technologies for flood protection of the built environment · technologies for flood protection of...
TRANSCRIPT

Technologies for the Cost-effective Flood Protection of the Built Environment
Technologies for Flood
Protection of the Built
Environment
Guidance based on findings from the EU-funded
project FloodProBE

FloodProBE Project ReportGrant Agreement No: 243401
FloodProBE Guidance ii
Document Information
Title Guidance based on findings from the EU-funded project FloodProBE
Lead Authors Manuela Escarameia, Karin Stone
Contributors Meindert Van, Chris Zevenbergen, Mark Morris
Distribution Public
Report Number WP05-01-13-03
Document History
Date Version Prepared by Organisation Approved by Notes 22/10/2013
5_0_P02
M Escarameia
HR Wallingford
Meindert Van
Final
Acknowledgement
The research leading to these results has received funding from the European Union's Seventh
Framework Programme (FP7/2007-2013) under Grant Agreement N° 243401.
Disclaimer
This document reflects only the authors’ views and not those of the European Community. This
work may rely on data from sources external to the members of the FloodProBE project
Consortium. Members of the Consortium do not accept liability for loss or damage suffered by any
third party as a result of errors or inaccuracies in such data. The information in this document is
provided “as is” and no guarantee or warranty is given that the information is fit for any particular
purpose. The user thereof uses the information at its sole risk and neither the European
Community nor any member of the FloodProBE Consortium is liable for any use that may be made
of the information.
© Members of the FloodProBE Consortium
FloodProBE Project ReportGrant Agreement No: 243401
FloodProBE Guidance iii
Contents
Document Information ..................................................................................................................... ii
Document History ........................................................................................................................... ii
Acknowledgement ........................................................................................................................... ii
Disclaimer ....................................................................................................................................... ii
Tables ............................................................................................................................................ iv
Figures ............................................................................................................................................ v
Chapter 1 Introduction ................................................................................................................... 1
1.1 Floods create a large risk to people and assets ............................................................. 3
1.2 The majority of people and assets are located in urban areas ....................................... 3
1.3 There is a need for knowledge to manage these flood risks .......................................... 4
1.4 FloodProBE focuses on developing knowledge on urban flood defences and critical
infrastructure ................................................................................................................. 4
1.5 Critical infrastructure and secondary impacts: terra incognita ........................................ 5
1.6 An extensive ‘toolbox’ to support flood risk management .............................................. 6
1.7 This guidance provides information and signposting to technologies arising from the
FloodProBE project ....................................................................................................... 6
Chapter 2 The Design Process in Urban Flood Management ........................................................ 9
2.1 Introduction ................................................................................................................. 11
2.2 System analysis .......................................................................................................... 13
2.3 Design & engineering; working towards a flood risk management plan ....................... 14
2.4 Monitoring and adaptation; maintaining the flood risk levels ........................................ 15
Chapter 3 System Analysis – Flood Defence Reliability ............................................................... 17
3.1 Introduction ................................................................................................................. 19
3.2 Levee segment assessment ........................................................................................ 21
3.2.1 Internal erosion processes ................................................................................ 22
3.2.2 Structure transitions .......................................................................................... 28
3.2.3 The performance of vegetation (grass) on flood embankments ......................... 32
3.3 Levee system assessment .......................................................................................... 35
3.3.1 Geophysical methods for rapid levee condition assessment ............................. 36
3.3.2 Remote sensing for rapid levee condition assessment ...................................... 41
3.3.3 Methods for analysing performance of the levee ............................................... 47
3.3.4 Combining data techniques ............................................................................... 48
FloodProBE Project ReportGrant Agreement No: 243401
FloodProBE Guidance iv
3.3.5 Analysing and designing the GIS-based data system for levee assessment ..... 50
Chapter 4 System Analysis – Vulnerability of Critical Infrastructure ............................................. 53
4.1 Introduction ................................................................................................................. 55
4.2 Step-wise approach for networks and tools ................................................................. 57
4.2.1 The Risk Assessment tool for global understanding .......................................... 58
4.2.2 Advanced Analysis tool – defining the interdependencies of infrastructure
networks ........................................................................................................... 60
4.3 The storyline method ................................................................................................... 62
4.4 Assessment methodology and tool to identify likely level of damage to critical buildings
.................................................................................................................................... 65
4.5 The ‘Quick Scan’ method ............................................................................................ 68
Chapter 5 Design and Engineering .............................................................................................. 71
5.1 Introduction ................................................................................................................. 73
5.2 Flood defences ............................................................................................................ 73
5.2.1 Strengthening of earth flood defences .............................................................. 73
5.2.2 Multifunctional Flood Defences ......................................................................... 75
5.3 Critical networks - Innovative road and bridge technologies ........................................ 81
5.3.1 Innovative technologies .................................................................................... 81
5.3.2 Catalogue of floating and composite technology ............................................... 84
5.4 Critical buildings .......................................................................................................... 86
5.4.1 Hotspot buildings .............................................................................................. 86
5.4.2 Smart shelters ................................................................................................. 102
Chapter 6 Further information .................................................................................................... 117
6.1 Further information .................................................................................................... 119
6.2 References ................................................................................................................ 122
Tables
Table 3.1 Basic mechanisms of internal erosion in dams and levees ...................................... 24
Table 3.2 Main scenarios of embankment failure by internal erosion ....................................... 26
Table 3.3 Matrix of models of internal erosion and parameters to be determined .................... 27
Table 3.4 An overview of the performance of geophysical methods in levee assessments ...... 38
Table 3.5 Geophysical method applicability with respect to stakeholder requirements ............ 39
Table 3.6 Remote sensing techniques for levees .................................................................... 42
Table 3.7 Overview of the examples of data combining techniques ......................................... 50

FloodProBE Project ReportGrant Agreement No: 243401
FloodProBE Guidance v
Table 5.1 Requirements of critical buildings ............................................................................ 86
Table 5.2 Flood resilience characteristics of finish materials .................................................... 87
Table 5.3 Flood resilience characteristics of insulation materials ............................................. 88
Table 5.4 Design considerations for flood proofing concepts ................................................... 93
Table 5.5 Applicability of flood proofing concepts according to flood level and flood duration ................................................................................................................... 93
Table 5.6 Overview of flood proofing concepts for hotspots ..................................................... 94
Table 5.7 Legend for Table 5.6 (Limitations)............................................................................ 95
Table 5.8 Hotspots by importance ........................................................................................... 96
Table 5.9 Usable floor space (in m2) for shelters ................................................................... 105
Table 5.10 Conditional probability and evacuation percentage per evacuation scenario .......... 110
Table 5.11 Number of casualties per dike section ................................................................... 111
Table 5.12 Conditional probability and evacuation percentage per evacuation scenario .......... 113
Table 5.13 Overview cost items and cost ................................................................................ 115
Table 6.1 Sources of information ........................................................................................... 120
Figures
Figure 1.1 Natural hazards in Europe (1998-2008) ..................................................................... 3
Figure 1.2 Flood marks, Prague, Czech Republic ....................................................................... 5
Figure 1.3 Overview of technologies developed within the FloodProBE project .......................... 7
Figure 2.1 The design process as a continuous process .......................................................... 12
Figure 2.2 The Source-Pathway-Receptor model ..................................................................... 13
Figure 2.3 The different scales of the urban flooding system .................................................... 14
Figure 2.4 The re-setting of objectives as a consequence of monitoring and adaptation ........... 16
Figure 3.1 Flow chart on the decision making process related to flood defences, based on the assessment (or diagnosis) of flood defences ..................................................... 20
Figure 3.2 General framework for assessment of levees .......................................................... 21
Figure 3.3 Failure due to backwards erosion; piping test at Ijkdijk, The Netherlands................. 23
Figure 3.4 Flow chart to identify types of transition and potential associated problems ............. 30
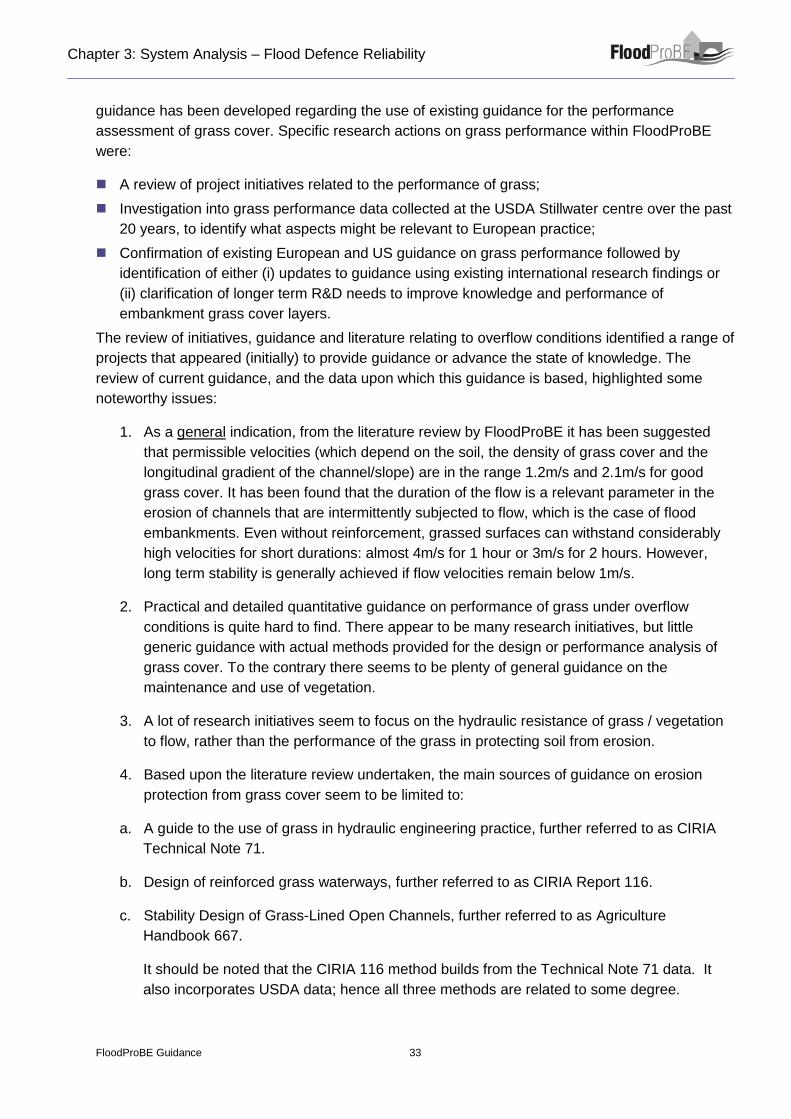
Figure 3.5 Some examples of levee grass protection testing using a wave overtopping simulator .................................................................................................................. 34
Figure 3.6 Geophysical principle for ground investigation ......................................................... 36
Figure 3.7 General scheme of a geophysical investigation process .......................................... 37
Figure 3.8 Examples of geophysical methods ........................................................................... 37
Figure 3.9 Place of geophysics in general assessment ............................................................. 40
Figure 3.10 Principle of a weak-spot detection by a repeated survey .......................................... 41
FloodProBE Project ReportGrant Agreement No: 243401
FloodProBE Guidance vi
Figure 3.11 Lidar acquisition (left) and multiple return (right) principle ........................................ 43
Figure 3.12 Lidar data and failure modes detection .................................................................... 44
Figure 3.13 Left to right, SDM and no-vegetation SDM from the same area ............................... 45
Figure 3.14 SDM (Left) Result from SDM/No-construction SDM raster subtraction ..................... 46
Figure 3.15 SDM with colour shadowing ..................................................................................... 46
Figure 3.16 Example of SDM/No-Vegetation SDM subtraction to display vegetation .................. 46
Figure 4.1 Schematic representation of cascading effects of flood damage to infrastructure .... 55
Figure 4.2 General framework underlying the Quick Scan ........................................................ 56
Figure 4.3 Framework for risk assessment ............................................................................... 57
Figure 4.4 Sample of risk matrix ............................................................................................... 58
Figure 4.5 Output of the program .............................................................................................. 59
Figure 4.6 Failure scenario example ......................................................................................... 60
Figure 4.7 Approach for studying network disruptions caused by floods accounting for interdependencies between networks ...................................................................... 61
Figure 4.8 Example of application of the tool for three types of network ................................... 61
Figure 4.9 View of the GIS tool (French version) ...................................................................... 62
Figure 4.10 Storyline method applied to the island of Dordrecht, The Netherlands ..................... 64
Figure 4.11 Building damage estimation tool principles .............................................................. 66
Figure 4.12 Basic steps of the Quick Scan method ..................................................................... 69
Figure 5.1 Sand grains treated with BioGrout ........................................................................... 74
Figure 5.2 Cementing gravel for the horizontal drilling pilot near Nijmegen, 2010 ..................... 75
Figure 5.3 Choosing and developing a design for a multifunctional flood defence .................... 76
Figure 5.4 Features of six concepts of multifunctional flood defences ....................................... 77
Figure 5.5 Example of catalogue of MFD options ..................................................................... 80
Figure 5.6 Pedestrian floating bridge by Eco-Dock Inc .............................................................. 82
Figure 5.7 Lightweight bridge placements ................................................................................. 83
Figure 5.8 Examples of floating storage facilities ...................................................................... 84
Figure 5.9 Examples of floating emergency bases .................................................................... 84
Figure 5.10 Proposed catalogue, different uses of floating and light weight technology according to the situation ......................................................................................... 85
Figure 5.11 Schematic of wet proof method ................................................................................ 88
Figure 5.12 Example of dry proofing Hamburg, Germany ........................................................... 89
Figure 5.13 Office building on stilts ............................................................................................. 90
Figure 5.14 Synagogue on mound, Sliedrecht, The Netherlands ................................................ 90
Figure 5.15 Floating pavilion, Rotterdam, The Netherlands ........................................................ 91
Figure 5.16 Amphibious dwelling in Maasbommel, The Netherlands .......................................... 91
Figure 5.17 Temporary barriers in Prague, Czech Republic........................................................ 92
FloodProBE Project ReportGrant Agreement No: 243401
FloodProBE Guidance vii
Figure 5.18 Permanent flood gate Meppel, The Netherlands ...................................................... 92
Figure 5.19 Flood proofing hotspot relevance map ..................................................................... 97
Figure 5.20 Overview of questions used as input for the hotspot selection tool........................... 98
Figure 5.21 Area requirements of different flood proofing methods and heights.......................... 99
Figure 5.22 Installation time of different flood proofing methods and heights ............................ 100
Figure 5.23 Scatter plot of container/gabion data (cost against height in metres) ..................... 101
Figure 5.24 Cost estimate data (in €/m) and height ranges for barrier-type flood proofing methods ................................................................................................................. 101
Figure 5.25 One large smart shelter covering a large area ....................................................... 103
Figure 5.26 Multiple smaller smart shelters covering several smaller areas .............................. 103
Figure 5.27 Rivers and canals surrounding the Island of Dordrecht, The Netherlands .............. 107
Figure 5.28 Main land use on the Island of Dordrecht ............................................................... 108
Figure 5.29 Maximum water depths for all breaches ................................................................. 109
Figure 5.30 Maximum water velocities for all breaches ............................................................. 109
Figure 5.31 Local individual risk (including evacuation)-LIR-for the Island of Dordrecht, The Netherlands ........................................................................................................... 111
Figure 5.32 Local individual risk (including evacuation)-LIR-for the Island of Dordrecht for area specific evacuation strategy ........................................................................... 114

FloodProBE Project ReportGrant Agreement No: 243401
FloodProBE Guidance viii

Chapter 1 Introduction

Chapter 1: Introduction
FloodProBE Guidance 2
Chapter 1: Introduction
FloodProBE Guidance 3
1.1 Floods create a large risk to people and assets
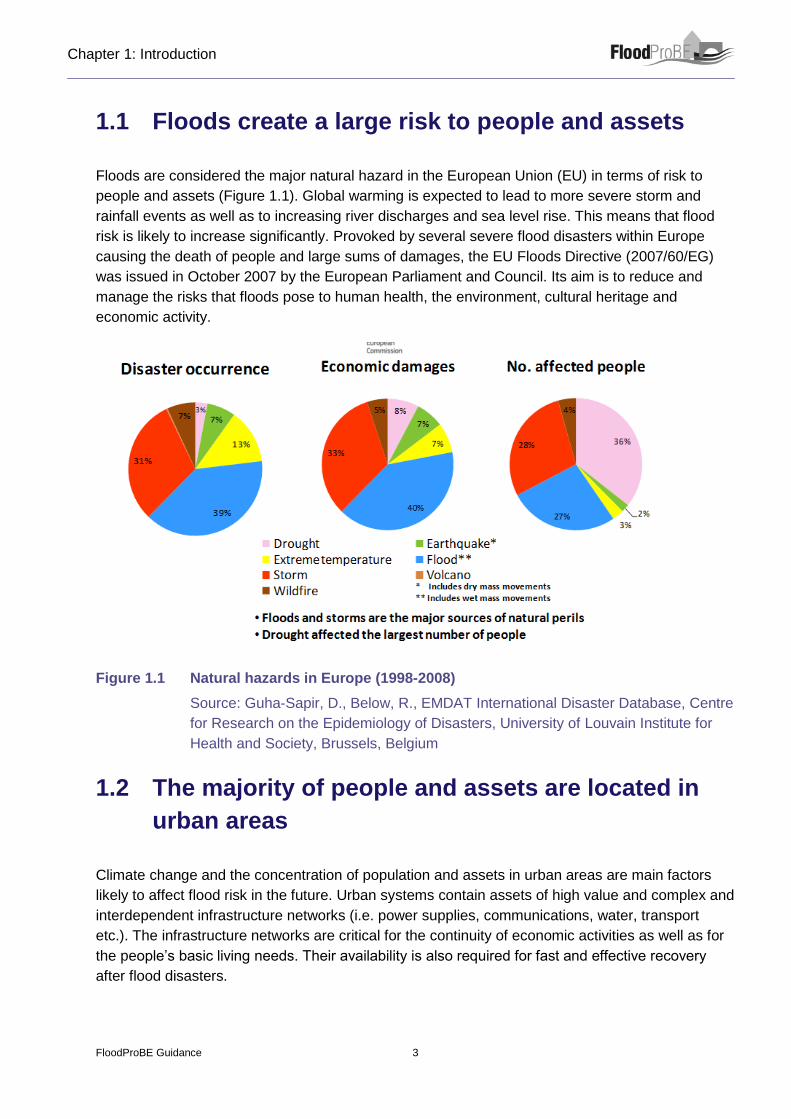
Floods are considered the major natural hazard in the European Union (EU) in terms of risk to
people and assets (Figure 1.1). Global warming is expected to lead to more severe storm and
rainfall events as well as to increasing river discharges and sea level rise. This means that flood
risk is likely to increase significantly. Provoked by several severe flood disasters within Europe
causing the death of people and large sums of damages, the EU Floods Directive (2007/60/EG)
was issued in October 2007 by the European Parliament and Council. Its aim is to reduce and
manage the risks that floods pose to human health, the environment, cultural heritage and
economic activity.
Figure 1.1 Natural hazards in Europe (1998-2008)
Source: Guha-Sapir, D., Below, R., EMDAT International Disaster Database, Centre
for Research on the Epidemiology of Disasters, University of Louvain Institute for
Health and Society, Brussels, Belgium
1.2 The majority of people and assets are located in
urban areas
Climate change and the concentration of population and assets in urban areas are main factors
likely to affect flood risk in the future. Urban systems contain assets of high value and complex and
interdependent infrastructure networks (i.e. power supplies, communications, water, transport
etc.). The infrastructure networks are critical for the continuity of economic activities as well as for
the people’s basic living needs. Their availability is also required for fast and effective recovery
after flood disasters.
Chapter 1: Introduction
FloodProBE Guidance 4
1.3 There is a need for knowledge to manage these
flood risks
Flood Risk Management (FRM) is defined in the FLOODsite EU Project (www.floodsite.net) as the
‘continuous and holistic societal analysis, assessment and mitigation of flood risk’. In line with this
definition, flood risk management can be roughly divided into two parts: flood risk analysis on the
one hand and risk mitigation on the other.
Various knowledge gaps were identified through the FLOODsite project which stand in the way of
an improved flood risk management. These knowledge gaps are in the field of a Better
understanding of risk as well as a Better understanding of interventions.
Many flood research projects funded by the EU Framework Programs in the last two decades
(such as FLOODsite) have developed tools, models and best practices which are most relevant for
the implementation of the Floods Directive. However, our current understanding in this emerging
domain of flood risk management still lacks a fundamental comprehension of the complexity of
socio-economic systems such as societal vulnerability towards flood disasters, and the
governance needed to integrate the efforts of organisations at all levels needed to effectively
implement these integrated approaches. It is becoming increasingly clear that flood risk
management is only one of the many challenges of our society to deal with and that there are
opportunities to incorporate flood risk management into other policy domains such urban planning
leading to significant societal and economic benefits. In addition to this, innovative interventions to
minimise flood impacts are required. FloodProBE “Technologies for the cost effective Flood
Protection of the Built Environment” is acknowledging and addressing these research gaps that
could help turn flood risk into opportunities.
1.4 FloodProBE focuses on developing knowledge on
urban flood defences and critical infrastructure
The principal aim of FloodProBE is to provide cost-effective means for flood risk reduction in urban
areas. FloodProBE focussed on:
improvement of knowledge on identification and upgrading of weak links in flood defence
systems and
flood-induced failure of particular critical infrastructure, assessment of damages caused by
these failures and development of new interventions.
This focus provided methodologies and interventions which allow decision makers to focus their
investments and efforts on addressing risk areas in flood defences and urban critical infrastructure.
Within the context of this guidance, critical infrastructure is defined as the urban assets which are
essential for the functioning of society and encompass utility networks, transport networks and
(tele) communication networks as well as the buildings which house elements of the infrastructure
Chapter 1: Introduction
FloodProBE Guidance 5
(“hotspot buildings” or “critical infrastructure buildings”). Examples of these are electricity and
pumping stations as well as hospitals, fire brigade buildings, communication hubs and shelters.
1.5 Critical infrastructure and secondary impacts:
terra incognita
Damage to critical infrastructure assets during flooding can result in significant secondary
consequences which, on many occasions such as during the 2007 floods in England and the 2011
floods in Queensland, may be more serious than the direct damage caused by the flood. More
recently, the destruction power and widespread disruption to infrastructure caused by Sandy on
the east coast of North America and the Caribbean has ranked this hurricane one of the costliest
storm events for insurers. The large electric and utility losses that left millions without power will
probably cause more insured losses than were foreseen from a typical Category 1 event. Much
damage could have been avoided if New York’s most vulnerable critical infrastructure assets were
protected ahead of time. This event has prompted to reconsider the impacts of flooding on the
functioning of essential services and the management practices used to alleviate these risks.
Damage to one type of infrastructure can cascade to disruption to other infrastructure, e.g. loss of
power supply can impact on the health service of an urban community. Flood vulnerability
therefore largely depends on the degree in which both hotspot buildings and infrastructure
networks are affected by flooding and as a consequence are generating damage either directly or
indirectly or both. Retrofitting techniques to protect flood prone residential buildings are widely
applied and well documented. There is however limited experience with retrofitting techniques to
reduce the impact of flooding to critical infrastructure assets and guidance and best practices to
flood proofing these assets are lacking.
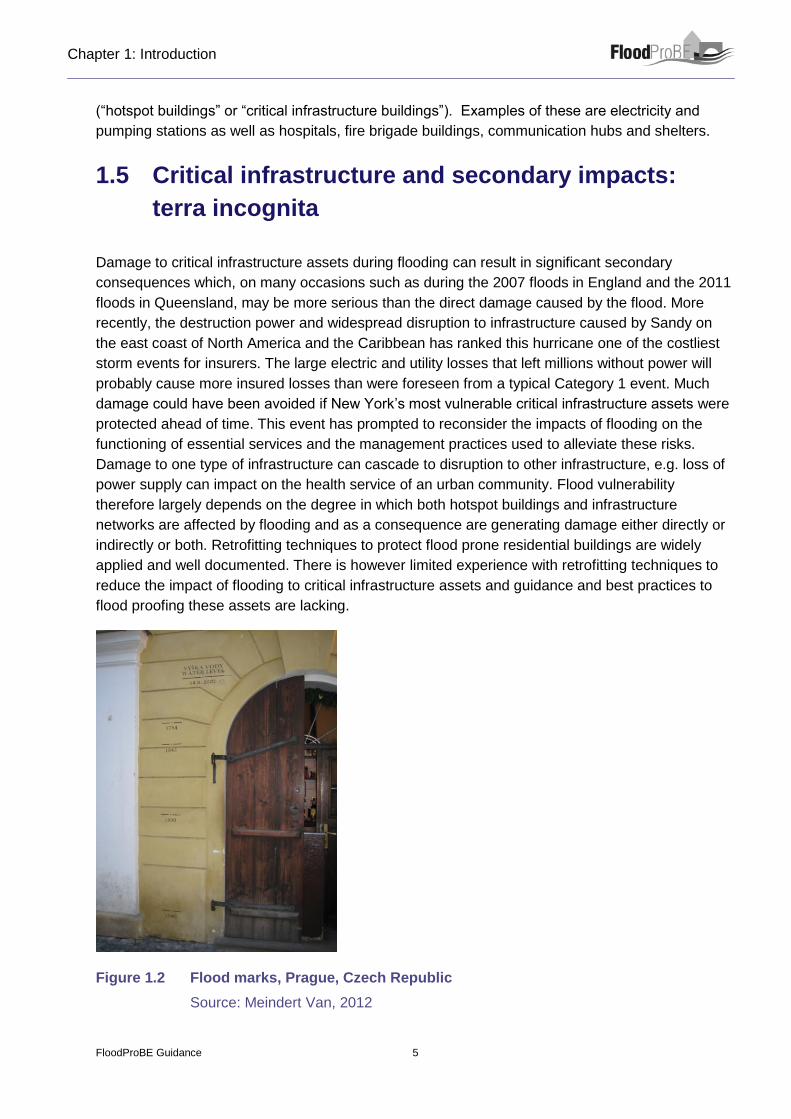
Figure 1.2 Flood marks, Prague, Czech Republic
Source: Meindert Van, 2012

Chapter 1: Introduction
FloodProBE Guidance 6
1.6 An extensive ‘toolbox’ to support flood risk
management
To this end, FloodProBE developed technologies, methods, concepts and tools for assessment
purposes and for the adaptation of new and existing buildings and infrastructure networks, as well
as for flood defences. The products of FloodProBE therefore aid in flood risk management and
support the implementation of the EU Flood Directive. This is illustrated in Figure 1.3.
1.7 This guidance provides information and
signposting to technologies arising from the
FloodProBE project
This FloodProBE overall guidance provides end users with an overview and a first insight into the
products, methods and knowledge developed within the context of the FloodProBE project. It aims
at public authorities responsible for flood protection and water management as well as other asset
managers and practitioners.
Through Chapter 2 further insight is given into the design process in urban flood management.
Chapters 3 and 4 give a summary of the developed FloodProBE technologies, methods, concepts
and tools aimed at improving flood risk analysis, where Chapter 3 focuses on flood defences and
Chapter 4 on critical infrastructure. Chapter 5 gives an overview of the interventions developed
within the FloodProBE context. Chapter 6 provides a summary of sources of complementary
information.

Chapter 1: Introduction
FloodProBE Guidance 7
Figure 1.3 Overview of technologies developed within the FloodProBE project
The technologies developed within FloodProBE are listed on the right in relation to
the Flood Risk Management process; the dark grey boxes indicate the Flood Risk
Management areas to which FloodProBE contributed

Chapter 1: Introduction
FloodProBE Guidance 8

Chapter 2 The Design
Process in Urban Flood
Management

Chapter 2: The Design Process in Urban Flood Management
FloodProBE Guidance 10

Chapter 2: The Design Process in Urban Flood Management
FloodProBE Guidance 11
2.1 Introduction
The development and implementation of Flood Risk Management plans should enhance the
capacity of the flooding system to cope with an uncertain future and unforeseen events due to
social economic developments and climate change. Consequently, Flood Risk Management plans
are established through a continuous process of design, engineering, implementation, monitoring
and adaptation, a multi-step process which is often initiated or triggered by a policy need, e.g. the
Floods Directive or a situation where flooding is high on the political agenda due to a flood event.
The value of a flood resilient system is its capacity to cope with unforeseen events and longer term
drivers such as global environmental change.
The first phase within the design process is one of gathering insight and information through an
analysis of the present and future flood risks within an area (phase 1 – Systems analysis). If it is
concluded that there is a need to decrease the flood risk, the next phase (phase 2 – Design and
engineering) will involve the evaluation of interventions and planning, leading to a selection of
appropriate interventions and the development of a flood risk management plan. These plans
should then keep options ‘open’ by adopting flexible, multiple use interventions which may involve
development of adaptable engineering techniques in construction and refurbishment.
It follows from the above that the engineering design process does not end when a plan is put into
action. The flooding system is a dynamic and complex one which is affected by continuous
changing of natural and human induced processes such as climate change, urban growth and
economic development. When the interventions are in place, a phase of monitoring of the flood
risk and, where required, adjusting and adapting is entered into (phase 3 – Monitoring and
adaptation). If adaptation is required, the process could be started from phase 1 and so on. Figure
2.1 illustrates this general process.
Chapter 2: The Design Process in Urban Flood Management
FloodProBE Guidance 12
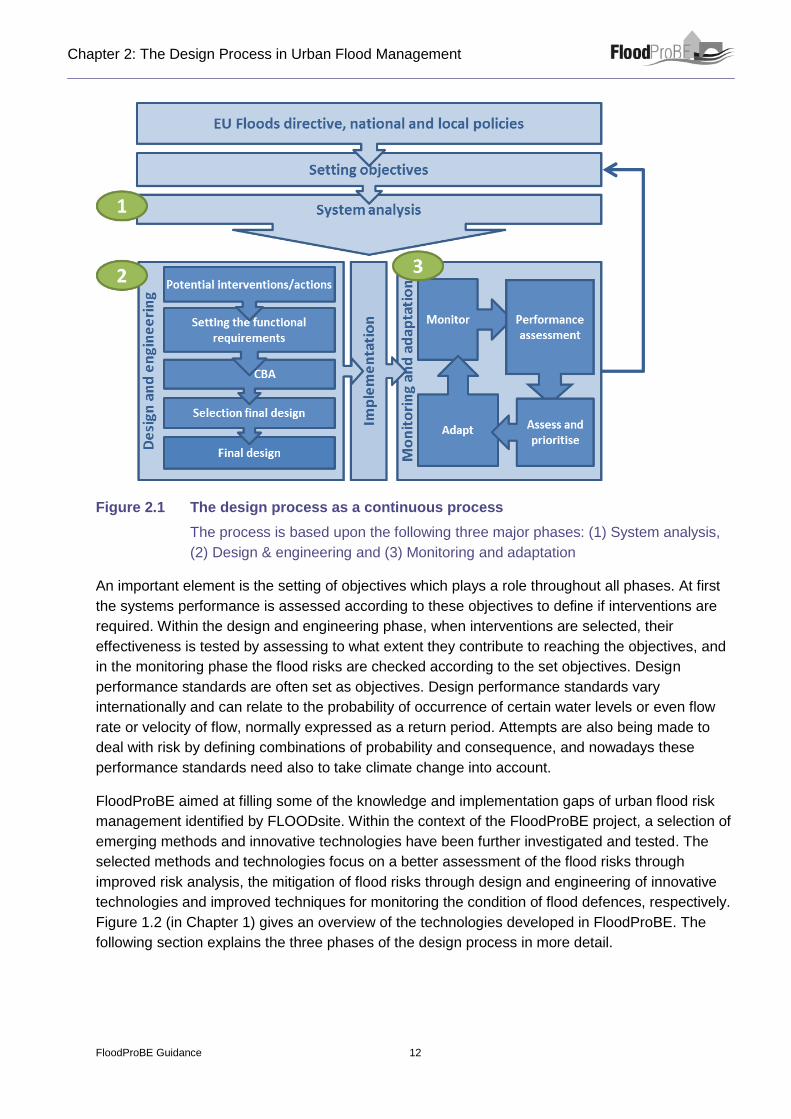
Figure 2.1 The design process as a continuous process
The process is based upon the following three major phases: (1) System analysis,
(2) Design & engineering and (3) Monitoring and adaptation
An important element is the setting of objectives which plays a role throughout all phases. At first
the systems performance is assessed according to these objectives to define if interventions are
required. Within the design and engineering phase, when interventions are selected, their
effectiveness is tested by assessing to what extent they contribute to reaching the objectives, and
in the monitoring phase the flood risks are checked according to the set objectives. Design
performance standards are often set as objectives. Design performance standards vary
internationally and can relate to the probability of occurrence of certain water levels or even flow
rate or velocity of flow, normally expressed as a return period. Attempts are also being made to
deal with risk by defining combinations of probability and consequence, and nowadays these
performance standards need also to take climate change into account.
FloodProBE aimed at filling some of the knowledge and implementation gaps of urban flood risk
management identified by FLOODsite. Within the context of the FloodProBE project, a selection of
emerging methods and innovative technologies have been further investigated and tested. The
selected methods and technologies focus on a better assessment of the flood risks through
improved risk analysis, the mitigation of flood risks through design and engineering of innovative
technologies and improved techniques for monitoring the condition of flood defences, respectively.
Figure 1.2 (in Chapter 1) gives an overview of the technologies developed in FloodProBE. The
following section explains the three phases of the design process in more detail.

Chapter 2: The Design Process in Urban Flood Management
FloodProBE Guidance 13
2.2 System analysis
In order to be able to manage the (flooding) system, an understanding of its functioning is a
prerequisite. A system analysis is often performed to further unravel its complexity. To analyse the
urban flood system, the physical system is best described through the conceptual source-pathway-
receptor model. The source describes the hazard source such as a river, a sea or direct rainfall;
the pathway is about the route the water flows when a flood occurs and the receptors are the
elements which are susceptible to flood water such as people, buildings and infrastructure, which
could be injured or damaged (see Figure 2.2).
Figure 2.2 The Source-Pathway-Receptor model
The first key point for avoiding serious damage and the high cost of a failure and its consequences
lies in the knowledge of the safety level and reliability of the flood defence system. Since flood
defence systems are only as strong as the weakest links, the weak spots need to be identified,
assessed and strengthened. In the urban context, many embedded constructions are encountered
within the levees. These levees are often old elements and little is known about the material within
the levee. A flood defence assessment is a process that has the objective of identifying these
weak spots and evaluating the performance of a levee system.
The flooding system is a dynamic and complex system, which is affected by continuous changing
natural and human induced processes. The urban flooding system is composed of interaction
between subsystems such as nodes and networks and the urban system itself is part of a bigger
(supra-) system. There is still limited understanding of the complex linkages between subsystems
and services and the cascading effects of one subsystem upon another, such as for example
between water supply, energy production and transportation. This limitation may partly explain the
Chapter 2: The Design Process in Urban Flood Management
FloodProBE Guidance 14
present lack of guidance on how to ensure the adoption of consistent approaches and on
quantification of the benefits which arise from increasing the flood resilience of the critical
infrastructure.
2.3 Design & engineering; working towards a flood
risk management plan
The design and engineering phase works towards a flood risk management plan. It is an
interactive process which requires the involvement of different stakeholders and encompasses
design and engineering of interventions and spatial planning. This phase can be split into five
steps:
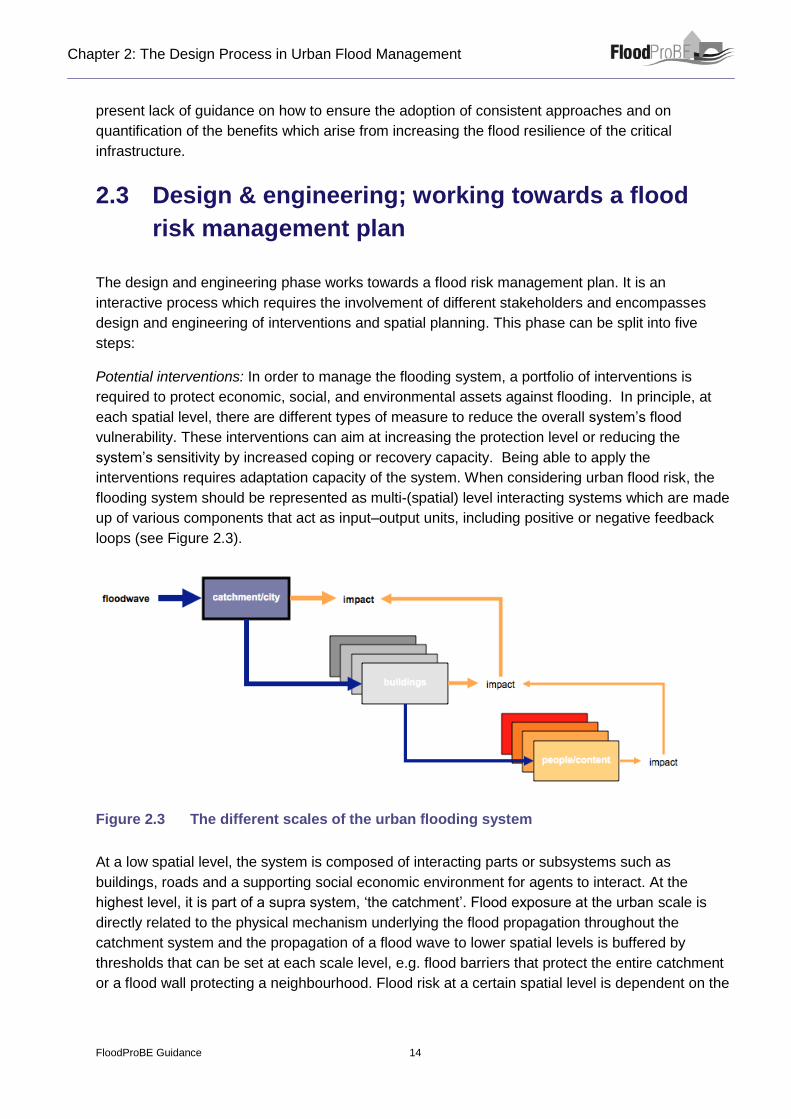
Potential interventions: In order to manage the flooding system, a portfolio of interventions is
required to protect economic, social, and environmental assets against flooding. In principle, at
each spatial level, there are different types of measure to reduce the overall system’s flood
vulnerability. These interventions can aim at increasing the protection level or reducing the
system’s sensitivity by increased coping or recovery capacity. Being able to apply the
interventions requires adaptation capacity of the system. When considering urban flood risk, the
flooding system should be represented as multi-(spatial) level interacting systems which are made
up of various components that act as input–output units, including positive or negative feedback
loops (see Figure 2.3).
Figure 2.3 The different scales of the urban flooding system
At a low spatial level, the system is composed of interacting parts or subsystems such as
buildings, roads and a supporting social economic environment for agents to interact. At the
highest level, it is part of a supra system, ‘the catchment’. Flood exposure at the urban scale is
directly related to the physical mechanism underlying the flood propagation throughout the
catchment system and the propagation of a flood wave to lower spatial levels is buffered by
thresholds that can be set at each scale level, e.g. flood barriers that protect the entire catchment
or a flood wall protecting a neighbourhood. Flood risk at a certain spatial level is dependent on the

Chapter 2: The Design Process in Urban Flood Management
FloodProBE Guidance 15
interventions implemented at a higher level. In other words, managing flood risks involves a
feedback process initiated from a top-down perspective.
Functional requirement: It is increasingly recognised that responses need to be based on
adaptable approaches leading to greater resilience for the system as a whole and should, where
feasible, be incremental, reversible and ‘no-regret’. This requires a new way of looking at
responses, especially those that entail ‘hard’ engineering and are seldom reversible. In future
these need to be able to accommodate changes (adaptations) in response to new knowledge,
demands and expectations, and in the assessment of performance, with attendant flexibility in
standards and codes of practice.
Cost benefit analysis (CBA): Responses need to provide the appropriate level of performance.
Decision-making following a risk based analysis is based on either implicit design standards or on
explicit cost benefit and multi-criteria considerations. CBA involves the comparison of the
construction, operation and maintenance costs with benefits such as victims and damage
prevented over the life of the project.
Selection of final design and flood risk management plan: Implementing technologies should be
timed to coincide with autonomous planning cycles wherever possible (e.g. scheduled refurbishing
or new developments) to minimise costs. Wherever feasible, win–win (i.e. benefits across multiple
sectors) or no-regret approaches should be sought, although there will frequently be tensions and
competing objectives. Development of integrated portfolios requires coordinating the activities of
more than one organisation and multiple stakeholders. Whilst ageing infrastructure and building
stock in the developed world pose a risk due to increasing vulnerability, this also provides an
opportunity to introduce new technologies in the redevelopment process and to adapt
infrastructure and buildings to enhance flood resilience. Urban restoration, regeneration and
modernisation can be a key driver of economic development; both as a result of the initial
investment required and the benefits that it will accrue over time (e.g. formerly flood-prone areas
may become available for productive use).
2.4 Monitoring and adaptation; maintaining the flood
risk levels
Once a flood risk management plan is implemented and interventions are in place, the phase of
monitoring and adaptation is entered which focuses on maintaining the flood risk levels. This is
done by monitoring the development of the flood risk and, where required, adapting to changing
circumstances. Monitoring and adaptation of the performance of the implemented technologies will
be critically important for judging their effectiveness and making decisions on which efforts are
needed to adjust to changing conditions. In the context of climate adaptation, continuous
monitoring and adaptation activities also need to recognise the longer time horizon of potential
climate change impacts.
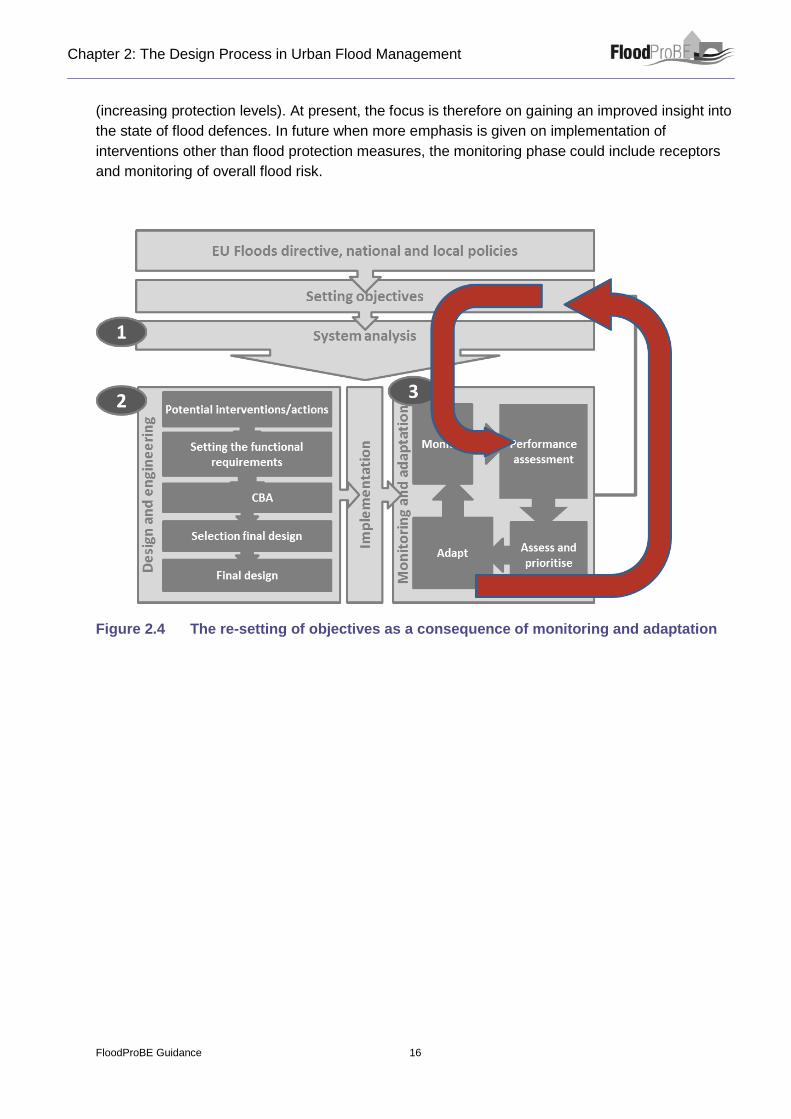
Monitoring can lead to the re-setting of objectives, as illustrated in Figure 2.4. In traditional flood-
risk management policies, flood risk is generally managed through structural interventions such as
strengthening of flood defences, and restricted to measures adopted at the catchment level only
Chapter 2: The Design Process in Urban Flood Management
FloodProBE Guidance 16
(increasing protection levels). At present, the focus is therefore on gaining an improved insight into
the state of flood defences. In future when more emphasis is given on implementation of
interventions other than flood protection measures, the monitoring phase could include receptors
and monitoring of overall flood risk.
Figure 2.4 The re-setting of objectives as a consequence of monitoring and adaptation
Chapter 3 System Analysis
– Flood Defence Reliability

Chapter 3: System Analysis – Flood Defence Reliability
FloodProBE Guidance 18
Chapter 3: System Analysis – Flood Defence Reliability
FloodProBE Guidance 19
3.1 Introduction
Most of the levees are old structures built several centuries ago, then rebuilt or repaired (after a
breach), modified, heightened several times, with some materials that do not necessarily match
the original conception of the structure. The levee foundations are naturally heterogeneous and in
general were not properly treated to improve their water-tightness or strength properties. Other
factors such as roots or animals introduce weaknesses in a levee.
In the urban context, the levees present many additional singularities, such as embedded
networks, pipes, human constructions like houses, gardens and walls. Urban flood defences
comprise both soft soil embankments and hard structures. Failures are often caused by internal
and/or external erosion processes, particularly at transitions between materials or between
defence types. Complex combinations of defence types are typical in urban areas.
A flood defence assessment, as part of the system analysis or monitoring phase, has the objective
to evaluate the performance of a levee system and should include a diagnosis of the actual or
possible causes of failure. In current practice, a levee assessment almost always involves
determination of the so-called reliability of a levee for all main types of failure mechanism.
Conventional site investigation techniques for assessing geotechnical properties do assess soil
properties at specific locations quite accurately; however due to natural and man-made
heterogeneity, determining the soil properties over long lengths of embankment is more difficult. In
between measured subsurface points, properties have to be interpreted or interpolated,
introducing large uncertainties. Considering the stretch of hundreds of kilometres and the
heterogeneity of the levees, both good assessment methods, based on sturdy fundamental
knowledge of the failure mechanisms and the strength of the levee components, and rapid, cost-
effective and reliable techniques for data acquisition and surveying the defence system over long
lengths are necessary. Figure 3.1 illustrates the decision process based on the assessment of
flood defences.

Chapter 3: System Analysis – Flood Defence Reliability
FloodProBE Guidance 20
Figure 3.1 Flow chart on the decision making process related to flood defences, based on the assessment (or diagnosis) of flood defences
Chapter 3: System Analysis – Flood Defence Reliability
FloodProBE Guidance 21
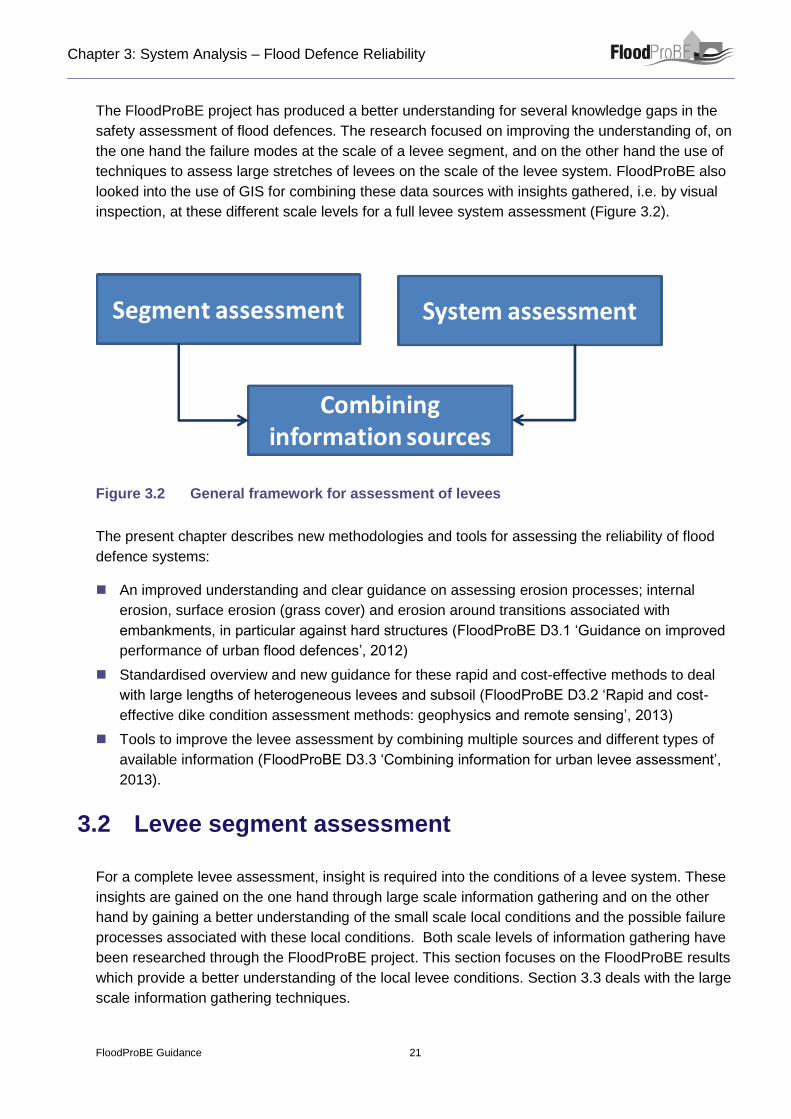
The FloodProBE project has produced a better understanding for several knowledge gaps in the
safety assessment of flood defences. The research focused on improving the understanding of, on
the one hand the failure modes at the scale of a levee segment, and on the other hand the use of
techniques to assess large stretches of levees on the scale of the levee system. FloodProBE also
looked into the use of GIS for combining these data sources with insights gathered, i.e. by visual
inspection, at these different scale levels for a full levee system assessment (Figure 3.2).
Figure 3.2 General framework for assessment of levees
The present chapter describes new methodologies and tools for assessing the reliability of flood
defence systems:
An improved understanding and clear guidance on assessing erosion processes; internal
erosion, surface erosion (grass cover) and erosion around transitions associated with
embankments, in particular against hard structures (FloodProBE D3.1 ‘Guidance on improved
performance of urban flood defences’, 2012)
Standardised overview and new guidance for these rapid and cost-effective methods to deal
with large lengths of heterogeneous levees and subsoil (FloodProBE D3.2 ‘Rapid and cost-
effective dike condition assessment methods: geophysics and remote sensing’, 2013)
Tools to improve the levee assessment by combining multiple sources and different types of
available information (FloodProBE D3.3 ‘Combining information for urban levee assessment’,
2013).
3.2 Levee segment assessment
For a complete levee assessment, insight is required into the conditions of a levee system. These
insights are gained on the one hand through large scale information gathering and on the other
hand by gaining a better understanding of the small scale local conditions and the possible failure
processes associated with these local conditions. Both scale levels of information gathering have
been researched through the FloodProBE project. This section focuses on the FloodProBE results
which provide a better understanding of the local levee conditions. Section 3.3 deals with the large
scale information gathering techniques.

Chapter 3: System Analysis – Flood Defence Reliability
FloodProBE Guidance 22
Soil erosion is the cause of failure of the majority of levees and composite flood defence
structures, whether through internal erosion, wave overtopping, overflow or contact erosion. The
research focus has been placed on the three failure processes (or modes) that have proven to be
critical in recent major flood events: internal erosion, erosion around transitions and surface
erosion (grass cover). These erosion processes are the most dominant failure mechanisms in
safety assessments in urban areas but also require an improvement of knowledge to be able to
perform a proper performance assessment of urban flood defences.
3.2.1 Internal erosion processes
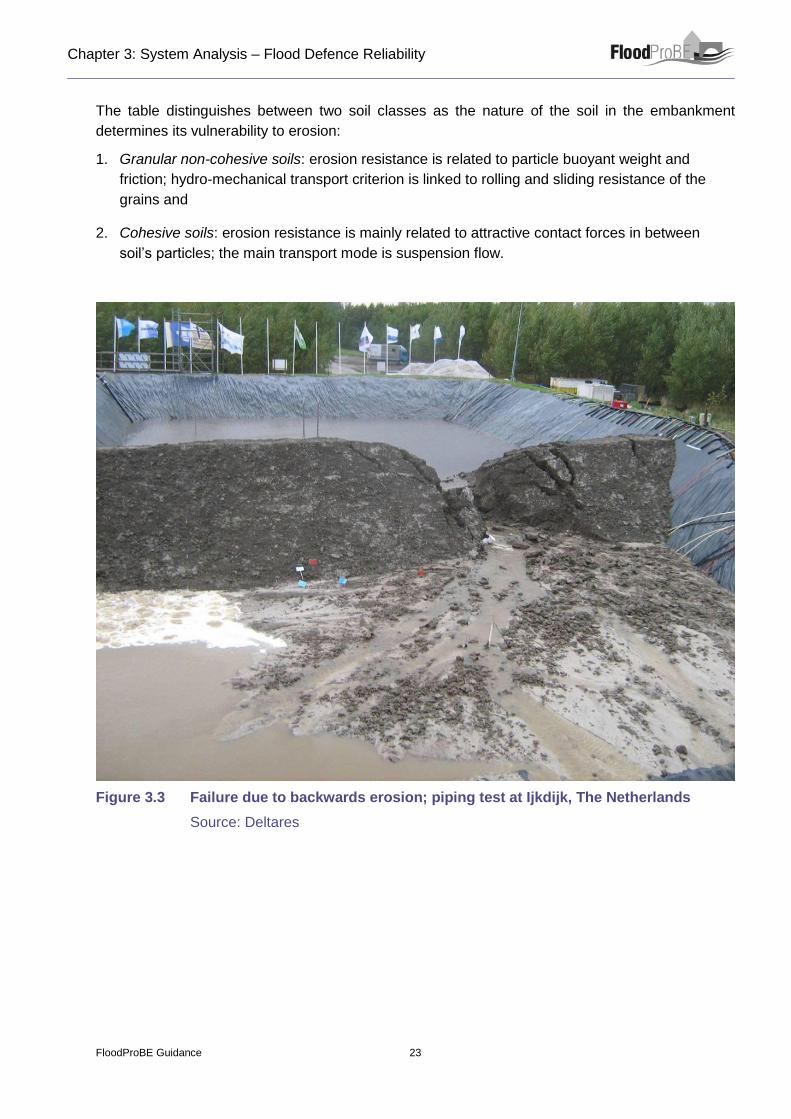
Internal erosion is the “downstream transport of soil particles within a levee or its foundation by
seepage flow”. Through an extensive literature review and analysis of test results on soil
erodibility, a better understanding was gained on the parameters which contribute to the internal
erosion processes (Figure 3.3). The knowledge on internal erosion has been bundled and
presented in a way easily understandable and act as guidance for the analysis of internal erosion
processes. This framework was developed for levee managers, engineers and technicians working
on the safety of hydraulic structures and (urban) flood defences, and includes the following:
1. A framework for a practical description of erosion assessment tools with link to identification parameters of soils and in-situ investigations. This framework consists of:
o A description of the different types of physical processes of erosion.
o A description of the different scenarios of failure by internal erosion through four successive phases leading (or not) to a breach, with a matrix representation.
o And a description of key soil parameters reflecting internal erosion susceptibility.
2. Information about testing facilities available in Europe and some other countries for
measuring erodibility parameters: parameters of erosion that can be measured, types of soils that can be tested.
3. Results of cross-tests on two pilot sites of the project (Orléans and Humber) and overview
of existing data bases for erodibility parameters.
A summary of the framework is provided in this section. Items 2 and 3 are elaborated further within
the technical reports.
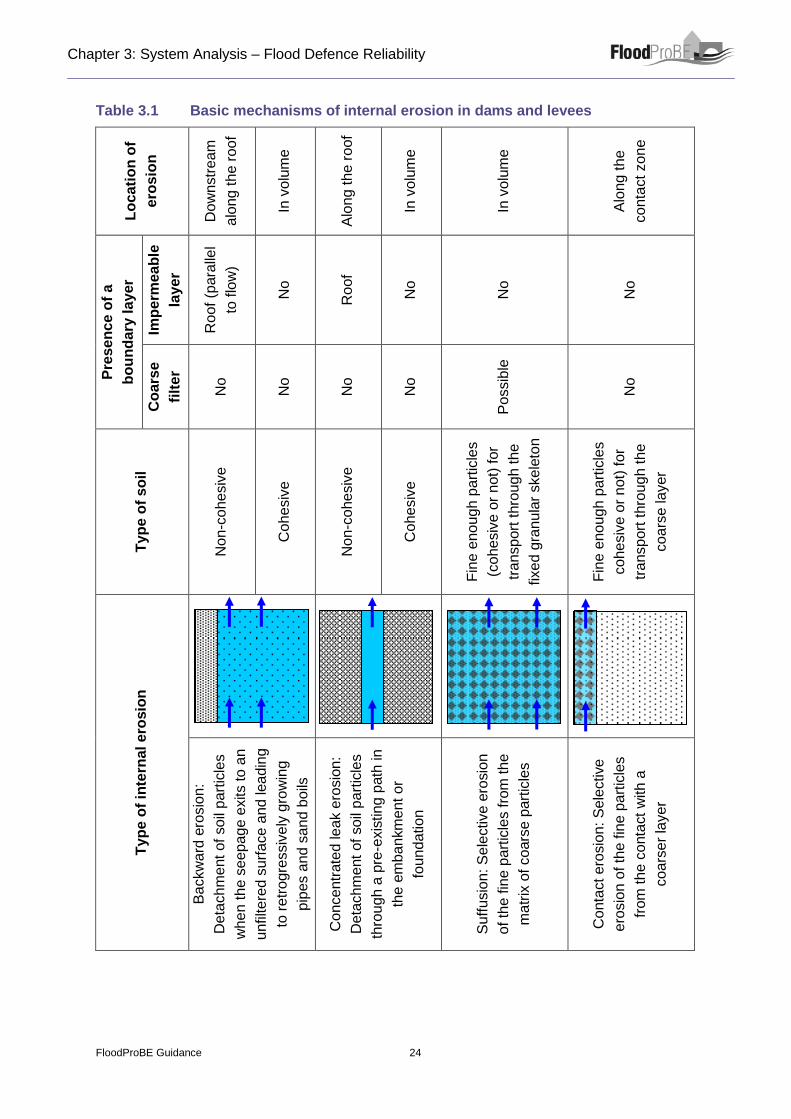
Framework on internal erosion
In Table 3.1 the internal erosion processes are defined and unified in a general overview. The FloodProBE project research focused on four internal erosion mechanisms, since these types of erosion (except suffusion) are known to be dominant for the urban areas in France, Great Britain and the Netherlands. The information in the table can be used to determine the potential types of internal erosion for a certain levee segment.
Chapter 3: System Analysis – Flood Defence Reliability
FloodProBE Guidance 23
The table distinguishes between two soil classes as the nature of the soil in the embankment
determines its vulnerability to erosion:
1. Granular non-cohesive soils: erosion resistance is related to particle buoyant weight and
friction; hydro-mechanical transport criterion is linked to rolling and sliding resistance of the
grains and
2. Cohesive soils: erosion resistance is mainly related to attractive contact forces in between
soil’s particles; the main transport mode is suspension flow.
Figure 3.3 Failure due to backwards erosion; piping test at Ijkdijk, The Netherlands
Source: Deltares
Chapter 3: System Analysis – Flood Defence Reliability
FloodProBE Guidance 24
Table 3.1 Basic mechanisms of internal erosion in dams and levees
Lo
cati
on
of
ero
sio
n
Do
wn
str
eam
alo
ng
th
e r
oof
In v
olu
me
Alo
ng
th
e r
oof
In v
olu
me
In v
olu
me
Alo
ng
th
e
co
nta
ct zo
ne
Pre
se
nc
e o
f a
bo
un
dary
la
yer
Imp
erm
ea
ble
laye
r
Ro
of
(para
llel
to flo
w)
No
Ro
of
No
No
No
Co
ars
e
filt
er
No
No
No
No
Po
ssib
le
No
Typ
e o
f s
oil
No
n-c
ohe
siv
e
Co
he
siv
e
No
n-c
ohe
siv
e
Co
he
siv
e
Fin
e e
no
ug
h p
art
icle
s
(co
he
siv
e o
r n
ot)
for
tra
nsp
ort
thro
ug
h th
e
fixe
d g
ran
ula
r ske
leto
n
Fin
e e
no
ug
h p
art
icle
s
co
he
siv
e o
r n
ot)
fo
r
tra
nsp
ort
thro
ug
h th
e
co
ars
e layer
Typ
e o
f in
tern
al e
rosio
n
Ba
ckw
ard
ero
sio
n:
De
tach
me
nt
of
so
il p
art
icle
s
wh
en
th
e s
eep
ag
e e
xits to
an
unfilte
red
su
rfa
ce a
nd lea
din
g
to r
etr
ogre
ssiv
ely
gro
win
g
pip
es a
nd
sa
nd b
oils
Co
nce
ntr
ate
d le
ak e
rosio
n:
De
tach
me
nt
of
so
il p
art
icle
s
thro
ug
h a
pre
-exis
tin
g p
ath
in
the e
mb
an
km
ent o
r
foun
da
tion
Su
ffu
sio
n:
Se
lective e
rosio
n
of th
e fin
e p
art
icle
s fro
m th
e
ma
trix
of
co
ars
e p
art
icle
s
Co
nta
ct e
rosio
n:
Se
lective
ero
sio
n o
f th
e fin
e p
art
icle
s
from
th
e c
onta
ct
with a
co
ars
er
layer
Chapter 3: System Analysis – Flood Defence Reliability
FloodProBE Guidance 25
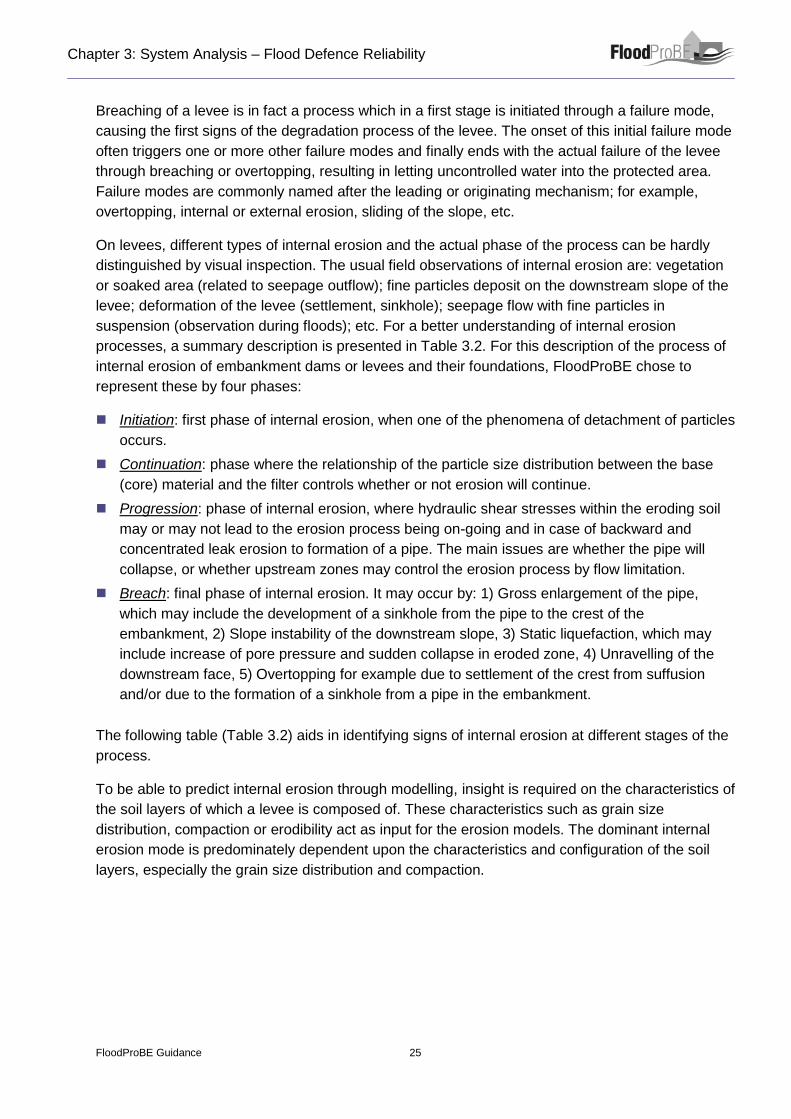
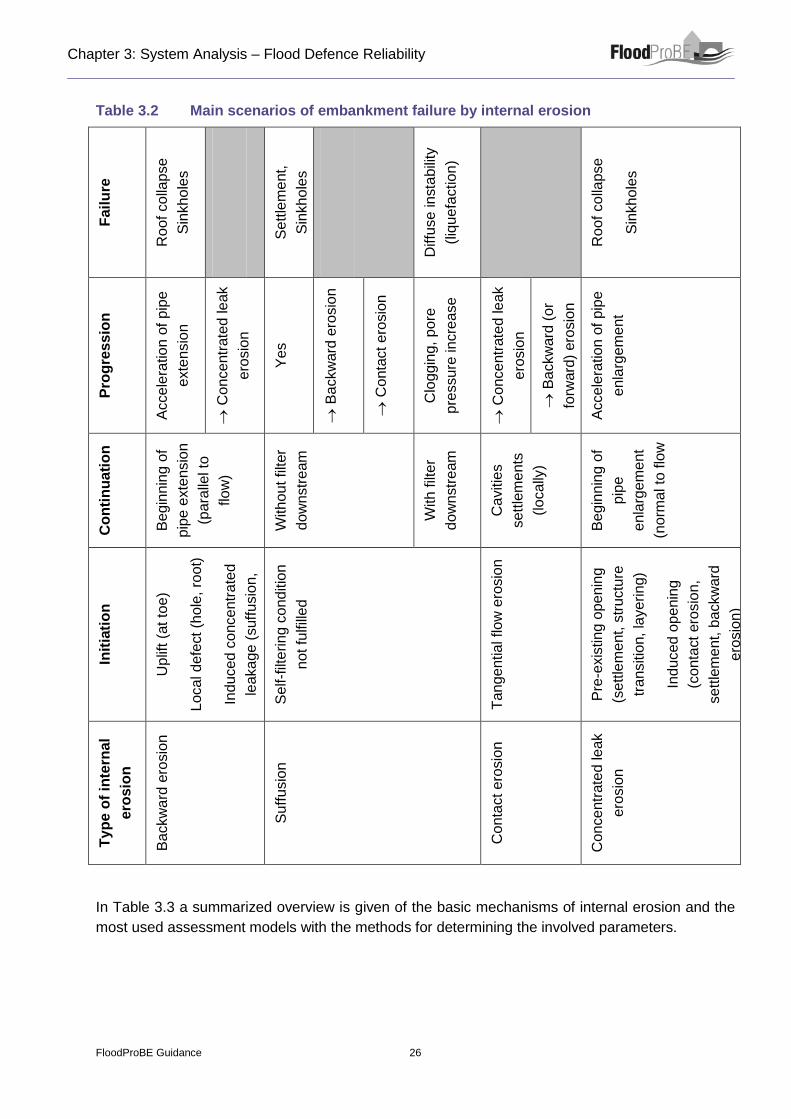
Breaching of a levee is in fact a process which in a first stage is initiated through a failure mode,
causing the first signs of the degradation process of the levee. The onset of this initial failure mode
often triggers one or more other failure modes and finally ends with the actual failure of the levee
through breaching or overtopping, resulting in letting uncontrolled water into the protected area.
Failure modes are commonly named after the leading or originating mechanism; for example,
overtopping, internal or external erosion, sliding of the slope, etc.
On levees, different types of internal erosion and the actual phase of the process can be hardly
distinguished by visual inspection. The usual field observations of internal erosion are: vegetation
or soaked area (related to seepage outflow); fine particles deposit on the downstream slope of the
levee; deformation of the levee (settlement, sinkhole); seepage flow with fine particles in
suspension (observation during floods); etc. For a better understanding of internal erosion
processes, a summary description is presented in Table 3.2. For this description of the process of
internal erosion of embankment dams or levees and their foundations, FloodProBE chose to
represent these by four phases:
Initiation: first phase of internal erosion, when one of the phenomena of detachment of particles
occurs.
Continuation: phase where the relationship of the particle size distribution between the base
(core) material and the filter controls whether or not erosion will continue.
Progression: phase of internal erosion, where hydraulic shear stresses within the eroding soil
may or may not lead to the erosion process being on-going and in case of backward and
concentrated leak erosion to formation of a pipe. The main issues are whether the pipe will
collapse, or whether upstream zones may control the erosion process by flow limitation.
Breach: final phase of internal erosion. It may occur by: 1) Gross enlargement of the pipe,
which may include the development of a sinkhole from the pipe to the crest of the
embankment, 2) Slope instability of the downstream slope, 3) Static liquefaction, which may
include increase of pore pressure and sudden collapse in eroded zone, 4) Unravelling of the
downstream face, 5) Overtopping for example due to settlement of the crest from suffusion
and/or due to the formation of a sinkhole from a pipe in the embankment.
The following table (Table 3.2) aids in identifying signs of internal erosion at different stages of the
process.
To be able to predict internal erosion through modelling, insight is required on the characteristics of
the soil layers of which a levee is composed of. These characteristics such as grain size
distribution, compaction or erodibility act as input for the erosion models. The dominant internal
erosion mode is predominately dependent upon the characteristics and configuration of the soil
layers, especially the grain size distribution and compaction.
Chapter 3: System Analysis – Flood Defence Reliability
FloodProBE Guidance 26
Table 3.2 Main scenarios of embankment failure by internal erosion F
ail
ure
Ro
of
co
llapse
Sin
kho
les
Se
ttle
me
nt,
Sin
kho
les
Diffu
se in
sta
bili
ty
(liq
ue
factio
n)
Ro
of
co
llapse
Sin
kho
les
Pro
gre
ss
ion
Acce
lera
tio
n o
f p
ipe
exte
nsio
n
C
once
ntr
ate
d le
ak
ero
sio
n
Ye
s
B
ackw
ard
ero
sio
n
C
onta
ct e
rosio
n
Clo
gg
ing,
pore
pre
ssu
re in
cre
ase
C
once
ntr
ate
d le
ak
ero
sio
n
B
ackw
ard
(o
r
forw
ard
) ero
sio
n
Acce
lera
tio
n o
f p
ipe
enla
rge
me
nt
Co
nti
nu
ati
on
Be
gin
nin
g o
f
pip
e e
xte
nsio
n
(para
llel to
flo
w)
With
out filter
dow
nstr
eam
With
filt
er
dow
nstr
eam
Ca
vitie
s
se
ttle
me
nts
(lo
cally
)
Be
gin
nin
g o
f
pip
e
enla
rge
me
nt
(norm
al to
flo
w
Init
iati
on
Up
lift
(at to
e)
Loca
l d
efe
ct (h
ole
, ro
ot)
Indu
ced
co
nce
ntr
ate
d
leaka
ge
(suff
usio
n,
co
nta
ct e
rosio
n)
Se
lf-f
ilte
ring c
ond
itio
n
not fu
lfill
ed
Tan
ge
ntia
l flo
w e
rosio
n
Pre
-exis
tin
g o
pe
nin
g
(se
ttle
me
nt, s
tru
ctu
re
tra
nsitio
n,
layerin
g)
Indu
ced
op
enin
g
(co
nta
ct
ero
sio
n,
se
ttle
me
nt, b
ackw
ard
ero
sio
n)
Typ
e o
f in
tern
al
ero
sio
n
Ba
ckw
ard
ero
sio
n
Su
ffu
sio
n
Co
nta
ct e
rosio
n
Co
nce
ntr
ate
d le
ak
ero
sio
n
In Table 3.3 a summarized overview is given of the basic mechanisms of internal erosion and the
most used assessment models with the methods for determining the involved parameters.

Chapter 3: System Analysis – Flood Defence Reliability
FloodProBE Guidance 27
Table 3.3 Matrix of models of internal erosion and parameters to be determined
Ke
y s
oil
s’
para
me
ters
Gra
in s
ize
dis
trib
utio
n
Wa
ter
co
nte
nt;
Co
mp
actio
n
Fin
e
co
nte
nt;
Ch
em
ica
l
activity
Gra
in s
ize
dis
trib
utio
n
Gra
in s
ize
dis
trib
utio
n
Sim
ilar
to
co
nce
ntr
ate
d lea
k
ero
sio
n
Do
ma
ins
of
vali
dit
y
d70:1
50
– 4
50
µm
;
d60/d
10<
2,6
;
roun
dn
ess: 3
5 –
70; re
lative d
en
sity
> 5
0%
; S
ilt fra
ction
(<6
3 μ
m)
< 1
0%
d50:
from
ve
ry f
ine
(<1
05 μ
m)
to v
ery
co
ars
e (
>1
6 m
m)
Co
he
siv
e s
oils
(su
ffic
ient
co
hesio
n
to h
old
up d
rilli
ng a
cylin
drica
l h
ole
fo
r
testing
)
No
n-c
ohe
siv
e s
oils
No
n-c
ohe
siv
e s
oils
Co
he
siv
e s
oils
Me
tho
ds o
f
dete
rmin
ati
on
Pe
rme
am
ete
r, g
rain
siz
e d
istr
ibutio
n
Gra
in s
ize
dis
trib
utio
n
Gra
in s
ize
dis
trib
utio
n a
nd
em
piric
al ta
ble
Ho
le E
rosio
n
Test (b
y a
dju
stm
ent
of th
e e
rosio
n la
w)
Gra
in s
ize
dis
trib
utio
n
Gra
in s
ize
dis
trib
utio
ns
Co
nta
ct E
rosio
n
Test (a
dju
stm
ent)
Pa
ram
ete
rs
: a
qu
ife
r p
erm
eab
ility
d70 o
f a
qu
ife
r
CB
ligh:
cre
ep
fa
cto
r
CLa
ne:
we
ighte
d c
reep
facto
r
Critica
l str
ess: c
Ero
sio
n c
oeffic
ient: k
er
F: m
ass p
assin
g (
siz
e d
)
H:
incre
me
nt o
f m
ass
passin
g (
siz
e D
=4
d)
k a
nd n
D:
co
ars
e s
oil
perm
eab
ility
and p
oro
sity;
d50 a
nd D
15
Sim
ilar
to c
once
ntr
ate
d
leak e
rosio
n
Mo
de
ls
Thre
sho
ld:
H
c=
Fre
sF
scaleF
ge
oL
(Se
llme
ijer)
Thre
sho
ld(B
ligh)
H
c=
L/C
Blig
h;
H
c=
(L/3
+L
v)/
CLane
Exce
ss s
he
ar
str
ess e
rosio
n la
w:
=
ker(- c
)
(Bo
ne
lli)
Se
lf-f
iltra
tio
n r
ule
s
H>
15
(K
ezdi); H
>F
(Ke
nn
ey &
Lau
)
Thre
sho
ld (
Be
gu
in)
Uc=
Fr c
nD((
s-
1)g
d50)1
/2
Fr c
=f(
d50,
D15,
Re
D)
Exce
ss s
he
ar
str
ess e
rosio
n la
w
= k
er(- c
) (B
egu
in)
Typ
e o
f
inte
rnal
ero
sio
n
Ba
ckw
ard
ero
sio
n (
in
non-
co
he
siv
e
ma
teria
l)
Co
nce
ntr
ate
d lea
k
ero
sio
n
Su
ffu
sio
n
Co
nta
ct
ero
sio
n
Chapter 3: System Analysis – Flood Defence Reliability
FloodProBE Guidance 28
In the case of non-cohesive materials where erosion is the result of local destabilizations of
particles at the interface induced by the hydraulic flow, it is obviously the grain size distribution of
the material that determines the resistance of soil to erosion. The main parameters are typical
particle diameters as d70 or d50, permeability and more complex parameters deduced from the
grain size distribution.
No simple relationship was found between soil characteristics and erodibility parameters
determined from direct testing of cohesive soils. However, soil parameters with the most significant
influences on erodibility have been clearly identified. For a given soil, the more influencing
parameters are compaction density, water content and degree of saturation. An increase of these
parameters leads to an improvement of soil resistance against erosion phenomenon. For a given
nature of fines (i.e. for a unique chemical activity), the fines content in soil has obviously an
important impact on erosion parameters; the critical shear stress of erosion increases significantly
as the percentage of fine content present in the soil increases. For different types of clay, chemical
activity is fundamental for erodibility and a very strong discrepancy is observed from one clay to
another, even within the same “class” of clays (kaolins for instance). The dispersivity of soil has a
significant impact on erodibility. It is also noteworthy that the aging effect plays a significant role
on soil erodibility parameters with strong differences between intact and reconstituted soil
samples; some erosion experimental results have shown that intact samples are more resistant
than reconstituted samples; this is certainly due to the remoulding of soil in case of reconstituted
samples.
3.2.2 Structure transitions
Analysis of recent flood events such as at Arles (France) and New Orleans (USA) have
demonstrated the weaknesses in urban flood defences that can occur at transitions between
structure types or at specific locations. In particular, the contact zone between two types of
structure can be a preferred seepage path, where erosion can be initiated or developed. Those
transitions create weak points within a defence and undermine the performance of the overall
system of flood defences. In particular, internal erosion processes at structure transitions or below
historical structures such as sluices, are poorly understood, since information on the current state
of the subterranean part of the structure, e.g. foundation or sheet pile cut-offs, is often lacking.
Whilst flood defence asset managers, who routinely inspect and manage defences, are typically
aware of the practical risks posed by transitions between structures, these risks are not yet
routinely included within system flood risk analyses. The broad aim of the work in FloodProBE was
to identify typical weak designs for structure transitions and specific points and provide guidance
on repair or retrofit solutions.
There is a need for methods for safety assessment of transition structures, being preferably fast,
cost-effective and non-destructive methods, as well as providing a clear understanding of the
erosion processes that lead to inundation failure. FloodProBE has built upon the state-of-the-art to
advance the fundamental knowledge on soil erosion along structures and at structure transitions.
This knowledge is used to extend or introduce failure mode descriptions of transitions for the risk
analysis of urban flood defences in particular.

Chapter 3: System Analysis – Flood Defence Reliability
FloodProBE Guidance 29
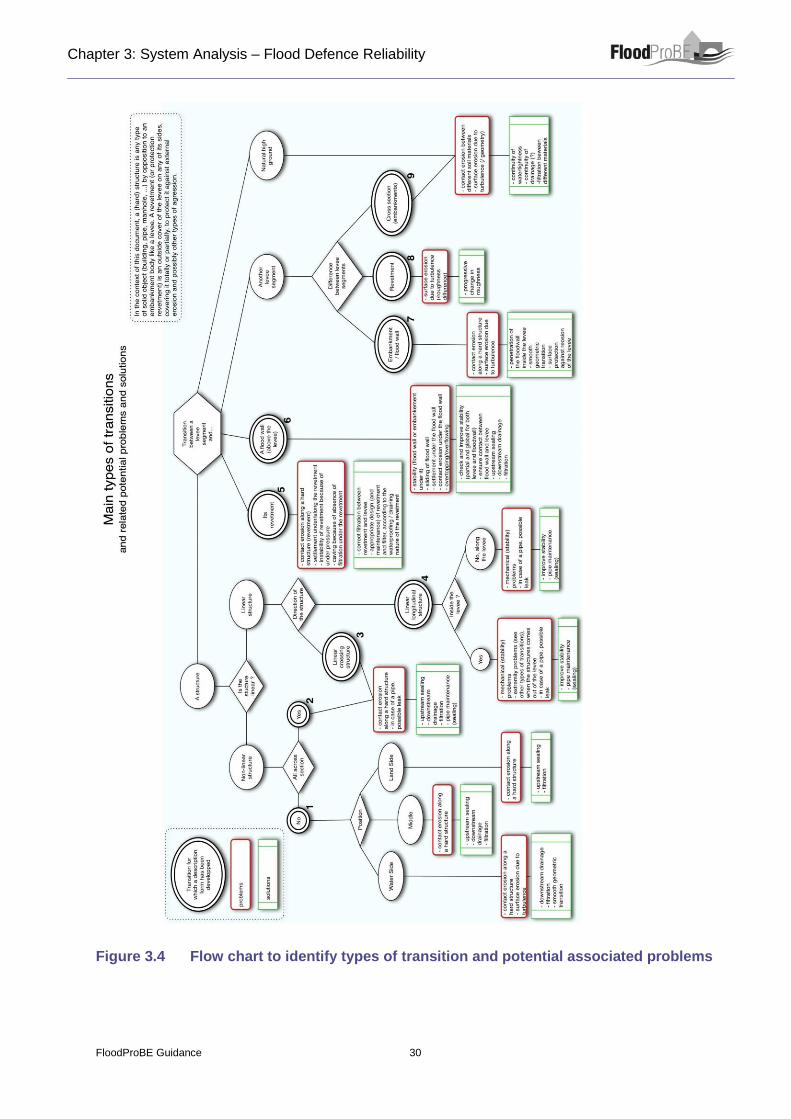
Typical problems that might occur, alone or as part of a process (or scenario) at different types of
structure transitions have been investigated in flood experiences in France, USA, Thailand, The
Netherlands and UK. Based on this study, Figure 3.4 was developed with a flow chart for the
assessment of the different types of structure transitions and the processes that might occur at
those transitions (red boxes) as well as short recommendations as to how such transitions should
be managed, assessed, designed and repaired to limit flood risk (green boxes).
Chapter 3: System Analysis – Flood Defence Reliability
FloodProBE Guidance 30
Figure 3.4 Flow chart to identify types of transition and potential associated problems
Chapter 3: System Analysis – Flood Defence Reliability
FloodProBE Guidance 31
The research resulted in the following lessons learned:
The contact zone between the different materials in the transitions can be defined as "rough" or
"smooth" or even "loose", allowing more or less water flow and so giving more or less internal
erosion. The physics of the phenomena are not yet well understood at the microscopic scale,
or characterised well by means of numerical models. The physics of contact erosion probably
differ in the case of a transition between a hard structure and an embankment or in the case of
a transition between two embankments, for instance at the limit of two stretches of the same
levee, with different geotechnical cross sections.
External erosion occurring at the surface area of a transition can be caused either by contact
erosion occurring inside, or by an external cause, such as for instance turbulence caused by a
difference in roughness coefficient across a transition between two materials. Also a simple
geometric irregularity can lead to concentrated flow, turbulence and external erosion.
Sometimes the function of the structure or the way it has been built can cause specific erosion
problems, for example: leakage from pipes (or into pipes) or poor levee soil conditions around
a good condition structure (e.g. sand around a pipe through a levee). As pipes are the most
common type of "hard" structures found in a levee in many countries (FloodProBE Orleans
pilot), it is particularly important to consider this specific transition structure. Problems could be
avoided or detected through close cooperation between the levee managing organisation, and
the pipe managing organisation.
Another type of problem is related to settlement under or near a hard structure, causing a
preferred area for water flow, which will then result in erosion or increased internal pressures
leading to uplift or sliding.
In some cases, the presence of a structure or a transition can also induce sliding (shear),
because of additional forces not taken into account in the initial stability analysis.
The failure and collapse of an included structure may lead to either settlement in the levee,
causing a potential overflow, or a loss of cohesion of the levee material in the structure area
and hence internal erosion during a flood. Due to the presence of the structure, or because of
its failure, mechanical failure (e.g. collapse or sliding) may also happen.
Solutions/interventions, for improving the management of transitions can be proposed in terms
of: 1) management of the encroachments, i.e. organisation (coordination) of the management
of the levee and the structure, 2) inspections (pre, during or post flood), 3) assessment
methods, 4) improvement works (decide between rebuild/remove/act on the soil or act on the
structure, propose technical options). It should be recognised, though, that the best option
remains to avoid creating transitions wherever possible.
Reviewing and developing the information on transitions was to provide guidance on how to
identify and manage the risks posed. It also became clear that identifying where transitions
existed was a problem. For the situations where transitions arise from interfaces between
structures buried within or even under the levee, records do not always exist and a visual
inspection does not always show any signs of the transition. In this situation a review of
historic records and asset manager’s field experience is often the only initial method that asset
managers could employ in order to develop a long list of transition structures for assessment.
Chapter 3: System Analysis – Flood Defence Reliability
FloodProBE Guidance 32
Historically, the analysis and inclusion of risks generated from transitions has not been undertaken
– at least within the UK and Dutch frameworks for flood risk analysis. Inclusion of transitions within
a modelling framework for risk assessment then poses a number of challenges. For a rigorous
assessment it is necessary to include transitions as point or individual structures, against which
performance data has to be attributed. This requires adaptation of the analysis framework to
incorporate such structures plus sufficient knowledge of the potential failure mechanisms as to
allow performance curves (fragility curves) to be produced for each transition structure under a
range of load conditions. Currently the understanding and characterisation of some of the
processes is not at a sufficiently developed stage to provide a reliable numerical representation of
the processes. However, in the absence of numerical models of the failure process, engineering
judgement may be used to develop initial estimates of performance based upon field experience.
See also Section 3.4 on how to combine engineering judgement and numerical data.
3.2.3 The performance of vegetation (grass) on flood
embankments
The erosion resistance of levees is partly determined by the performance of the grass cover.
Grass is considered to have good performance if it prevents erosion of the underlying soil and
ultimately any damage to the flood defence. Determining the loading(s) up to which grass remains
in place, offering protection to the structure, is one of the primary aims of the designer and asset
manager. The hydraulic performance of grass on flood embankments can be assessed by the
loading(s) to which the grass and embankment are subjected. These loadings fall mainly into the
following categories: wave impact and overtopping, overflow and rainfall runoff.
In general the hydraulic performance of grass can be considered in terms of:
1. Its erosion resistance, by means of a “maximum permissible velocity” of the flow or the
“effective shear stress” that a grass lined structure can withstand; the erosion resistance
indicates if the grass cover can protect the underlying soil.
2. The resistance to the flow (caused friction), usually by means of a coefficient of frictional
resistance such as Manning’s n, which allows calculation of the flow depth/velocity/rate.
Both concepts are useful and complementary. For the case of flood embankments, determining
the erosion resistance is the primary aim, whereas the resistance to the flow becomes more
relevant to the design of grassed channels because it allows the determination of the conveyance
(i.e. flow capacity) of a channel. However, knowledge of the resistance of grass is also important in
the context of flood embankments as it is required in certain methodologies for the determination
of the effective shear stress, and allows estimation of how much flow can reach areas behind the
defences and how fast it will reach them.
Existing design guidance on the performance of grass on levees is limited and typically based
upon data and analyses from the 1980s. The data sets used are fairly limited, and also appear to
contain in built factors of safety which, whilst these maybe appropriate for use in design methods,
can cause problems when the performance curves are used for levee reliability analysis. Based
upon a review of international research results and grass performance data from the last 25 years,
Chapter 3: System Analysis – Flood Defence Reliability
FloodProBE Guidance 33
guidance has been developed regarding the use of existing guidance for the performance
assessment of grass cover. Specific research actions on grass performance within FloodProBE
were:
A review of project initiatives related to the performance of grass;
Investigation into grass performance data collected at the USDA Stillwater centre over the past
20 years, to identify what aspects might be relevant to European practice;
Confirmation of existing European and US guidance on grass performance followed by
identification of either (i) updates to guidance using existing international research findings or
(ii) clarification of longer term R&D needs to improve knowledge and performance of
embankment grass cover layers.
The review of initiatives, guidance and literature relating to overflow conditions identified a range of
projects that appeared (initially) to provide guidance or advance the state of knowledge. The
review of current guidance, and the data upon which this guidance is based, highlighted some
noteworthy issues:
1. As a general indication, from the literature review by FloodProBE it has been suggested
that permissible velocities (which depend on the soil, the density of grass cover and the
longitudinal gradient of the channel/slope) are in the range 1.2m/s and 2.1m/s for good
grass cover. It has been found that the duration of the flow is a relevant parameter in the
erosion of channels that are intermittently subjected to flow, which is the case of flood
embankments. Even without reinforcement, grassed surfaces can withstand considerably
high velocities for short durations: almost 4m/s for 1 hour or 3m/s for 2 hours. However,
long term stability is generally achieved if flow velocities remain below 1m/s.
2. Practical and detailed quantitative guidance on performance of grass under overflow
conditions is quite hard to find. There appear to be many research initiatives, but little
generic guidance with actual methods provided for the design or performance analysis of
grass cover. To the contrary there seems to be plenty of general guidance on the
maintenance and use of vegetation.
3. A lot of research initiatives seem to focus on the hydraulic resistance of grass / vegetation
to flow, rather than the performance of the grass in protecting soil from erosion.
4. Based upon the literature review undertaken, the main sources of guidance on erosion
protection from grass cover seem to be limited to:
a. A guide to the use of grass in hydraulic engineering practice, further referred to as CIRIA
Technical Note 71.
b. Design of reinforced grass waterways, further referred to as CIRIA Report 116.
c. Stability Design of Grass-Lined Open Channels, further referred to as Agriculture
Handbook 667.
It should be noted that the CIRIA 116 method builds from the Technical Note 71 data. It
also incorporates USDA data; hence all three methods are related to some degree.
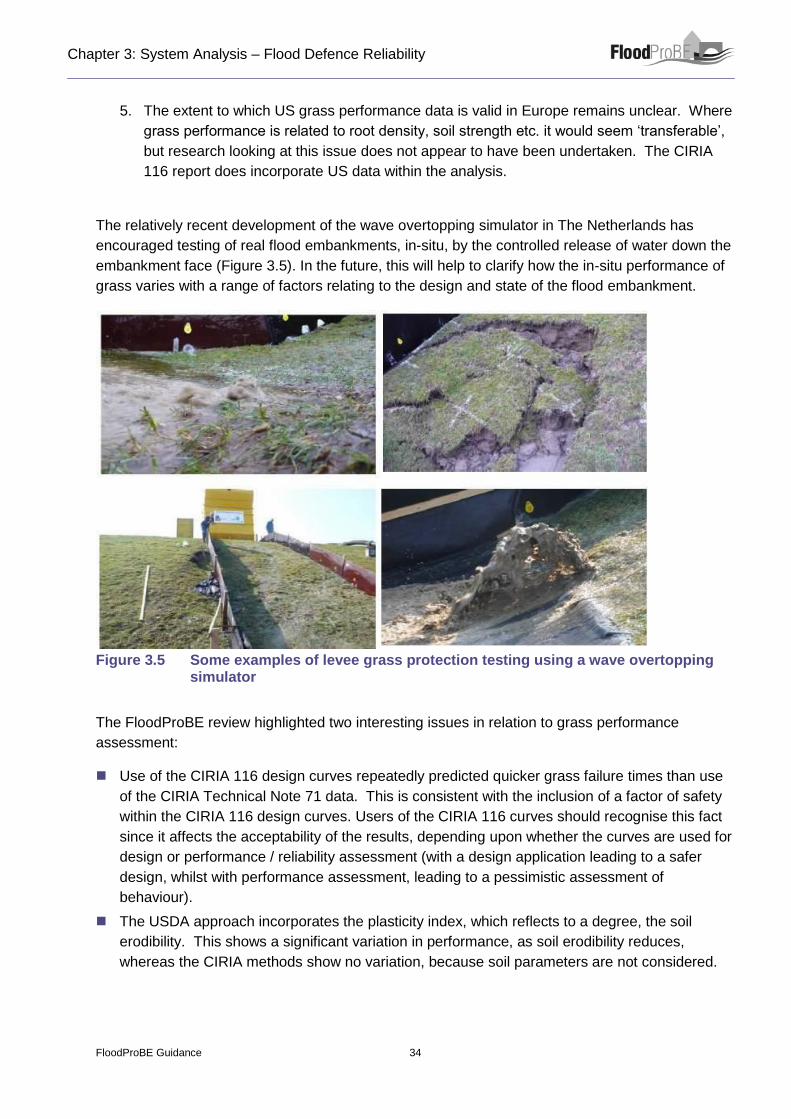
Chapter 3: System Analysis – Flood Defence Reliability
FloodProBE Guidance 34
5. The extent to which US grass performance data is valid in Europe remains unclear. Where
grass performance is related to root density, soil strength etc. it would seem ‘transferable’,
but research looking at this issue does not appear to have been undertaken. The CIRIA
116 report does incorporate US data within the analysis.
The relatively recent development of the wave overtopping simulator in The Netherlands has
encouraged testing of real flood embankments, in-situ, by the controlled release of water down the
embankment face (Figure 3.5). In the future, this will help to clarify how the in-situ performance of
grass varies with a range of factors relating to the design and state of the flood embankment.
Figure 3.5 Some examples of levee grass protection testing using a wave overtopping
simulator
The FloodProBE review highlighted two interesting issues in relation to grass performance
assessment:
Use of the CIRIA 116 design curves repeatedly predicted quicker grass failure times than use
of the CIRIA Technical Note 71 data. This is consistent with the inclusion of a factor of safety
within the CIRIA 116 design curves. Users of the CIRIA 116 curves should recognise this fact
since it affects the acceptability of the results, depending upon whether the curves are used for
design or performance / reliability assessment (with a design application leading to a safer
design, whilst with performance assessment, leading to a pessimistic assessment of
behaviour).
The USDA approach incorporates the plasticity index, which reflects to a degree, the soil
erodibility. This shows a significant variation in performance, as soil erodibility reduces,
whereas the CIRIA methods show no variation, because soil parameters are not considered.

Chapter 3: System Analysis – Flood Defence Reliability
FloodProBE Guidance 35
Hence, whilst improvement in the reliability of performance assessment can be made by using the
USDA approach instead of CIRIA methods, there still remains a number of ‘gaps in knowledge’
relating to grass performance. These include:
The appropriateness of using test data from grasses in the USA for application within Europe.
The performance of grass during the initial hour or so of overflow – this period is missing from
the CIRIA 116 and Technical Note 71 work.
Much of the data used relates to flow in steep grass lined channels, as might be used for
embankment dam spillways. The applicability to small earth flood embankments is not
completely clear.
The effect of variation in grass type across Europe is unclear. In addition, as climate change
effects start to change the rainfall and soil moisture content of levees, variations in grass type
may also occur.
Analysis of any link between grass type and performance in conjunction with underlying soil
type and performance is also required. For example, where the underlying soils are highly
erosion resistant, do they prevent growth and maintenance of an effective grass layer?
Conversely do weak erodible soils promote stronger grass growth? Subsequently, which
combination of soil and grass cover offers the best solution for flood embankment protection
and performance?
It was noted that in recent years there have been a number of initiatives looking at (i) the
management of grass (i.e. cutting frequency), (ii) soil erodibility and (iii) wave overtopping on
grassed embankments. The missing piece to this jigsaw of research is quality data relating to the
performance of a range of grass types, on a range of soil types under steady overflowing
conditions. Such data would permit most of the gaps in knowledge listed above to be answered
and for more reliable performance guidance to be given.
It would seem logical that the physical process of grass erosion, with the removal of roots from the
soil, would also relate to the resistance of the underlying soil to erosion. The trend in levee breach
analysis is towards the use of soil erodibility in order to improve representation of the embankment
performance. Similarly, with the likely trend being towards design or planning for acceptable
overflow during increasingly extreme flood events, adoption of a method that includes
representation of soil erodibility for grass performance assessment would seem sensible.
3.3 Levee system assessment
Levee systems consist of large stretches of flood defences which have to be assessed in a rapid
and cost-effective manner. Geophysical methods and remote sensing are assessment tools that
are specifically applicable for large areas. Within FloodProBE, an overview of these techniques
which are applicable for risk assessment of levees is compiled and presented in a uniform way.
Especially within FloodProBE, its applicability focus is the use of these techniques in urban areas.
This is studied as well as tested in pilots. The results are summarised in the following sections.
Section 3.3.1 gives an overview of geophysical methods and how those can be used in levee
assessments. In section 3.3.2 an overview is given of all available remote sensing techniques,
which could be used for levee assessment, but especially the so-called LIDAR technique is

Chapter 3: System Analysis – Flood Defence Reliability
FloodProBE Guidance 36
presented in much more detail and was tested in a pilot since this technique is the most useful
method for a cost-effective risk assessment of urban levees.
3.3.1 Geophysical methods for rapid levee condition
assessment
Geophysical investigation is based on a reflection of a physical or electromagnetic wave on the
subsurface materials - see Figure 3.6. These reflections are sensitive to material properties, its
nature and parameters such as i.e. bulk density or moisture content. Therefore, geophysical
investigations have shown great potential to inform on subsoil features such as: structure
(layering), nature (geology), condition and spatial variations of soil properties.
Figure 3.6 Geophysical principle for ground investigation
Source: www.cflhd.gov
The geophysical interpretation requires signal processing and noise reduction, then data
processing, calibration, modelling and result quality assessment (reliability or uncertainty level),
(see Figure 3.7). Interpretation of data from various sources (combination of geophysical methods
with borehole / cone penetration test data, geologic data and / or historical data) is needed for
interpretation and calibration of the resulted subsoil model.
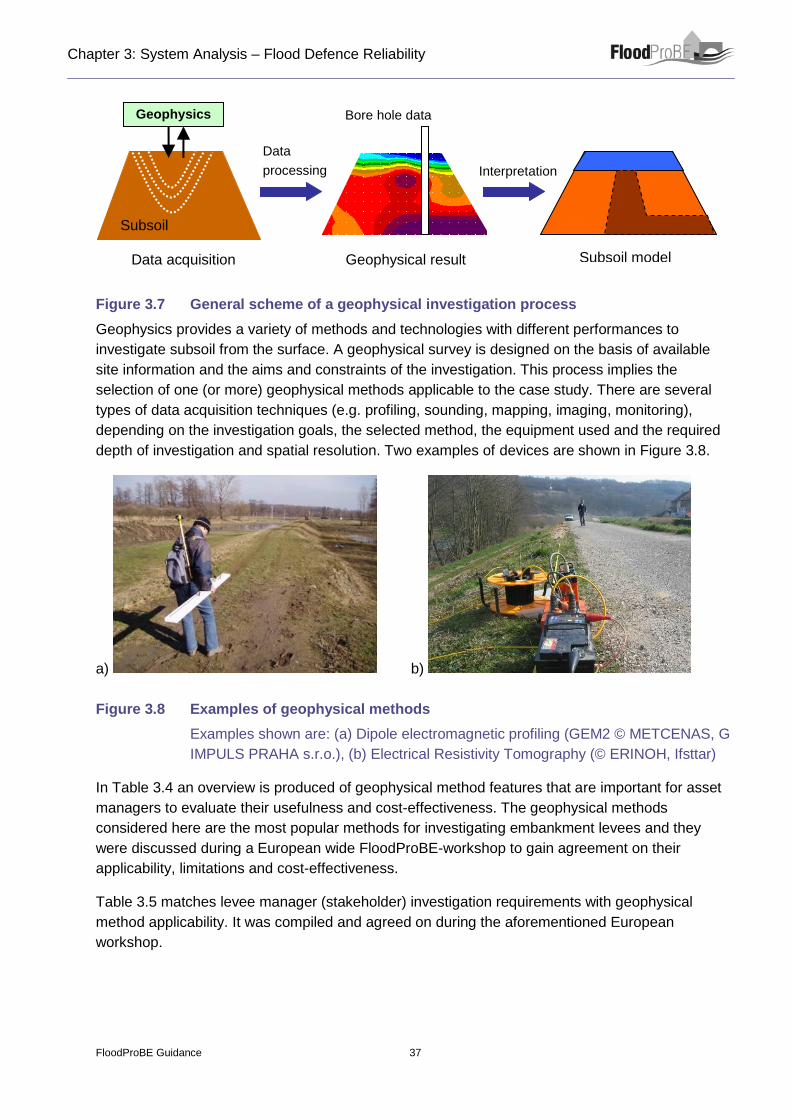
Chapter 3: System Analysis – Flood Defence Reliability
FloodProBE Guidance 37
Figure 3.7 General scheme of a geophysical investigation process
Geophysics provides a variety of methods and technologies with different performances to
investigate subsoil from the surface. A geophysical survey is designed on the basis of available
site information and the aims and constraints of the investigation. This process implies the
selection of one (or more) geophysical methods applicable to the case study. There are several
types of data acquisition techniques (e.g. profiling, sounding, mapping, imaging, monitoring),
depending on the investigation goals, the selected method, the equipment used and the required
depth of investigation and spatial resolution. Two examples of devices are shown in Figure 3.8.
a) b)
Figure 3.8 Examples of geophysical methods
Examples shown are: (a) Dipole electromagnetic profiling (GEM2 © METCENAS, G
IMPULS PRAHA s.r.o.), (b) Electrical Resistivity Tomography (© ERINOH, Ifsttar)
In Table 3.4 an overview is produced of geophysical method features that are important for asset
managers to evaluate their usefulness and cost-effectiveness. The geophysical methods
considered here are the most popular methods for investigating embankment levees and they
were discussed during a European wide FloodProBE-workshop to gain agreement on their
applicability, limitations and cost-effectiveness.
Table 3.5 matches levee manager (stakeholder) investigation requirements with geophysical
method applicability. It was compiled and agreed on during the aforementioned European
workshop.
Geophysics
Data acquisition Geophysical result Subsoil model
Data
processing Interpretation
Bore hole data
Subsoil

Chapter 3: System Analysis – Flood Defence Reliability
FloodProBE Guidance 38
Table 3.4 An overview of the performance of geophysical methods in levee assessments
This table is explained in detail in the FloodProBE deliverable report; see Chapter 6 for links to
more information.
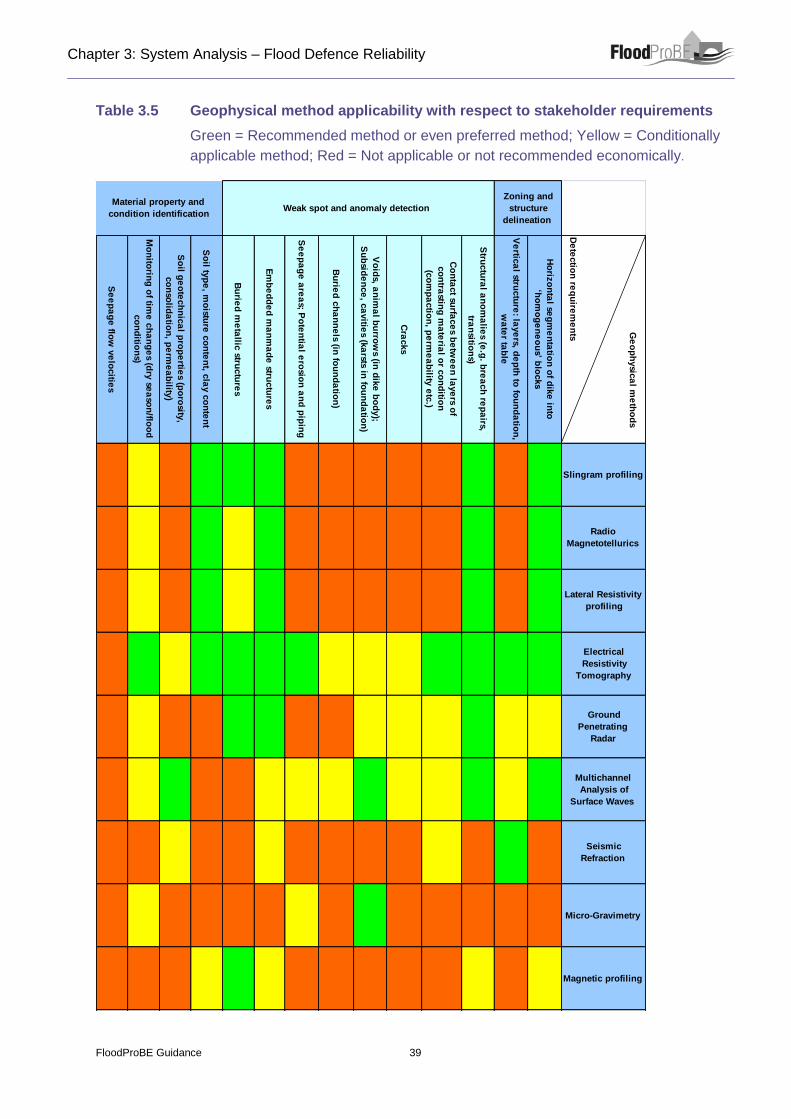
Chapter 3: System Analysis – Flood Defence Reliability
FloodProBE Guidance 39
Table 3.5 Geophysical method applicability with respect to stakeholder requirements
Green = Recommended method or even preferred method; Yellow = Conditionally
applicable method; Red = Not applicable or not recommended economically. G
eo
ph
ysic
al m
eth
od
s
De
tectio
n re
qu
irem
en
ts
Slingram profiling
Radio
Magnetotellurics
Lateral Resistivity
profiling
Electrical
Resistivity
Tomography
Ground
Penetrating
Radar
Multichannel
Analysis of
Surface Waves
Seismic
Refraction
Micro-Gravimetry
Magnetic profiling
Ho
rizo
nta
l seg
me
nta
tion
of d
ike
into
‘ho
mo
ge
ne
ou
s’ blo
cks
Ve
rtica
l structu
re: la
ye
rs, de
pth
to fo
un
da
tion
,
wa
ter ta
ble
Stru
ctu
ral a
no
ma
lies (e
.g. b
rea
ch
rep
airs,
tran
sition
s)
Co
nta
ct su
rface
s be
twe
en
laye
rs of
co
ntra
sting
ma
teria
l or c
on
ditio
n
(co
mp
actio
n, p
erm
ea
bility
etc
.)
Cra
cks
Vo
ids, a
nim
al b
urro
ws (in
dik
e b
od
y);
Su
bsid
en
ce
, ca
vitie
s (ka
rsts in fo
un
da
tion
)
Bu
ried
ch
an
ne
ls (in fo
un
da
tion
)
Se
ep
ag
e a
rea
s; Po
ten
tial e
rosio
n a
nd
pip
ing
Em
be
dd
ed
ma
nm
ad
e stru
ctu
res
Bu
ried
me
tallic
structu
res
So
il typ
e, m
oistu
re c
on
ten
t, cla
y c
on
ten
t
So
il ge
ote
ch
nic
al p
rop
ertie
s (po
rosity
,
co
nso
lida
tion
, pe
rme
ab
ility)
Mo
nito
ring
of tim
e c
ha
ng
es (d
ry se
aso
n/flo
od
co
nd
ition
s)
Se
ep
ag
e flo
w v
elo
citie
s
Zoning and
structure
delineation
Weak spot and anomaly detectionMaterial property and
condition identification
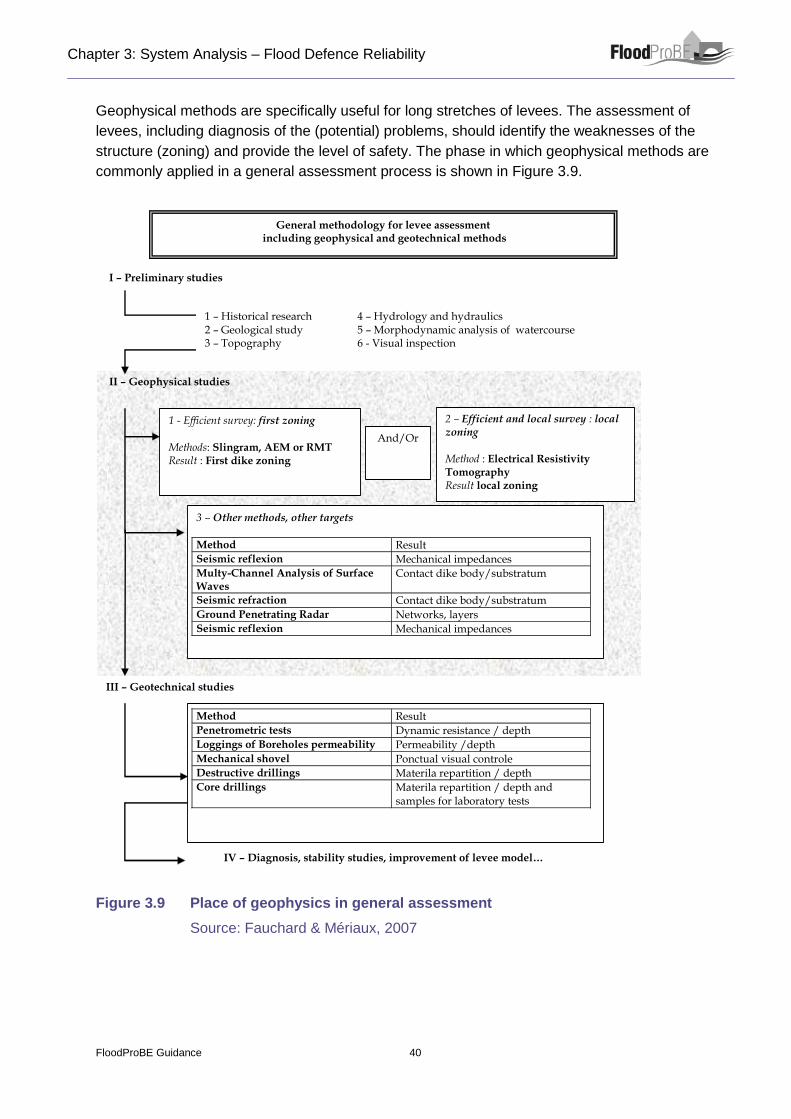
Chapter 3: System Analysis – Flood Defence Reliability
FloodProBE Guidance 40
Geophysical methods are specifically useful for long stretches of levees. The assessment of
levees, including diagnosis of the (potential) problems, should identify the weaknesses of the
structure (zoning) and provide the level of safety. The phase in which geophysical methods are
commonly applied in a general assessment process is shown in Figure 3.9.
Method Result
Penetrometric tests Dynamic resistance / depth
Loggings of Boreholes permeability Permeability /depth
Mechanical shovel Ponctual visual controle
Destructive drillings Materila repartition / depth
Core drillings Materila repartition / depth and samples for laboratory tests
4 – Hydrology and hydraulics 5 – Morphodynamic analysis of watercourse 6 - Visual inspection
III – Geotechnical studies
II – Geophysical studies
I – Preliminary studies
1 - Efficient survey: first zoning
Methods: Slingram, AEM or RMT Result : First dike zoning
2 – Efficient and local survey : local zoning Method : Electrical Resistivity Tomography Result local zoning
IV – Diagnosis, stability studies, improvement of levee model…
General methodology for levee assessment including geophysical and geotechnical methods
And/Or
3 – Other methods, other targets
Method Result
Seismic reflexion Mechanical impedances
Multy-Channel Analysis of Surface Waves
Contact dike body/substratum
Seismic refraction Contact dike body/substratum
Ground Penetrating Radar Networks, layers
Seismic reflexion Mechanical impedances
1 – Historical research 2 – Geological study 3 – Topography
Figure 3.9 Place of geophysics in general assessment
Source: Fauchard & Mériaux, 2007

Chapter 3: System Analysis – Flood Defence Reliability
FloodProBE Guidance 41
This assessment process begins with so-called ‘preliminary studies’ to collect all available data of
the area. It is of primary importance that the levee manager provides all information of the
preliminary studies to the geophysics expert before the geophysical investigation phase starts.
Then geophysics is used for an efficient survey of long stretches and defining zones (or levee
sections) with similar subsoil profiles. It is recommended to execute first a longitudinal zoning,
resulting in stronger and weaker subsoil zones. And then in a second phase measure cross-
sections, especially in the weak areas, which in Figure 3.3 is called ‘local zoning’. However, in
some countries longitudinal and cross-sections are measured in one survey. After these
geophysical studies, further local geotechnical studies with field tests and laboratory testing are
needed for each relevant zone in the safety assessment.
Figure 3.10 Principle of a weak-spot detection by a repeated survey
The geophysical survey can be repeated for additional information. For example the transition from
a dry season to a wet season causes changing of soil properties and water tables within levee. In
weak zones, significant property changes may occur and be a sign of progressive disorders (e.g.
water infiltration, seepage, internal erosion, etc). Soil property and water table variations induce
geophysical response variations. Therefore, measured seasonal differences could indicate weak
zones, for an illustration see Figure 3.10.
3.3.2 Remote sensing for rapid levee condition assessment
Remote sensing, in its broadest sense, refers the use, from a distance (for instance an aircraft, a
spacecraft, a satellite or a boat), of any type of instrument capable of acquiring information on the
environment. For the levees, the most frequently used techniques include: aerial photography or
satellite imagery; mono- or multispectral photogrammetry; traditional Lidar and bathymetric Lidar;
radar; high resolution infrared thermography; sonar. These various techniques, either passive
(photography, thermography) or active (Lidar, Radar, Sonar), and their potential applications to
levee assessment is summarized in a table in Table 3.6. Lidar technologies are very relevant for
levee assessments and how to perform these assessments, especially in urban areas, is
elaborated in details within FloodProBE.
1st
x
Dry season (or neap tide) Wet season (flood or spring tide)
weak spot?
2nd
x
Embankment dike Water level rise

Chapter 3: System Analysis – Flood Defence Reliability
FloodProBE Guidance 42
Table 3.6 Remote sensing techniques for levees

Chapter 3: System Analysis – Flood Defence Reliability
FloodProBE Guidance 43
Figure 3.11 Lidar acquisition (left) and multiple return (right) principle
Source : Fugro Geoid
Lidar (Light Detection And Ranging) is an “active” remote sensing technique based on light
transmission from a transmitter to a receiver. The light is partly radiated or absorbed into the target
environment while the remaining light is backscattered towards the receiver. The technique is
based on measuring the lengths between the laser source and the object or environment (typically
the earth surface). The signal is transmitted from a laser attached to an airborne (helicopter or
airplane) or on a ground platform. The signal wavelength ranges, depending on its applications,
from 500 nm (e.g. bathymetric Lidar) to 1,550 nm (e.g. Airborne Laser Scanning). Traditional
ground resolutions are provided in decimetres with densities amounting to a few points per square
meter. This type of Lidar survey is commonly used in Levee management for acquiring
topographical data on river valleys, and for studying coastal areas. Compared to airplanes,
helicopters offer the advantage of flying at lower altitudes and slower velocity, allowing the
measurement of high point densities on the ground (> 50 points/m2) and are particularly suitable
for performing surveys or following up linear infrastructures such as levees. Additional to Lidar,
taking also aerial photographs or videos of the levees is very helpful to identify and specify any
visually indicated damages (external erosion, etc.), specific works (walls, water discharge or
intake, etc.) and irregular surfaces (woodlands), and to map then on a large scale plan.
As part of levee assessment procedures, Lidar techniques were first used in the United States and
The Netherlands. In France, the first experimental application dates back to 2006. As part of
FloodProBE-project, the very high resolution helicopter-borne laser remote sensing technology has
been identified as suitable for contributing to the assessment process (topography, determination
of embedded structures within the levee and vegetation) of urban and suburban levees, see the
textbox for some results of this pilot in Val D’ Orléans in France.
The laser performs three scans forward, nadir and backward, respectively, on the helicopter
(Figure 3.11). The flight path and laser source position can be known using onboard GPS systems.
The measurement principle is based on recording all data stemming from the first pulse or first
echo, and from the last pulse or last echo. First echo data will show, for instance, the vegetation
top whereas last echo data will show the ground underneath this vegetation. The different returns
can be used in the analysis i.e. in digital terrain model (DTM) also known as surface digital model
1st return from
tree top
1st (and only)
return from
the ground
2nd return from
branches
3rd return
from the
ground

Chapter 3: System Analysis – Flood Defence Reliability
FloodProBE Guidance 44
(SDM) or digital elevation model (DEM) and from the different returns in layers with or without
vegetation. In Figure 3.12 an overview is given of which echo data can be used for assessing risks
of internal erosion, overflow, instability external erosion and scour or former breaches. Vegetation
heights may be classified for a better determination of forest canopy strata or structures (trees,
bushes, hedges, etc.). In the text box some examples of the Orleans pilot site are shown, but for
more examples and details of the assessment guidance is referred to the FloodProBE deliverable,
see Chapter 6.
Figure 3.12 Lidar data and failure modes detection
Potential levee settlement issues may be identified by comparing topographical data recorded over
time. These types of movements usually change, at a more or less slow pace, over several years.
In order to identify and follow them up, high resolution Lidar acquisitions should be repeated at
regular intervals, every 2 to 5 years for instance. Follow-up processes of this type are regularly
applied in management for levees in the Netherlands.

Chapter 3: System Analysis – Flood Defence Reliability
FloodProBE Guidance 45
Box 3.1 Helicopter-borne survey of levees
The French pilot site selected for performing and operating an experimental helicopter-
borne survey over levees and related works in urban and suburban environments is Val d’
Orléans. This is one of the most challenging dales along the Loire River, with several
Orléans districts or boroughs located on areas liable to flooding by the river (65,000
inhabitants).
The digital elevation model (further referred to as SDM) contains information transmitted by
the radar first echo from the vegetation and frame cover. Items such as cars and people
are filtered. Underwater topography is not shown on the SDM as this type of laser does not
reflect water. Especially for the FloodProBE experiment, other SDM products were created:
a no-vegetation SDM to show only the constructions; and conversely a no-construction
SDM to show only the vegetation (Figure 3.13). This will help improve the levee
assessment with constructions and vegetation analyses with a GIS.
Figure 3.13 Left to right, SDM and no-vegetation SDM from the same area
As recalled in paragraph 3.3 (structure transitions), main internal erosion risk factors are as
follows: buildings embedded in levees, pipes crossing the levee, woodland and interface or
transition areas. SDM data are provided as 100x150 metre raster plates. To produce a
layer showing only constructed entities, each no-construction SDM raster (including
vegetation) must be subtracted from SDM (including vegetation and constructed entities).
Below is an example of a house embedded in the levee slope on the land side (orange
circle). It is located in Guilly, just before the levee separates from the river downstream. In
this instance, only one house is identified.
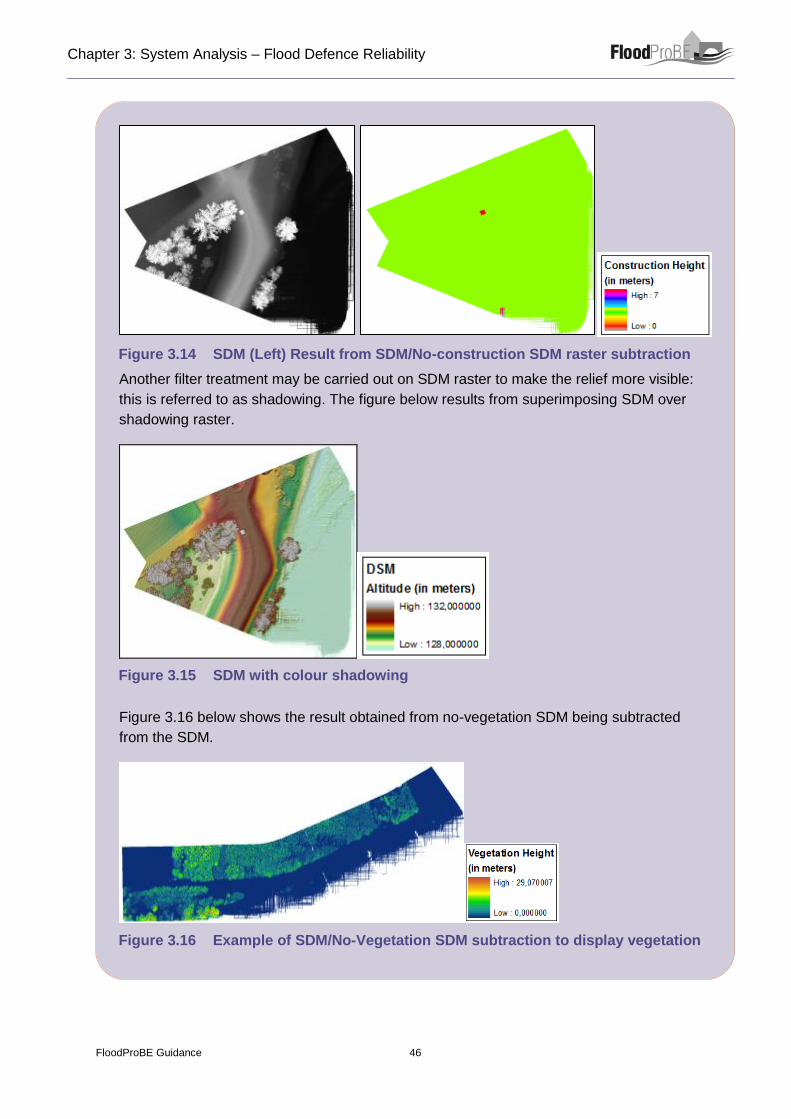
Chapter 3: System Analysis – Flood Defence Reliability
FloodProBE Guidance 46
Figure 3.14 SDM (Left) Result from SDM/No-construction SDM raster subtraction
Another filter treatment may be carried out on SDM raster to make the relief more visible:
this is referred to as shadowing. The figure below results from superimposing SDM over
shadowing raster.
Figure 3.15 SDM with colour shadowing
Figure 3.16 below shows the result obtained from no-vegetation SDM being subtracted
from the SDM.
Figure 3.16 Example of SDM/No-Vegetation SDM subtraction to display vegetation

Chapter 3: System Analysis – Flood Defence Reliability
FloodProBE Guidance 47
Combination of information sources - GIS-based diagnosis of levees
Levee management has changed rapidly over the past few years towards a more structured and
transparent data oriented process. This change is largely driven by the evolving presence of
information technology at all steps of the assessment. This applies to the traditional “hard” data
(that goes directly into the performance models), but also to the softer information that experts
observe whilst inspecting levees. A significant improvement in performance assessment can be
made if these fundamentally different data types (hard data as well as softer information like
observations or experiences) are combined and used in the assessment. As most of the
information is linked to a location, more and more information regarding levees is stored within GIS
databases. GIS is therefore more and more applied as part of a performance assessment.
Incorporating the softer information in the assessment models is not always straight-forward as our
traditional assessment tools are not designed to deal with different data types. FloodProBE
investigated how data is used to assess flood defence performance and how data and softer
information might be combined to provide more reliable performance assessments. The report
elaborates on assessment methods and mathematical techniques to combine data types and gives
practical examples.
The way in which system performance is assessed varies between countries and according to
specific assessment; national policy and cultural approaches have a significant impact on the
approaches taken. However, analysis of system performance typically requires the assessment of
each component of the system in a methodical manner. Historically, this has evolved by summing
the analysis of each of the individual structures or structure lengths. Within UK and The
Netherlands, probabilistic methods are used to analyse system flood risk. Fundamentally, the
approach considers how the flood defence structure performs over a range of load conditions and
what might happen when failure occurs. The FloodProBE-research differentiates between the
purpose of the assessment (policy analyses, routine maintenance, emergencies and regular safety
assessment), the type of data (data nature, type, source, format) and the stage (in the assessment
process) in which the data can be combined – for example, refining the input versus refining the
model.
3.3.3 Methods for analysing performance of the levee
The assessment process can be described, in a very simple way; as the use of one or more
methods for treating and combining data in order to evaluate the performance of the levee or levee
system, according to its main function (to protect against a flood) and/or its reliability (possible
failure modes). This can be done in a variety of ways, as there are different assessment methods
used in different countries, all based upon a combination of data processing, using expert
judgment, index based methods, empirical models, physical and/or mathematical models. Simple
models often suffice with simple data like indexes while more complex models often need large
amounts of data assimilation. Four types of methods for analysing levee safety modes are listed
from relatively simple (expert judgment) to very complex (mathematical models):
A flood safety expert has experience to assess whether a flood defence can withstand a
certain water level. The quality of the assessment stands with the quality of the expert. This

Chapter 3: System Analysis – Flood Defence Reliability
FloodProBE Guidance 48
also implies that the process leading to the conclusion is not always transparent and could be
questioned.
In index based assessment methods, a number of performance features determines the safety
level. An example of such a method is a check on erosion of the inner slope of the levee based
on several observations such as the angle of the slope and the quality of the grass. A check list
with scores is normally used.
If there is a clear relationship between a number of parameters and the performance of a levee
(for different failure modes), empirical models for failure modes can be set up in order to
evaluate the performance. Such a correlation leads to a relationship between
measurable/predictable parameters and the safety of the levee. An example of such a model is
Bligh’s model for backward erosion.
Physical and mathematical models for failure modes are detailed assessment tools. Then an
investigation of the critical situation, the so-called limit state, is a method of determining the
safety level of a levee solely based on physics. In this situation, the loading and the mobilized
strength is in equilibrium. This is the maximum load the levee can withstand. By dealing with
uncertainties, a probability of failure as a function of the water level can be deduced. Most
physical and mathematical models can be presented in a limit state equilibrium equation.
3.3.4 Combining data techniques
In every step of an assessment – from gathering data to reporting the assessment result – there
are sources of uncertainty. Uncertainties found in parameters are caused by imperfections and
omissions in the physical models and are the result of the fact that models are schematisations. At
every step of the safety assessment, information is left out because it did not fit the assessment
methodology. In order to decide on the strategy of combining data one should address the main
uncertainties, and then determine what data can help to reduce the uncertainty and finally look for
a technique that combines this data type with the existing model. With the increasing availability of
GIS data, more opportunities arise to use multiple sources of data in the assessment. Up to now,
this happens mainly through expert judgment. But several techniques exist to fully utilize all
available GIS data in a more reproducible way. Data can be combined at three points during the
steps of the analysis process. Each of these three points will be elaborated on in this section.
Point 1: Refining the input data.
Integration can be performed at the start of any analysis in order to have the correct input data or
to refine or improve the input data. The prediction model remains unchanged. Observations of the
levee behaviour or performance are combined with the results of the prediction model. Many
techniques already exist to perform calibration Of the input data The techniques vary from rather
straight forward averaging and least squares analysis to be applied in data-sparse areas, to more
complex time series analysis and Kalman filtering techniques applicable in data-rich areas.
Chapter 3: System Analysis – Flood Defence Reliability
FloodProBE Guidance 49
Point 2: Improving the (performance) model.
At a later stage in the assessment process, data can be combined to improve the precision of the
model through calibration or by incorporating additional effects. If the uncertainty due to the model
is relatively large compared to the uncertainty of the input parameters, updating the model is an
efficient way of improving the assessment.
The simplest updating method comprises standard mathematical techniques. A more advanced
method to upgrade the probability density function is by adding survived loads (high water labels in
the past) to the analysis. More advanced mathematical techniques comprise a group of methods
that rely on computational intelligence. Such methods can address complex problems to which the
previously mentioned methodologies and approaches are ineffective or infeasible because of the
complexity of the data. Another possibility in data rich areas is the use of an artificial neural
network (ANN) to simulate the behaviour of a system. ANNs are very efficient to simulate the
behaviour of a slow, complex mathematical model with few input parameters. If experts have
knowledge about processes, but are unable to quantify them mathematically, fuzzy logic can be a
tool to translate this knowledge to an assessment tool. E.g. knowledge like “clogging of a drain is a
small risk to the safety” can be combined with other such statements to construct a fuzzy system
that relates and quantifies the risks of a levee system.
Point 3: Adjusting the output.
In the final stage, one or several assessment results can be updated based on additional
information.
An assessment result can be adjusted based on information that has not been taken into account
in the parameters or model yet. Understanding the influence of data types like animal burrowing,
historic plan form data or visual inspection data on failure modes provides valuable information.
This understanding makes it possible to include information into the assessment that has not been
taken into account initially.
The combining and integration of data sources is complex and manifold. Within the FloodProBE
project several examples have been drawn up to illustrate and explain different data combining
techniques. Table 3.7 gives an overview of these examples which are elaborated further in the
FloodProBE deliverables (see Chapter 6). The first column names the example; the second
column shows the point (data, model or output) at which the data is combined. The third column is
the applied (mathematical) combining technique and the final column gives a short description of
the example and the data types.
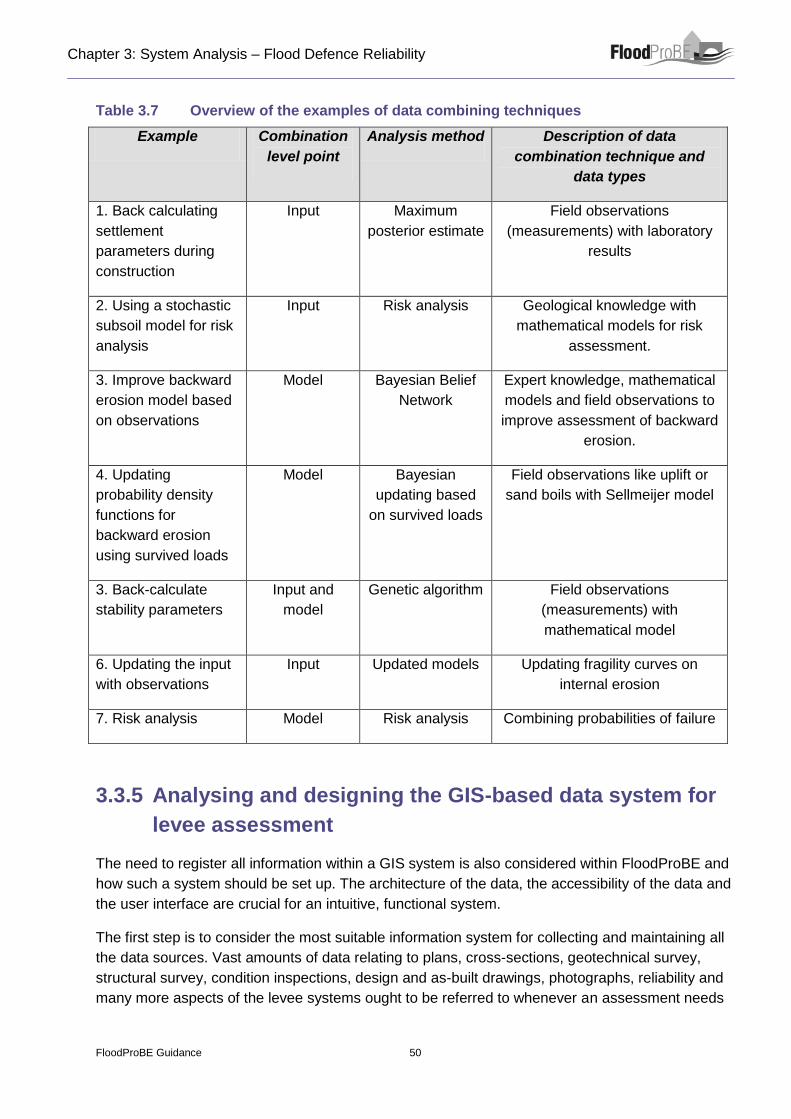
Chapter 3: System Analysis – Flood Defence Reliability
FloodProBE Guidance 50
Table 3.7 Overview of the examples of data combining techniques
Example Combination
level point
Analysis method Description of data
combination technique and
data types
1. Back calculating
settlement
parameters during
construction
Input Maximum
posterior estimate
Field observations
(measurements) with laboratory
results
2. Using a stochastic
subsoil model for risk
analysis
Input Risk analysis Geological knowledge with
mathematical models for risk
assessment.
3. Improve backward
erosion model based
on observations
Model Bayesian Belief
Network
Expert knowledge, mathematical
models and field observations to
improve assessment of backward
erosion.
4. Updating
probability density
functions for
backward erosion
using survived loads
Model Bayesian
updating based
on survived loads
Field observations like uplift or
sand boils with Sellmeijer model
3. Back-calculate
stability parameters
Input and
model
Genetic algorithm Field observations
(measurements) with
mathematical model
6. Updating the input
with observations
Input Updated models Updating fragility curves on
internal erosion
7. Risk analysis Model Risk analysis Combining probabilities of failure
3.3.5 Analysing and designing the GIS-based data system for
levee assessment
The need to register all information within a GIS system is also considered within FloodProBE and
how such a system should be set up. The architecture of the data, the accessibility of the data and
the user interface are crucial for an intuitive, functional system.
The first step is to consider the most suitable information system for collecting and maintaining all
the data sources. Vast amounts of data relating to plans, cross-sections, geotechnical survey,
structural survey, condition inspections, design and as-built drawings, photographs, reliability and
many more aspects of the levee systems ought to be referred to whenever an assessment needs

Chapter 3: System Analysis – Flood Defence Reliability
FloodProBE Guidance 51
to be made. In order to access these data efficiently, it is important to have a well organised data
acquisition and data storage system in place, which could combine both a classic paper based
system (e.g. for paper reports, plans), a digital computer file system (e.g. for CAD files, digital
pictures, digital aerial photographs) and a GIS-based digital platform. Since many of these data
are spatially related, there are clear advantages to such a system being accessible via a GIS
combined with a Data Base Management System (DBMS). Examples of existing GIS & DBMS’s
are the NFCDD in the UK Environment Agency, the IRIS in the Netherlands, the SIRS Digues in
France. One of the challenges is to design a conceptual data model which allows combining both
the representation of linear items (e.g. type of surface material of the landside part of the levee)
and point items (e.g. trees, animal burrows).
This GIS / DMBS system can be loosely or tightly coupled to specific levee assessment tools
based on some of the techniques presented in the previous section. In such a case, a GIS with an
underlying DBMS can serve as central data source for input to analysis software for levee
assessment. By automating this link, it is ensured that the most recent information is used in the
safety analysis. New visual observations from regular inspections can be used to tune the input
data, the model or the output data or a combination hereof.

Chapter 3: System Analysis – Flood Defence Reliability
FloodProBE Guidance 52
Chapter 4 System Analysis
– Vulnerability of Critical
Infrastructure

Chapter 4: System Analysis – Vulnerability of Critical Infrastructure
FloodProBE Guidance 54
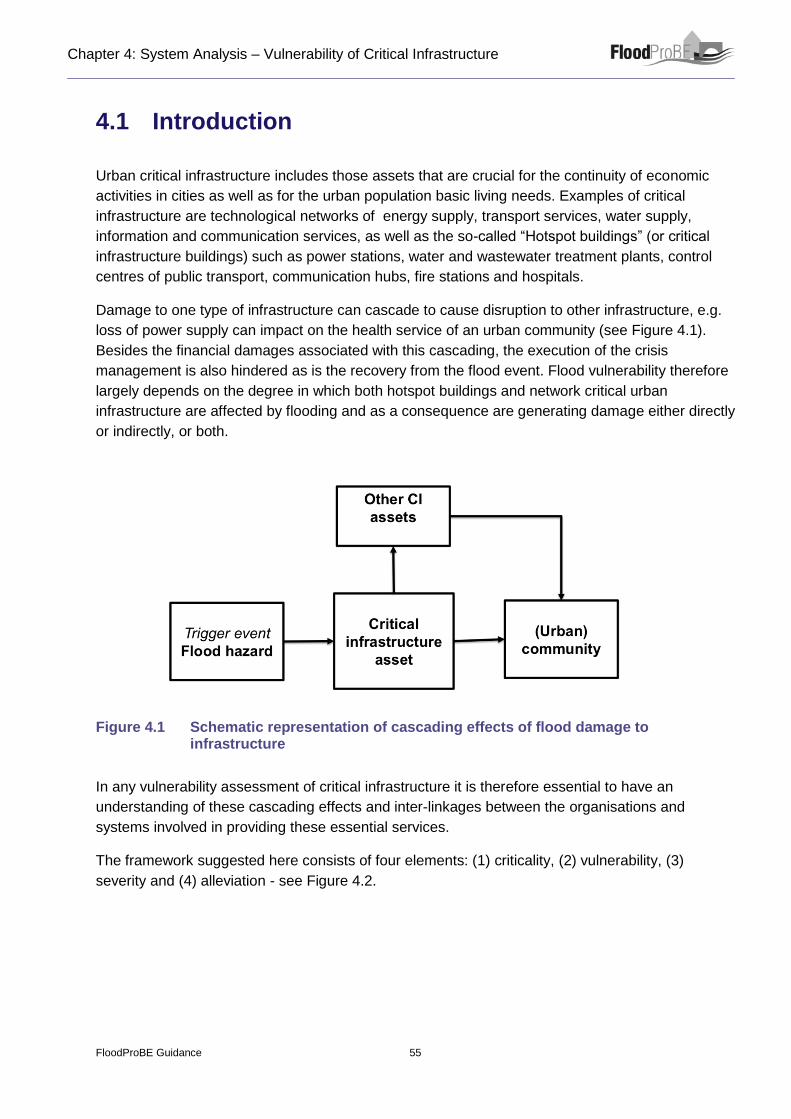
Chapter 4: System Analysis – Vulnerability of Critical Infrastructure
FloodProBE Guidance 55
4.1 Introduction
Urban critical infrastructure includes those assets that are crucial for the continuity of economic
activities in cities as well as for the urban population basic living needs. Examples of critical
infrastructure are technological networks of energy supply, transport services, water supply,
information and communication services, as well as the so-called “Hotspot buildings” (or critical
infrastructure buildings) such as power stations, water and wastewater treatment plants, control
centres of public transport, communication hubs, fire stations and hospitals.
Damage to one type of infrastructure can cascade to cause disruption to other infrastructure, e.g.
loss of power supply can impact on the health service of an urban community (see Figure 4.1).
Besides the financial damages associated with this cascading, the execution of the crisis
management is also hindered as is the recovery from the flood event. Flood vulnerability therefore
largely depends on the degree in which both hotspot buildings and network critical urban
infrastructure are affected by flooding and as a consequence are generating damage either directly
or indirectly, or both.
Figure 4.1 Schematic representation of cascading effects of flood damage to infrastructure
In any vulnerability assessment of critical infrastructure it is therefore essential to have an
understanding of these cascading effects and inter-linkages between the organisations and
systems involved in providing these essential services.
The framework suggested here consists of four elements: (1) criticality, (2) vulnerability, (3)
severity and (4) alleviation - see Figure 4.2.
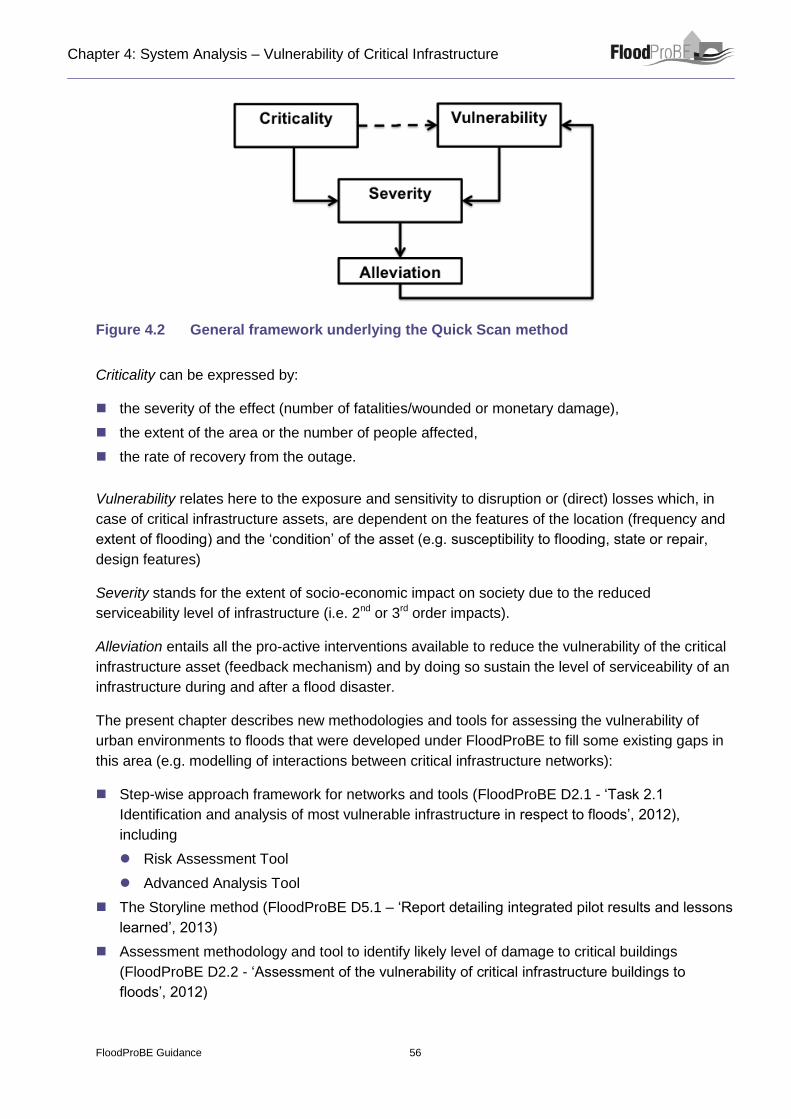
Chapter 4: System Analysis – Vulnerability of Critical Infrastructure
FloodProBE Guidance 56
Figure 4.2 General framework underlying the Quick Scan method
Criticality can be expressed by:
the severity of the effect (number of fatalities/wounded or monetary damage),
the extent of the area or the number of people affected,
the rate of recovery from the outage.
Vulnerability relates here to the exposure and sensitivity to disruption or (direct) losses which, in
case of critical infrastructure assets, are dependent on the features of the location (frequency and
extent of flooding) and the ‘condition’ of the asset (e.g. susceptibility to flooding, state or repair,
design features)
Severity stands for the extent of socio-economic impact on society due to the reduced
serviceability level of infrastructure (i.e. 2nd or 3rd order impacts).
Alleviation entails all the pro-active interventions available to reduce the vulnerability of the critical
infrastructure asset (feedback mechanism) and by doing so sustain the level of serviceability of an
infrastructure during and after a flood disaster.
The present chapter describes new methodologies and tools for assessing the vulnerability of
urban environments to floods that were developed under FloodProBE to fill some existing gaps in
this area (e.g. modelling of interactions between critical infrastructure networks):
Step-wise approach framework for networks and tools (FloodProBE D2.1 - ‘Task 2.1
Identification and analysis of most vulnerable infrastructure in respect to floods’, 2012),
including
Risk Assessment Tool
Advanced Analysis Tool
The Storyline method (FloodProBE D5.1 – ‘Report detailing integrated pilot results and lessons
learned’, 2013)
Assessment methodology and tool to identify likely level of damage to critical buildings
(FloodProBE D2.2 - ‘Assessment of the vulnerability of critical infrastructure buildings to
floods’, 2012)

Chapter 4: System Analysis – Vulnerability of Critical Infrastructure
FloodProBE Guidance 57
The ‘Quick Scan method’, a pragmatic assessment and ranking procedure of the
consequences of flooding which attempts to capture second and third order consequences.
4.2 Step-wise approach for networks and tools
To offer guidance for the flood vulnerability analysis of critical infrastructure networks, the
FloodProBE project developed a framework based on a stepwise approach, from a simple coarse
assessment to advanced modelling. This approach is oriented towards the stakeholders involved
in critical infrastructure and flood vulnerability in urban areas, be them public entities, private
consultants or researchers. Two tools were developed in strong collaboration with the pilot areas
Trondheim (Norway), Orleans (France) and Dordrecht (The Netherlands).
The methodology proposed consists of four steps that cover a spectrum of possible approaches
for the flood event. It goes from step 1 (a coarse overview) to step 4 (the most sophisticated
analysis) - Figure 4.3. In many situations not all steps are possible to undertake (or required) but in
the case where they are performed, the final result is a thorough insight into the critical
infrastructure present, and its vulnerability towards flooding of the area under assessment.
Figure 4.3 Framework for risk assessment
Note: FMEA - Failure Modes and Effects Analysis
Steps 2 and 4 are not covered by existing tools and were therefore developed within the frame of
FloodProBE to fill these gaps.

Chapter 4: System Analysis – Vulnerability of Critical Infrastructure
FloodProBE Guidance 58
4.2.1 The Risk Assessment tool for global understanding
Based on existing methodology and software tools for risk and vulnerability assessment in Norway
(covering various types of hazard) an Excel based tool for global risk assessment has been
developed focusing on the flood hazard. This tool which allows fulfilling step 2 in the framework for
risk assessment consists of a coarse analysis resulting in the generation of risk matrices (Figure
4.4). A risk matrix is produced for six different categories, which represent as many perspectives
for the calculation of the risks:
People
Environment
Infrastructure: water network, transportation, electricity, telecommunications.
These matrices are handy tools which support discussions and the decision process for the
stakeholders (municipalities, planners, flood professionals, etc). The main area of improvement for
the stakeholders can be defined by the sections "Some damage", "Serious" and "Critical". If the
risk calculated for the event is located in the red part "Catastrophic", it should be understood that
maybe even the most significant mitigating measures are not able to bring about a real
improvement. In this case, the focus may be preferably focused on the recovery from the extreme
event, or on reducing vulnerability.
Figure 4.4 Sample of risk matrix
The tool only requires basic knowledge of the area under investigation and can be performed by
users from different backgrounds. The method starts with expert interviews to identify undesired
events, their likelihood and the consequences in the case of an incident. These are discussed and
registered in a risk matrix. The analysis then provides a first risk picture on a coarse scale. In most
cases, more detailed standard risk analyses and model-based risk analyses have to follow. An
example of application is given for the case of Trondheim, Norway (see Box 4.1).

Chapter 4: System Analysis – Vulnerability of Critical Infrastructure
FloodProBE Guidance 59
BOX 4.1 – Application of Risk Assessment tool - for global understanding to the city
of Trondheim, Norway
The Trondheim Municipality is situated in central Norway beside the Trondheim Fjord, in
the county of Trøndelag. With around 170.000 inhabitants, Trondheim is the third biggest
city of Norway and is exposed to three different sources of flood risk:
Flooding from the river Nidelva
Flooding from the sea during storm events
Flooding of urban drainage systems - the sewer system consists of about 50% combined
system built before 1965, 40% separate system and 10% non-active separate system.
For a large number of possible flood events the risk has been evaluated and placed within
the matrices showing the vulnerability to People and to the Environment. The results are
presented in Figure 4.5. Each number represents one possible flood event. For example,
the event numbered 42 is in the red zone for risks on people, but only in the yellow zone
when it concerns the environment.
Figure 4.5 Output of the program
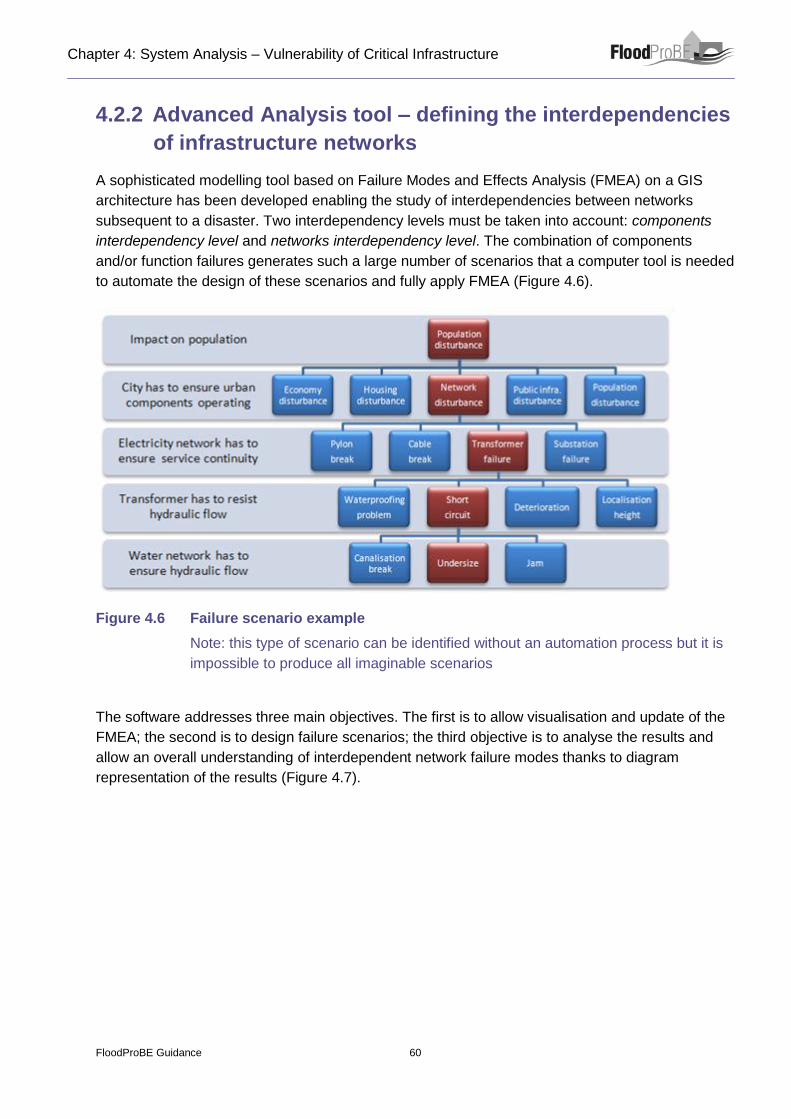
Chapter 4: System Analysis – Vulnerability of Critical Infrastructure
FloodProBE Guidance 60
4.2.2 Advanced Analysis tool – defining the interdependencies
of infrastructure networks
A sophisticated modelling tool based on Failure Modes and Effects Analysis (FMEA) on a GIS
architecture has been developed enabling the study of interdependencies between networks
subsequent to a disaster. Two interdependency levels must be taken into account: components
interdependency level and networks interdependency level. The combination of components
and/or function failures generates such a large number of scenarios that a computer tool is needed
to automate the design of these scenarios and fully apply FMEA (Figure 4.6).
Figure 4.6 Failure scenario example
Note: this type of scenario can be identified without an automation process but it is
impossible to produce all imaginable scenarios
The software addresses three main objectives. The first is to allow visualisation and update of the
FMEA; the second is to design failure scenarios; the third objective is to analyse the results and
allow an overall understanding of interdependent network failure modes thanks to diagram
representation of the results (Figure 4.7).

Chapter 4: System Analysis – Vulnerability of Critical Infrastructure
FloodProBE Guidance 61
Figure 4.7 Approach for studying network disruptions caused by floods accounting for
interdependencies between networks
An example of application of the tool is given in Figure 4.8 - as data on technical networks are
difficult to obtain especially at city level (due to commercial sensitivities), this example used
fictional data. The example involves three networks and demonstrates the importance of
considering interdependencies (in orange dashed lines). For instance, the electrical network does
not suffer direct damage (in red) and direct dysfunction (in pink) from flood hazard but it is
damaged by the sanitation network. As time goes on, the initial failures further generate new
dysfunctions (in orange) on sanitation and drinking water networks (by pumping station
dysfunctions).
Figure 4.8 Example of application of the tool for three types of network
Upper level is the drinking water network; middle is the electricity network; lower is
the sanitation network
It should be noted that most of the frequent disruptions are locally absorbed by the networks and
the end users remain unaware of their occurrence. This fact results from the ability of the networks
to redistribute the flow at the location of the disruption – to a certain extent. This is a typical
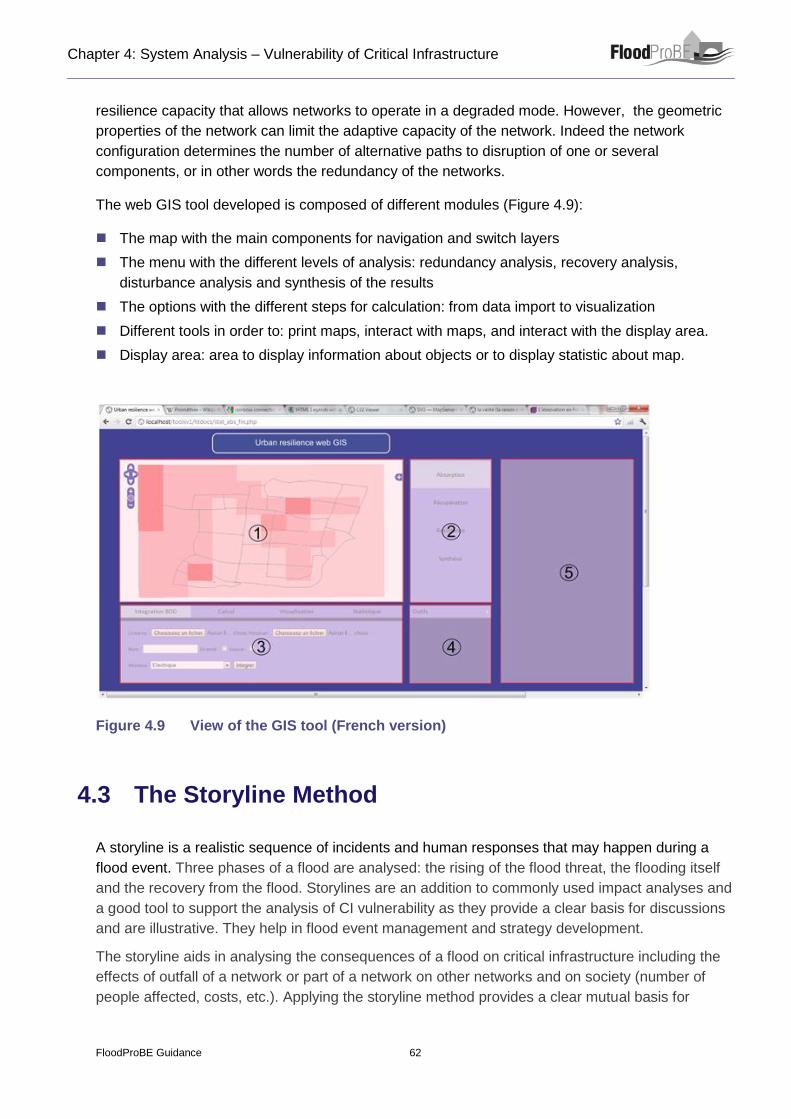
Chapter 4: System Analysis – Vulnerability of Critical Infrastructure
FloodProBE Guidance 62
resilience capacity that allows networks to operate in a degraded mode. However, the geometric
properties of the network can limit the adaptive capacity of the network. Indeed the network
configuration determines the number of alternative paths to disruption of one or several
components, or in other words the redundancy of the networks.
The web GIS tool developed is composed of different modules (Figure 4.9):
The map with the main components for navigation and switch layers
The menu with the different levels of analysis: redundancy analysis, recovery analysis,
disturbance analysis and synthesis of the results
The options with the different steps for calculation: from data import to visualization
Different tools in order to: print maps, interact with maps, and interact with the display area.
Display area: area to display information about objects or to display statistic about map.
Figure 4.9 View of the GIS tool (French version)
4.3 The Storyline Method
A storyline is a realistic sequence of incidents and human responses that may happen during a
flood event. Three phases of a flood are analysed: the rising of the flood threat, the flooding itself
and the recovery from the flood. Storylines are an addition to commonly used impact analyses and
a good tool to support the analysis of CI vulnerability as they provide a clear basis for discussions
and are illustrative. They help in flood event management and strategy development.
The storyline aids in analysing the consequences of a flood on critical infrastructure including the
effects of outfall of a network or part of a network on other networks and on society (number of
people affected, costs, etc.). Applying the storyline method provides a clear mutual basis for

Chapter 4: System Analysis – Vulnerability of Critical Infrastructure
FloodProBE Guidance 63
discussion on what may happen and what could be done. It shows interdependencies and
complexities between the water system, critical infrastructure and actors; it allows analysis of CI in
relation to flood event management, recovery and measures and provides insight on which
assumptions are relevant and into knowledge gaps. Storylines can also be developed for a
situation with interventions in place, providing insight into the effect of the selected interventions.
A storyline is developed through the following steps:
1. Setting up a framework to comprise all information that can contribute to the sequence of
incidents and human responses during a flood. The components of this framework are based
on the Source-Pathway-Receptor-Consequence S-P-R-C approach. Information is gained from
literature, studies on the area and talking with experts on the subject and the area.
2. Based on this knowledge, the elements that need to be incorporated to form a realistic
storyline are selected. Furthermore, the flooding scenarios that are most relevant to describe in
a storyline are determined. Once these elements are determined, the methods and information
needed to develop and analyse storylines with different realistic options are described.
3. The resulting storylines are analysed. The number of fatalities, the damage, the number of
people affected and the number of evacuees are determined. These results are then used to
compare different measures that may be taken at all layers/levels of the Multi Level Safety
approach and to develop new strategies.
It should be understood though that applying a storyline method does require time and a sufficient
set of data. The method cannot be used to compare areas and is not very suitable to use for larger
areas. Storylines must be realistic, but no precise probability can be assigned to them.
An example of application is given in Box 4.2.
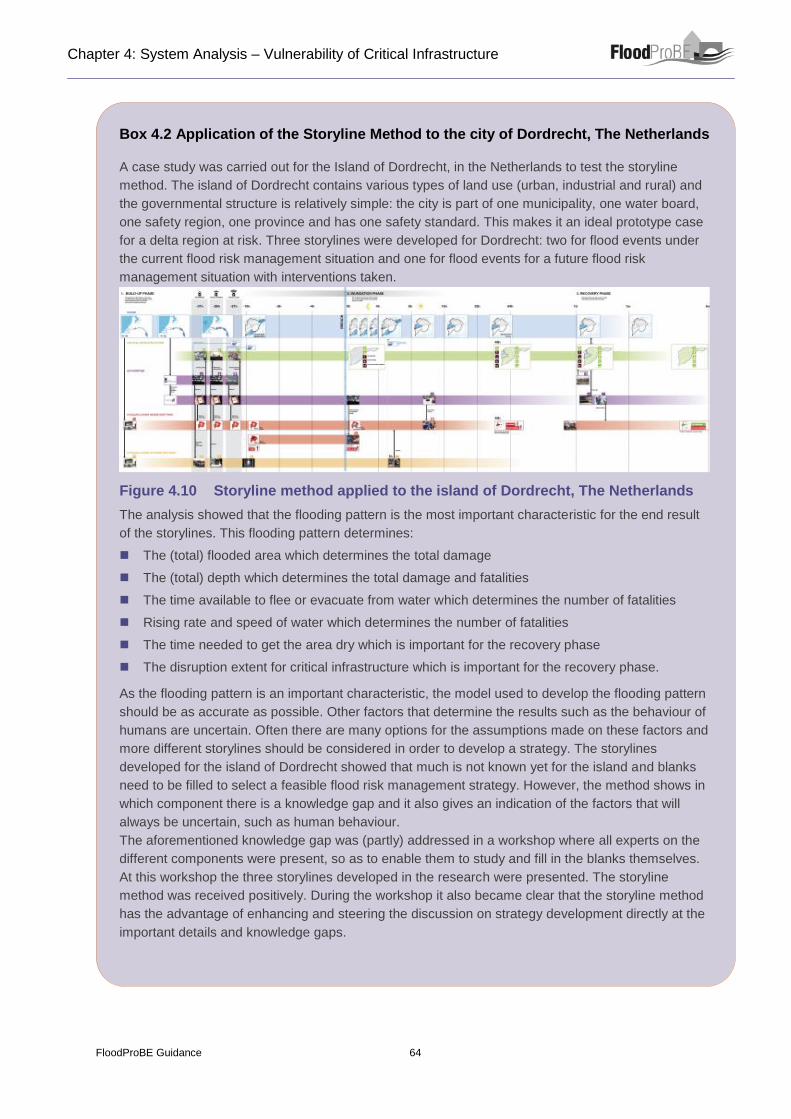
Chapter 4: System Analysis – Vulnerability of Critical Infrastructure
FloodProBE Guidance 64
Box 4.2 Application of the Storyline Method to the city of Dordrecht, The Netherlands
A case study was carried out for the Island of Dordrecht, in the Netherlands to test the storyline
method. The island of Dordrecht contains various types of land use (urban, industrial and rural) and
the governmental structure is relatively simple: the city is part of one municipality, one water board,
one safety region, one province and has one safety standard. This makes it an ideal prototype case
for a delta region at risk. Three storylines were developed for Dordrecht: two for flood events under
the current flood risk management situation and one for flood events for a future flood risk
management situation with interventions taken.
Figure 4.10 Storyline method applied to the island of Dordrecht, The Netherlands
The analysis showed that the flooding pattern is the most important characteristic for the end result
of the storylines. This flooding pattern determines:
The (total) flooded area which determines the total damage
The (total) depth which determines the total damage and fatalities
The time available to flee or evacuate from water which determines the number of fatalities
Rising rate and speed of water which determines the number of fatalities
The time needed to get the area dry which is important for the recovery phase
The disruption extent for critical infrastructure which is important for the recovery phase.
As the flooding pattern is an important characteristic, the model used to develop the flooding pattern
should be as accurate as possible. Other factors that determine the results such as the behaviour of
humans are uncertain. Often there are many options for the assumptions made on these factors and
more different storylines should be considered in order to develop a strategy. The storylines
developed for the island of Dordrecht showed that much is not known yet for the island and blanks
need to be filled to select a feasible flood risk management strategy. However, the method shows in
which component there is a knowledge gap and it also gives an indication of the factors that will
always be uncertain, such as human behaviour.
The aforementioned knowledge gap was (partly) addressed in a workshop where all experts on the
different components were present, so as to enable them to study and fill in the blanks themselves.
At this workshop the three storylines developed in the research were presented. The storyline
method was received positively. During the workshop it also became clear that the storyline method
has the advantage of enhancing and steering the discussion on strategy development directly at the
important details and knowledge gaps.

Chapter 4: System Analysis – Vulnerability of Critical Infrastructure
FloodProBE Guidance 65
4.4 Assessment methodology and tool to identify likely
level of damage to critical buildings
Critical infrastructure includes not only the physical networks of cables, pipes and roads, but also
the organisational networks of health, security and emergency services. Buildings play an
important role in protecting the equipment and personnel related to these networks (e.g. hospitals,
fire stations, communications centres, power stations, etc.). However, the variety of designs and
constructions of these buildings make it unrealistic to categorise them into meaningful types when
considering their vulnerability to flooding. In order to be able to predict the effects of flooding and
costs of reinstatement of these buildings, an individual approach needs to be taken, taking into
account the specific characteristics of each building.
At present there is no reliable way of anticipating and estimating post flood remedial works to
buildings at an individual scale. This is problematic in that plans need to be developed in advance
of flooding to ensure expeditious rehabilitation of buildings. The need for such plans is particularly
relevant for critical infrastructure buildings. In the majority of cases, the production of a site-specific
remediation plan only occurs following a major flood event.
Therefore, an assessment methodology that identifies the likely level of damage to individual
buildings in the case of flooding was developed, the results being expressed as the predicted costs
of remedial works. The assessment methodology distinguishes between buildings built using
different constructions and materials and is relevant to critical as well as non-critical buildings. A
damage prediction tool was developed based on the methodology. This damage prediction tool
facilitates:
Forward planning of rehabilitation responses
Identification of key risks in order that buildings can be retrofitted to improve their robustness
against flooding
Target investment for reducing future vulnerability
Better land-use planning for new build and re-development of brown field sites.
The tool is designed for use by people with sufficient technical knowledge of the planning and
construction of buildings in question, such as surveyors, architects and other building designers,
quantity surveyors and property managers. The purpose of the tool is to enable building
professionals who have no specialist knowledge of the effects of flooding on buildings to predict
the cost of flood damage to individual buildings depending on the nature of the flood event and the
individual constructional characteristics of a particular building. This will enable them to foresee the
likely consequences of flooding and to make a cost/benefit analysis of different measures that
could be undertaken to protect the building from these consequences. The tool is designed to be
used by building professionals throughout Europe. Although the cost data is based on UK prices in
2012, there are conversion factors built in to the tool to make adjustments for the different building
costs in the EU countries. The prices and the conversion factors would have to be updated
regularly to reflect changes in these over time.

Chapter 4: System Analysis – Vulnerability of Critical Infrastructure
FloodProBE Guidance 66
This tool is a simple-to-use system that encompasses the elements of individual buildings likely to
be affected by flood water, namely the basement and foundations, the external walls, the ground
floor, the internal partitions including the internal doors and joinery, the external doors and
windows, as well as the associated services such as electrics, plumbing and ventilation.
The tool calculates the actual cost of flood damage to individual building elements according to
their construction and materials, the types of services and the nature of the flooding. The initial
output, based on the database contained within the tool, predicts the cost of cleaning, repair or
replacement and is expressed as a percentage of the new-build cost of each element. Additional
percentages are added for pollution clean-up and sterilization and mechanically assisted drying.
An adjustment for regional factors (i.e. different countries) can then be made. An approximate
indication of the actual cost of returning the building to use, depending on where it is and when the
flooding occurs, can then be produced by the tool when it is combined with calculations using the
areas, lengths or numbers of affected elements, the current or predicted rates of construction
prices. It should be noted that the way in which the flood depth is taken into account with regard to
repairs of building elements depends to a large extent on the different approaches in each country
and on different individual practices within a country. For this reason the tool is flexible enough to
allow tailoring to the practices in each country.
A simple diagram of the principles of the tool is presented in Figure 4.11.
Figure 4.11 Building damage estimation tool principles
The basic data required to be input into the tool by the user are:
The flood characteristics of the event that is predicted
Floodwater depth
Flow velocity and debris
Contaminant content
Flood duration
Identification of the main structural system
Chapter 4: System Analysis – Vulnerability of Critical Infrastructure
FloodProBE Guidance 67
The building divided by elements (external walls, floors, internal partitions, windows and doors,
electrics, mechanical services, communications etc.). Each element is analysed according to
the materials used and the layering of them. To simplify the range of options, a list of typical
constructions has been devised from which a choice can be made.
Dimensions of walls, floors etc. and numbers of doors and windows that are affected by the
selected flooding event.
Types of services, their positions and layout and the extent of these that are affected by the
selected flooding event.
The basic data that are contained in the tool are:
A database of common elements of different constructions and materials
A database of effects of flood damage to each construction and the % new build cost incurred
by clearing up costs, repair/replacement of the affected area of the construction, assuming
clean water
An additional cost to add for mechanically assisted drying
An additional percentage calculated to add for pollution of different types, i.e. hazardous and
non-hazardous
An additional percentage calculated to account for the effects of high velocity and debris
An additional percentage calculated to account for the duration of the flood
A database of effects of flood damage to each of the different services
An adjustment factor calculated for regional differences (i.e. different countries).
Before calculating the damage to the building, it is worth checking that the building is not prone to
collapse due to the flooding, as this will make the damage calculations superfluous. The likelihood
of collapse can be determined either by calculation or by depth/collapse curves (curves are
available for wood, metal and masonry constructions for single and multi-storey buildings).
This tool can be used to compare the implications of flooding for different types of building
construction, and to assess the value/cost of installing flood protection installations to the building
to reduce the damage from future flooding. Various solutions using dry proofing and wet proofing
techniques (see Chapter 5) can be explored and run through the tool to gauge their cost
effectiveness. Of course, decisions on protecting the building against floods will also be affected by
the function and contents of the building – in some cases the fabric of the building and its
protection might only be a relatively small economic consideration. The tool does not calculate the
damage to contents and secondary costs associated with these.
Validation of the tool was carried out using three case studies in order to gauge the accuracy of
the predictions made by the tool. These were selected from data supplied by AXA insurance on
three premises that were flooded in 2007 in the Sheffield area of the UK.
The tool as presented here should be regarded as a demonstration of the methodology for
calculation of flood damage costs based on flood characteristics, detailed constructional
Chapter 4: System Analysis – Vulnerability of Critical Infrastructure
FloodProBE Guidance 68
information and associated damage factors. It will provide a springboard for the development of a
fully functional tool that can be used for buildings of all types throughout Europe.
The flood damage estimation tool relies on a range of expert assessments of the scale of damage
and costs of repair/replacement of a wide range of building constructions. These assessments can
be made more robust by repeated testing against real situations, both in the laboratory and in real
life as experienced in past flood events. In order to do this, much more specific information of flood
events is required, including detailed data about the effects of different flood characteristics on
different building constructions and materials, and itemised costs of necessary repair/replacement
works. It has proved difficult to gain this level of detail during this research, partly due to issues of
confidentiality, to lack of detailed records of past events, and division of responsibilities during and
after the event.
The range of different constructions and materials presented by the prototype tool is still limited
compared with what is available and used throughout Europe. In order for the tool to be widely
applicable, a far greater choice of these should be offered in the menus. To provide this requires a
major exercise in cataloguing and assessing typical construction methods and materials in the
various countries.
4.5 The ‘Quick Scan’ method
The objective of the Quick Scan is (i) to assist operators and decision makers to identify, rate, and
protect their (existing) critical infrastructure assets servicing urban communities, which may be at
most risk from flooding and (ii) to support them in developing effective interventions to alleviate the
damage to these assets which are relatively easily achievable and most cost beneficial (i.e. ‘low
hanging fruit’).
The Quick Scan is concerned with urban infrastructure networks including the essential nodes or
high value assets (referred to as “hotspot buildings”) of these networks. Both are critical for the
continuity of economic activities in cities as well as for the urban population’s basic living needs.
Examples of critical infrastructure are technological networks of energy supply, transport services,
water supply, information and communication services. Hotspot buildings within these networks
include power stations, water treatment plants, control centres of public transport, communication
hubs, waste water treatment plants, fire fighting stations and hospitals.
The Quick Scan method aims to provide a pragmatic and rapid assessment and ranking
procedure taking specifically into account rough estimates of the consequences and damages; the
method attempts to capture indirect (second and third order) consequences. It complements the
Storyline method in the sense that the Quick Scan also includes indicative estimates of the cost
and time required for implemenation of the options with the highest severity rating. It is important
to note that the point of departure of the Quick Scan is the urban community (defined here as a
neighbourhood or city district with a clear cut boundary based on density, age composition of the
buildings, geographic location, or socio-economic status). This implies that the focus of the
assessment is on ‘upstream’ rather than on ‘downstream’ dependencies (in other words: the focus
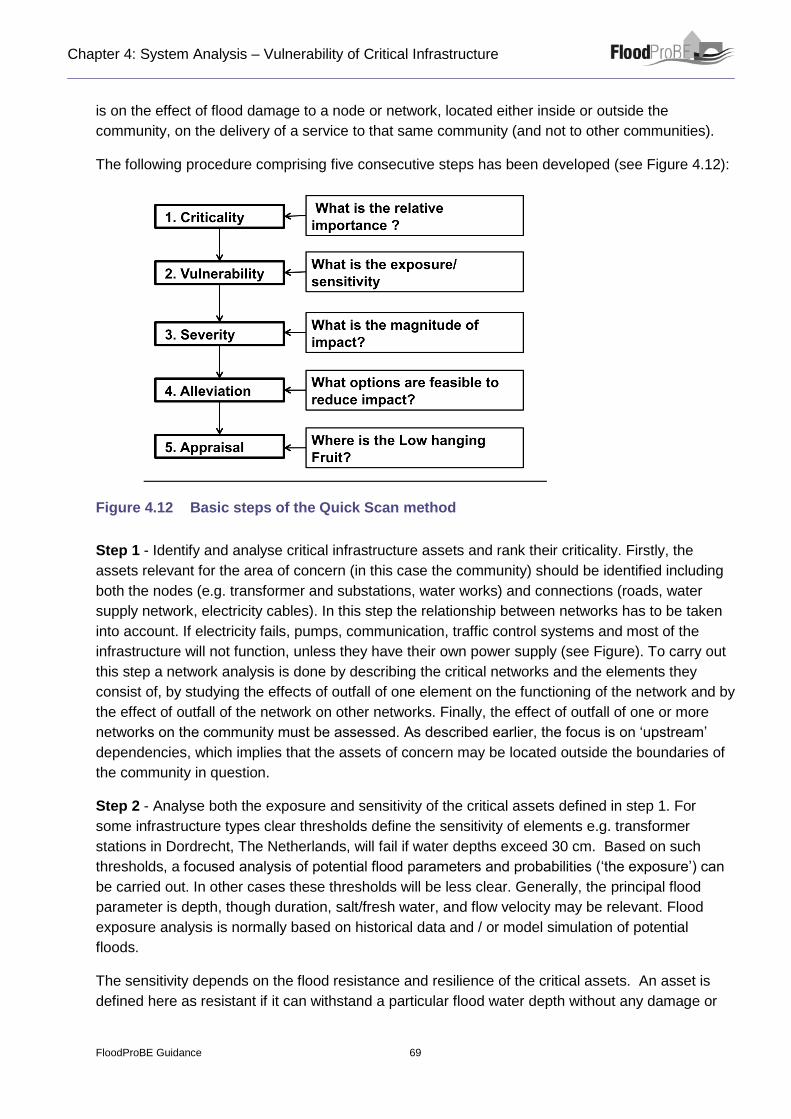
Chapter 4: System Analysis – Vulnerability of Critical Infrastructure
FloodProBE Guidance 69
is on the effect of flood damage to a node or network, located either inside or outside the
community, on the delivery of a service to that same community (and not to other communities).
The following procedure comprising five consecutive steps has been developed (see Figure 4.12):
Figure 4.12 Basic steps of the Quick Scan method
Step 1 - Identify and analyse critical infrastructure assets and rank their criticality. Firstly, the
assets relevant for the area of concern (in this case the community) should be identified including
both the nodes (e.g. transformer and substations, water works) and connections (roads, water
supply network, electricity cables). In this step the relationship between networks has to be taken
into account. If electricity fails, pumps, communication, traffic control systems and most of the
infrastructure will not function, unless they have their own power supply (see Figure). To carry out
this step a network analysis is done by describing the critical networks and the elements they
consist of, by studying the effects of outfall of one element on the functioning of the network and by
the effect of outfall of the network on other networks. Finally, the effect of outfall of one or more
networks on the community must be assessed. As described earlier, the focus is on ‘upstream’
dependencies, which implies that the assets of concern may be located outside the boundaries of
the community in question.
Step 2 - Analyse both the exposure and sensitivity of the critical assets defined in step 1. For
some infrastructure types clear thresholds define the sensitivity of elements e.g. transformer
stations in Dordrecht, The Netherlands, will fail if water depths exceed 30 cm. Based on such
thresholds, a focused analysis of potential flood parameters and probabilities (‘the exposure’) can
be carried out. In other cases these thresholds will be less clear. Generally, the principal flood
parameter is depth, though duration, salt/fresh water, and flow velocity may be relevant. Flood
exposure analysis is normally based on historical data and / or model simulation of potential
floods.
The sensitivity depends on the flood resistance and resilience of the critical assets. An asset is
defined here as resistant if it can withstand a particular flood water depth without any damage or
Chapter 4: System Analysis – Vulnerability of Critical Infrastructure
FloodProBE Guidance 70
failure. An asset is resilient if, when it comes into contact with floodwater during floods, no
permanent damage is caused, structural integrity is maintained and, if operational disruption does
occur, normal operation can resume rapidly after the flood has receded. Vulnerability can be
expressed in monetary terms or be based upon indicators such as the duration of outage, the
number of people affected and combinations of those.
Step 3 - Based on the results of step 1 (criticality) and 2 (vulnerability) the severity can be
assessed taking into account (i) the effect of failure of the assets (nodes and connections) on the
delivery of service (first order), (ii) the effect of failure of a (part of one) network or node on other
networks (2nd and 3rd order affects such as electricity outage which may impact the functioning of
communication and traffic control systems) and (iii) the likelihood of failure (flood exposure and
sensitivity).
Step 4 - The aim of this step is to identify the options available to alleviate the effects of flooding
on the functioning of the critical infrastructure and at what cost. The options comprise flood
proofing (resilient and resistant) construction and retrofitting techniques ranging from simple
interventions such as temporary closures to permanent elevation. Much information which is
available for traditional buildings is also applicable to critical infrastructure assets, albeit that the
underlying CBA (Cost Benefit Analysis) may require a different approach. It is also possible to
alleviate impacts from failure by reducing the criticality of the sensitive elements e.g. by making
the network more redundant in order to make sure that if one node fails, the network will still
function.
Step 5 - The final step comprises the appraisal phase in which the so called “Low Hanging Fruit”
will be identified. Based on the severity ranking (where are the highest impacts?) of step 3 on the
one hand and the identification of the options and cost to alleviate these impacts of step 4 to the
other, the actions that can be undertaken at (relatively) low cost and with high impact as part of a
wider range of interventions to further protect the urban critical infrastructure can be identified.

Chapter 5 Design and
Engineering

Chapter 5: Design and Engineering
FloodProBE Guidance 72
Chapter 5: Design and Engineering
FloodProBE Guidance 73
5.1 Introduction
A wide range of engineering options is available to flood risk professionals to help manage flood
risk in the urban environment. For the purpose of providing guidance, it is helpful to distinguish
between flood defences, critical networks and critical buildings, although these are obviously
interlinked and the individual categories should be considered as part of a holistic approach to
flood management.
The present chapter describes new methodologies and tools to minimise the impact of floods that
were developed under FloodProBE to fill some existing gaps in this area:
“BioGrout”, a technique to strengthen flood defences (FloodProBE D4.1 – ‘Report on bio-
technological strengthening on flood embankments, including the applicability based on
experiments, and concepts close to industrial application’, 2013)
Concepts for Multifunctional Flood Defences (FloodProBE D4.2 - ‘Design concepts of
Multifunctional Flood Defence Structures’, 2013)
Innovative road and bridge technologies (FloodProBE D4.3c – ‘Construction and Technologies
for flood-proofing Buildings and Infrastructures; Concepts and Technologies for flood-proof
Road Infrastructure’, 2013)
Hotspot Buildings (FloodProBE D4.3 ‘Construction Technologies for flood proof buildings and
infrastructures; Technologies for flood-proofing hotspot buildings, 2012; FloodProBE D4.4
‘Building resilience measures; outline design guidance and roadmap for accelerated
acceptance’, 2013).
5.2 Flood defences
A number of options are available to improve the quality and/or take advantage of existing flood
defences (also termed embankments, dikes, levees in different countries) or to design new
structures. Some innovative options developed under FloodProBE are presented in the following
sections as examples to be considered within the portfolio of options.
5.2.1 Strengthening of earth flood defences
For urban flood defences internal erosion, involving the removal of sand is an important potential
type of failure that eventually leads to inundation of the areas protected. Internal erosion occurs
when groundwater velocity, driven by a hydraulic head difference over the water defence during a
flood or storm surge, exceeds a critical value. In case internal erosion below a point structure is
suspected to threaten the stability of the structure, costly measures are usually undertaken: leak
detection monitoring techniques (e.g. tracer, temperature or self-potential methods) or traditional
measures for mitigating (potential) internal erosion problems, such as reduction of the groundwater
flow velocity by means of installation of sheet piles or (local) grout injection. However, as well as
costly these can be undesirable in cases where flood defences have historical value.

Chapter 5: Design and Engineering
FloodProBE Guidance 74
BioGrout is an innovative technology for in situ strengthening of unconsolidated sediments using
bacteria. This technique enables sustainable improvement of sandy soils by building calcium
carbonate bridges between the sand grains through microbial processes (Figure 5.1).
Figure 5.1 Sand grains treated with BioGrout
Contrary to (traditional) grout injection methods, BioGrout can be applied without significant
reduction of the permeability of the sand. This technique is still in development stage but
laboratory experiments have demonstrated its feasibility with regard to prevention of backward
erosion in flood defences. By applying BioGrout the critical head is increased several times,
sufficient to withstand high water in rivers and rise in sea level (Figure 5.2). BioGrout has the
following advantages compared to conventional techniques:
Applied in situ, without soil displacement or influencing surrounding constructions
Large injection distance, at least 5 m between injection and extraction wells
Fast process: within 5-10 days, sufficient strength is obtained
Strength and stiffness are adjustable between 0.2 MPa and 50 MPa
Permeability is more or less maintained up to 10 MPa, hardly influencing the (ground) water
flow
Light application material, making it usable at locations with difficult access
Only calcite, a natural mineral, is left in the soil.

Chapter 5: Design and Engineering
FloodProBE Guidance 75
Figure 5.2 Cementing gravel for the horizontal drilling pilot near Nijmegen, 2010
The costs to apply BioGrout are substantial, making it a high grade technology. Also the
production of ammonium chloride means that only limited volumes of BioGrout can be produced.
This technique is recommended at locations where other techniques cannot offer a solution, as
can be the case of multifunctional flood defences (see Section 5.2.2).
5.2.2 Multifunctional flood defences
The search for multi-functionality in flood defences has been gaining relevance by the long-term
trends of urbanisation and climate change. These two factors will have a large influence on (urban)
flood defences as well as on the spatial quality of cities and landscapes, which will need to be
adjusted in the next decades.
Multifunctional Flood Defences (MFD) is a newly developed concept to optimise allocation of urban
space rather than constructing stand-alone dikes. MFD are flood defences that combine the
function of flood protection with other functions such as provision of housing, recreation and
leisure, commercial buildings, ecology, mobility and transport, underground infrastructure. The
biggest advantage of multi-functionality is that it can generate financial, social and environmental
benefits.
The main difference between traditional flood defences and MFD is that instead of modifying the
surrounding area for a traditional flood defence, the MFD are modified for the surrounding area.
Functions in the surrounding area do not disappear; rather they remain or are enhanced.
Decisions in the area of policy and governance (cooperation), regulation and land development
(real estate) often dictate whether or not a particular type of MFD is possible and which of the
various alternatives may be feasible. Involving local stakeholders is an important contribution to
this. Therefore in the design process it is essential to take into account the needs and
requirements of current and future stakeholders, such as the local population, municipality and the
relevant environmental/water authorities. Equally important is that the exchange of information
takes place in a transparent way. These issues relate to the policy, system analysis and setting of
objectives stages.
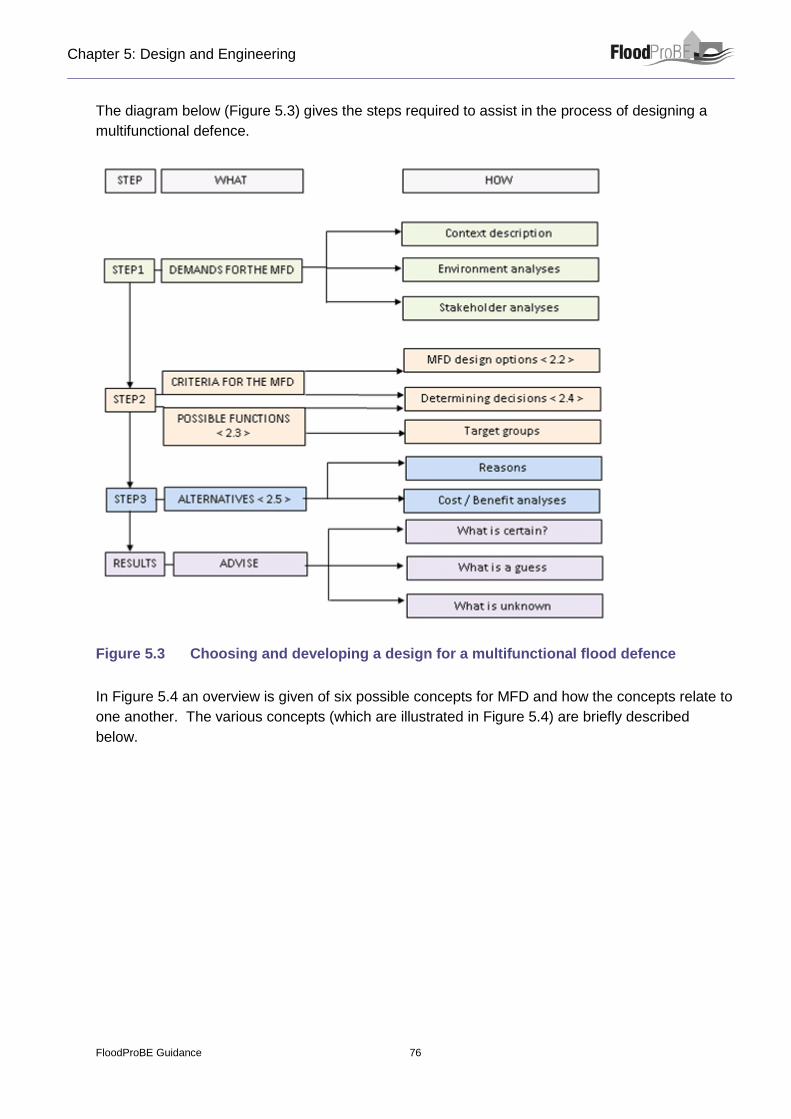
Chapter 5: Design and Engineering
FloodProBE Guidance 76
The diagram below (Figure 5.3) gives the steps required to assist in the process of designing a
multifunctional defence.
Figure 5.3 Choosing and developing a design for a multifunctional flood defence
In Figure 5.4 an overview is given of six possible concepts for MFD and how the concepts relate to
one another. The various concepts (which are illustrated in Figure 5.4) are briefly described
below.
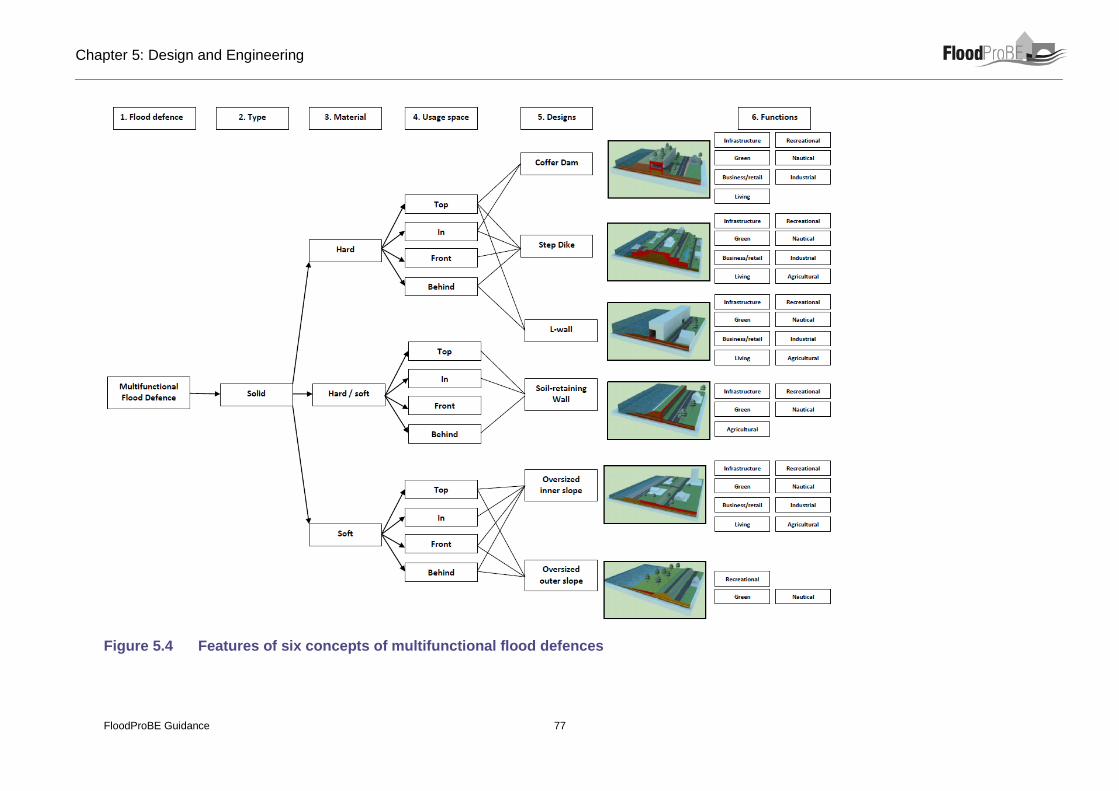
Chapter 5: Design and Engineering
FloodProBE Guidance 77
Figure 5.4 Features of six concepts of multifunctional flood defences

Chapter 5: Design and Engineering
FloodProBE Guidance 78
Coffer dam
The coffer dam is a concept that can either be a freestanding construction or combined with a
traditional dike body. When building this construction, two deep steel walls are placed at least 7 m
apart from each other. The space between these deep walls can either be filled with soil or used
as a tunnel, parking garage, etc. The top of the coffer dam can be used for several functions such
as a boulevard/promenade or park.
Step Dike
The Step Dike is a concept that can be combined with a traditional dike body where this serves as
the base. This concept can use space efficiently as there are a number of horizontal flat surfaces
that can be used for several functions and is constructed as follows. Deep walls are placed
alongside a traditional dike body, all walls go equally deep into the ground but differ in length
above ground. If necessary, the step dike can be constructed much wider and higher than
required, making it safer. The spaces between the deep walls are filled with soil, creating the
characteristic steps.
L-wall
The L-wall is a freestanding concept that does not need a traditional dike body. It is a concrete
construction with horizontal and vertical parts equal in length, giving it the characteristic L shape.
Additional functions can be place behind this wall. An important consideration is that the walls
must always be kept accessible for inspections. The L-wall can also be constructed in such a way
that a tunnel can be built below ground, with additional functions on top. When the horizontal part
is constructed deep enough into the ground, it can also help prevent piping thus reducing the
chance of the construction failing. Because it is a hard construction that directly stands in contact
with the water, waves react more intensively to the presence of the wall; this is in contrast with
traditional dike bodies which have slopes that attenuate the energy of the water and also the
waves.
Soil Retaining Wall
This is a concept that can be combined with a traditional dike body. The construction can be
applied either behind the dike or in front of it. When placed behind the dike, it creates space for
additional functions. To build this construction the traditional dike body has to be excavated until
only a half (in plan) remains. The remaining part of the dike body is kept in place by a steel or
concrete wall, allowing time and space to create a soil retaining wall. This construction does not
only demand certain height requirements, but the excavated dike body has to be at least 3 m wide
at the top.
Oversized Inner Slope
Over sizing the inner or outer slope of a dike are concepts that have to be combined with a
traditional dike body. When constructing, both concepts need considerable space but when built
they create a lot of space and are believed to be unbreakable. When the inner side of the slope is
over dimensioned, all potential functions can be applied. Land is simply raised. The greatest
limitation of over dimensioning the inner slope is that all existing functions have to be removed.

Chapter 5: Design and Engineering
FloodProBE Guidance 79
This is a major undertaking and will also incur a large financial cost. The inner or outer slope of an
existing dike body is extended by adding soil to the slope, giving the slope a very shallow angle.
Because of the shallow angle, waves have less influence on the dike body and the height can be
decreased which is positive for the visual aspect of the surrounding area. A slope angle of 1:6 is
only suitable for green functions or infrastructure. When the slope is flatter than 1:9 buildings can
be constructed on the slopes.
Oversized Outer Slope
Over sizing the outer slope of the existing dike makes the front of the dike higher and longer, and
practically unbreakable. For example trees can be planted resulting in a 'park dike'. Vegetation or
other functions on the outer slope of the dike will have a wave-breaking effect. This concept may
negatively impact on the width of watercourses as their width is reduced. Over sizing the front
slope does not allow many functions, as tides and currents affect this. Only recreational and green
functions can be applied, such as parks and aquatic nature. If applied correctly, these functions
can stop or slow down the height and speed of waves making it possible to lower the crest of the
dike body. Buildings can be constructed on the front of the dike although these have to be floating.
Figure 5.5 shows an example of a matrix that brings the various types of concept and possible
functions together, helping the selection process. This matrix provides indication of the most
appropriate location of a particular function in relation to the dike (top T, front F, behind B, in I) for
each design. The matrix shown in Figure 5.5 was developed for a rural location; in this case not
every function fits into the MFD as it would for an urban location. For this MFD if the focus is on
functions like green and recreation (see below) the MFD is better connected with the environment.
The ‘Over sized inner slope’ appears the most obvious choice for adding green functions. The
‘Cofferdam’ or the ‘Step dike’ are unable to easily add any recreational functions at the flood
defence.

Chapter 5: Design and Engineering
FloodProBE Guidance 80
Figure 5.5 Example of catalogue of MFD options
Note: MFD is Multifunctional Flood Defences
The additional functions in a flood defence have an impact on engineering, economics, society and
the environment. The potential integration of a specific function also affects the design of the flood
defence. For example, a green function, such as a park, will result in a different dike profile than
the integration of parking garages. Choosing a particular function has impacts in terms of
economics. This has to do with the distinction between public and private functions. Certain
functions, like infrastructure, can potentially be funded from public funds, whereas other functions,
like businesses, can be financially more interesting from a commercial perspective. The available
financial resources from the public and private domains are often limited and decisions must be
taken to use these in the best way. It is, therefore, important that all costs and benefits of the
Chapter 5: Design and Engineering
FloodProBE Guidance 81
interventions for water safety and other functions are included in an integrated assessment. A Cost
Benefit Analysis (CBA) method has been developed that can be used for the analysis of the
possible alternatives for MFDs. The CBA method is a dynamic process in which it might often be
needed to return to previous steps during the design process, so the sequences of the steps are
not necessarily linear. Furthermore, a CBA is able to provide both a quantitative and qualitative
comparison of the possible alternatives.
Once an MFD is constructed, the Monitoring & Adaptation stage is based primarily on the
procedures/measures for flood defences (see Chapter 3), complemented by necessary actions
related to the functions included in the structure (e.g. buildings, recreational).
The most significant advantage of multi-functionality is that it can generate financial, social and
environmental benefits. In contrast with MFDs, traditional dike strengthening only generates
financial costs with non-monetary benefits (i.e., increased flood safety / reduced flood risk). By
designing MFDs, the costs for dike strengthening can in some cases be partially funded with the
revenues from the secondary functions.
5.3 Critical networks - Innovative road and bridge
technologies
This section addresses a range of innovative technologies related to critical nodes and networks.
These technologies are installed just before or during a flood event with the objective to sustain
functioning of the critical node or network and will be removed completely when water levels have
receded. These technologies comprise floating road infrastructure and bridges, light weight
bridges, floating storage facilities and emergency bases. At present there is very limited practical
experience in the use of these technologies and specific guidance on their application is lacking.
Road infrastructure forms a lifeline for inhabitants in a flood prone area, allowing evacuation as
well as access to emergency response services to affected areas, and the continuation of the
provision of essential services such as supply of food, bottled water and maintenance of
communications. To alleviate this impact it is important to have back-up solutions.. Flood proof
structures are therefore proposed in circumstances of flooding and post-flooding, for
interoperability and connection.
5.3.1 Innovative technologies
Floating Bridge Technology
Floating bridges are those bridges that rest on the surface of water instead of crossing it, as is
usual, and one of their main characteristics is that they do not present a barrier to the passage of
water Figure 5.6). The fact that these bridges do not have foundations on the ground makes its
global stability dependent on its buoyancy and not on the resistance and characteristics of their
supports and foundations.

Chapter 5: Design and Engineering
FloodProBE Guidance 82
Promptly assembled floating bridges consist of prefabricated cubic composite elements. A
connection of a dozen or so elements using mechanical connectors will become the floating base.
In order to stabilize the bridge structure, this should be anchored using stays in the quay. For
compensation of fluctuations in the water level and to facilitate movement from bank to the bridge,
deflection constructions should be placed on its ends. On the side surfaces of the bridge there are
handles for slinging installations with various types of utility.
Figure 5.6 Pedestrian floating bridge by Eco-Dock Inc
Temporary Lightweight Composite Bridge Technology
This technology consists of extremely light sections that are assembled on site. The load-bearing
parts consist of fibreglass beams that are reinforced with carbon fibres on the underside. The
bridge interacts with a thin bridge deck that is prefabricated out of composite-fibre-reinforced
concrete with extremely high strength. Since these materials are very durable and demountable,
they are advantageous in a life-cycle perspective, and they are highly suitable for temporary
construction, see Figure 5.7.

Chapter 5: Design and Engineering
FloodProBE Guidance 83
Figure 5.7 Lightweight bridge placements
Source: Construction by ACCIONA, Asturias, Spain, 2004
The implementation of this technology follows a series of analysis and decision making process,
that are carried out by competent authorities involved in planning and design of buildings,
infrastructure, disaster management and maintenance of key infrastructure (central, provincial, and
local government agencies sharing the responsibilities with local stakeholders).
Floating Storage Facilities
Having access to fuel during flood events (and other disasters) is complementary to providing
access and is therefore relevant to mention techniques for storage. Very large floating structures
have been used for storing fuel. Constructed like flat tankers (box-shaped) parked side by side,
they form an ideal oil storage facility, keeping the explosive, inflammable fluid from populated
areas on land. Japan has two major floating oil storage systems. One oil storage facility is located
in Shirashima with a capacity of 5.6 million kilolitres while the other is at Kamigoto (see Figure 5.8)
with a capacity of 4.4 million kilolitres.

Chapter 5: Design and Engineering
FloodProBE Guidance 84
Figure 5.8 Examples of floating storage facilities
On the left Shirashima Floating Oil Storage Base, Japan; on the right Kamigoto
Floating Oil Storage Base, Nagasaki Prefecture, Japan
Floating Emergency Bases
As floating structures are inherently isolated from earthquakes and floods, they are ideal for
applications as floating emergency rescue bases in earthquake and flood prone countries. Japan
has a number of such floating rescue bases parked in the Tokyo Bay, Ise Bay and Osaka Bay, see
Figure 5.9.
Figure 5.9 Examples of floating emergency bases
On the left Emergency Rescue Base in Tokyo Bay and on the right Emergency
Rescue Base in Osaka Bay, Japan
5.3.2 Catalogue of floating and composite technology
A catalogue has been developed for bridge technology. In the catalogue, floating and composite
bridge and base structures with the corresponding method of usage have been suggested for five
possible situations during floods: footbridge for pedestrians, vehicular bridges and two types of
composite structure (see Figure 5.10).

Chapter 5: Design and Engineering
FloodProBE Guidance 85
Pedestrian
bridge by
blocks
Vehicular
bridge
Lightweight
bridge
Floating
base
Figure 5.10 Proposed catalogue, different uses of floating and light weight technology according to the situation
The technologies described in this section aim to improve the resilience of existing critical
infrastructure such as road infrastructure, emergency services and energy supply so that they
remain fully operational during periods of (extreme) flooding. They should be planned and
designed so that they can be readily installed and managed in such a way that the users are not at
risk during the flooding. The present research has contributed to the development of guidance on
the application of these temporary and demountable technologies but it is recognised that
guidance is still in its infancy.
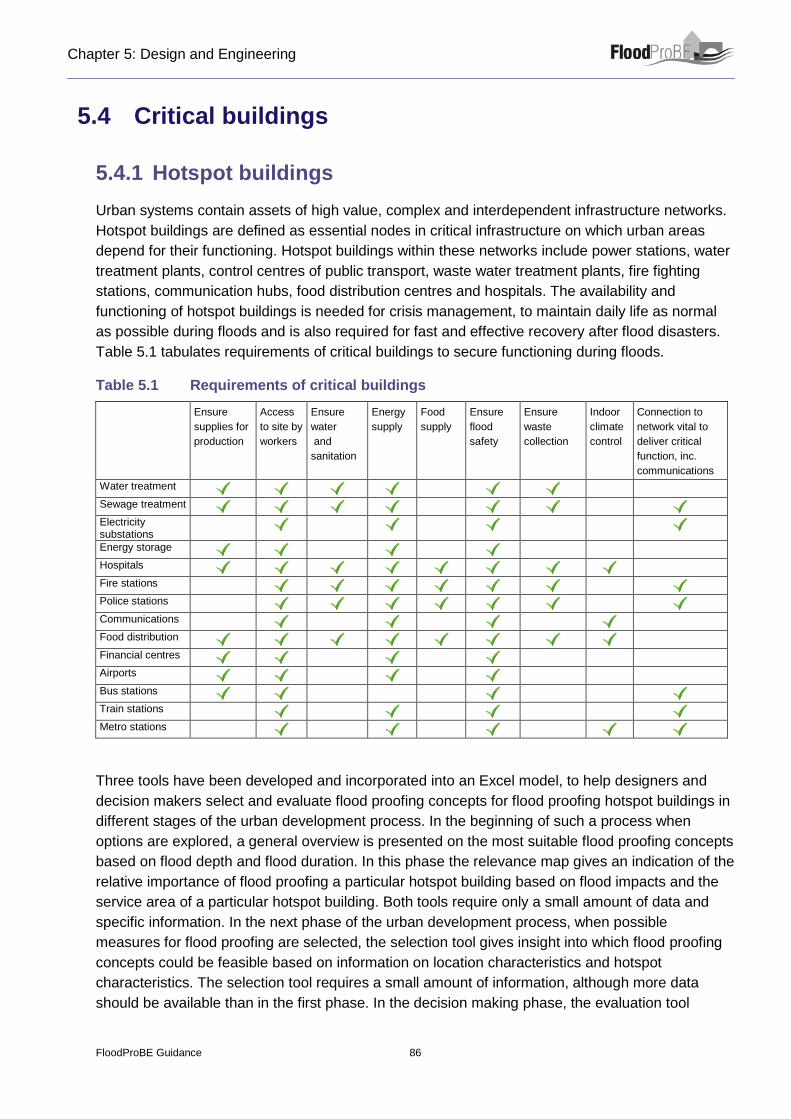
Chapter 5: Design and Engineering
FloodProBE Guidance 86
5.4 Critical buildings
5.4.1 Hotspot buildings
Urban systems contain assets of high value, complex and interdependent infrastructure networks.
Hotspot buildings are defined as essential nodes in critical infrastructure on which urban areas
depend for their functioning. Hotspot buildings within these networks include power stations, water
treatment plants, control centres of public transport, waste water treatment plants, fire fighting
stations, communication hubs, food distribution centres and hospitals. The availability and
functioning of hotspot buildings is needed for crisis management, to maintain daily life as normal
as possible during floods and is also required for fast and effective recovery after flood disasters.
Table 5.1 tabulates requirements of critical buildings to secure functioning during floods.
Table 5.1 Requirements of critical buildings
Ensure
supplies for
production
Access
to site by
workers
Ensure
water
and
sanitation
Energy
supply
Food
supply
Ensure
flood
safety
Ensure
waste
collection
Indoor
climate
control
Connection to
network vital to
deliver critical
function, inc.
communications
Water treatment
Sewage treatment
Electricity substations
Energy storage
Hospitals
Fire stations
Police stations
Communications
Food distribution
Financial centres
Airports
Bus stations
Train stations
Metro stations
Three tools have been developed and incorporated into an Excel model, to help designers and
decision makers select and evaluate flood proofing concepts for flood proofing hotspot buildings in
different stages of the urban development process. In the beginning of such a process when
options are explored, a general overview is presented on the most suitable flood proofing concepts
based on flood depth and flood duration. In this phase the relevance map gives an indication of the
relative importance of flood proofing a particular hotspot building based on flood impacts and the
service area of a particular hotspot building. Both tools require only a small amount of data and
specific information. In the next phase of the urban development process, when possible
measures for flood proofing are selected, the selection tool gives insight into which flood proofing
concepts could be feasible based on information on location characteristics and hotspot
characteristics. The selection tool requires a small amount of information, although more data
should be available than in the first phase. In the decision making phase, the evaluation tool

Chapter 5: Design and Engineering
FloodProBE Guidance 87
provides detailed information about the costs of several possible options for flood proofing a
specific hotspot. Relatively detailed information on the hotspot, flood characteristics and location
characteristics should be available for application of this tool.
Flood proofing methods
Flood proofing is a way of making buildings resilient against flooding. This can be done by avoiding
contact with floodwater or by making the building cope with floodwater and minimising damage
caused by floodwater; the following methods are available:
Wet flood proofing
Wet flood proofing or wet proof construction is a building method that allows temporary flooding
of the lower parts of the building. To prevent damage, preferably building materials are applied
that are water resistant. As an alternative, materials can be used that can be easily repaired or
replaced (Tables 5.2 and 5.3 give indication of the resilience of some finish materials and
insulating materials, respectively, based on laboratory tests).
Table 5.2 Flood resilience characteristics of finish materials
Source: CIRIA, 2006
Material
Resilience characteristics*
Overall
resilience
performance
Water
penetration
Drying
ability
Retention of
pre-flood
dimensions,
integrity
Timber board
OSB2, 11mm thick
(Oriented Strand Board)
Medium
Poor
Poor
Poor
OSB3, 18mm thick
(Oriented Strand Board)
Medium
Poor
Poor
Poor
Gypsum plaster board
Gypsum Plasterboard, 9mm
thick
Poor
Not
assessed
Poor
Poor
Mortars
Below DPC (Damp
Proof Course)
1:3 (cement:sand)
Good
Good
Good
Good
Above DPC (Damp
Proof Course)
1:6 (cement:sand)
Good
Good
Good
Good

Chapter 5: Design and Engineering
FloodProBE Guidance 88
Table 5.3 Flood resilience characteristics of insulation materials
Source: CIRIA, 2006
Material
Resilience characteristics*
Overall
resilience
performance
Water
penetration
Drying
ability
Retention of
pre-flood
dimensions,
integrity
Cavity insulation
Mineral
fibre Poor Poor Poor Poor
Blown-in Poor Poor Poor Poor
Rigid PU
foam Medium Medium Good Medium
*Resilience characteristics are related to the testing carried out and exclude aspects such as ability to withstand
freeze/thaw cycles, cleanability and mould growth
Another important design aspect is the location of electrical lines and delivery points above the
expected flood level. Construction parts have to be designed in such a way that they can easily be
dried after the flood. A schematic of wet proofing a house is given in Figure 5.11.
Figure 5.11 Schematic of wet proof method
Source: Pasche, 2008
Burner
Cat Walk
Pumping Sump
Electrical appliances
Hazard
Flood Stage
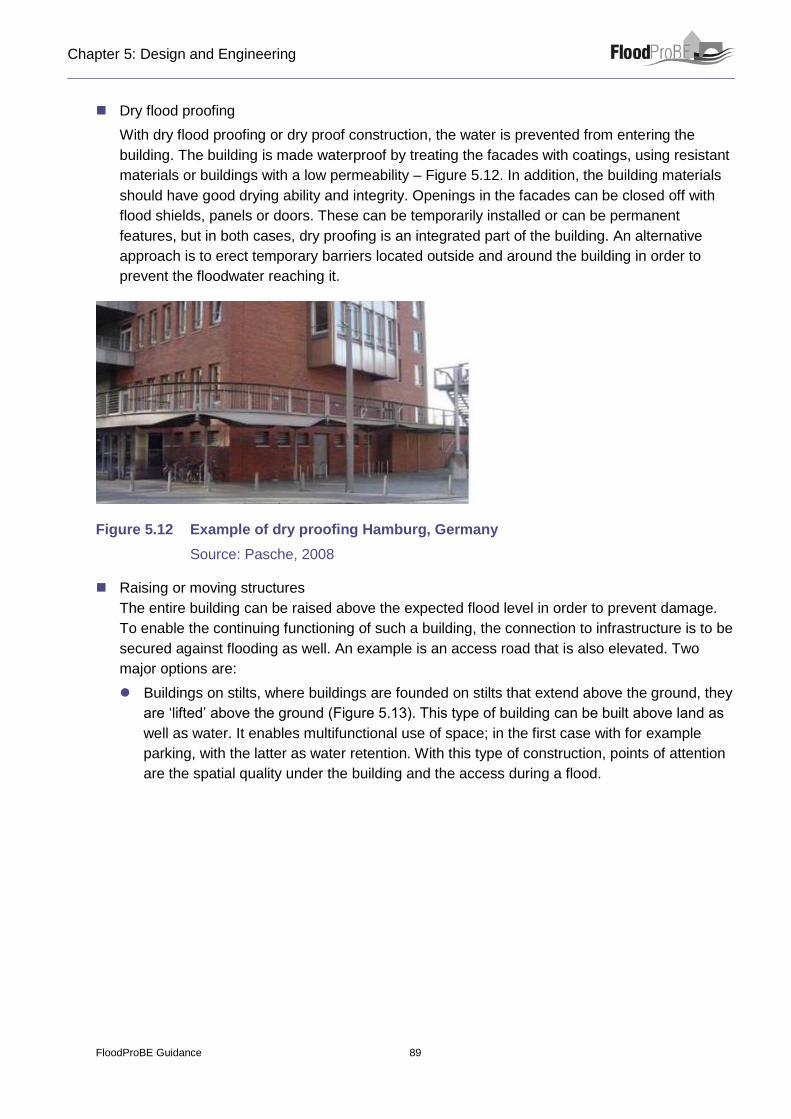
Chapter 5: Design and Engineering
FloodProBE Guidance 89
Dry flood proofing
With dry flood proofing or dry proof construction, the water is prevented from entering the
building. The building is made waterproof by treating the facades with coatings, using resistant
materials or buildings with a low permeability – Figure 5.12. In addition, the building materials
should have good drying ability and integrity. Openings in the facades can be closed off with
flood shields, panels or doors. These can be temporarily installed or can be permanent
features, but in both cases, dry proofing is an integrated part of the building. An alternative
approach is to erect temporary barriers located outside and around the building in order to
prevent the floodwater reaching it.
Figure 5.12 Example of dry proofing Hamburg, Germany
Source: Pasche, 2008
Raising or moving structures
The entire building can be raised above the expected flood level in order to prevent damage.
To enable the continuing functioning of such a building, the connection to infrastructure is to be
secured against flooding as well. An example is an access road that is also elevated. Two
major options are:
Buildings on stilts, where buildings are founded on stilts that extend above the ground, they
are ‘lifted’ above the ground (Figure 5.13). This type of building can be built above land as
well as water. It enables multifunctional use of space; in the first case with for example
parking, with the latter as water retention. With this type of construction, points of attention
are the spatial quality under the building and the access during a flood.
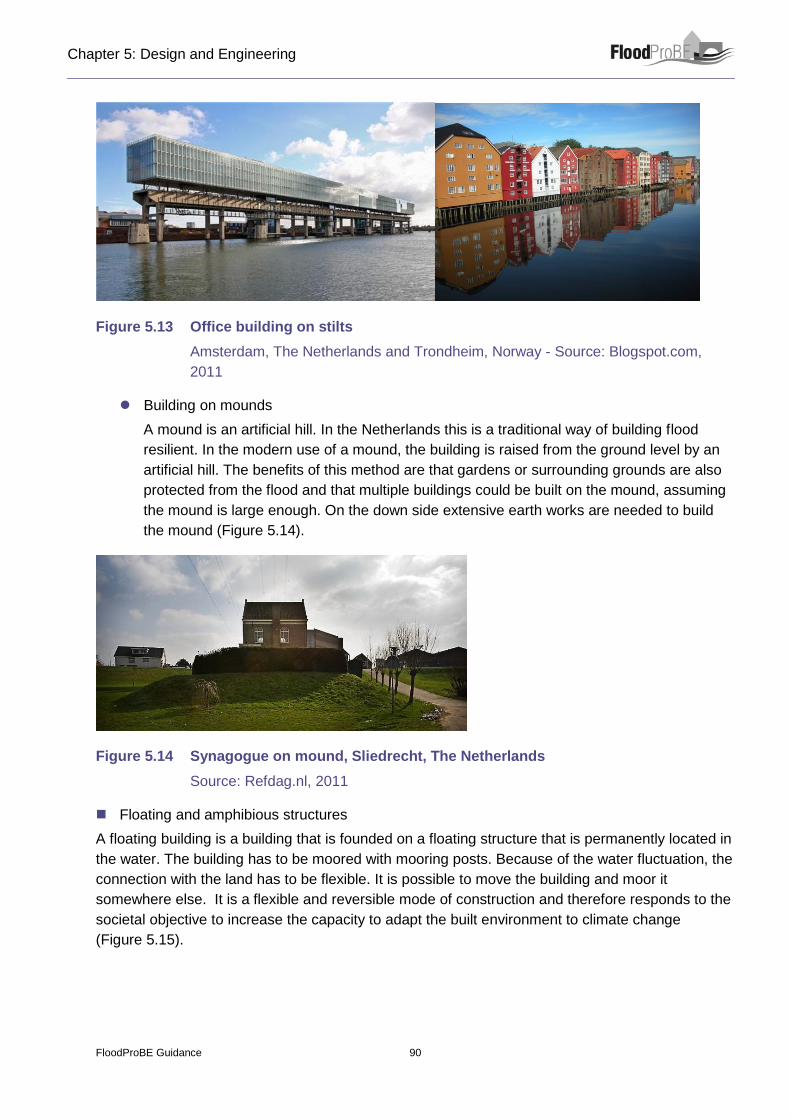
Chapter 5: Design and Engineering
FloodProBE Guidance 90
Figure 5.13 Office building on stilts
Amsterdam, The Netherlands and Trondheim, Norway - Source: Blogspot.com,
2011
Building on mounds
A mound is an artificial hill. In the Netherlands this is a traditional way of building flood
resilient. In the modern use of a mound, the building is raised from the ground level by an
artificial hill. The benefits of this method are that gardens or surrounding grounds are also
protected from the flood and that multiple buildings could be built on the mound, assuming
the mound is large enough. On the down side extensive earth works are needed to build
the mound (Figure 5.14).
Figure 5.14 Synagogue on mound, Sliedrecht, The Netherlands
Source: Refdag.nl, 2011
Floating and amphibious structures
A floating building is a building that is founded on a floating structure that is permanently located in
the water. The building has to be moored with mooring posts. Because of the water fluctuation, the
connection with the land has to be flexible. It is possible to move the building and moor it
somewhere else. It is a flexible and reversible mode of construction and therefore responds to the
societal objective to increase the capacity to adapt the built environment to climate change
(Figure 5.15).

Chapter 5: Design and Engineering
FloodProBE Guidance 91
Figure 5.15 Floating pavilion, Rotterdam, The Netherlands
Source: De Wit, 2010
An amphibious structure has a traditional foundation combined with a floating body. In a normal
situation the building is situated on the ground. When a flood occurs the building will start to float.
For that reason the building has to be fixed in a horizontal direction by mooring posts. Amphibious
construction is only possible for new buildings (Figure 5.16). In particular in floodplains where
floods frequently occur and in emergency water retention basins, this construction method can be
applied.
Figure 5.16 Amphibious dwelling in Maasbommel, The Netherlands
Source: Waterbestendigbouwen.nl, 2011
Active or temporary flood proofing
Temporary flood barriers are placed only if a flood is expected to damage buildings. After the flood
the barrier is removed again. Temporary barriers can protect high value buildings, infrastructure
nodes or hotspots. Temporary barriers are made from wood, steel, aluminium or plastics
(Figure 5.17).
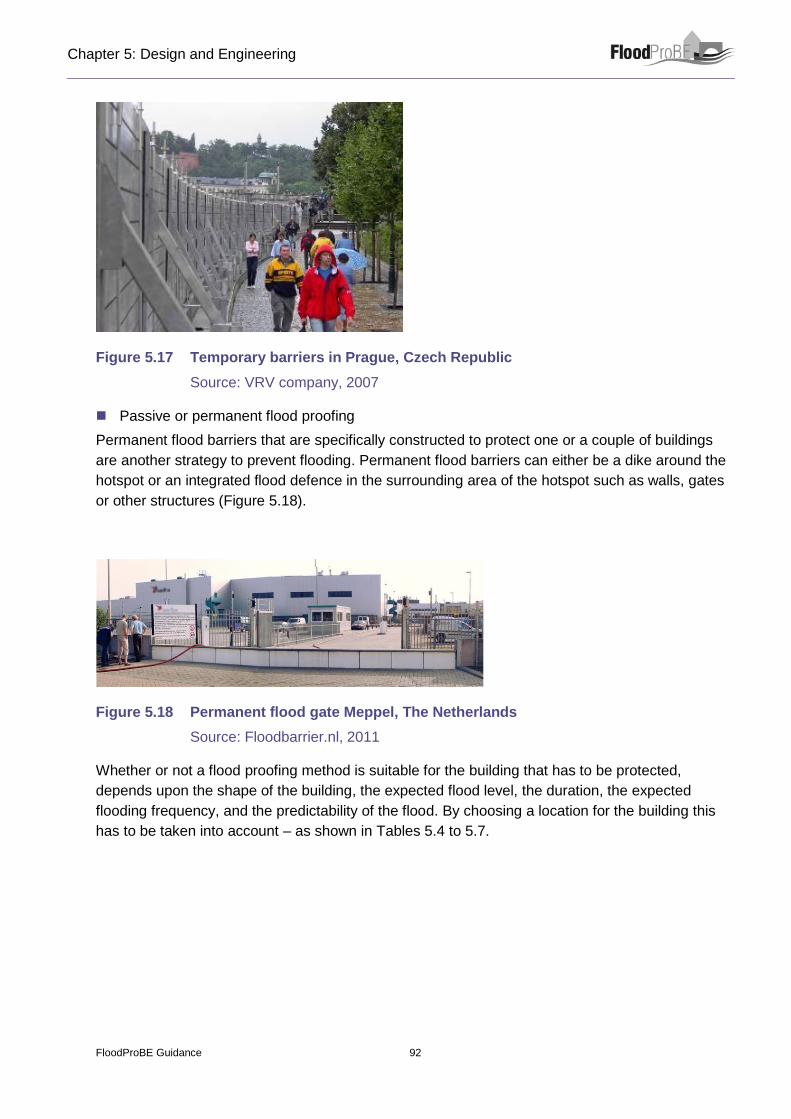
Chapter 5: Design and Engineering
FloodProBE Guidance 92
Figure 5.17 Temporary barriers in Prague, Czech Republic
Source: VRV company, 2007
Passive or permanent flood proofing
Permanent flood barriers that are specifically constructed to protect one or a couple of buildings
are another strategy to prevent flooding. Permanent flood barriers can either be a dike around the
hotspot or an integrated flood defence in the surrounding area of the hotspot such as walls, gates
or other structures (Figure 5.18).
Figure 5.18 Permanent flood gate Meppel, The Netherlands
Source: Floodbarrier.nl, 2011
Whether or not a flood proofing method is suitable for the building that has to be protected,
depends upon the shape of the building, the expected flood level, the duration, the expected
flooding frequency, and the predictability of the flood. By choosing a location for the building this
has to be taken into account – as shown in Tables 5.4 to 5.7.
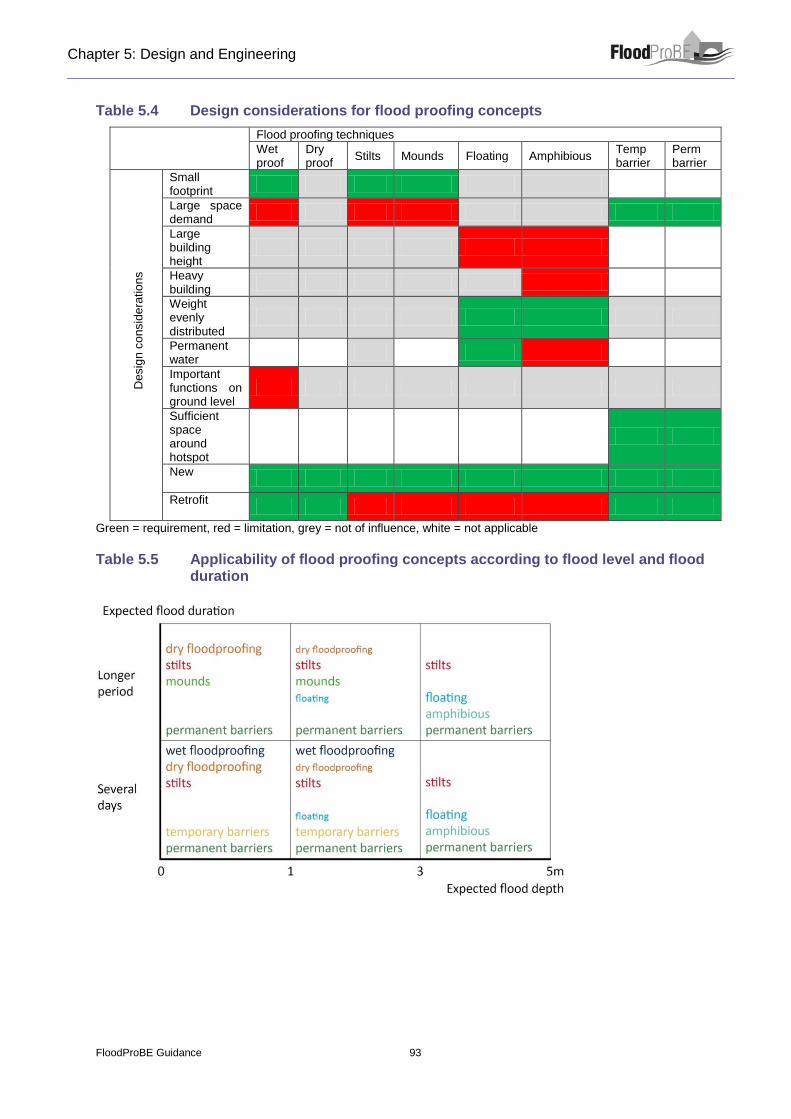
Chapter 5: Design and Engineering
FloodProBE Guidance 93
Table 5.4 Design considerations for flood proofing concepts
Flood proofing techniques
Wet proof
Dry proof
Stilts Mounds Floating Amphibious Temp barrier
Perm barrier
Desig
n c
onsid
era
tio
ns
Small footprint
Large space demand
Large building height
Heavy building
Weight evenly distributed
Permanent water
Important functions on ground level
Sufficient space around hotspot
New
Retrofit
Green = requirement, red = limitation, grey = not of influence, white = not applicable
Table 5.5 Applicability of flood proofing concepts according to flood level and flood duration
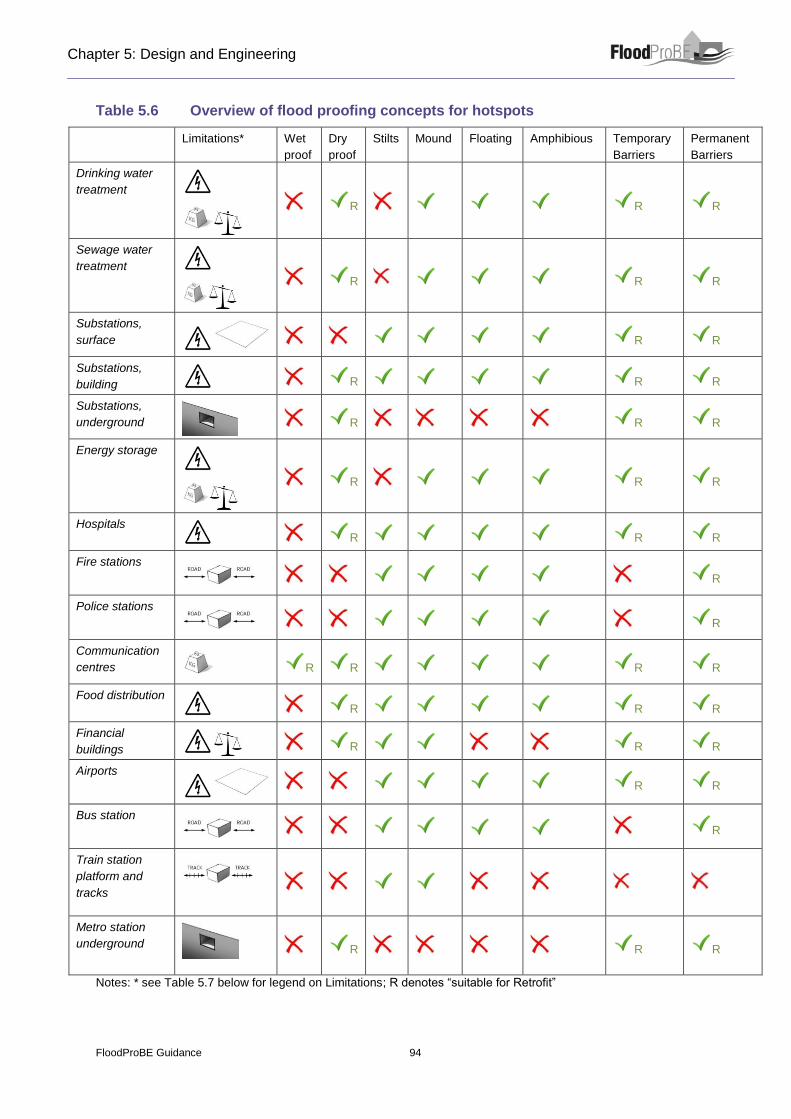
Chapter 5: Design and Engineering
FloodProBE Guidance 94
Table 5.6 Overview of flood proofing concepts for hotspots
Limitations* Wet
proof
Dry
proof
Stilts Mound Floating Amphibious Temporary
Barriers
Permanent
Barriers
Drinking water
treatment
R R R
Sewage water
treatment
R R R
Substations,
surface
R R
Substations,
building R R R
Substations,
underground
R R R
Energy storage
R R R
Hospitals
R R R
Fire stations
R
Police stations
R
Communication
centres
R R R R
Food distribution
R R R
Financial
buildings R R R
Airports
R R
Bus station
R
Train station
platform and
tracks
Metro station
underground R R R
Notes: * see Table 5.7 below for legend on Limitations; R denotes “suitable for Retrofit”
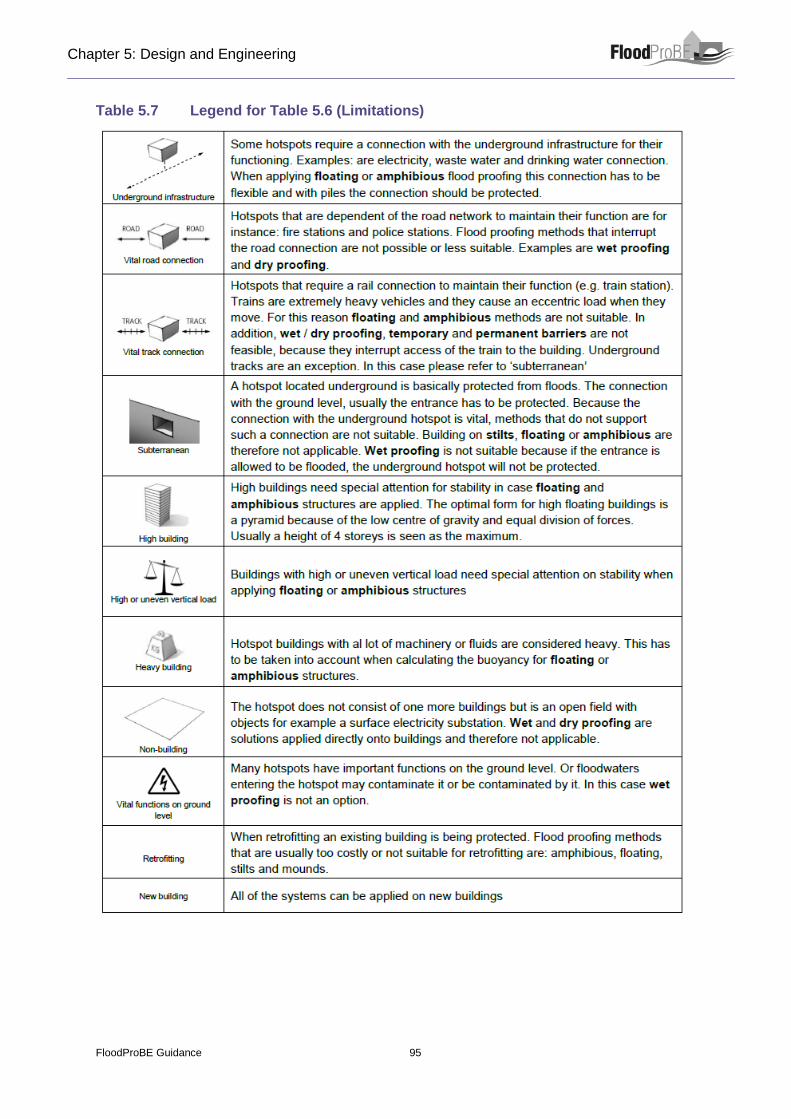
Chapter 5: Design and Engineering
FloodProBE Guidance 95
Table 5.7 Legend for Table 5.6 (Limitations)
Chapter 5: Design and Engineering
FloodProBE Guidance 96
Design tools
An interactive flood proofing design tool has been developed allowing policy makers, decision
makers and designers to narrow down the range of possibilities of flood proofing methods for
hotspot buildings in their projects. The tool consists of three stages: the Relevance Map, the
Selection Tool and the Evaluation Tool. The Relevance Map provides a first check to evaluate the
level of relevance of applying flood proofing measures. The Selection Tool is used to select the
applicable flood proofing measures based on the type of hotspot and other qualitative aspects. The
Evaluation Tool provides quantitative data, such as cost estimates and application ranges, and it is
used to find the most optimal flood-proofing methods for a given situation.
The Relevance Map
In order to assess the broader local or regional relevance of flood proofing a hotspot building,
two factors are of importance: the service area of the hotspot (how many people rely on this
service) and the magnitude of the anticipated flood scenario (how many people will be affected
by the flood).
The amount of people that depend on the hotspot is referred to here as the ‘hotspot service
area’. The hotspot types have been clustered into three levels in terms of their service area:
district, city and region (table below has been added for reference). Hotspots with regional or
larger importance serve a significant support area and a high economic value. For example
airports and food distribution centres are generally large scale facilities that serve many
people. If an airport would flood, this would have a huge effect on the economy of that region.
If a food distribution centre would flood, it would affect the stores in a very large area. On the
other hand, the flooding of a district bus station would not affect that many people and would
have less regional impact on the economy.
Table 5.8 Hotspots by importance
Service area Hotspot
Regional or larger Airports, Train station, Energy storage, Food distribution centre
Communication building (network operations / data / telecomm.)
Hospital (specialized / regional hospital)
Financial centre (stock exchange, central bank)
City Metro station, Electricity substation (transmission substation)
Communication building (data centre), Drinking water treatment,
Sewage treatment, Hospital (general hospital), Financial (city bank)
District Bus station, Electricity substation (distribution/transformation)
Police station, Fire station, Financial building (branch office)
Hospital (clinic)
Secondly, the magnitude of the (anticipated) flood event is relevant. This can be defined as the
amount of people that is affected by the flood and it is referred to as ‘flood impact’. If a hotspot
that only has a local importance is hit by a small scale local flood, the impact is low. People
that normally rely on this hotspot can easily find similar hotspot that has not been flooded at a

Chapter 5: Design and Engineering
FloodProBE Guidance 97
small distance. On the other hand, if an international airport is flooded, the impact of flood
proofing on the broader economy it is high, even if the flood would only be limited to a small
region. In case both the hotspot importance is high and the flood impact is high, flood proofing
of the hotspot would be necessary to improve urban flood resilience. Both factors have been
combined in Figure 5.19 – this gives a general idea about the relevance of flood proofing a
particular type of function designated as a hotspot.
Figure 5.19 Flood proofing hotspot relevance map
The Selection Tool
The Selection Tool narrows down the number of feasible flood proofing measures for each type
of hotspot. Building-specific and location-specific limitations will exclude certain flood proofing
options. For example, if there is no possibility of creating water or using existing water, floating
is not an option and if a metro station is created underground, stilts or wet proofing cannot be
applied. Such qualitative advantages and disadvantages, most of which have already been
discussed for the individual hotspot types, have been used as a basis for the selection tool.
In the selection tool the different characteristics of hotspot typologies have been converted into
a series of simple Yes or No questions (Figure 5.20).
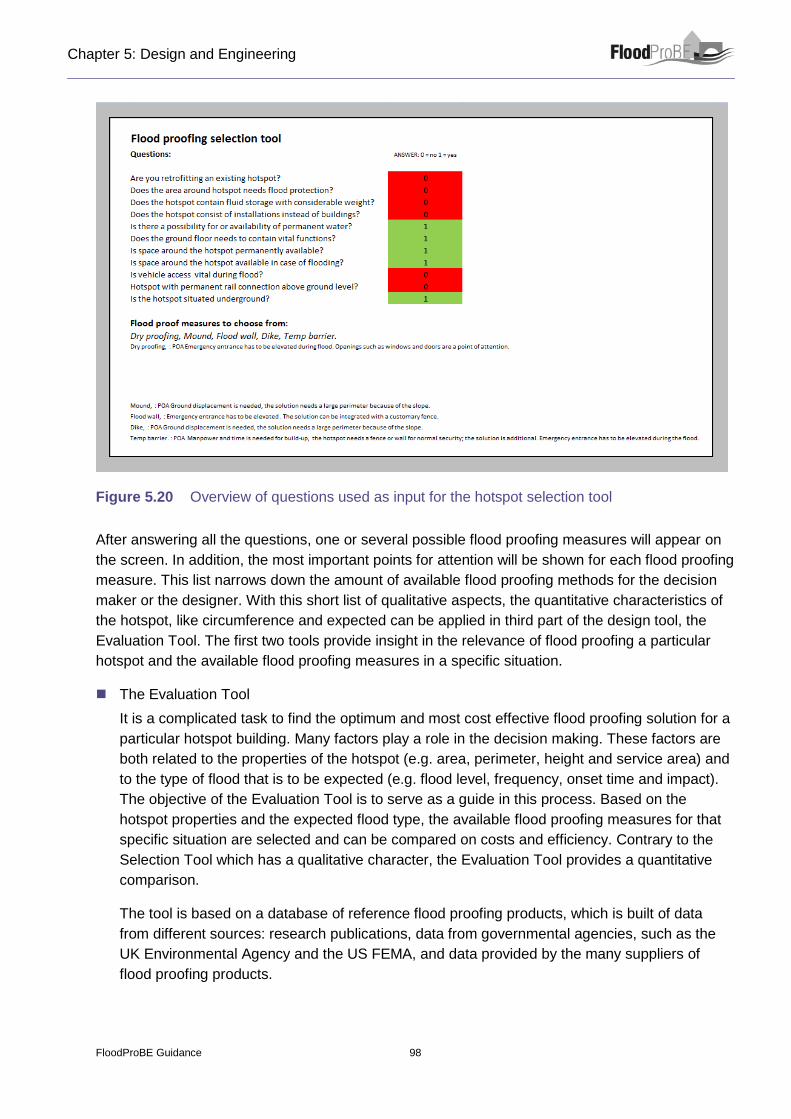
Chapter 5: Design and Engineering
FloodProBE Guidance 98
Figure 5.20 Overview of questions used as input for the hotspot selection tool
After answering all the questions, one or several possible flood proofing measures will appear on
the screen. In addition, the most important points for attention will be shown for each flood proofing
measure. This list narrows down the amount of available flood proofing methods for the decision
maker or the designer. With this short list of qualitative aspects, the quantitative characteristics of
the hotspot, like circumference and expected can be applied in third part of the design tool, the
Evaluation Tool. The first two tools provide insight in the relevance of flood proofing a particular
hotspot and the available flood proofing measures in a specific situation.
The Evaluation Tool
It is a complicated task to find the optimum and most cost effective flood proofing solution for a
particular hotspot building. Many factors play a role in the decision making. These factors are
both related to the properties of the hotspot (e.g. area, perimeter, height and service area) and
to the type of flood that is to be expected (e.g. flood level, frequency, onset time and impact).
The objective of the Evaluation Tool is to serve as a guide in this process. Based on the
hotspot properties and the expected flood type, the available flood proofing measures for that
specific situation are selected and can be compared on costs and efficiency. Contrary to the
Selection Tool which has a qualitative character, the Evaluation Tool provides a quantitative
comparison.
The tool is based on a database of reference flood proofing products, which is built of data
from different sources: research publications, data from governmental agencies, such as the
UK Environmental Agency and the US FEMA, and data provided by the many suppliers of
flood proofing products.
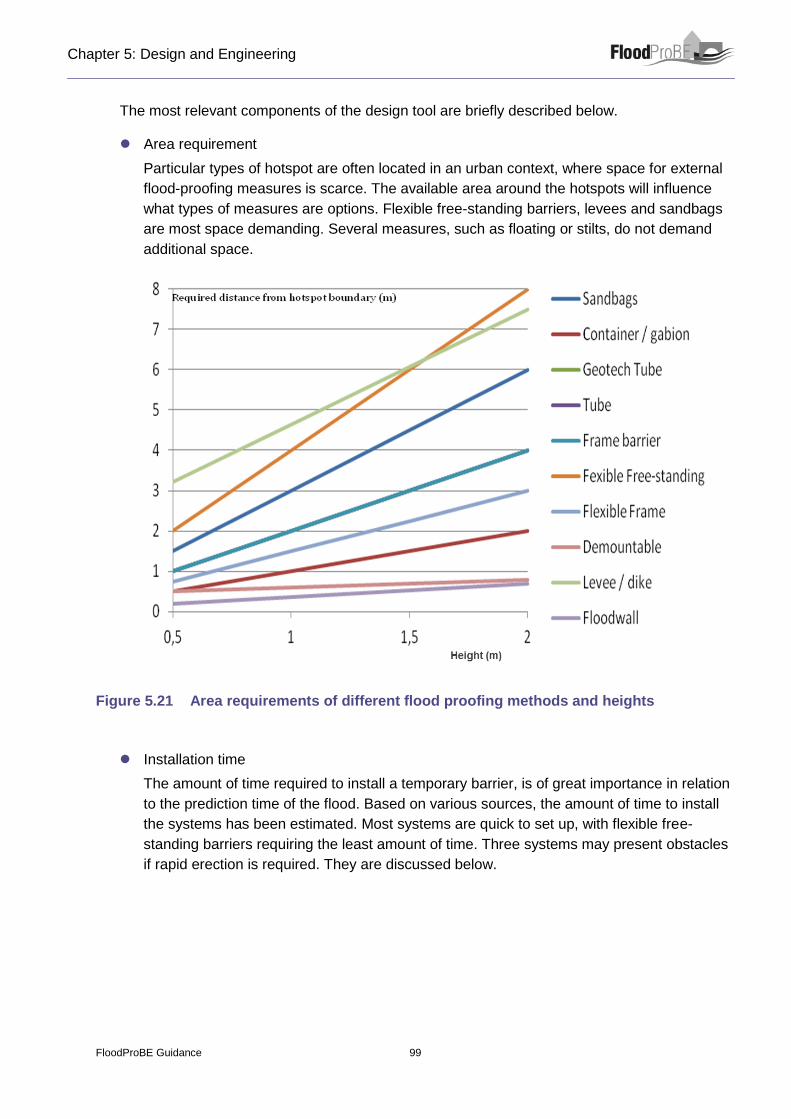
Chapter 5: Design and Engineering
FloodProBE Guidance 99
The most relevant components of the design tool are briefly described below.
Area requirement
Particular types of hotspot are often located in an urban context, where space for external
flood-proofing measures is scarce. The available area around the hotspots will influence
what types of measures are options. Flexible free-standing barriers, levees and sandbags
are most space demanding. Several measures, such as floating or stilts, do not demand
additional space.
Figure 5.21 Area requirements of different flood proofing methods and heights
Installation time
The amount of time required to install a temporary barrier, is of great importance in relation
to the prediction time of the flood. Based on various sources, the amount of time to install
the systems has been estimated. Most systems are quick to set up, with flexible free-
standing barriers requiring the least amount of time. Three systems may present obstacles
if rapid erection is required. They are discussed below.

Chapter 5: Design and Engineering
FloodProBE Guidance 100
Figure 5.22 Installation time of different flood proofing methods and heights
The graph shows that sandbags are very labour intensive, especially at higher flood levels.
Container/gabion systems require heavy equipment such as a front-loaders and lorries
that deliver the metal gabions and sand. While the installation time is limited, installing this
system is a considerable logistic challenge. Flexible frames are complex to install and
require a relatively high level of skill. As a result, on larger projects lack of enough skilled
personnel will cause longer installation times.
Height range
Flood proofing products have a limited height range. Most products have a maximum
height between 2,5 m and 3 m. For Flexible free-standing barriers the maximum height is
even less, up to 2 m. Generally, the permanent barriers and demountable systems have a
higher maximum range.
Cost estimation
Costs are an essential part of the assessment of flood defense measures. Some systems
are more cost effective for lower flood depths, but get very expensive as soon as they are
applied for high flood depths. Both sandbags, tubes and containers are exponentially more
expensive at a bigger height, because of the pyramid style stacking of the elements. Some
systems only have a limited life span of one or two application cycles. Both sandbags and
container/gabion systems are difficult to reuse. This will have a considerable influence on
the investment over longer periods. The costs may also depend on the flood frequency,
especially temporary measures that take manpower and resources to be installed.
For each type of flood proofing measure, cost data in relation to the protection height level
was gathered from a large number of sources. These two variables (costs per metre and
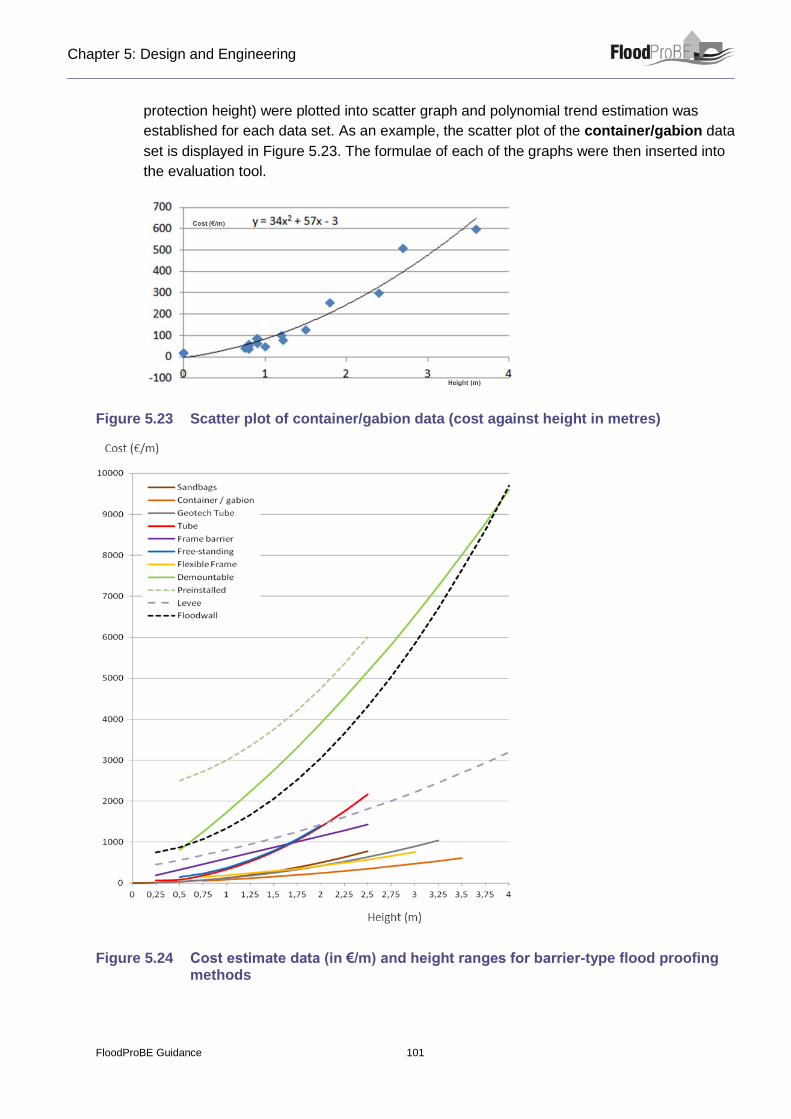
Chapter 5: Design and Engineering
FloodProBE Guidance 101
protection height) were plotted into scatter graph and polynomial trend estimation was
established for each data set. As an example, the scatter plot of the container/gabion data
set is displayed in Figure 5.23. The formulae of each of the graphs were then inserted into
the evaluation tool.
Figure 5.23 Scatter plot of container/gabion data (cost against height in metres)
Figure 5.24 Cost estimate data (in €/m) and height ranges for barrier-type flood proofing methods
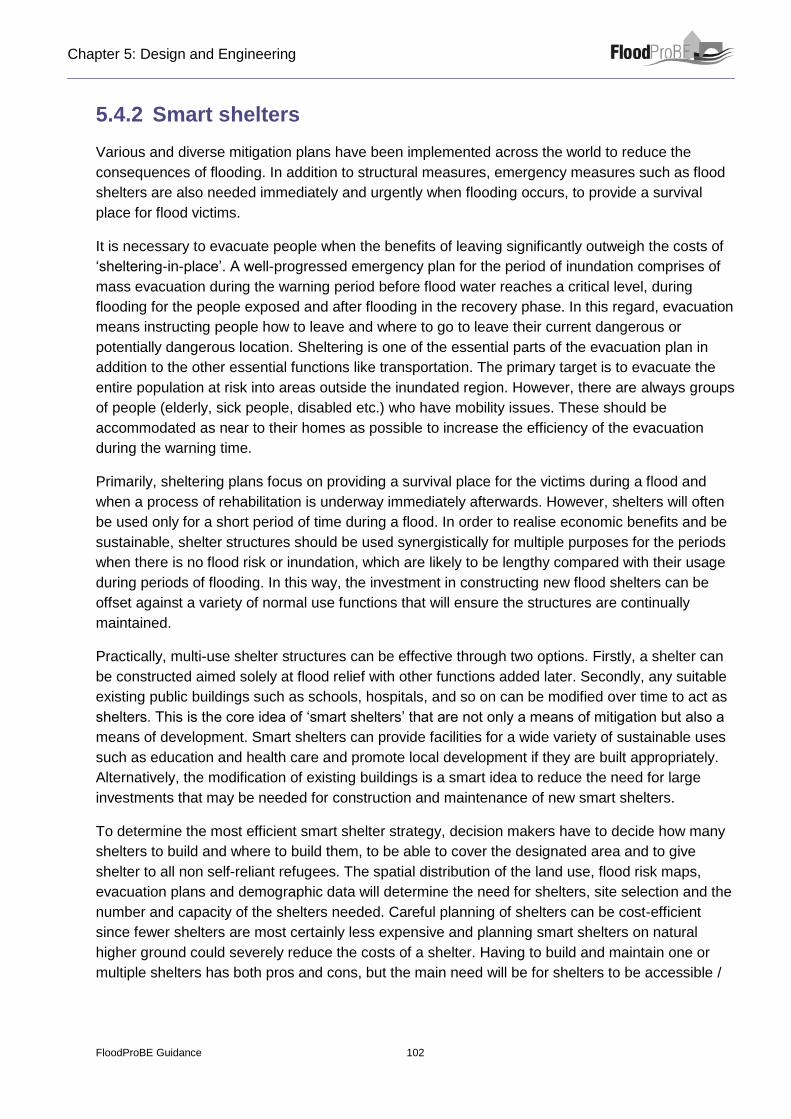
Chapter 5: Design and Engineering
FloodProBE Guidance 102
5.4.2 Smart shelters
Various and diverse mitigation plans have been implemented across the world to reduce the
consequences of flooding. In addition to structural measures, emergency measures such as flood
shelters are also needed immediately and urgently when flooding occurs, to provide a survival
place for flood victims.
It is necessary to evacuate people when the benefits of leaving significantly outweigh the costs of
‘sheltering-in-place’. A well-progressed emergency plan for the period of inundation comprises of
mass evacuation during the warning period before flood water reaches a critical level, during
flooding for the people exposed and after flooding in the recovery phase. In this regard, evacuation
means instructing people how to leave and where to go to leave their current dangerous or
potentially dangerous location. Sheltering is one of the essential parts of the evacuation plan in
addition to the other essential functions like transportation. The primary target is to evacuate the
entire population at risk into areas outside the inundated region. However, there are always groups
of people (elderly, sick people, disabled etc.) who have mobility issues. These should be
accommodated as near to their homes as possible to increase the efficiency of the evacuation
during the warning time.
Primarily, sheltering plans focus on providing a survival place for the victims during a flood and
when a process of rehabilitation is underway immediately afterwards. However, shelters will often
be used only for a short period of time during a flood. In order to realise economic benefits and be
sustainable, shelter structures should be used synergistically for multiple purposes for the periods
when there is no flood risk or inundation, which are likely to be lengthy compared with their usage
during periods of flooding. In this way, the investment in constructing new flood shelters can be
offset against a variety of normal use functions that will ensure the structures are continually
maintained.
Practically, multi-use shelter structures can be effective through two options. Firstly, a shelter can
be constructed aimed solely at flood relief with other functions added later. Secondly, any suitable
existing public buildings such as schools, hospitals, and so on can be modified over time to act as
shelters. This is the core idea of ‘smart shelters’ that are not only a means of mitigation but also a
means of development. Smart shelters can provide facilities for a wide variety of sustainable uses
such as education and health care and promote local development if they are built appropriately.
Alternatively, the modification of existing buildings is a smart idea to reduce the need for large
investments that may be needed for construction and maintenance of new smart shelters.
To determine the most efficient smart shelter strategy, decision makers have to decide how many
shelters to build and where to build them, to be able to cover the designated area and to give
shelter to all non self-reliant refugees. The spatial distribution of the land use, flood risk maps,
evacuation plans and demographic data will determine the need for shelters, site selection and the
number and capacity of the shelters needed. Careful planning of shelters can be cost-efficient
since fewer shelters are most certainly less expensive and planning smart shelters on natural
higher ground could severely reduce the costs of a shelter. Having to build and maintain one or
multiple shelters has both pros and cons, but the main need will be for shelters to be accessible /
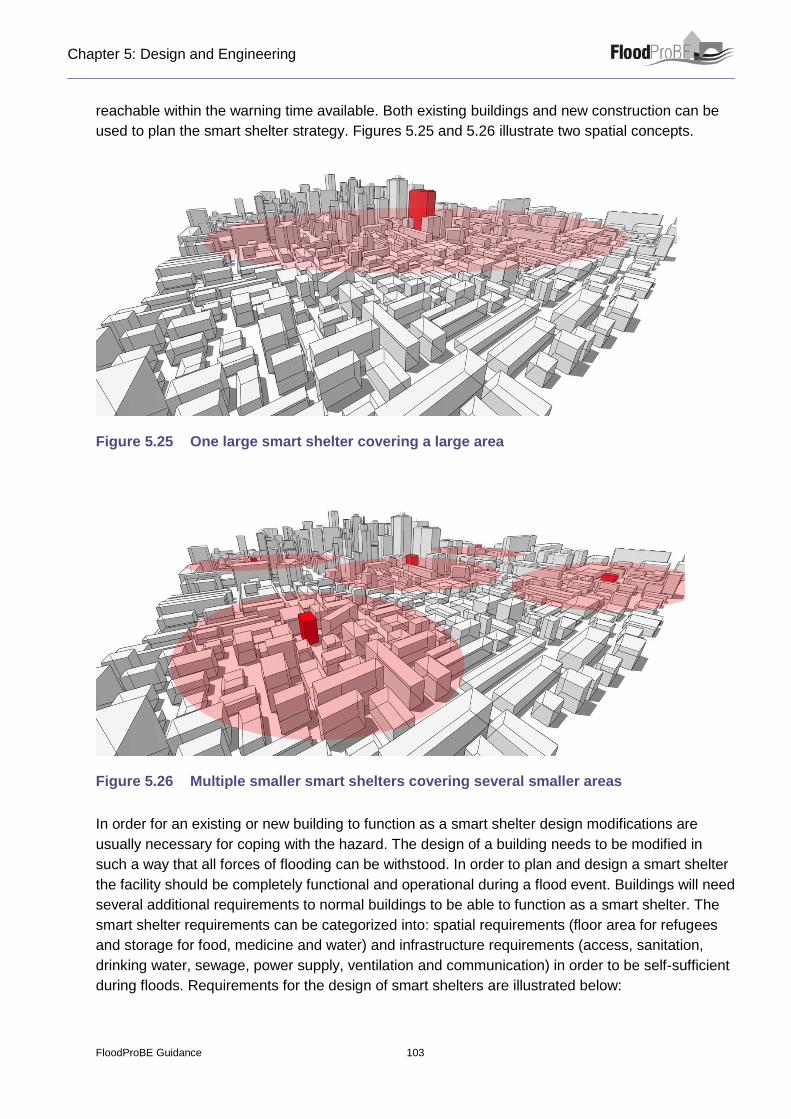
Chapter 5: Design and Engineering
FloodProBE Guidance 103
reachable within the warning time available. Both existing buildings and new construction can be
used to plan the smart shelter strategy. Figures 5.25 and 5.26 illustrate two spatial concepts.
Figure 5.25 One large smart shelter covering a large area
Figure 5.26 Multiple smaller smart shelters covering several smaller areas
In order for an existing or new building to function as a smart shelter design modifications are
usually necessary for coping with the hazard. The design of a building needs to be modified in
such a way that all forces of flooding can be withstood. In order to plan and design a smart shelter
the facility should be completely functional and operational during a flood event. Buildings will need
several additional requirements to normal buildings to be able to function as a smart shelter. The
smart shelter requirements can be categorized into: spatial requirements (floor area for refugees
and storage for food, medicine and water) and infrastructure requirements (access, sanitation,
drinking water, sewage, power supply, ventilation and communication) in order to be self-sufficient
during floods. Requirements for the design of smart shelters are illustrated below:

Chapter 5: Design and Engineering
FloodProBE Guidance 104
Clarifying constraints
For the case of shelters, a main consideration prior to the development of the alternatives is to
investigate if there are (inter)national standards. The constraints should include those elements
that are likely to be influencing (prohibiting) factors for the number and location of shelters and the
services provided. These include the specific requirements and capacities of the organisations
who might be involved in an evacuation plan (emergency services), the condition of the roads for
providing safe access to the shelter, the time available for evacuation, and the safety level of
people settled in the shelter during flooding.
Design modifications
In order for an existing or new building to function as a smart shelter some design modifications
are usually necessary for coping with the hazard. These modifications are mainly structural and
made on the exterior of the building and the bearing structure. The design of a building needs to
be modified in such a way that all forces of flooding can be withstood. In order to plan and design a
smart shelter the facility should be completely functional and operational during a flood event. This
means avoidance of the flood is the most effective way to minimise the life-safety risk to the
community that relies on the shelter, as well as to minimise the potential damage to the building. A
well-planned, designed, constructed and maintained smart shelter needs to be able to withstand
damage and remain functional during a flood event. Other possibilities of flood proofing a building
are wet proof, dry proof or even floating options which can be achieved by adding a factor of safety
(i.e. freeboard, levees, or elevation). Performance evaluation of a facility affected by flooding
needs to include consideration of the building response to the following load conditions:
Lateral hydrostatics forces
Vertical (buoyant) hydrostatic forces
Hydrodynamic forces
Surge forces
Impact forces of flood-borne debris
Breaking wave forces
Localized scour
The parts of the building that are vulnerable to these forces will need extra protection. They may
include the use of strengthened glass, water and blast proof windows, temporary flood barriers and
the use of water resistant materials and insulation.
Functional requirements
Buildings will need several additional requirements to normal buildings to be able to function as a
smart shelter. During normal circumstances multi-use smart shelters will provide their primary
function. But in times of emergency smart shelters change their function. The smart shelter
requirements can be categorised into: spatial requirements (floor area for refugees and storage for
food, medicine and water) and infrastructure requirements (access, sanitation, drinking water,
sewage, power supply, ventilation and communication) in order to be self-sufficient during floods.

Chapter 5: Design and Engineering
FloodProBE Guidance 105
It is necessary to define the spatial requirement per refugee in order to determine the capacity of
shelters. These requirements may differ in each country. The American Red Cross recommends
the following minimum floor spaces (these criteria are based on the use of the shelter both as a
refuge area during the event and as a recovery centre after the event):
20 square feet / 1.86 m2 per person for a short-term stay (i.e. a few days)
40 square feet / 3.72 m2 per person for a long-term stay (i.e. days to weeks)
The Dutch Red Cross recommends slightly larger floor areas:
2.5 m2 per person for a short-term stay (day time)
2 – 4 m2 per person for a long-term stay (day and night)
4 m2 = 1 bed + chair
3 m2 = 1 stretcher + chair
2 m2 = 1 stretcher
Note that the terms short-term and long-term may be different in different countries and that spatial
requirements should be according to local law and regulation.
Additional floor space is needed for the storage of supplies in order to change the function of the
building into the shelter function, i.e. beds, food and water and for additional installations that are
needed to guarantee electricity, water, ventilation and sanitation. This additional space depends
highly on the primary function and the spatial floor plan of the building. For instance: hotels may
offer ideal floor plans to host evacuees and most likely have large parts of the food supplies
reserved for guests. The additional space for this is estimated at 10% of the gross floor area of the
shelter. The ICC-500 (2008 Standard for the Design and Construction of Storm Shelters) states
that depending on the arrangement of the floor area of the primary function of the shelter, there are
three possible calculations to define the usable floor space (Table 5.9):
Useable floor area is 50% of the gross floor area in case of high density and fixed furnishings
Useable floor area is 65% of the gross floor area in case of low density and unfixed furnishings
Useable floor area is 85% of the gross floor area in case of open floor spaces with unfixed
furnishings.
Table 5.9 Usable floor space (in m2) for shelters
Smart Shelter Capacity
Smart Shelter building type Cinema School Conference Hall
Gross Floor Area 5000 m2 5000 m2 5000 m2
Spatial Requirements + 10% 500 m2 500 m2 500 m2
Total Gross Floor Area 5500 m2 5500 m2 5500 m2 Useable net. Area (50% / 65% / 80%) 2750 m2 3575 m2 4400 m2
Capacity short-term 1,86 m2/pers. 1478 pers. 1922 pers. 2365 pers.
Capacity long-term 3,72 m2/pers. 739 pers. 961 pers. 1182 pers.
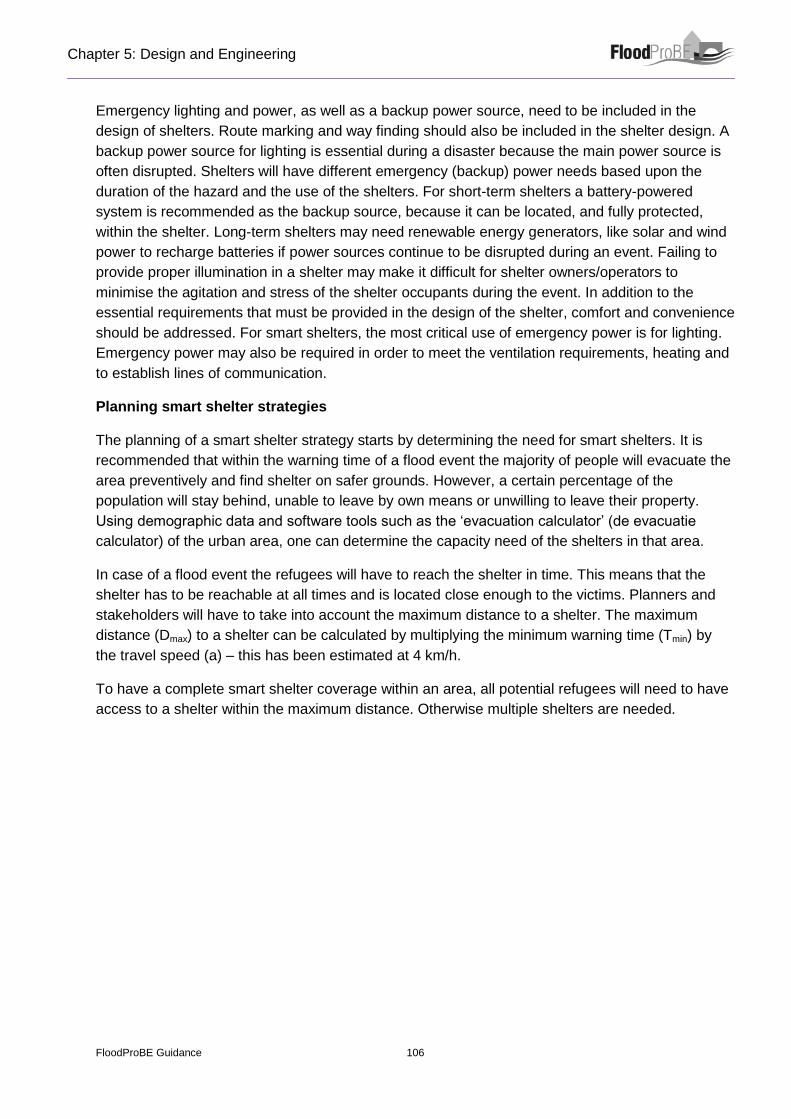
Chapter 5: Design and Engineering
FloodProBE Guidance 106
Emergency lighting and power, as well as a backup power source, need to be included in the
design of shelters. Route marking and way finding should also be included in the shelter design. A
backup power source for lighting is essential during a disaster because the main power source is
often disrupted. Shelters will have different emergency (backup) power needs based upon the
duration of the hazard and the use of the shelters. For short-term shelters a battery-powered
system is recommended as the backup source, because it can be located, and fully protected,
within the shelter. Long-term shelters may need renewable energy generators, like solar and wind
power to recharge batteries if power sources continue to be disrupted during an event. Failing to
provide proper illumination in a shelter may make it difficult for shelter owners/operators to
minimise the agitation and stress of the shelter occupants during the event. In addition to the
essential requirements that must be provided in the design of the shelter, comfort and convenience
should be addressed. For smart shelters, the most critical use of emergency power is for lighting.
Emergency power may also be required in order to meet the ventilation requirements, heating and
to establish lines of communication.
Planning smart shelter strategies
The planning of a smart shelter strategy starts by determining the need for smart shelters. It is
recommended that within the warning time of a flood event the majority of people will evacuate the
area preventively and find shelter on safer grounds. However, a certain percentage of the
population will stay behind, unable to leave by own means or unwilling to leave their property.
Using demographic data and software tools such as the ‘evacuation calculator’ (de evacuatie
calculator) of the urban area, one can determine the capacity need of the shelters in that area.
In case of a flood event the refugees will have to reach the shelter in time. This means that the
shelter has to be reachable at all times and is located close enough to the victims. Planners and
stakeholders will have to take into account the maximum distance to a shelter. The maximum
distance (Dmax) to a shelter can be calculated by multiplying the minimum warning time (Tmin) by
the travel speed (a) – this has been estimated at 4 km/h.
To have a complete smart shelter coverage within an area, all potential refugees will need to have
access to a shelter within the maximum distance. Otherwise multiple shelters are needed.

Chapter 5: Design and Engineering
FloodProBE Guidance 107
BOX 5.1 Case Study Dordrecht
The city of Dordrecht (the Netherlands) forms the southern gateway to the urban
agglomeration of Amsterdam, Utrecht, Rotterdam and The Hague and is situated in one of
the lowest parts of the Netherlands (from -1 m to +3 m above sea level). It counts
approximately 120,000 inhabitants and lies next to the bifurcation of the Beneden
Merwede, the Oude Maas and the Noord. The city is effectively located on an island, being
surrounded by the Beneden Merwerde and the Oude Maas in the north, the Dordtsche Kil
in the west and the Nieuwe Merwede and Hollandsch Diep in the south (Figure 5.27).
Figure 5.27 Rivers and canals surrounding the Island of Dordrecht, The Netherlands
Figure 5.28 shows the three main land use categories of the Island of Dordrecht. These
categories are: residential & transport, industry & commerce, and agriculture & recreation.
These categories are based on the damage categories used in the standard method to
calculate damages and casualties due to floods. The figure shows that most agriculture and
recreational areas lie south of the (Wieldrechtse) Zeedijk and east of the city, while the
residential, industrial and commercial areas lie in the north west of the Island. Most
industrial areas lie next to the rivers, outside the primary defence system.
The island is connected to the main land by only a few bridges and tunnels. The four main
important connections are: the Drecht tunnel and (train and vehicles) bridge in the north
east, the Merwede and Baanhoek bridges (train and vehicles) in the north, the Kil tunnel
(vehicles) in the east and the Moerdijk bridge (train and vehicles) in the south west.
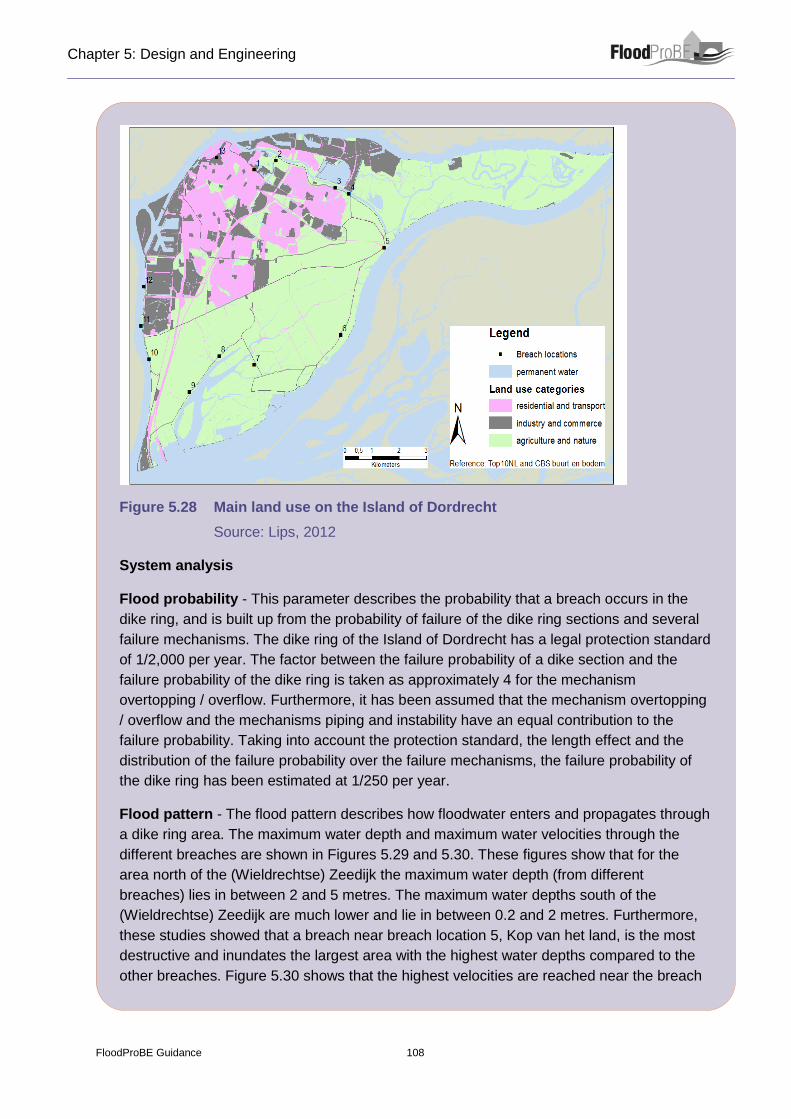
Chapter 5: Design and Engineering
FloodProBE Guidance 108
Figure 5.28 Main land use on the Island of Dordrecht
Source: Lips, 2012
System analysis
Flood probability - This parameter describes the probability that a breach occurs in the
dike ring, and is built up from the probability of failure of the dike ring sections and several
failure mechanisms. The dike ring of the Island of Dordrecht has a legal protection standard
of 1/2,000 per year. The factor between the failure probability of a dike section and the
failure probability of the dike ring is taken as approximately 4 for the mechanism
overtopping / overflow. Furthermore, it has been assumed that the mechanism overtopping
/ overflow and the mechanisms piping and instability have an equal contribution to the
failure probability. Taking into account the protection standard, the length effect and the
distribution of the failure probability over the failure mechanisms, the failure probability of
the dike ring has been estimated at 1/250 per year.
Flood pattern - The flood pattern describes how floodwater enters and propagates through
a dike ring area. The maximum water depth and maximum water velocities through the
different breaches are shown in Figures 5.29 and 5.30. These figures show that for the
area north of the (Wieldrechtse) Zeedijk the maximum water depth (from different
breaches) lies in between 2 and 5 metres. The maximum water depths south of the
(Wieldrechtse) Zeedijk are much lower and lie in between 0.2 and 2 metres. Furthermore,
these studies showed that a breach near breach location 5, Kop van het land, is the most
destructive and inundates the largest area with the highest water depths compared to the
other breaches. Figure 5.30 shows that the highest velocities are reached near the breach

Chapter 5: Design and Engineering
FloodProBE Guidance 109
locations and small areas in between higher areas (embankments) that lie within the dike
ring. The velocities can be faster than 0.5 m/s near the breaches and in between higher
areas, but are less than 0.2 m/s in most areas of the island.
Figure 5.29 Maximum water depths for all breaches
Source: Lips, 2012
Figure 5.30 Maximum water velocities for all breaches
Source: Lips, 2012

Chapter 5: Design and Engineering
FloodProBE Guidance 110
Preventive evacuation - The preventive evacuation is the percentage of inhabitants of the
dike ring area that can be evacuated before a breach occurs. In the Water Safety 21st
century project, preventive evacuation has been schematized with four evacuation
scenarios: 1) unexpected, no evacuation; 2) unexpected, unorganized; 3) expected,
unorganized; and, 4) expected, organized. A conditional probability (which is the probability
that a given evacuation scenario occurs) and an evacuation percentage have been
assigned to each evacuation scenario (Table 5.10). By combining the conditional
probabilities and the evacuation percentages an average evacuation percentage of 15% of
the inhabitants is found for the Island of Dordrecht.
Table 5.10 Conditional probability and evacuation percentage per evacuation scenario
Preventive evacuation strategy
Scenario Scenario 1
Scenario 2
Scenario 3
Scenario 4
Average
Conditional probability
0.40 0.44 0.12 0.04
Evacuation percentage
0.00 0.03 0.59 0.76 0.15
Number of causalities - The number of causalities gives the human lives lost as a direct
consequence of a flood. This can be determined using the expected mortality rate (defined
as the probability that a person dies as a result of the flood characteristics occurring at a
particular location) and the ability to evacuate before a breach occurs. The Flood
Information System Damage and Casualty Module (HIS-SSM) contains mortality functions
that calculate the probability of death at a particular location based on the flood
characteristics occurring, such as the water depth, water velocity and rise rate. The number
of casualties for the Island of Dordrecht was analysed with HIS-SSM for two situations. A
first set of calculations has been made for the situation with a Design Water Level (1/2000
per year) and a further set of calculations has been made for a situation with a factor 100
lower probability (1/200000 per year). Table 5.11 shows the number of casualties as
calculated by Hoss et al (2011). This table shows that the number of casualties is high in
areas with many residential areas (e.g. dike section 5), while it is lower in areas with an
industrial function (e.g. dike section 12). Furthermore, damage and casualties are higher in
areas that suffer a bigger water depth. In general the areas that suffer the biggest flood
impact lay at the northern side of the island, while at the southern side flood impact is less.

Chapter 5: Design and Engineering
FloodProBE Guidance 111
Table 5.11 Number of casualties per dike section
Number of casualties
Dike section 1 2 3 4 5 6 7 8 9 10 11 12 13
Casualties with a 1/2000 per year water level
25-100
40-165
40-160
40-160
170-710
0 0 0 0 2-7 20-85
10-40
0
Casualties with a 1/200000 per year water level
55-230
90-370
140-600
115-480
285-1,200
0 0 0 1-4
5- 20
40-170
25-105
15-75
Source: Hoss et al, 2011
The expected value of the numbers of casualties was calculated by the summation of all
possible breach scenarios. Here, all breach scenarios have a contribution depending on the
probability that it occurs and the number of casualties associated with it. This expected
value gives the total flood risk of a dike ring with regard to casualties, expressed in
expected annual number of casualties (EANC). For the Island of Dordrecht, the expected
value of the numbers of casualties has been estimated at 0.42 casualties per year.
The visualization of the Local Individual Risk (LIR) - including evacuation - is given in
Figure 5.31. The Individual Risk expresses the flood risk at every location in the dike ring
area. It is equal to the probability of dying as a result of the flood characteristics (water
depth, water velocity and rise rate) for a certain location. The IR is larger in the urbanised
parts of Island of Dordrecht than in the rural parts. The industry park Dordtse Kil in the west
of the island is by far the largest area with an increased LIR.
Figure 5.31 Local individual risk (including evacuation)-LIR-for the Island of Dordrecht, The Netherlands
Chapter 5: Design and Engineering
FloodProBE Guidance 112
Setting objectives
The objective set by the municipality, in close cooperation with the other stakeholders
involved in flood risk management for the Island of Dordrecht, is to find practical measures
on the city level that make the Island of Dordrecht safer and more attractive. An important
starting point in this respect is connecting flood safety with spatial developments and water
awareness.
The city of Dordrecht aims to identify synergistic opportunities where measures in one level
of flood safety, such as protection, are synergetic to the effectiveness of other levels of
flood safety, such as prevention or preparedness. Another important connection is that
between flood safety and spatial development. Successfully connecting policy development
ambitions in different sectors can speed up the implementation process for flood safety.
Furthermore, new sources of funding can be addressed and/or costs can be reduced.
The area specific evacuation strategy is mainly directed toward measures in the third safety
level (preparedness) and is supported by measures from the first safety level (protection)
and second safety level (prevention). This strategy strives to reduce the flood risk with
regard to casualties below certain target values. Target values can be predefined by the
stakeholders or can be imposed by law. Different target values can be established for the
different risk measures, such as the LIR and EANC. These target values can be used to
assess whether a given intervention reaches the desired flood safety. One of the objectives
of the Second Delta Committee is to make the Netherlands ten times safer. In this respect,
the potential interventions can be ranked according to the degree by which they reduce the
EANC. The actual target value for flood risk corresponding with a ten times saver situation
can be calculated by dividing the EANC for the reference situation by ten. The target value
for the LIR, as proposed by the Delta Programme Rhine Estuary-Drechtsteden, should be
below 10-5 per year.
Potential interventions
Complete preventive evacuation for the Island of Dordrecht is not seen as feasible for the
following reasons: 1) there are few main escaping routes (main highways) off the Island; 2)
the amount of time for the evacuation is short (24 hours before the highest water levels
occur it is impossible to evacuate anymore due to the fact that a heavy storm is blowing
over the area); 3) the number of people that need to be evacuated is large (densely
populated area); 4) neighbouring dike ring areas will be experiencing the same problem, so
that there is no place to evacuate to. Therefore, an area specific evacuation strategy is
envisioned. The proposed interventions for this strategy are to designate buildings on high
places as smart shelters, to improve the self-reliance of the people, and to improve warning
and crisis communication.
Shelters - Buildings on naturally existing high places on the island are to be designated as
smart shelters for the non self-reliant people. For this purpose, several schools have been

Chapter 5: Design and Engineering
FloodProBE Guidance 113
selected to serve as shelters to receive evacuees. This is because these buildings already
have a function in accommodating large amounts of people. Their canteens will be
constructed on higher floor levels once these schools are renovated or newly build.
Improving self-reliance - Through communication about potential disasters and training the
self- reliance of the people will be increased. This is aimed at encouraging self-reliant
people to stay in their houses or to seek shelter in high buildings in the area.
Improving communication - By an improved warning system the likelihood of an expected
and organized evacuation increases. The improvement of the communication to the people
during a disaster will increase the effectiveness of disaster management. This intervention
will need to be implemented on several levels: local, regional and national.
Setting functional requirements
As part of the area specific evacuation strategy, about 20% of the people that remain on
the island after preventive evacuation will still be evacuated to the smart shelters. The
required sheltering capacity has been calculated using these factors, and it amounts to
about 8000 to 14000 shelter places. The shelters should be self-sufficient, either
permanently or temporarily (i.e. using emergency responses), in terms of sanitation,
drinking water, sewage, power supply, ventilation and communication.
Cost effectiveness
The effect of the area specific evacuation strategy on the flood risk with regard to casualties
has been assessed. The improved warning system will alter the conditional probabilities per
evacuation scenario in favour of the scenarios with higher evacuation factors, whereas
improved preparation will increase the evacuation factors for these scenarios (Table 5.12).
This results in a higher average evacuation percentage, raising from 15 to 28%.
Furthermore, the construction of smart shelters will lead to a reduction of the mortality by
50%. This means that the number of casualties is halved.
Table 5.12 Conditional probability and evacuation percentage per evacuation scenario
Area specific evacuation strategy
Scenario Scenario 1 Scenario 2 Scenario 3 Scenario 4 Average
Conditional probability 0.28 0.38 0.18 0.16
Evacuation percentage 0.00 0.07 0.71 0.79 0.28
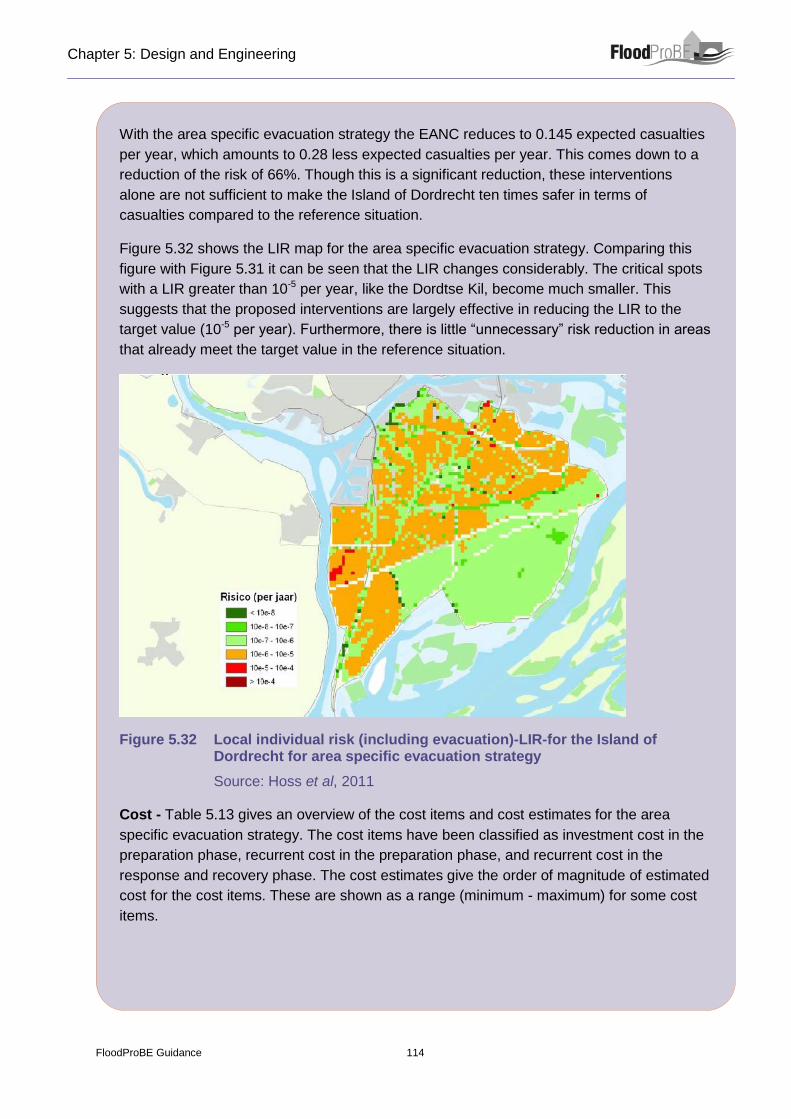
Chapter 5: Design and Engineering
FloodProBE Guidance 114
With the area specific evacuation strategy the EANC reduces to 0.145 expected casualties
per year, which amounts to 0.28 less expected casualties per year. This comes down to a
reduction of the risk of 66%. Though this is a significant reduction, these interventions
alone are not sufficient to make the Island of Dordrecht ten times safer in terms of
casualties compared to the reference situation.
Figure 5.32 shows the LIR map for the area specific evacuation strategy. Comparing this
figure with Figure 5.31 it can be seen that the LIR changes considerably. The critical spots
with a LIR greater than 10-5 per year, like the Dordtse Kil, become much smaller. This
suggests that the proposed interventions are largely effective in reducing the LIR to the
target value (10-5 per year). Furthermore, there is little “unnecessary” risk reduction in areas
that already meet the target value in the reference situation.
Figure 5.32 Local individual risk (including evacuation)-LIR-for the Island of Dordrecht for area specific evacuation strategy
Source: Hoss et al, 2011
Cost - Table 5.13 gives an overview of the cost items and cost estimates for the area
specific evacuation strategy. The cost items have been classified as investment cost in the
preparation phase, recurrent cost in the preparation phase, and recurrent cost in the
response and recovery phase. The cost estimates give the order of magnitude of estimated
cost for the cost items. These are shown as a range (minimum - maximum) for some cost
items.

Chapter 5: Design and Engineering
FloodProBE Guidance 115
Table 5.13 Overview cost items and cost
Area specific evacuation strategy
Investment cost in the preparation phase Cost estimate
Planning cost to determine the type, number, and size of the
needed shelters 0.1 MEuro
Implementation of modification measures to improve present
buildings to be a shelter 9.8 - 17.2 MEuro
Recurrent costs in the preparation phase
Risk communication between different emergency services
involved in evacuation programs and to the public - MEuro
Education and training of the emergency services staffs 2.5 MEuro
Recurrent cost in the response and recovery phase
Costs of displacement of people into shelter 0.2 - 0.4 MEuro
Cost of providing immediate and urgent needs such as food,
health care, etc. 10 - 35 MEuro
The modification and extension of the existing crisis management plan is required, because
the area specific evacuation strategy requires different responses and capacities from the
current strategy. For example, the type, number, and size of the shelters should be
investigated as part of the planning process. The planning cost has been estimated from
the cost incurred for the development of the Regional Basic Plan Floods. This amounted to
approximately 0.1 MEuro.
The cost for adding the shelter-function to schools is estimated at 20% of the investment
cost of building new schools. The average construction cost for an educational building in
Dordrecht amounts to 1000 Euro per square metre of gross floor area. The costs for the
addition of shelter locations are therefore equal to 200 Euro per square metre of gross floor
area. Assuming a ratio of usable flood area versus gross floor area of 0.65, this amounts to
€ 308 Euro per square metre. The required usable floor area for sheltering one person (for
the period of 1-2 weeks) is approximately 4 square metres (based on the American Red
Cross recommendations). The cost for the addition of a shelter-function to schools is
therefore € 1232 per shelter place. Assuming 8000-14000 shelter places, the total
investment cost amount to 9.8 to 17.2 MEuro.
Risk communication between different emergency services involved in evacuation
programs and with the public is an essential part of the area specific evacuation strategy.
For example, people should be made aware that it is safer to find shelter on the island than
to evacuate and risk getting stuck in traffic. Also, for the non self-reliant people it should be
clear that they can get health care, etc. in designated shelter locations in the
neighborhoods. The costs for risk communication are unknown.
The emergency services staff should be trained and the new strategy should be practiced.
These costs were estimated at 2.5 MEuro per year.
Chapter 5: Design and Engineering
FloodProBE Guidance 116
It is estimated that about 100 policemen are required for the displacement of 5000 non self-
reliant people into shelters. Given the short early warning period, it is assumed that the
displacement into shelters has to take place within one day. The cost of a policeman per 24
hours is 1500 Euro. Assuming that 8000 to 14000 persons have to be displaced, the total
cost is estimated at 0.2 to 0.4 MEuro.
The cost of providing health care has been estimated using the average care cost per day
in a nursing home. This amounts to 185 Euro per person per day. These costs do not
include medical supervision. Assuming 8000-14000 shelter places for 1-2 weeks, the total
cost is about 10 to 35 MEuro (minimum: 1 week shelter for 8,000 people; and maximum:
two weeks shelter for 14,000 people).
Cost-benefit analysis
The benefits of the area specific evacuation strategy can be calculated by expressing the
casualties in terms of economic damages. In the Water Safety 21st century project a
monetary value of 6.7 MEuro is assumed per casualty. The reduction in casualties with the
area specific evacuation strategy has been estimated at 0.28 less expected casualties per
year. This implies that the economic damage is reduced by 1.9 MEuro per year. These
annual benefits should be discounted into present values terms, taking into account a
discount rate of 4%. In case of an infinite time horizon, the present value of benefits comes
down to 48.8 MEuro.
The costs of the area specific evacuation strategy consists of investment cost in the
preparation phase, recurrent cost in the preparation phase, and recurrent cost in the
response and recovery phase. The present value of costs has been calculated at 75.0 to
82.8 MEuro, by adding the discounted costs together over the time horizon.
Subtracting the benefits from the costs gives a negative NPV of 26.3 to 34.0 MEuro. This
implies that the investment in smart shelters cannot be justified economically. It is of note,
however, that this is mainly due to the relatively high cost of education and training of the
emergency services staff.
References:
HOSS F, JONKMAN S N & MAASKANTA B (2011), Comprehensive assessment of
multilayered safety in flood risk management – the Dordrecht case study. Floods: From
Risk to Opportunity, IAHS Publ. 357, 2013.
LIPS N (2012), Application of storylines for strategy development in flood risk management.
A case study on the flooding of the island of Dordrecht (The Netherlands). MSc Thesis
Universiteit Utrecht, Utrecht, The Netherlands.

Chapter 6 Further
information

Chapter 6: Further Information
FloodProBE Guidance 118

Chapter 6: Further Information
FloodProBE Guidance 119
6.1 Further information
Table 6-1 below provides signposting to different topic focussed information arising from the
FloodProBE research. The main deliverable reports associated with each topic are listed, along
with a link to the project website where more information (fact sheets, executive summaries,
technical reports, links to associated pilot site work etc) may be found. Note that not all topic areas
relate to all pilots, but some pilots include work covering multiple topics.
Web links: The web links provide a direct link to the FloodProBE website and a ‘bundle’ of
information relating specifically to the associated topic or question or pilot. A more general search
of FloodProBE outputs can be made via the documents area at http://www.floodprobe.eu/project-
documents.asp

Chapter 6: Further Information
FloodProBE Guidance 120
Table 6.1 Sources of information
Topics
Section in
this Guide
Associated
(Deliverable)
Report
Web link to
access more
detailed
Information
Applying FloodProBE Technologies within
the Urban Design Process 2
Link
Levee Assessment: 3 Link
Assessing levee erosion processes: Internal erosion
3.2.1 D3.1
WP03-01-12-11 Link
Assessing levee erosion processes: Structure transitions
3.2.2 D3.1
WP03-01-12-11 Link
Assessing levee erosion processes: Performance of grass cover
3.2.3 D3.1
WP03-01-12-11 Link
Levee assessment using geophysical
technologies 3.3 D3.2
WP3-01-12-20 Link
Levee assessment using remote sensing
technologies (LIDAR) 3.3
D3.2 WP3-01-12-20
Link
Combining different data sources to gain
insight into the levee condition. 3.4
D3.3 WP03-01-12-24
Link
Critical infrastructure assessment: 4 Link
Step-wise approach and tools for network
assessment 4.2
D2.1 WP02-01-12-04
Link
Risk assessment for global understanding 4.2.1 D2.1 WP02-01-12-04
Link
Assessment of interdependencies of
infrastructure networks 4.2.2
D2.1 WP02-01-12-04
Link
Analysing the course of a flood event on
critical infrastructure through the storyline
method
4.3
D2.1 WP02-01-12-04
Link
Assessment of likely level of damage to critical
buildings
4.4
D2.2 WP02-01-12-05
Link
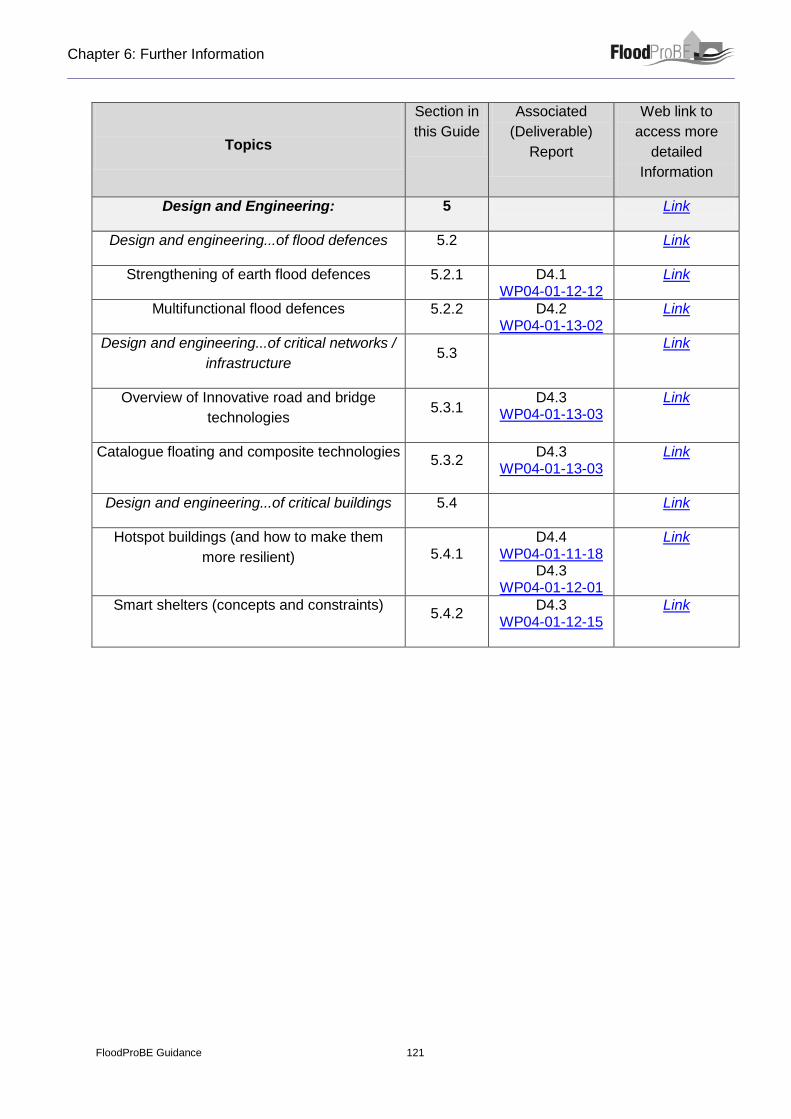
Chapter 6: Further Information
FloodProBE Guidance 121
Topics
Section in
this Guide
Associated
(Deliverable)
Report
Web link to
access more
detailed
Information
Design and Engineering: 5 Link
Design and engineering...of flood defences 5.2 Link
Strengthening of earth flood defences 5.2.1 D4.1 WP04-01-12-12
Link
Multifunctional flood defences 5.2.2 D4.2 WP04-01-13-02
Link
Design and engineering...of critical networks /
infrastructure 5.3
Link
Overview of Innovative road and bridge
technologies 5.3.1
D4.3 WP04-01-13-03
Link
Catalogue floating and composite technologies 5.3.2
D4.3 WP04-01-13-03
Link
Design and engineering...of critical buildings 5.4 Link
Hotspot buildings (and how to make them
more resilient) 5.4.1 D4.4
WP04-01-11-18 D4.3
WP04-01-12-01
Link
Smart shelters (concepts and constraints) 5.4.2
D4.3 WP04-01-12-15
Link
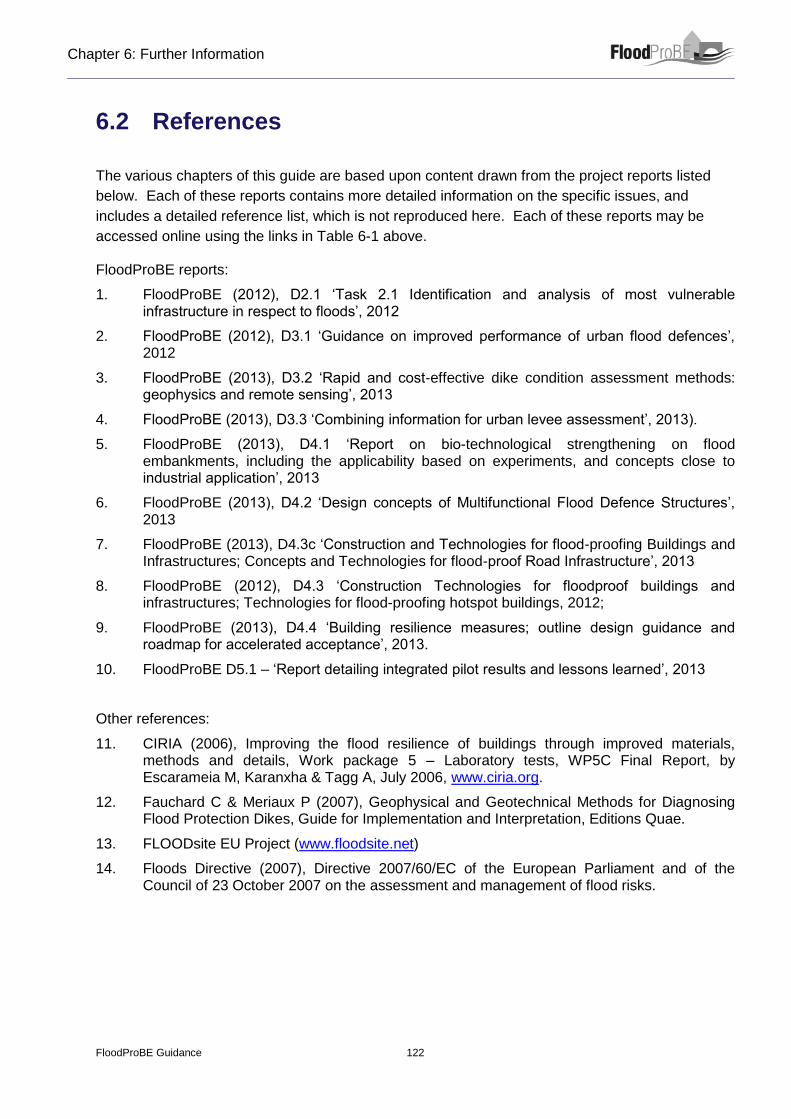
Chapter 6: Further Information
FloodProBE Guidance 122
6.2 References
The various chapters of this guide are based upon content drawn from the project reports listed
below. Each of these reports contains more detailed information on the specific issues, and
includes a detailed reference list, which is not reproduced here. Each of these reports may be
accessed online using the links in Table 6-1 above.
FloodProBE reports:
1. FloodProBE (2012), D2.1 ‘Task 2.1 Identification and analysis of most vulnerable infrastructure in respect to floods’, 2012
2. FloodProBE (2012), D3.1 ‘Guidance on improved performance of urban flood defences’, 2012
3. FloodProBE (2013), D3.2 ‘Rapid and cost-effective dike condition assessment methods: geophysics and remote sensing’, 2013
4. FloodProBE (2013), D3.3 ‘Combining information for urban levee assessment’, 2013).
5. FloodProBE (2013), D4.1 ‘Report on bio-technological strengthening on flood embankments, including the applicability based on experiments, and concepts close to industrial application’, 2013
6. FloodProBE (2013), D4.2 ‘Design concepts of Multifunctional Flood Defence Structures’, 2013
7. FloodProBE (2013), D4.3c ‘Construction and Technologies for flood-proofing Buildings and Infrastructures; Concepts and Technologies for flood-proof Road Infrastructure’, 2013
8. FloodProBE (2012), D4.3 ‘Construction Technologies for floodproof buildings and infrastructures; Technologies for flood-proofing hotspot buildings, 2012;
9. FloodProBE (2013), D4.4 ‘Building resilience measures; outline design guidance and roadmap for accelerated acceptance’, 2013.
10. FloodProBE D5.1 – ‘Report detailing integrated pilot results and lessons learned’, 2013
Other references:
11. CIRIA (2006), Improving the flood resilience of buildings through improved materials, methods and details, Work package 5 – Laboratory tests, WP5C Final Report, by Escarameia M, Karanxha & Tagg A, July 2006, www.ciria.org.
12. Fauchard C & Meriaux P (2007), Geophysical and Geotechnical Methods for Diagnosing Flood Protection Dikes, Guide for Implementation and Interpretation, Editions Quae.
13. FLOODsite EU Project (www.floodsite.net)
14. Floods Directive (2007), Directive 2007/60/EC of the European Parliament and of the Council of 23 October 2007 on the assessment and management of flood risks.