technologies for viable salmon aquaculture, an examination of land-based closed containment
TRANSCRIPT

Acknowledgement The SOS Marine Conservation Foundation gratefully acknowledges the financial contributions made towards the preparation of this technology report by Fisheries and Oceans Canada and the British Columbia Ministry of Agriculture and Lands in partnership with the Investment Agriculture Foundation.
Technologies for Viable Salmon Aquaculture An Examination of Land-Based Closed Containment Aquaculture
A public domain report.
Draft – May 2010 by Andrew S. Wright Ph.D & Nasim Arianpoo MSc Submitted to the SOS Solutions Advisory Committee, established to provide advice to The SOS Marine Conservation Foundation’s Save Our Salmon Initiative

P a g e | 2
Draft – May 2010
Table of Contents Table of Contents ................................................................................................................ 2 Table of Figures .................................................................................................................. 3 Forward / Executive Summary ........................................................................................... 4 Reviewers ............................................................................................................................ 5 Aquaculture Technology Landscape ................................................................................... 6 Introduction ......................................................................................................................... 7 Basic Fish Husbandry Requirements .................................................................................. 9 Technology Components .................................................................................................. 11 Evaluation of a Land-Based Full Recirculation Fish Farm Design .................................. 13
Production Strategy ....................................................................................................... 14 Design Targets .............................................................................................................. 19 Farm Module Design .................................................................................................... 24 Construction .................................................................................................................. 25 Total Power Consumption Assessments ....................................................................... 31 Conclusion Regarding Technology Assessment for Land-Based Recirculating Systems....................................................................................................................................... 33
Farm Site Criteria .............................................................................................................. 34 Land Utilization ............................................................................................................ 34 Water Consumption ...................................................................................................... 38
Financial Assessment for Land-Based Full Recirculation Aquaculture ........................... 40 Financial Assessment Summary for the Land-Based Full Recirculating Closed Containment Fish Farm..................................................................................................... 43 Summary Assessment for a Land-Based Closed Containment Recirculating Fish Farm . 45 Report Conclusions ........................................................................................................... 46 References ......................................................................................................................... 47
P a g e | 3
Draft – May 2010
Table of Figures Figure 1: Conceptual / Preliminary Technology Continuum. ............................................. 7 Figure 2: Commercial Off-The-Shelf Equipment & Technology Availability ................ 11 Figure 3: Growth Rates for Atlantic Salmon .................................................................... 15 Figure 4: Tank Layout for Sequential Fish Growth .......................................................... 16 Figure 5: Harvest Weight and Fish Numbers ................................................................... 17 Figure 6: Water Targets for Fish Husbandry .................................................................... 19 Figure 7: Mass Balance Equilibrium ................................................................................ 20 Figure 8: Metabolic Conversion Rates ............................................................................. 21 Figure 9: Mass Balance Flow Rate Results ...................................................................... 23 Figure 10: Full Recirculation Processes ........................................................................... 24 Figure 11: System Flow and Components for a 100 MT Module .................................... 26 Figure 12: Reference Design ............................................................................................ 27 Figure 13: Farm Module Component List ........................................................................ 28 Figure 14: Component Sizing. .......................................................................................... 30 Figure 15: Total Power Consumption ............................................................................... 32 Figure 16: 100 MT Farm Module Land Footprint ............................................................ 34 Figure 17: 1,000 MT Production Farm ............................................................................. 35 Figure 18: 100,000 MT Industry Land-Use Requirement ................................................ 36 Figure 19: Production Land Footprint Sizing ................................................................... 37 Figure 20: Water Consumption ......................................................................................... 39 Figure 21: Capital Costs.................................................................................................... 40 Figure 22: Major Operating Costs .................................................................................... 41 Figure 23: Percentage Total Operating Costs ................................................................... 41 Figure 24: Commodity-Based Annual Revenue & Income Statement for Annual Harvest Production for 175 MT Production from 100 MT Farm Modules and 1,750 MT Production from a 1,000 MT Farm ................................................................................... 42 Figure 25: Premium-Based Annual Revenue (25%) & Income Statement for Annual Harvest Production for 175 MT Production from 100 MT Farm Modules and 1,750 MT Production from a 1,000 MT Farm ................................................................................... 42 Figure 26: Financial Assessment Summaries ................................................................... 43 Any estimates, forecasts, statements of intent, statements of opinion and projections contained in the Report have been prepared by the authors of the Report. Neither the SOS Foundation, nor any of its respective directors, officers, employees, affiliates, agents, advisors, or representatives make any promise, representation or warranty, expressed or implied, as to the accuracy or completeness of the information contained in the Report. This Report does not purport to contain all of the information that may be required to evaluate a transaction. Any recipient hereof should conduct its own independent analysis of the opportunities and the data contained or referred to in the Report.
P a g e | 4
Draft – May 2010
Forward / Executive Summary This report documents an investigation into the feasibility of land-based closed containment technology for utilization in the British Columbia aquaculture industry. The report concludes that land-based closed containment is technically viable using commercial off-the-shelf components. The associated economics allow an investment of approximately $12 million to provision a farm that yields 1,000 MT of full-size 5 kg fish and 750 MT of fillet and plate-size fish per annum. This harvest allows revenue streams of between $10 million and $20 million per annum depending upon the harvest and supplementary crop production strategies that are adopted. Yearly operating costs are less than $6 million. Final annual income after costs ranges between $5 million and $13 million, also dependent upon harvest and supplementary harvest strategies. The report concludes that land-based closed containment is technically and economically feasible. Moreover, the design presented if refined would allow for substantial reductions in both capital and operating expenses. The report offers insight into the site criteria for land-based closed containment salmon farms. The report concludes that British Columbia is advantageously provisioned with key attributes that will continue to attract and retain the aquaculture industry.
P a g e | 5
Draft – May 2010
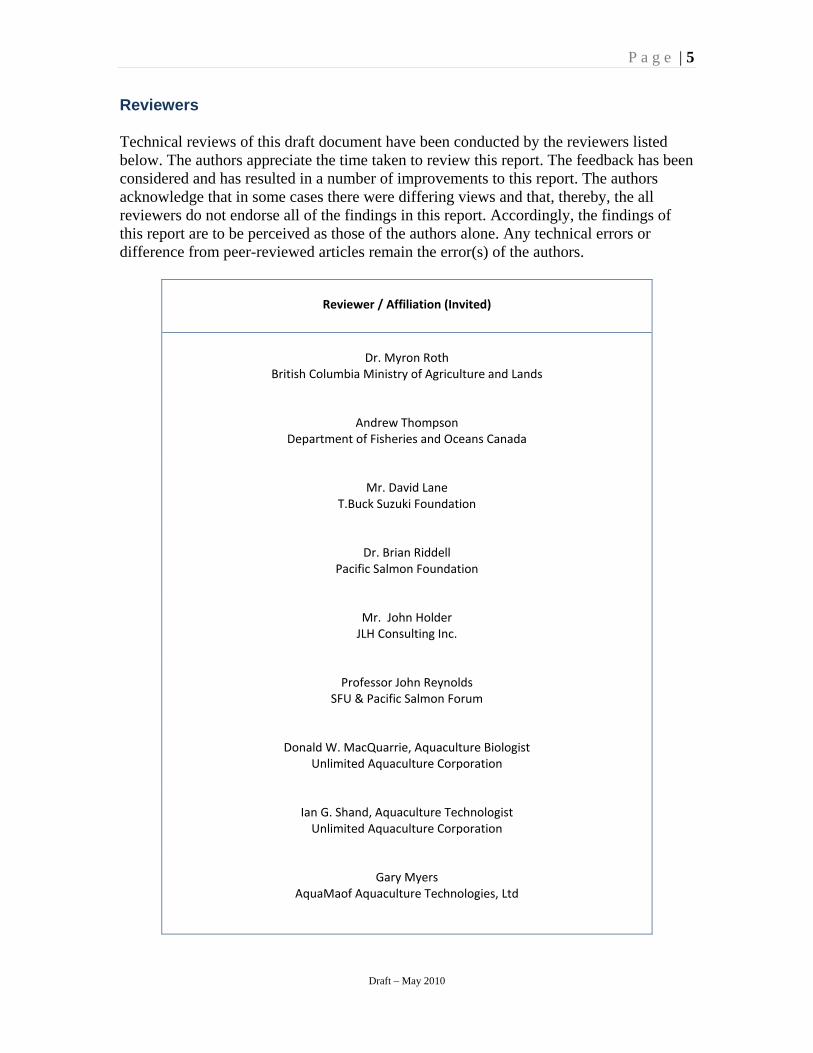
Reviewers Technical reviews of this draft document have been conducted by the reviewers listed below. The authors appreciate the time taken to review this report. The feedback has been considered and has resulted in a number of improvements to this report. The authors acknowledge that in some cases there were differing views and that, thereby, the all reviewers do not endorse all of the findings in this report. Accordingly, the findings of this report are to be perceived as those of the authors alone. Any technical errors or difference from peer-reviewed articles remain the error(s) of the authors.
Reviewer / Affiliation (Invited)
Dr. Myron Roth
British Columbia Ministry of Agriculture and Lands
Andrew Thompson Department of Fisheries and Oceans Canada
Mr. David Lane T.Buck Suzuki Foundation
Dr. Brian Riddell Pacific Salmon Foundation
Mr. John Holder JLH Consulting Inc.
Professor John Reynolds SFU & Pacific Salmon Forum
Donald W. MacQuarrie, Aquaculture Biologist Unlimited Aquaculture Corporation
Ian G. Shand, Aquaculture Technologist Unlimited Aquaculture Corporation
Gary Myers AquaMaof Aquaculture Technologies, Ltd

P a g e | 6
Draft – May 2010
Aquaculture Technology Landscape Open net-pen aquaculture has spurred significant economic growth in the province of British Columbia (B.C.). Arguably, however, this growth has come at the expense of wild salmon stocks. The past decade has seen much debate about ocean aquaculture, resulting in a highly polarized decision-making environment. This document deliberately attempts to set aside these arguments and simply ask several basic questions:
• Has aquaculture technology evolved to permit viable alternative fish rearing methods to open ocean net-pen techniques?
• Has closed containment technology matured and become reliable and established,
or is it still an embryonic technology subject to adoption risk?
• If the technology is viable, is it cost-effective to build and operate a finfish facility using commercial off-the-shelf technology?
It is the authors’ contention that the answer to each of these questions is a resounding yes. This confidence is based upon the prevalence of success in other species and the first viable closed containment salmon farm operations occurring in other jurisdictions. The purpose of this document is to provide sufficient technical support to this emphatic answer to ensure that qualified aquaculture management personnel are confident in raising the operational requirements for the B.C. aquaculture industry. Fundamentally, the goal of this document is to illuminate a viable pathway allowing investment in both wild and farmed salmon stocks for vibrant and sustainable aquaculture and wild fishery industries.

P a g e | 7
Draft – May 2010
Introduction This document approaches salmon aquaculture from the perspectives of fish husbandry and biological security. This approach is taken to avoid the trap of presumptive negative assessments of notional closed containment definitions. Much of this negative assessment has been formulated around specific technical failures that have occurred in previous closed containment trials. A specific example is the oft-quoted belief that pumping water from the ocean to elevated land-based facilities is a fundamental requirement that is economically not viable; hence closed containment is not viable. The statement is correct in part, but an aquaculture closed containment system designer would not approach the design of a farm today in this manner. Substantial technological advancements have occurred and it is these advancements that this report illuminates both at the component and system levels. Figure 1 below is the framework for this investigation. Rather than considering closed containment versus open net-pen, it is valuable to consider a continuum of technologies ranging from open net-pens in the ocean through to land-based systems. Furthermore, if the basic requirements of fish husbandry and biological security are to be considered as basic measures of performance, consideration needs to be given to what advantages are conferred by specific technology components, and how well they function within a specific system design. Figure 1: Conceptual / Preliminary Technology Continuum.

P a g e | 8
Draft – May 2010
Figure 1 articulates many predetermined assumptions and requirements. For example, the introduction of a solid wall vessel into the ocean environment to contain fish immediately reduces the potential for fish escapes, but does little to alleviate other biosecurity concerns if water is simply exchanged unfiltered with the ocean. The introduction of a solid wall also immediately implies that for good fish health, oxygenated water needs to be supplied by means of a pump, inferring power operating costs, back-up generators and / or liquid oxygen availability, etc. Changes to the baseline open net-pen technology, therefore, come at a cost. This is only true for certain aspects of operation, however. Biological security, defined by a range of parameters, is non-existent in an ocean net-pen, leaving the operator exposed to a huge “value at risk”, for whole harvests of cohorts can be lost due to disease outbreak. Moving to full land-based recirculation closed containment systems allows these issues to be effectively eliminated and permits the production of drug and chemical therapeutic-free fish; fish that will command a premium in today’s growing health and environment-conscious market. The continuum presented in Figure 1 is focused upon the immediate concerns of fish husbandry. A broader perspective would also include, but not be limited to: global warming potential, eutrophication potential, acidification potential, marine ecotoxicity potential, abiotic depletion, human toxicity potential, and cumulative energy demands. Thus wider investigation is warranted, for it is valid to assess both global and local cost-benefit issues when embracing a new potential solution. An example of this broader assessment would be to ascertain the balance between utilizing green hydropower to power fish farms and burning diesel fuel in ships to deliver feed and harvest fish in the ocean. However, these questions are beyond the scope of this report, which is simply focused upon the technical and economic feasibility of land-based closed containment for salmon farming. By examining the continuum in Figure 1, it can be clearly seen that an almost infinite number of cost-benefit combinations can be imagined as functions of specific component choices and operational design. To escape this burden, the investigation follows the following pathway:
• A brief review of basic fish husbandry and biological security requirements;
• Examination of technology components that address specific husbandry or biological security requirements;
• Examination of a conceptual closed containment design for land-based operation;
• Preliminary capital and operating expense calculations for the design.
The investigation concludes by providing suggestions for public policy makers that would result in a vibrant and more secure aquaculture economy in B.C.

P a g e | 9
Draft – May 2010
Basic Fish Husbandry Requirements A viable closed containment salmon farm cannot be designed without a deep understanding of fish husbandry needs. These needs range from those that might be intuitive to a layperson, to species-specific physiological needs that require a great deal of biological expertise. This section of the report provides a brief synopsis of the basic fish husbandry needs that must be satisfied. The section is intended to provision the reader with the basic biological knowledge required to appreciate why a particular component is needed in the design of an operating farm. Fish support themselves by consuming food and oxygen. The by-products from this process are carbon dioxide, ammonia and solid wastes. Within a contained body of water, the inputs, feed and oxygen, will become depleted while the wastes, carbon dioxide, ammonia, and solids, will steadily increase. Naturally, fish will die if the inputs are not sustained, and sustaining the supply of offered food and oxygen will cause the concentration of wastes to increase. Ammonia, solids, and carbon dioxide are each lethal to fish at specific concentrations and are detrimental to fish health at lower concentrations. The challenge is to design a treatment plant for the culture volume containing the water and fish that can remove the waste products from the water volume as fast as they are generated and replenish the oxygen. Feed must also be supplied by an independent feeding mechanism. Air is approximately 21% oxygen, but oxygen is only slightly soluble in water and fish have to expend calories to extract the oxygen from water. Furthermore, water salinity, temperature, and barometric pressure all impact dissolved oxygen levels in water. For salmonids to remain in good health, the depleted water drawn from the tank should exhibit dissolved oxygen levels of no less than 6-8 mg/L. Thus, technologies are required to re-inject oxygen into the water body in a recirculating system to ensure that this minimum level is maintained. Total oxygen consumption is directly related to the amount of food that the fish consume. Salmonids require approximately 0.6 g of oxygen per gram of consumed food. Estimating oxygen demand can therefore be seen to require both consideration of total lifetime demands and accommodation of behavioural variability around peak and minimum consumption. Pressurized oxygen injection cones, low head oxygenators, pressure (or vacuum) swing oxygen generators, and standby liquid oxygen canisters all permit this requirement to be satisfied. Carbon dioxide (CO2), a by-product of breathing and food consumption, is returned into the water by the fish. This gas is highly soluble in water. At low concentrations carbon dioxide is tolerated by fish; however, as concentrations increase it suppresses respiration efficiency and lowers the tolerance of the fish to low oxygen levels. At high concentrations, CO2 limits the ability of the gills to unload carbon dioxide back into the water, which in turn causes blood stream carbon dioxide levels to increase. This lowers blood stream pH, ultimately leading to respiratory acidosis and causing extreme stress to the fish. Consequently, an upper limit of dissolved carbon dioxide of 15-20 mg/L is recommended to ensure good fish condition. It should be noted that the pH of the water body is a very important factor in the management of carbon dioxide levels. Due to the
P a g e | 10
Draft – May 2010
ease at which CO2 dissolves into water, it quickly forms carbonic acid that, depending upon the alkalinity of the water, will act as reservoir of CO2, sequestered by the mechanics of the carbonate cycle. Total effective dissolved CO2 levels thus very quickly become a function of atmospheric pressure and the water body pH. Fortunately, this is a very well-understood dynamic chemical equilibrium and is readily addressed through packed or spray degassing towers and forced air blowers. The specification of the degassing CO2 removal tower is derived on the basis that each kilogram of consumed oxygen creates 1.35 kg of carbon dioxide. Ammonia (NH3) is toxic to fish at extremely low concentrations and must be removed rapidly. It is produced because nitrogen, an essential nutrient consumed in food, is only required in low quantities by fish. Consequently, excess nitrogen is expelled into the water body through gill diffusion, gill cation exchange, and feces. The dissolved ammonia is removed from the water body through a two-step conversion process to nitrate ions (NO3
-). The conversion is provided by nitrosomonas and nitrobacter bacteria, which convert the ammonia to nitrite (NO2
-) and then to nitrate (NO3-). A range of
biofilter technology is available to support this conversion; moving bed bead filters, rotating contactors, and fluidized bed sand filters are three examples of the many successful designs. The biofilter is a critical component of a closed containment system and the provisioning of the oxygen generators must take into account the oxygen demand of the nitrifying bacteria. Biofilter sizing is computed from the basic knowledge that 1 kg of consumed feed at 45% protein will generate approximately 45 g of ammonia. When steadily acclimated, fish can tolerate high concentrations of nitrate, but high concentrations do lead to poor fish condition. Removal of nitrate in brackish and sea water systems is achieved by utilizing a denammox process [Tal et al, 2009]. For freshwater systems, the optimal solution is to integrate aquaponics into the farm design, for the nitrate-laden wastewater is a valuable resource that can be utilized to grow crops. Almost 70% of the nitrogen bound in the original food source is still available and contained in the wastewater. For each kilogram of consumed feed, fish tend to create 0.25 kg of solids in the water volume. These solids need to be rapidly removed because they impact the performance of all components within the farm’s treatment processes. The suspended solids are comprised of feces, biofloc, and uneaten food. These particulates vary in size from millimetres to microns. High concentrations of fine solids are particularly detrimental to fish health because they can impair gill function by smothering and can promote the proliferation of pathogens by providing habitat. Solids are removed by a combination of technologies that include drum and conveyor filters, swirl separators, foam fractionators, and simple settling ponds and basins. The water quality and fish chemistry outlined here barely scratches the surface of the complexity of fish husbandry and its many associated issues. It is hoped, however, that this section conveys a basic understanding and appreciation for the water quality requirements that must be provisioned to ensure good fish health and growth.
P a g e | 11
Draft – May 2010
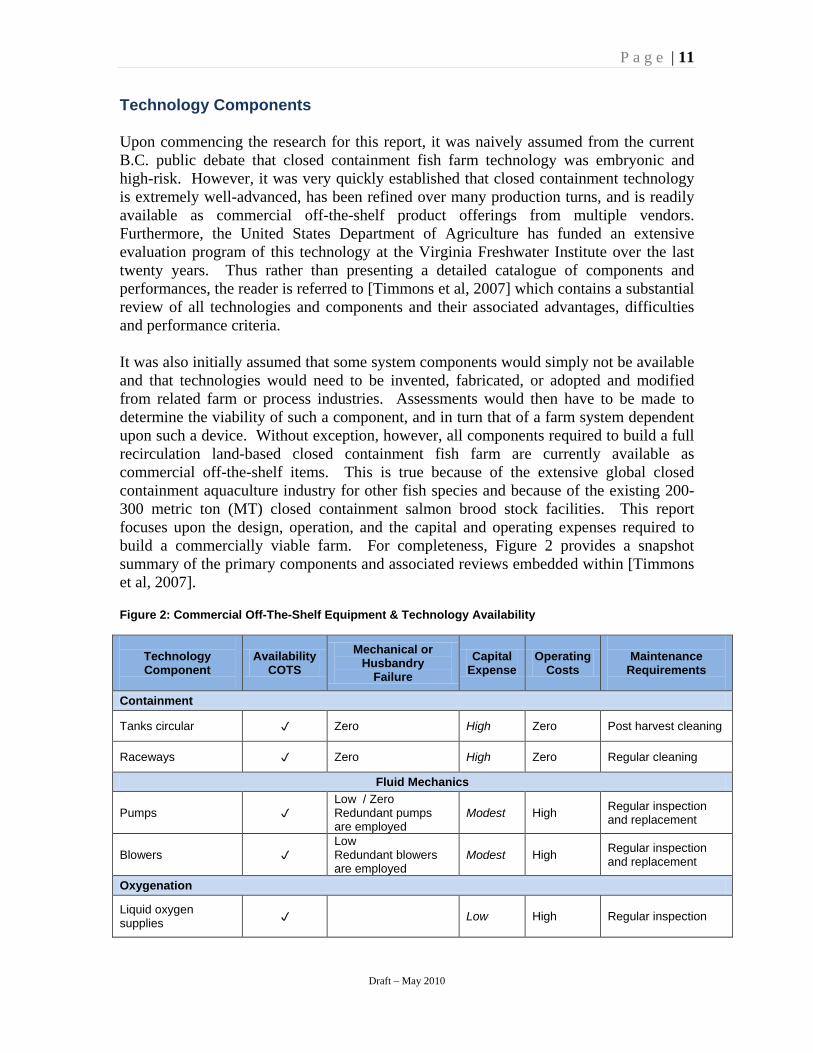
Technology Components Upon commencing the research for this report, it was naively assumed from the current B.C. public debate that closed containment fish farm technology was embryonic and high-risk. However, it was very quickly established that closed containment technology is extremely well-advanced, has been refined over many production turns, and is readily available as commercial off-the-shelf product offerings from multiple vendors. Furthermore, the United States Department of Agriculture has funded an extensive evaluation program of this technology at the Virginia Freshwater Institute over the last twenty years. Thus rather than presenting a detailed catalogue of components and performances, the reader is referred to [Timmons et al, 2007] which contains a substantial review of all technologies and components and their associated advantages, difficulties and performance criteria. It was also initially assumed that some system components would simply not be available and that technologies would need to be invented, fabricated, or adopted and modified from related farm or process industries. Assessments would then have to be made to determine the viability of such a component, and in turn that of a farm system dependent upon such a device. Without exception, however, all components required to build a full recirculation land-based closed containment fish farm are currently available as commercial off-the-shelf items. This is true because of the extensive global closed containment aquaculture industry for other fish species and because of the existing 200-300 metric ton (MT) closed containment salmon brood stock facilities. This report focuses upon the design, operation, and the capital and operating expenses required to build a commercially viable farm. For completeness, Figure 2 provides a snapshot summary of the primary components and associated reviews embedded within [Timmons et al, 2007]. Figure 2: Commercial Off-The-Shelf Equipment & Technology Availability
Technology Component
Availability COTS
Mechanical or Husbandry
Failure Capital
Expense Operating
Costs
Maintenance
Requirements
Containment
Tanks circular Zero High Zero Post harvest cleaning
Raceways Zero High Zero Regular cleaning
Fluid Mechanics
Pumps Low / Zero Redundant pumps are employed
Modest High Regular inspection and replacement
Blowers Low Redundant blowers are employed
Modest High Regular inspection and replacement
Oxygenation
Liquid oxygen supplies
Low High Regular inspection

P a g e | 12
Draft – May 2010
On-site oxygen generation
Low / Zero Redundant generators are employed
High Low Regular inspection
Oxygen injection cones Zero Low Zero None
Low head oxygenators Zero Moderate Zero None
H20 Sterilization
UV Zero High Low / Zero Regular inspection Bulb replacements
Ozone generation Low Moderate Low / Zero Regular inspection
Ammonia Removal Biofilters
Floating bead Low Modest Low Regular inspection Yearly replacement of beads
Rotating contactors Low High Low Regular inspection
Fluidized bed Low High Low / Moderate
Regular recharge of sand
CO2 Removal
Packed degassing columns Zero High Low /
Moderate
Yearly exchange or scrubbing of bio media
Unpacked degassing columns Zero High /
Moderate Low / Moderate Zero
Solids Removal
Swirl separators Zero Low Zero Zero
Drum filters Low Dual redundant filters to be employed
High Low Regular inspection and wearing parts replacement
Conveyor filters Low Moderate Low Regular inspection and wearing parts replacement
Foam fractionators Zero Low Very low Regular inspection and cleaning
Settling tanks Zero Moderate Zero Zero Regular purge
Misc.
Robotic feeding systems Low High Low
Regular inspection and wearing parts replacement
Computer control and water quality monitoring
Low High Low / Zero Regular inspection software upgrades
Water piping and valves Zero Moderate Zero Zero
Back-up power generators
Low / Zero Redundant generators are employed
High Zero Regular inspection

P a g e | 13
Draft – May 2010
Evaluation of a Land-Based Full Recirculation Fish Farm Design Design Philosophy: The design approach articulates a land-based recirculation salmon farm defined by the following principals:
• Biosecurity, disease transfer to / from wild stock, must be improbable;
• Quality fish husbandry conditions must exist;
• Design steps that decrease operating expenses are preferentially adopted over
lower capital expenditure design choices;
• Localized environmental protection must be ensured, i.e. all effluent is harmless;
• Minimized make-up water supply consumption is assumed, to enable a wider
range of operating locations.
The design articulated in this report is for a farm producing 1,000 MT of full-grown 5 kg fish annually in addition to a supplementary harvest of 500-750 MT of early harvest fish ranging in weight from 3 kg to 4.5 kg. Thus, the design yields a maximum of 1,750 MT per annum. The production yields are based upon a farm design that supports a standing biomass fish density of 50 kg/m3. In practice, the pre-harvest biodensity will approach 55 kg/m3 in the harvest grow-out tanks, while overall average farm density will not exceed 46 kg/m3. Post-harvest, the average biodensity falls to a notional 20 kg/m3. The 1,000 MT farm is comprised of ten 100 MT production modules which are bio-isolated to protect against total production loss in the event of an internal infectious disease outbreak that may occur due to pathogens introduced via egg-line or broodstock, or resulting from stress-inducing conditions. All water pathway mechanisms are therefore constrained to each production unit. Equipment such as power generators and oxygen generators are scaled across the entire farm. This design permits a fairly optimal capital expenditure regime, as equipment pricing reaches economic scale for water pathway equipment below 100 MT, while oxygenation equipment reaches economic scale at farm size. For example, multi-ton oxygen generators suitable for a 1,000 MT farm are cheaper than buying multiple smaller units to service a single production unit, while water equipment such as drum filters and swirl separators are currently sized for installations of approximately 100 MT in size. Component and equipment selection are huge factors in the operating costs of the farm. When choices are available for this design, those that offer lower operating costs are always preferentially selected, despite potentially higher capital costs. This choice is made because the useful working life of the equipment over which it may be amortized is at least 20/5 years and year-over-year profits are critically dependent upon operating costs. The amortization period considered is twenty years for non-mechanical components such as tanks and five years for active mechanical devices such as drum filters, blowers, and pumps.

P a g e | 14
Draft – May 2010
It is important to note that the design articulated in the following pages has been architected to support both freshwater and brackish water (10-11 ppt salt) operation (sea water is 30-35 ppt). This design permits the production of either Atlantic or Pacific salmon species to be considered. It also provisions the farm operator with an economic production choice; through deliberately increasing capital and operating costs, aquaponics can be utilized to yield higher profits. Aquaponics involve using the nutrient flow embedded in the recirculating water for the production of a crop such as lettuce or tomatoes. Alternatively, the time to first harvest can be shortened by utilizing a brackish water rearing environment. As will be demonstrated, the inclusion of aquaponics within a freshwater production regime significantly improves revenue and profits.
Production Strategy The design (and equipment sizing) of the farm is dependent upon the chosen production strategy. Closed containment land-based fish farming permits a break from the batch processing method that is utilized in open net-pen aquaculture. The ocean-based production strategy simply stocks the farm once with smolts that weigh between 100 and 200 grams and allows the fish to completely grow out to 5 kg within a production unit over an 18-month period. Lower ocean temperatures that vary between 2oC and 9oC are what define this ocean growth period. [Stead et al, 2002] documented variability in marine growth of Atlantic salmon using industrial farming production as the base reference and demonstrated that fish growth is impeded by seasonal variation in water temperature. Ocean-based production strategies are therefore based on a simple batch process approach and the growth rates attained are dependent upon ocean temperature. To maximize utilization of capital assets, minimize energy costs, and provide a steady production harvest, closed containment readily allows a continuous sequential harvest strategy to be employed. For the purpose of the analysis presented in this document, a grow-out period of 18 months, identical to that experienced in the ocean, will be utilized. It should however be recognized that closed containment does offer the potential to minimize the time to first revenue by utilizing higher temperatures and optimal salinity conditions to increase growth rates. Brackish water combined with higher temperatures, or freshwater combined with higher temperatures both offer the potential to increase growth rate. Figure 3 documents the growth rates for Atlantic salmon at 10oC for a range of thermal growth coefficients. The curves are computed according to the equation below which can be found in [Stead et al, 2002].
Final Weight = (start weight1/3 + GF3 x TotalSumTemperature /1,000)3 Where GF3 is the defined thermal growth coefficient and TotalSumTemperature is expressed as degree days.

P a g e | 15
Draft – May 2010
Examining the curves for a range of GF3 coefficients between 2.25 and 2.75, it can be seen that 5 kg fish can be expected to be grown in 18 months or less. This range of GF3 coefficients is at the lower end of the range reported by [Stead et al, 2002]; values for GF3 can exceed 3.0 in optimal ocean conditions [Stead et al, 2002]. Assuming steady temperatures of 9–10oC in the closed containment environment, it is reasonable to expect 5 kg fish in less than 18 months. The continuous sequential harvest approach is defined through examination of growth rate curves for Atlantic salmon (Figure 3). The method exploits non-linear fish growth, as the bulk weight gain occurs in the last third of the harvest period as the fish are fattened for market. Figure 3: Growth Rates for Atlantic Salmon
Continuous sequential production splits the fish stock into six growth classes staggered at 3-month intervals over the 18-month growth phase. This will yield four harvest periods per annum, each separated by 13 weeks, with the first harvest occurring after 18 months. Figure 4 illustrates an exemplary tank and farm module layout for a 100 MT farm module. Octiform tank construction technology is utilized to construct dual drain Cornell design tanks because the construction technology allows a volume of 2,000 m3 to be comprised of ten 200 m3 tanks augmented with gated swim ways between each tank, a design that is easily fabricated.

P a g e | 16
Draft – May 2010
Figure 4: Tank Layout for Sequential Fish Growth
The growth and harvest of fish via the continuous sequential production method occurs in the following manner. The ramp to production starts by stocking an excess of fingerlings or smolts into the rearing tanks. As the fish grow, they are moved sequentially through the farm into larger and larger water volumes that are commensurate with their growth. In the example design presented, one 200 m3 culture tank is dedicated to the first growth quarter (weeks 0-13), and a second 200 m3 culture tank to the subsequent growth quarter (weeks 13-26). For the third and fourth growth quarters (weeks 26-52), two 200 m3 culture tanks comprising a total of volume of 400 m3 are utilized. For the penultimate quarter (weeks 52-65) and the last growth quarter (weeks 65-79), three 200 m3 tanks comprising 600 m3 of culture volume for each growth period are employed. Thus, a total 2,000 m3 culture volume is allocated between ten tanks and six distinct growth phase classes of fish.

P a g e | 17
Draft – May 2010
The farm is designed to support a biomass loading of 50 kg/m3; therefore, the initial fish stock numbers are selected such that as the fish enter the last growth quarter at approximately 3 kg, the harvest tanks achieve peak loading. This requires that a quantity of 3 kg fish is harvested to reduce the system loading and allow for further growth by the remaining fish. The total fish population is reduced and harvests occur at fish weights of 3.5 kg, 4 kg, and 4.5 kg, in addition to the final target weight of 5 kg. The harvests occur to ensure that the system biomass loading does not exceed 50 kg/m3. They allow enhanced profitability for the return upon capital costs and operating costs because the farm is running at peak biomass level for a longer period of time. Figure 5 illustrates that the initial stocking should provision the fingerling tanks with 10,000 fish. As these fish reach a target weight of 3 kg and enter the final harvest tanks five quarters later, the 600 m3 of culture volume will have reached the maximum serviceable biomass capacity of 50 kg/m3. Thus, 1,429 fish will need to be harvested early in order to allow the necessary growth space for the remaining fish to grow to 3.5 kg. At 3.5 kg the maximum serviceable biomass will again have been reached, requiring a second harvest of 1,071 fish at a weight of 3.5 kg. This process continues until 6,000 fish at a weight of 4.5 kg remain that can grow to a full harvest weight of 5 kg. Figure 5: Harvest Weight and Fish Numbers
Fish Weight
(kg)
Number of Fish
Density
Harvest
No.
Harvest
Weight (kg)
3 10,000 50 1,429 4,286 3.5 8,571 50 1,071 3,750
4 7,500 50 833 3,333 4.5 6,667 50 667 3,000
5 6,000 50 6,000 30,000
Total Harvest Weight 44,369 The three harvest tanks (600 m3) are therefore essentially always operating close to the target biomass density of 50 kg/m3. This deliberate combination of overstocking, early selective harvest, and sequential operation permits a farm sized for a biodensity of 50 kg/m3 and a volume of 2,000 m3 to yield 44 MT of fish each quarter (176 MT yearly yield). This yield is reached once the initial 18-month grow-out phase (production ramp) has been completed. The farm therefore yields a harvest of 44 MT per quarter or 176 MT per annum comprised of 100 MT per annum of full-size 5 kg fish and 75 MT per annum of smaller 3-4.5 kg fish. This range of harvest fish weights can be marketed to a variety of market segments ranging from whole fish to single serving fillets on cedar plank.

P a g e | 18
Draft – May 2010
After the final full-weight harvest and with the last three tanks empty, a bubble or air curtain can be used to herd / migrate the fish from the growth tanks through the swim ways and into the harvest tanks. Once this has occurred, the swim ways can be gated and the more juvenile fish migrated in a similar manner from the stocking tanks to the growth tanks. A favourable attribute of this approach is that the stocking density can be readily adjusted for the number of fish by utilizing the appropriate number of tanks. For example, just after harvest only seven tanks might be employed. This permits optimized feeding regimes and the ability to fine-tune fish husbandry and to reduce operating costs by slowing pumps to empty tanks. Furthermore, placing grading grates in the swim ways allows the fish to be graded without ever handling or stressing the fish. The grates can also allow faster-growing fish to be promoted, while fish exhibiting slower growth rates can be held back. The continuous harvest approach allows for splitting of the five harvests that occur each quarter into finer granularity, providing stable market availability. The connected tanks make this a relatively easy operational choice. A final and important point to note is that the delay between final farm commissioning and the first operational revenue is five quarters with quarter-over-quarter profitability only being reached after the first full 18 months of operation. It is interesting to note that once full production capacity has been reached and harvests are occurring on a regular quarterly basis, the overall growth period of the fish becomes somewhat irrelevant, as the costs are directly related to total fish growth (feed and power), rather than time. The important financial observation is that the capital costs should include the operating costs for the first 18 months before the first harvesting begins and revenues are captured.

P a g e | 19
Draft – May 2010
Design Targets Figure 6 below illustrates the target fish stocking density and water quality metrics that are required within the fish culture tanks to ensure healthy fish. These targets are known to be aggressive and are selected to ensure that the running costs of the farm are not underestimated. In addition, deliberately over-designing the farm module allows peaks in system demand due to fish behaviour, such as oxygen demand during and after feeding and peak ammonia production, to be readily handled. Finally, the over-design ensures that the critical operating costs are not underestimated.
Figure 6: Water Targets for Fish Husbandry
Parameter
Specification / Requirement
Stocking density 50 kg/m3
Water temperature 8-10oC
Dissolved oxygen, DO2
15.0 mg/L ingress 8.0 mg/L egress
Dissolved carbon dioxide, DCO2
6.35 mg/L ingress 20.0 mg/L egress
Ammonia concentration, NH3
0.7 mg/L ingress 1.0 mg/L egress
Total suspended solids
2.5 mg/L ingress 10.0 mg/L egress
Salinity (optional)
10-11 ppt
The selection of these target environmental parameters is based upon applying an increased design margin (safety buffer) over published data [Timmons et al, 2007] for other cold-water species, with particular reference to other salmonids such as rainbow trout, as well as to data published for Atlantic salmon [Stead et al, 2002]. The selection of these parameters has critical implications for the operating costs of the farm because these target parameters explicitly dictate at what rate water has to be removed from the culture tanks and returned, replenished, to the fish. The rate of water transfer is naturally proportional to power and pumping costs and to the sizing of equipment such as drum filters and biofilters.

P a g e | 20
Draft – May 2010
The computation of the basic flow rate for a full recirculation system is derived from mass balance equations and the basic physiology of the fish. As defined in [Timmons et al, 2007], the following relationships are true: for each kilogram of food that is consumed, a specific amount of oxygen is consumed and in turn carbon dioxide, ammonia, and suspended solids are produced. Thus, the metabolic rate of the fish defines the rates of oxygen consumption and waste production, which in turn define the rate at which the water must be replenished with oxygen and scrubbed of waste(s). Figure 7 illustrates the approach as described in [Timmons et al, 2007]. A treatment box must be introduced to process the culture water so that the target water quality parameters are maintained at the levels defined by Figure 6. Figure 7: Mass Balance Equilibrium
CultureTank
Power Feed WaterHeat
Treatment Plant
T-effDO 70% Oxygen Injection
DCO2 70% strippingDNH3 -> NO3 30% Conversion
TSS 75% removal
Waste EquipmentDrum Filters, BioFilters
LHOs, Foam fractionatorsDegassing towers etc
High CO2, NH3, TSS
Low O2
High O2
Low CO2, NH3, TSS
Increased NO3-
Solid Waste
Q
C1C2P

P a g e | 21
Draft – May 2010
The flow rate (Q) into and out of the culture tank for a recirculation system is the same as the flow rate out of and into the treatment box. The treatment box must reduce the concentration (C1) of production wastes (CO2, NH3, and solids) and replenish O2 as fast as the culture tank produces waste (P) and consumes O2 if equilibrium is to be maintained. If the flow rate is too slow or the processing within the treatment plant ineffectual (i.e. T-eff is too low), water quality will degrade. Consequently, fish will become stressed and their health compromised, and they will ultimately die if the conditions persist. Alternatively, fast flow rates and high treatment plant processing efficiencies ensure fish health, but will consume excess power, increase operating expenses, and will require oversized equipment, thus incurring excess capital costs. Sizing of farm flow rates and equipment is thus a balancing act between these constraints. It should be noted that excess flow rates would also compromise the ability of fish to effectively rest, thus negatively impacting fish condition. Fortunately, power consumption concerns are a stronger constraint, preventing this unique condition from occurring. To size the flow rates and influent concentrations (C2) using mass balance equations, the fish metabolic data defined in Figure 8 below are required. The raw data are available in [Timmons et al, 2007]. Figure 8: Metabolic Conversion Rates
Parameter
Empirical Value
Feed conversion rate
1.2x Current industry standard
kg O2 Requirement f(feed, metabolism)
0.72x = 1.2 * 0.6 * total feed weight Feed conversion factor *O2 consumption rate
kg CO2 Production rate f(O2, metabolism)
1.375 *x O2 kg x O2 consumption rate
kg NH3 Production rate f(feed, metabolism)
0.045x = 0.45 * 0.1 * total feed weight Protein content in feed * NH3 conversion rate
kg Total suspended solids production f(feed)
0.25 * total feed weight Fraction of feed converted to solid waste
It is important to note that the rates of oxygen consumption and CO2 production defined above are general guidelines for the majority of fish species feeding on high carbohydrate diets. For salmon feeding on high protein diets, these guideline numbers overestimate the oxygen requirements and associated CO2 production [Forsberg, 1997] and [Forsberg, 1994]. This in turn causes power consumption estimates for oxygen generation and delivery, and for CO2 stripping by air blowers, to be lower than estimated. However, for the purposes of this work the guideline numbers in Figure 8 will be utilized, for they
P a g e | 22
Draft – May 2010
allow operating headroom within the farm to allow for production densities that exceed the target 50 kg/m3 design specification. In practice, pumps, blowers, and oxygen delivery can all be controlled / fine-tuned to optimum levels. The design and construction of the farm is determined by computing the overall flow rates that satisfy the conditions and constraints specified in Figure 6 and Figure 8. This is achieved by solving mass balance equations for each of the four fish husbandry processes. The farm module system flow rate is then defined as the highest of these flows. To make the mathematics tractable to the casual reader, the results are tabulated in the following pages for a unit system comprising a culture tank volume of one cubic metre containing 50 kg of biomass. This is comparable to other species that have been successfully grown in recirculating aquaculture systems and is lower than the 100 kg/m3 density employed for the rearing of smolts at Target Marine products in Sechelt. It is important to note that this stocking density is higher than open net-pen farming and is permitted by elevated dissolved oxygen levels in the water body. Flow rates are defined as a percentage of tank volume/minute. This permits rapid scaling and assessment for any culture volume albeit farm module or the full farm. Computations for complete mass balance mathematics pertaining to the unit (50 kg/m3), farm module (100 MT/2,000 m3), and full farm (1,000 MT/20,000 m3) are scaled from these basic calculations. Readers requiring a more detailed computational description are referred to [Timmons et al, 2007]. All calculations made in this report are computed in accordance with the science and mathematics documented in [Timmons et al, 2007]. The final flow rates and key assumptions are defined overleaf in Figure 9.

P a g e | 23
Draft – May 2010
Figure 9: Mass Balance Flow Rate Results
Flow Rate Process
Computed Flow Rate
Mass Balance Equations
Assumptions / Data / Constraints
Oxygenation (O2) replenishment
12.2 L/min 1.22% culture vol/min
O2 injection efficiency = 90% Csat O2 = 18 mg/L Sea level design = 0.0 ft asl Temperature = 150C Oxygen cone pressure = 20 psi
Carbon dioxide (CO2) removal
8.6 L/min
0.86% culture vol/min
Spray column stripping efficiency = 70% C02 atmospheric = 0.5 mg/L Max CO2 in tank = 20 mg/L
Ammonia conversion to nitrate (NH3 -> NO3
-)
19.0 L/min
1.9% of culture vol/min
Biofilter conversion efficiency = 30% NH3 ideal = 0.0% Protein in feed = 45% Conversion factor = 0.1
Solid waste(s) removal
19 L/min
1.90% of culture vol/min
Solid removal efficiency = 75% Target TSS = 10mg/L TSS best = 0 mg/L Feed conversion = 0.25
Max system flow rate %
2% of culture volume / minute
Max system flow rate
20 L/min for 1 m3 system / 50 kg production per annum 40,000 L/min for 2,000 m3 / 100 MT production per annum 400,000 L/min for 20,000 m3 / 1,000 MT production per annum
Hydraulic retention time
50 minutes

P a g e | 24
Draft – May 2010
Farm Module Design The flow rates defined in the previous section allow equipment sizing to be undertaken for the basic 100 MT farm module. However, although the flow rates are nominally 2% of the culture volume, the variation in flow rate as a function of process, oxygenation, CO2 removal, or waste removal reveals a 2:1 ratio. From an equipment sizing and total power consumption perspective, this represents an opportunity to minimize capital costs and, most importantly, power consumption costs. Figure 10 below illustrates the design approach taken. Rather than a singular treatment process loop running at the highest flow rate, independent flow parallel processes each running at near optimum rates are utilized. This has the potential to save a large amount of power. Figure 10: Full Recirculation Processes
CultureTank
Power Feed Water
OxygenationShort Hydraulic Retention time
Waste RemovalMedium Hydraulic
Retention time
DenitrificationLongest Hydraulic
Retention time
Heat
O2 Saturation
Oxygen EquipmentCompressors, Pressure or
Vacuum swing, LOX oxygen generation
Solids, CO2, NH3->NO3
Waste EquipmentDrum Filters, BioFilters
LHOs, Foam fractionatorsDegassing towers etc
Aquaponic Crops
&Shell & Cray Fish
Production
AnerobicDecomposition
Crops
Heat / Energy
Solid Fertilizer
Nutrient Water
The approach also allows the farm module to be provisioned such that additional cash crop production and energy-saving methods can be readily incorporated. In a freshwater production regime, nitrate-laden water is ideal for aquaponic crops such as lettuce, and solid wastes are a source of energy and fertilizer. Alternatively, ocean vegetables such as kelp could be grown. If a fish-only brackish water production regime is adopted then a denammox fixed-bed upflow filter and biogas reactor can be utilized to perform denitrification [Stead et al, 2002].

P a g e | 25
Draft – May 2010
Construction Utilization of commercial components to create a 100 MT production module is illustrated in Figure 11; for simplicity, only three culture tanks are illustrated. Assuming a continuous sequential production regime with four harvests per annum at peak fish densities that do not exceed 50 kg/m3, a 100 MT farm module requires a total culture volume of 2,000 m3. This will deliver 100 MT of full-size 5 kg fish and an additional supplementary 75 MT harvest of smaller fish. The following farm module description is an empirical blend of choices that attempt to minimize operating expense and wastewater and to contain capital expenses to reasonable levels, while provisioning a viable working farm module. Furthermore, the module is over-designed to provide pristine water conditions and to ensure optimal fish health. When compared to existing operating designs for other species, the design described in this report would appear capital-intensive and over-cautious with respect to pumping rates and equipment utilization. Construction Description: The 100 MT farm module is comprised of ten 200 m3 culture tanks constructed to comply with dual drain Cornell design rules, each provisioned with a swirl separator, foam fractionators, and oxygen injection cones. Clean egress water from the swirl separator is sent to the oxygen injection cones and foam fractionators before re-injection into the main culture tank. Wastewater from the swirl separator from each tank is then aggregated and sent through a second swirl separator before entering a drum filter to eliminate suspended solids down to 60-30 µm in size. The clean egress water is then sent to be processed by a moving bead biofilter and carbon dioxide crown-nozzle stripping tower before entering a low head oxygenator (LHO) for supplementary oxygen injection. The water from the LHO is then polished with foam fractionators using ozone injection for disinfection, which is supported by a subsequent UV disinfection stage. This process allows water quality to remain optimal, thus decreasing the potential for biological or viral infections to occur and in turn reducing stress upon the fish. Stressed fish have reduced immunity and are susceptible to latent pathogens. The rejuvenated water is then pumped to a header tank. Gravity flow from the header tank returns the water to the culture tanks. Wastewater bearing solids from the drum filter is directed to settling tanks. Once settled, these solids can be simply purged and utilized for compost or sent to a biogas reactor, which converts the solids to a combination of methane and carbon dioxide. Denitrification can be achieved for both marine and freshwater systems by employing a sludge digestion tank and a denammox fixed-bed upflow filter [Tal et al, 2009], which converts solid wastes and dissolved nitrates to free nitrogen, water, methane, and sulfur gas compounds. These compounds can be readily captured for subsequent energy use. Alternatively, or in conjunction with denammox filtering, the nitrogen-rich run-off from these tanks can be passed through an aquaponics field to strip nitrate from the fluid. This process offers a huge benefit, as an additional cash crop can be integrated into the farm to recover valuable nutrients by growing produce to capture the value in the “waste” stream. The settling tanks are purged on a regular basis. This is the only water loss mechanism

P a g e | 26
Draft – May 2010
from the system with the exception of evaporation from the system and aquaponic crop uptake (if employed). Figure 11: System Flow and Components for a 100 MT Module
P a g e | 27
Draft – May 2010
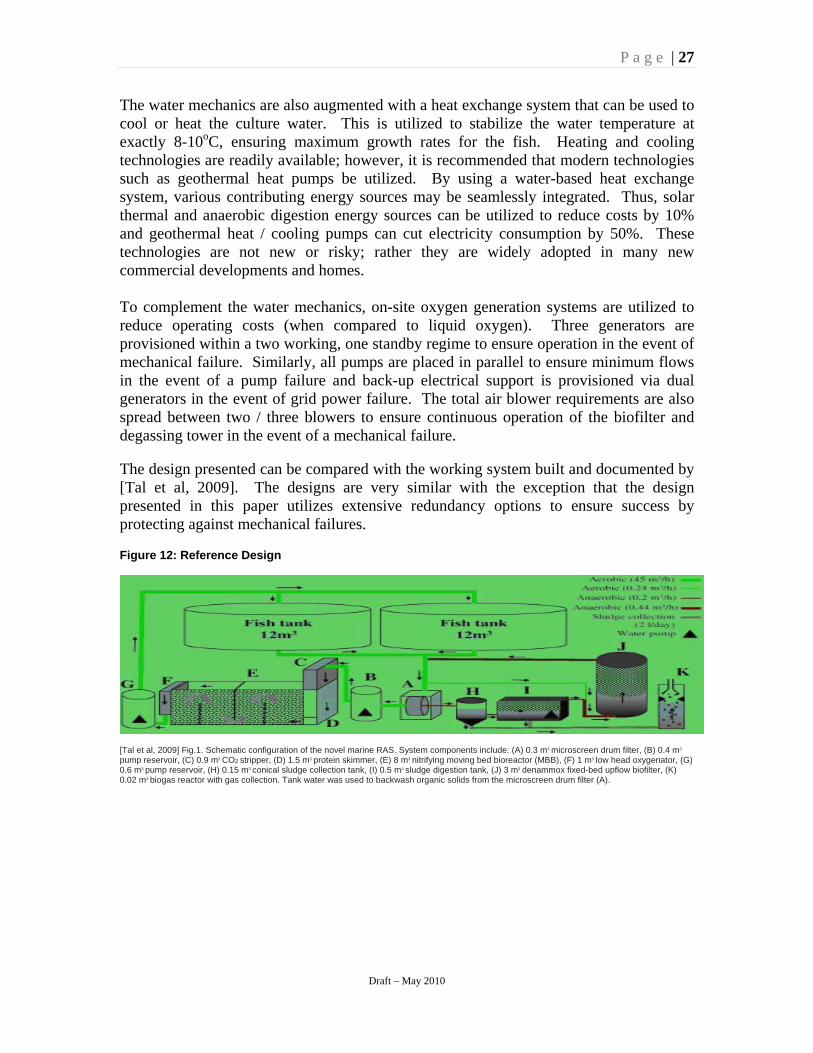
The water mechanics are also augmented with a heat exchange system that can be used to cool or heat the culture water. This is utilized to stabilize the water temperature at exactly 8-10oC, ensuring maximum growth rates for the fish. Heating and cooling technologies are readily available; however, it is recommended that modern technologies such as geothermal heat pumps be utilized. By using a water-based heat exchange system, various contributing energy sources may be seamlessly integrated. Thus, solar thermal and anaerobic digestion energy sources can be utilized to reduce costs by 10% and geothermal heat / cooling pumps can cut electricity consumption by 50%. These technologies are not new or risky; rather they are widely adopted in many new commercial developments and homes. To complement the water mechanics, on-site oxygen generation systems are utilized to reduce operating costs (when compared to liquid oxygen). Three generators are provisioned within a two working, one standby regime to ensure operation in the event of mechanical failure. Similarly, all pumps are placed in parallel to ensure minimum flows in the event of a pump failure and back-up electrical support is provisioned via dual generators in the event of grid power failure. The total air blower requirements are also spread between two / three blowers to ensure continuous operation of the biofilter and degassing tower in the event of a mechanical failure. The design presented can be compared with the working system built and documented by [Tal et al, 2009]. The designs are very similar with the exception that the design presented in this paper utilizes extensive redundancy options to ensure success by protecting against mechanical failures. Figure 12: Reference Design
[Tal et al, 2009] Fig.1. Schematic configuration of the novel marine RAS. System components include: (A) 0.3 m3 microscreen drum filter, (B) 0.4 m3
pump reservoir, (C) 0.9 m3 CO2 stripper, (D) 1.5 m3 protein skimmer, (E) 8 m3 nitrifying moving bed bioreactor (MBB), (F) 1 m3 low head oxygenator, (G) 0.6 m3 pump reservoir, (H) 0.15 m3 conical sludge collection tank, (I) 0.5 m3 sludge digestion tank, (J) 3 m3 denammox fixed-bed upflow biofilter, (K) 0.02 m3 biogas reactor with gas collection. Tank water was used to backwash organic solids from the microscreen drum filter (A).
P a g e | 28
Draft – May 2010
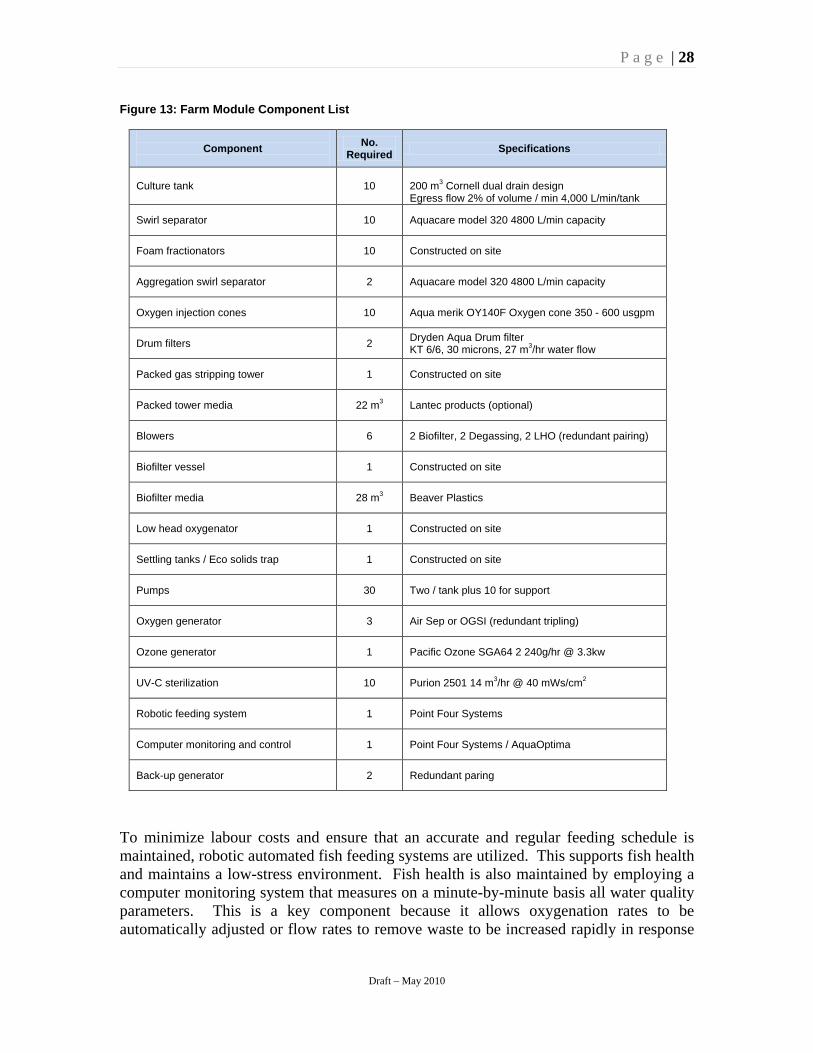
Figure 13: Farm Module Component List
Component
No.
Required Specifications
Culture tank 10 200 m3 Cornell dual drain design Egress flow 2% of volume / min 4,000 L/min/tank
Swirl separator 10 Aquacare model 320 4800 L/min capacity
Foam fractionators 10 Constructed on site
Aggregation swirl separator 2 Aquacare model 320 4800 L/min capacity
Oxygen injection cones 10 Aqua merik OY140F Oxygen cone 350 - 600 usgpm
Drum filters 2 Dryden Aqua Drum filter KT 6/6, 30 microns, 27 m3/hr water flow
Packed gas stripping tower 1 Constructed on site
Packed tower media 22 m3 Lantec products (optional)
Blowers 6 2 Biofilter, 2 Degassing, 2 LHO (redundant pairing)
Biofilter vessel 1 Constructed on site
Biofilter media 28 m3 Beaver Plastics
Low head oxygenator 1 Constructed on site
Settling tanks / Eco solids trap 1 Constructed on site
Pumps 30 Two / tank plus 10 for support
Oxygen generator 3 Air Sep or OGSI (redundant tripling)
Ozone generator 1 Pacific Ozone SGA64 2 240g/hr @ 3.3kw
UV-C sterilization 10 Purion 2501 14 m3/hr @ 40 mWs/cm2
Robotic feeding system 1 Point Four Systems
Computer monitoring and control 1 Point Four Systems / AquaOptima
Back-up generator 2 Redundant paring
To minimize labour costs and ensure that an accurate and regular feeding schedule is maintained, robotic automated fish feeding systems are utilized. This supports fish health and maintains a low-stress environment. Fish health is also maintained by employing a computer monitoring system that measures on a minute-by-minute basis all water quality parameters. This is a key component because it allows oxygenation rates to be automatically adjusted or flow rates to remove waste to be increased rapidly in response
P a g e | 29
Draft – May 2010
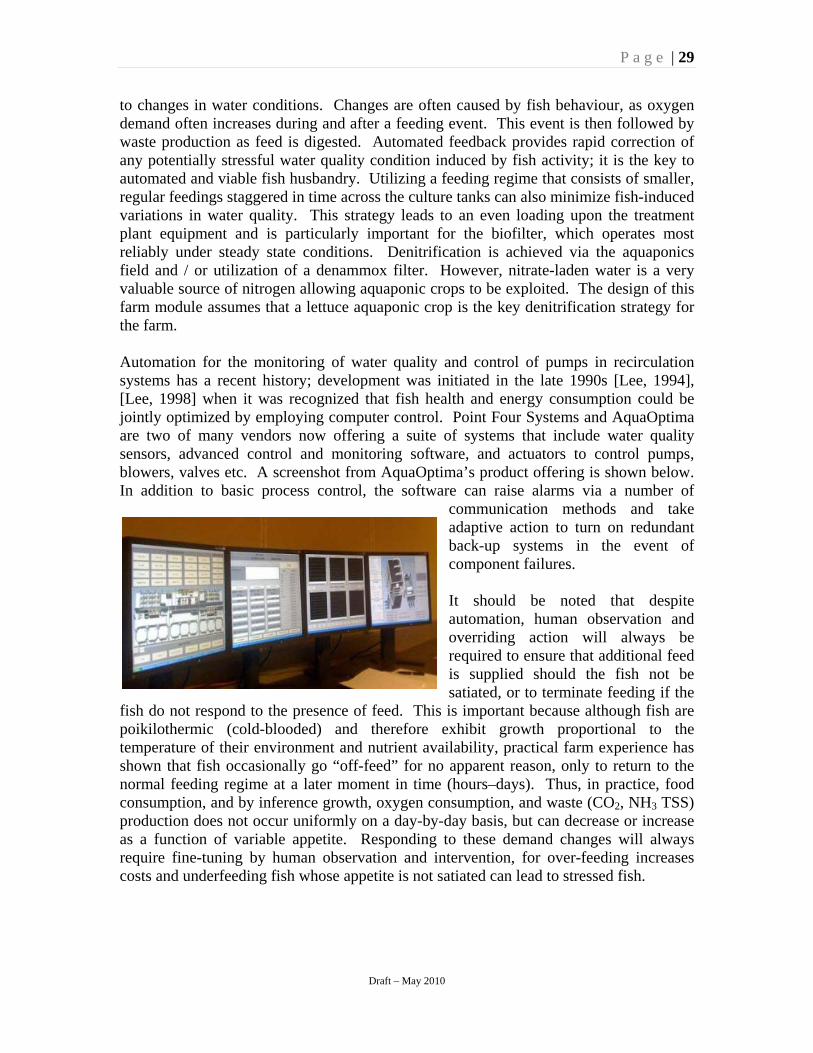
to changes in water conditions. Changes are often caused by fish behaviour, as oxygen demand often increases during and after a feeding event. This event is then followed by waste production as feed is digested. Automated feedback provides rapid correction of any potentially stressful water quality condition induced by fish activity; it is the key to automated and viable fish husbandry. Utilizing a feeding regime that consists of smaller, regular feedings staggered in time across the culture tanks can also minimize fish-induced variations in water quality. This strategy leads to an even loading upon the treatment plant equipment and is particularly important for the biofilter, which operates most reliably under steady state conditions. Denitrification is achieved via the aquaponics field and / or utilization of a denammox filter. However, nitrate-laden water is a very valuable source of nitrogen allowing aquaponic crops to be exploited. The design of this farm module assumes that a lettuce aquaponic crop is the key denitrification strategy for the farm. Automation for the monitoring of water quality and control of pumps in recirculation systems has a recent history; development was initiated in the late 1990s [Lee, 1994], [Lee, 1998] when it was recognized that fish health and energy consumption could be jointly optimized by employing computer control. Point Four Systems and AquaOptima are two of many vendors now offering a suite of systems that include water quality sensors, advanced control and monitoring software, and actuators to control pumps, blowers, valves etc. A screenshot from AquaOptima’s product offering is shown below. In addition to basic process control, the software can raise alarms via a number of
communication methods and take adaptive action to turn on redundant back-up systems in the event of component failures. It should be noted that despite automation, human observation and overriding action will always be required to ensure that additional feed is supplied should the fish not be satiated, or to terminate feeding if the
fish do not respond to the presence of feed. This is important because although fish are poikilothermic (cold-blooded) and therefore exhibit growth proportional to the temperature of their environment and nutrient availability, practical farm experience has shown that fish occasionally go “off-feed” for no apparent reason, only to return to the normal feeding regime at a later moment in time (hours–days). Thus, in practice, food consumption, and by inference growth, oxygen consumption, and waste (CO2, NH3 TSS) production does not occur uniformly on a day-by-day basis, but can decrease or increase as a function of variable appetite. Responding to these demand changes will always require fine-tuning by human observation and intervention, for over-feeding increases costs and underfeeding fish whose appetite is not satiated can lead to stressed fish.

P a g e | 30
Draft – May 2010
Prime Component Sizing: Figure 14 tabulates the component sizing for the various processes and components for the farm module. These results are derived from the mass balance equations needed to support the fish. The table allows capital and operating costs to be assessed. All computations are in accordance with the design principles defined in [Timmons et al, 2007]. Figure 14: Component Sizing
Component
Performance Criteria
100 MT / 2,000 m3 Farm Module
Sizing Specifications
Pump sizing
Flow rate per tank Total module head height Pump efficiency
3.8 m3/min 2 m 40 %
Pump / tank power 4.4 kW Pump / tank power 5.8 HP
Oxygenation sizing
Feed conversion rate Oxygen rate of feed Injection efficiency energy for O2 generation
1.5 0.6 70% 3 kWh/100 scfh
Yearly production of O2 128 MT Yearly production of O2 96,600 m3 Oxygen generator power 12 kW
CO2 packed column degassing tower
Height G/L ratio Max Hydraulic loading rate Required H20 flow rate
1.5 m 10 1.2 m3/m2/min 17.25 m3/min
Distribution plate area 14.37 m2 Required Airflow rate 172 m3/min Blower sizing 37 kW
Drum filter
Filter size Flow rate 5% total vol/hr
<60 um 20 m3/hr
Power 2 kw/ 30 m3/hr 4 kW
UV-C source
Minimum dose 10 mWs/cm2 No. of cycles per day Required flow rate Required no. devices
10 mWs/cm2 6 500 m3/hr 10
Pirion 2501 h UV-C device Device dose 40 mWs/cm2 @ 14 m3/hr Device dose 10 mWs/cm2 @ 56 m3/hr Device power 10* 105 watts = 1.05 kW
Ozone sizing
O3 @ 10 grams/1 kg feed Feed = harvest weight *fcr Minimum required O3
175 MT*1.2 239 g/hr
Pacific Ozone SGA64 O3 delivery 240 g/hr Power 3.3 kW
Floating bead biofilter NH3 -> N03
-
Daily ammonia removal rate NH3 removal rate Media-specific surface area Bio filter media depth Min hydraulic loading Flow into bio filter Media density
16.44 kg/day 0.6 kg/m3/day 2,520 m2 0.75 m 1,600 m3/m2/day 54,800 m3/day 16 kg/m3
Water distribution plate area 36.5m2 Total volume of media 27.5 m3
Heat production
Water temperature Building R (blue poly) HVAC performance Heat pump power savings Seasonal ambient variation
15oC 1.67 km2/W 70% 50% 5oC - 20oC
Total power required < 30 kWh
Land footprint
Design overage (excess over tank area) Tank diameter to depth ratio
1.8x 6
Farm module area 1,610 m2 Farm module area linear 24m x 67m
Hydroponic lettuce production
Yearly feed to fish Growing area conversion
150,000 kg 0.1 kg/d/m3
Supportable growing area 4,100 m2 Linear growing area 64 m x 64 m
Anaerobic energy production
Waste to energy ratio
500 -2,000 kWh/ton
18,500 - 74,000 kWh
Compost production
Feed to solid waste ratio
0.25
37,500 kg/year

P a g e | 31
Draft – May 2010
Total Power Consumption Assessments Figure 15 overleaf tabulates the total power requirements for the major components of the farm module, the 1,000 MT farm, and a 100,000 MT industry that is commensurate with the existing west coast ocean aquaculture industry. The comparisons for equivalent usage tabulated in the last row were compiled using data published directly by BC Hydro in the quick facts section of their website. It is also important to note that the total power consumption estimated in this report equates to 7 kWh/kg for the produced fish. This is higher than that consumed by modern low-head aquaculture farm designs which are estimated to achieve 1.8 kWh/kg to 3.0 kWh/kg production values. Holder Timmons Engineering and AquaMaof Technologies have built these efficient farm designs. Practical consumption should therefore be less than the presented estimates. It is also important to note that these higher power consumption levels are due to the conservative design approach taken in this report, which includes estimates of oxygen consumption and waste production that are higher than the observed values produced by the fish, and the over-provisioning of pump and blower requirements.

P a g e | 32
Draft – May 2010
Figure 15: Total Power Consumption
Item kW /100 MT Module kW /1,000 MT Farm kW /100,000 MT Industry
Pumps 3 m head 44 440 44,000
Pumps 1 m head 10 100 10,000
CO2 blower 37 200 20,000
Oxygenation 12 120 12,000
UV-C 1 10 1,000
Ozone 3.5 35 3,500
Drum filters 4 40 4,000
Lights 10 100 10,000
Ancillary power Approx. 10% total 10 100 10,000
Total Power 131.5 kW 1,000.5 kW 1 MW
100,050 kW 10 MW
Total Annum Power Consumption
1,151,940 kWh 1.2 GWh
11,519,400 kWh 11.5 GWh
1,150 GWh
Total Annum Cost at 0.07 kWh $80,636 $806,358 M $81
BC Hydro equivalent yearly consumption
Approx 80 homes 1 – 2 large office 20-25 floor building(s) 2-3 pulp mills

P a g e | 33
Draft – May 2010
Conclusion Regarding Technology Assessment for Land-Based Recirculating Systems The previous section has documented the design of a hypothetical fish farm consistent with basic principles of fish husbandry. During this process, the flow rates and equipment sizing were undertaken to build practical 100 MT working modules for utilization within a 1,000 MT farm. Sizing the components was a revealing exercise, for, without exception, all required technologies and components are readily available in the marketplace. Furthermore, the components are appropriately sized for 100 MT farm modules and are available as commercial off-the-shelf items. This availability exists because closed containment recirculating aquaculture is currently a mainstream industry for other species of fish. More importantly, closed containment recirculating aquaculture exists in the salmon industry, for it is readily employed for 300 MT broodstock hatcheries which grow fish to fingerling and full-size as an integrated production function of the existing salmon aquaculture industry. Thus, it can be concluded that there are no technological barriers to developing land-based closed containment full recirculation aquaculture facilities for salmon production.

P a g e | 34
Draft – May 2010
Farm Site Criteria
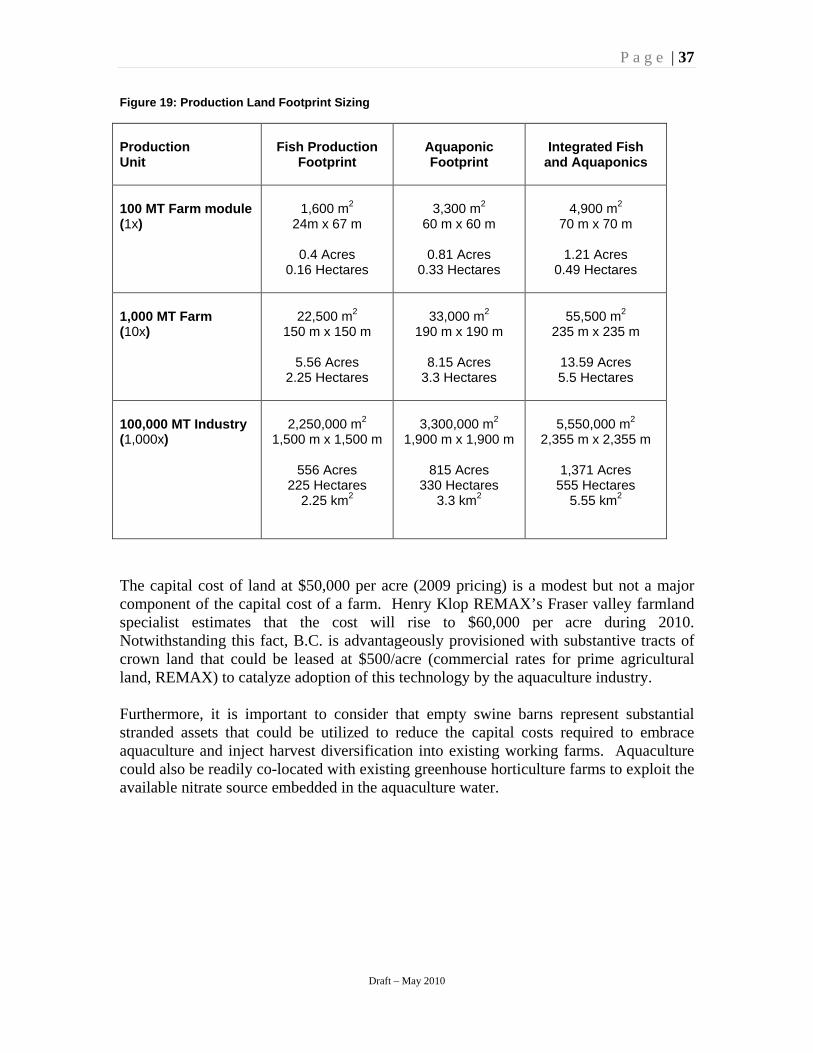
Land Utilization Access to land is often considered a capital cost impediment to the utilization of land-based aquaculture. Fortunately, site criteria analysis reveals that the footprint size is substantially smaller than anticipated. Figure 19 tabulates the land utilization requirements. It is revealing that a 100,000 MT closed containment industry can be located on approximately two square kilometres of land, and on less than four square kilometres if aquaponics are included. Figure 16 is an accurate scale drawing of the land-use footprint for all components utilized in the construction of a 100 MT farm module. The footprint assumes that the farm module is contained in a coverall building with access at both ends. It is also provisioned with a central working access area allowing fish husbandry and harvesting to occur on a tank-by-tank basis. Figure 16: 100 MT Farm Module Land Footprint
Water plumbing and Oxygen Gas Delivery Conduit
Water plumbing and Oxygen Gas Delivery Conduit
Fish Harvest and Tank Access Working Area Clear 4m wide
Water plumbing and Oxygen Gas Delivery Conduit
Water plumbing and Oxygen Gas Delivery Conduit
Bio Filter 40m2
foot print 4mx10m
CO2 Degassing
Tower 16m2
foot print 4mx4m
100m3
Header Tank
foot print 5mx5m
Swirl Sepera
tor
Swirl Sepera
tor
Swirl Sepera
tor
Swirl Sepera
tor
Swirl Sepera
tor
Swirl Sepera
tor
Oxycone
Oxycone
Oxycone
Oxycone
Oxycone
Oxycone
Foamfrac
Foamfrac
Foamfrac
Foamfrac
Foamfrac
Foamfrac
Drum Filter
foot print 4mx2m
Swirl Seperator
LHO 20m2
foot print 4mx5m
Sludge Settling Tank 25m3
foot print 4mx3m
Sludge Digestion Tank 25m3
foot print 4mx3m
Denammox 25m3
foot print 4mx3m
Biogas reactor 25m3
foot print 4mx3m
UV 8m2
foot print 4mx2m
Oxygengenerator
12m2
foot print 4mx3m
Oxygen generatorredundant 12m2
foot print 4mx3m
Ozone GeneratorA 12m2
foot print 4mx3m
Back up power generator 12m2
foot print 4mx3m
Back up power generator
redundant 12m2
foot print 4mx3m
FoamFractionator
Robotic Feed
SystemLoading
Zone 30m2
foot print
10mx3m
Office
Feed Storage
ComputerControl
Storage
24 Meters
67 Meters
Robotic Feed
SystemLoading
Zone 30m2
foot print
10mx3m
Swirl Sepera
tor
Oxycone
Foamfrac
Swirl Sepera
tor
Oxycone
Foamfrac
Swirl Sepera
tor
Oxycone
Foamfrac
Swirl Sepera
tor
Oxycone
Foamfrac
Service Access3.5 meters wide
200m3
Tank
foot print 9mx9m
200m3
Tank
foot print 9mx9m
200m3
Tank
foot print 9mx9m
200m3
Tank
foot print 9mx9m
200m3
Tank
foot print 9mx9m
200m3
Tank
foot print 9mx9m
200m3
Tank
foot print 9mx9m
200m3
Tank
foot print 9mx9m
200m3
Tank
foot print 9mx9m
200m3
Tank
foot print 9mx9m
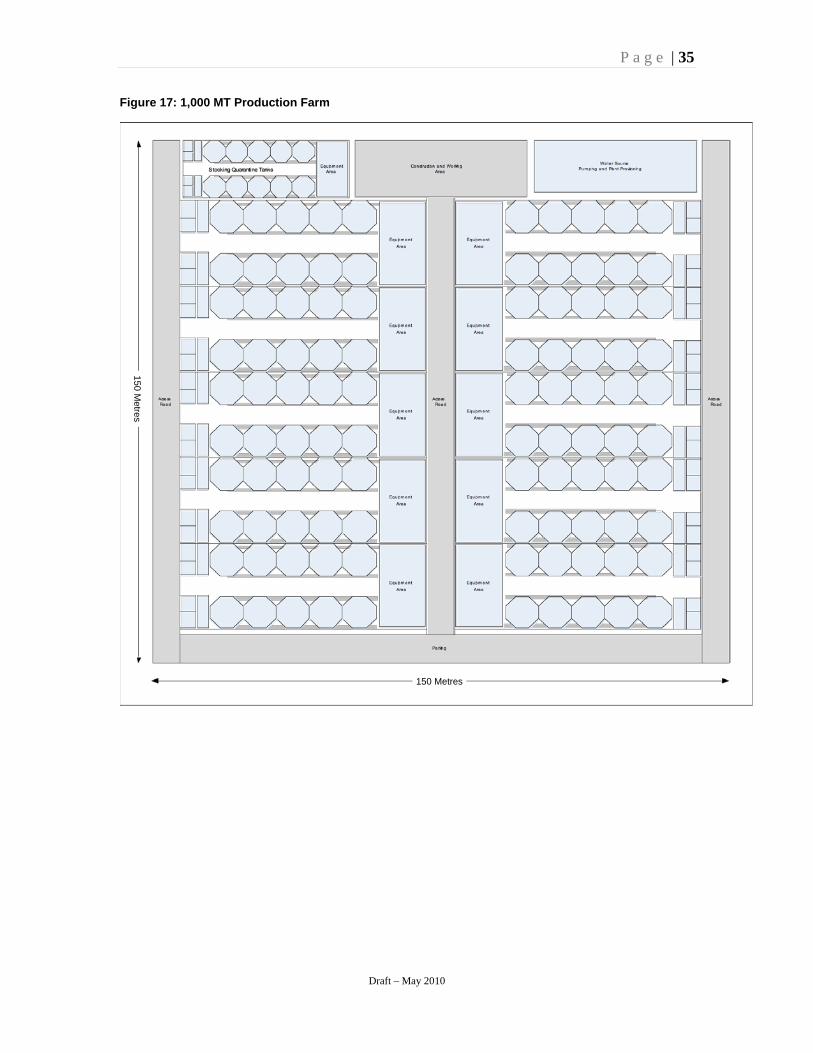
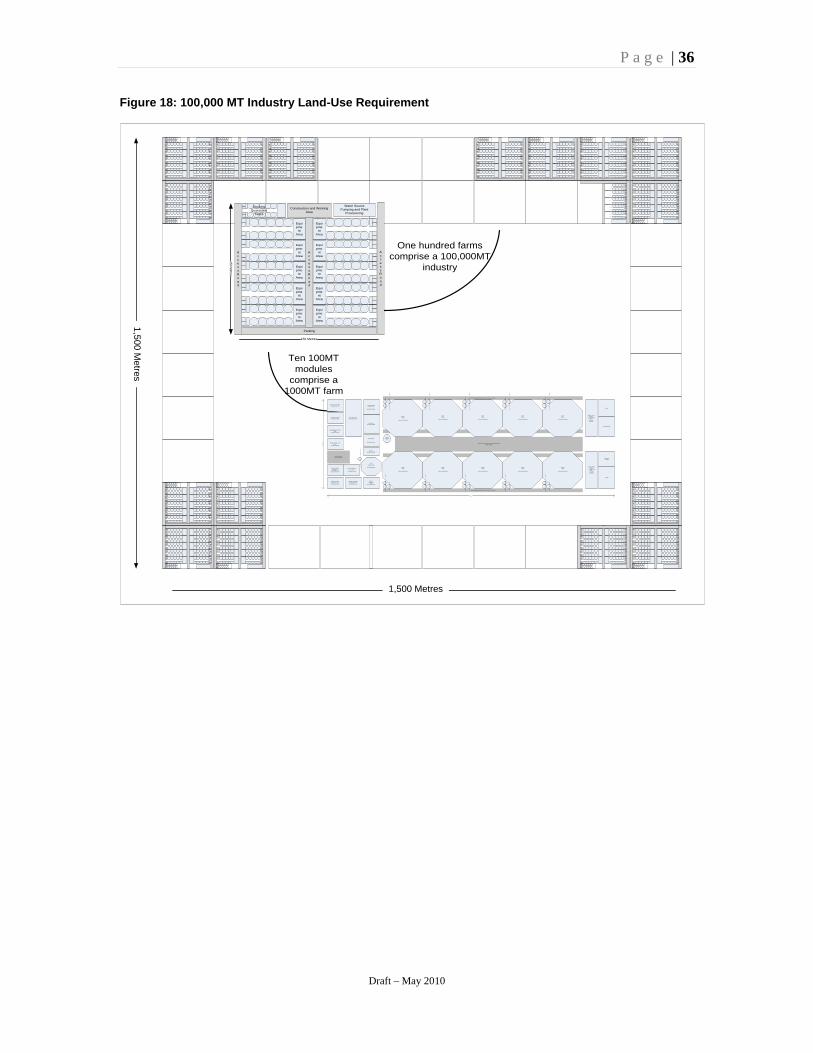
The total required land-use is simply 24 metres by 67 metres. The Figure 17 overleaf illustrates how ten such farm modules may be integrated into a 1,000 MT farm production module; also included is additional vehicle access and working area spaces. The total land-use requirement for the 1,000 MT farm is 150 metres by 150 metres. The land-use requirement for an entire 100,000 MT farm industry is illustrated in Figure 18 and requires 1,500 metres by 1,500 metres to construct (2.25 square kilometres). A summary of the land-use requirements is provided in Figure 19. The same data are provided in various numeric units for ease of reader comprehension.
Footprint 9m x 9m
67 Metres 24 M
etres
P a g e | 35
Draft – May 2010
Figure 17: 1,000 MT Production Farm
150 Metres 150 M
etres
P a g e | 36
Draft – May 2010
Figure 18: 100,000 MT Industry Land-Use Requirement
1500 meters
1500 Metres
Equipment
Area
Equipment
Area
Equipment
Area
Equipment
Area
Equipment
Area
Equipment
Area
Equipment
Area
Equipment
Area
Equipment
Area
Equipment
Area
Access Road
Construction and WorkingArea
Parking
Access Road
Access Road
Water Source
Pumping and Plant Provisioning
Stocking Quarantine
Tanks
150 Metres
150 Metres
Ten 100MT modules
comprise a 1000MT farm
One hundred farmscomprise a 100,000MT
industry
Water plumbing and Oxygen Gas Delivery Conduit
Water plumbing and Oxygen Gas Delivery Conduit
Fish Harvest and Tank Access Working Area Clear 4m wide
Water plumbing and Oxygen Gas Delivery Conduit
Water plumbing and Oxygen Gas Delivery Conduit
200m3
Tank
foot print 10mx10m
Bio Filter 40m2
foot print 4mx10m
200m3
Tank
foot print 10mx10m
200m3
Tank
foot print 10mx10m
200m3
Tank
foot print 10mx10m
200m3
Tank
foot print 10mx10m
200m3
Tank
foot print 10mx10m
200m3
Tank
foot print 10mx10m
200m3
Tank
foot print 10mx10m
200m3
Tank
foot print 10mx10m
200m3
Tank
foot print 10mx10m
CO2 DegassingTower 16m2
foot print 4mx4m
100m3
Header Tank
foot print 5mx5m
Swirl Seperator
Swirl Seperator
Swirl Seperator
Swirl Seperator
Swirl Seperator
Swirl Seperator
Oxycone
Oxycone
Oxycone
Oxycone
Oxycone
Oxycone
Foamfrac
Foamfrac
Foamfrac
Foamfrac
Foamfrac
Foamfrac
Drum Filter
foot print 4mx2m
Swirl Sepera
tor
LHO 20m2
foot print 4mx5m
Sludge Settling Tank 25m3
foot print 4mx3m
Sludge Digestion Tank 25m3
foot print 4mx3m
Denammox 25m3
foot print 4mx3m
Biogas reactor 25m3
foot print 4mx3m
UV 8m2
foot print 4mx2m
Oxygengenerator
12m2
foot print 4mx3m
Oxygen generatorredundant 12m2
foot print 4mx3m
Ozone GeneratorA 12m2
foot print 4mx3m
Back up power generator 12m2
foot print 4mx3m
Back up power generator
redundant 12m2
foot print 4mx3m
FoamFractionator
Robotic Feed System
Loading Zone 30m2
foot print 10mx3m
Office
Feed Storage
ComputerControl
Storage
24 Meters
72 Meters
Robotic Feed System
Loading Zone 30m2
foot print 10mx3m
Swirl Seperator
Oxycone
Foamfrac
Swirl Seperator
Oxycone
Foamfrac
Swirl Seperator
Oxycone
Foamfrac
Swirl Seperator
Oxycone
Foamfrac
Service Access3.5 meters wide
1,500 Metres
1,500 Metres
P a g e | 37
Draft – May 2010
Figure 19: Production Land Footprint Sizing Production Unit
Fish Production
Footprint
Aquaponic Footprint
Integrated Fish
and Aquaponics
100 MT Farm module (1x)
1,600 m2
24m x 67 m
0.4 Acres 0.16 Hectares
3,300 m2
60 m x 60 m
0.81 Acres 0.33 Hectares
4,900 m2
70 m x 70 m
1.21 Acres 0.49 Hectares
1,000 MT Farm (10x)
22,500 m2
150 m x 150 m
5.56 Acres 2.25 Hectares
33,000 m2
190 m x 190 m
8.15 Acres 3.3 Hectares
55,500 m2
235 m x 235 m
13.59 Acres 5.5 Hectares
100,000 MT Industry (1,000x)
2,250,000 m2
1,500 m x 1,500 m
556 Acres 225 Hectares
2.25 km2
3,300,000 m2
1,900 m x 1,900 m
815 Acres 330 Hectares
3.3 km2
5,550,000 m2
2,355 m x 2,355 m
1,371 Acres 555 Hectares
5.55 km2
The capital cost of land at $50,000 per acre (2009 pricing) is a modest but not a major component of the capital cost of a farm. Henry Klop REMAX’s Fraser valley farmland specialist estimates that the cost will rise to $60,000 per acre during 2010. Notwithstanding this fact, B.C. is advantageously provisioned with substantive tracts of crown land that could be leased at $500/acre (commercial rates for prime agricultural land, REMAX) to catalyze adoption of this technology by the aquaculture industry. Furthermore, it is important to consider that empty swine barns represent substantial stranded assets that could be utilized to reduce the capital costs required to embrace aquaculture and inject harvest diversification into existing working farms. Aquaculture could also be readily co-located with existing greenhouse horticulture farms to exploit the available nitrate source embedded in the aquaculture water.

P a g e | 38
Draft – May 2010
Water Consumption Access to a high-quality water source is a fundamental requirement for the development of a land-based closed containment salmon farm. The ideal source is devoid of pathogens and free of contaminants such as pesticides, long chain hydrocarbons, PCBs, etc. Three sources of such water are available for consideration: underground water sources such as aquifer and well water, lake and river water, and municipal water. British Columbia is advantageously provisioned with plentiful access to quality water sources. Water represents a resource to which the government can provision access and catalyze adoption of closed containment technology. An integral requirement for the farm is to ensure adequate access to make-up water. Despite the nomenclature of full recirculation, the design presented, which is consistent with closed containment designs utilized in other species [Tal et al, 2009], has a retention rate greater than 99.9%. This term, which is often misunderstood, refers to the volume of water retained each time the tank volume circulates through the system. Assuming a notional tank retention time of one hour, this equates to a daily water loss of approximately 0.8%. This water loss is a result of evaporation, sludge removal, and fish handling losses [Tal et al, 2009]. In a fish-only production environment, this water is effectively discharged. [Tal et al, 2009] found that evaporation was the largest component of this water loss at 0.5% and sludge represented the smallest at 0.05%, while fish-handling losses and leaks accounted for the balance. If aquaponics are integrated to perform denitrification (as opposed to using a denammox filter for marine designs), this water loss volume will increase due to the crop’s absorption of both water and nutrients. Alternatively, the discharge could be integrated into dry field crops as irrigation. Irrespective of the design and production choice, site criteria must provision access to a make-up water source that can provide 1-2% of the production volume per day. Figure 20 overleaf tabulates the consumption rates for various production volumes. The sludge is discharged to the bioreactor for conversion to methane, CO2, and other gases.

P a g e | 39
Draft – May 2010
Figure 20: Water Consumption
Production Unit
Fish Production Footprint
Water Make-up Rate 1% of Volume Day
Sludge Discharge to
Bioreactor
100 MT 2,000 m3
Farm module
20 m3 < 1 m3 discharge
1,000 MT 20,000 m3
Farm
200 m3 < 10 m3 discharge
100,000 MT 200,000 m3
Industry
20,000 m3 < 1,000 m3 discharge
Note: a public swimming pool is typically 1,000 m3
Water Source Selections Criteria: The preferred water source is ground well water that has been naturally filtered and provides no means for external wildlife to introduce pathogens. Well water also exhibits a constant daily egress temperature irrespective of ambient weather conditions. This stability is advantageous, for it eliminates the need for heating and cooling technologies and the associated running costs. The absolute temperature tends to vary by less than two degrees as a function of season; for example, the Nimpkish Hatchery’s well water is warmer in winter by a couple of degrees indicating that the aquifer has a least a 6-month or 18-month drainage latency. This is a very desirable property, especially if partial recirculation or flow-through designs are considered. Other sources include river and lake water. If one of these sources is used, provisions should be made to filter, store and treat (ozone and UV-C disinfection) the water before it is used in the culture tanks. These measures are necessary because even though the source water may not be stocked with wild salmon, which would provide immediate exposure to species-specific pathogens, wildlife utilizing the water source can introduce an array of pathogens that are still harmful or can induce stress in the fish stock. If one of these water sources is employed, means to match incoming water temperature to the culture tanks is also required, as the source water temperatures will vary. Finally, depending upon location, municipal water may be used if and only if it is heavily filtered to ensure that the remaining concentrations of dissolved chlorine and bromine in the water are immeasurable. Triple-stage carbon-packed self-backwashing filters can be utilized for this purpose but do incur additional capital expense. The low water consumption of the design presented does, however, permit this option, albeit higher capital costs are incurred for carbon filters and potential operating costs if commercial access rates are to be satisfied for municipal water consumption.

P a g e | 40
Draft – May 2010
Financial Assessment for Land-Based Full Recirculation Aquaculture Capital Costs: Figure 21 below defines the capital costs required to build and construct a 100 MT farm module and a full 1,000 MT farm comprised of ten modules. All pricing has been obtained by commercial quote or from direct web-based price offerings. In practice, price discounts would be expected if the purchasing were subject to a competitive bid process. The pricing is commensurate with the specifications documented in Figure 20. Figure 21: Capital Costs
Item
Unit basis
No. required
Module / Farm 100 MT Module 1,000 MT Farm
Culture tanks 200 m3 $100/m3 10/100 $200,000 $2,000,000
Swirl separators $1,000 $12,000 $12,000 $120,000
Oxygen injection cones $4,400 10/100 $44,000 $444,000
Oxygen generators (triple redundancy) 3/3 $150,000 $574,275
CO2 degassing tower $200/m3 1 / 10 $3,593 $35,935
Degassing media $400/m3 OPTIONAL $7187 $71,870
Blowers $11,000 2/20 $22,000 $220,000
Biofilter tank $200/m3 1/10 $5,137 $51,370
Biofilter media $70/m3 $1,798 $17,979
Low head oxygenator $2,000 $20,000
Foam fractionators $1,500 10/100 $15,000 $150,000
Drum filters $17,000 2/20 $34,000 $340,000
Settling tanks / Eco trap $10,000 $100,000
Pumps $400 /HP
30/60
100 HP/1,000 HP
$58,641 $586,409
Plumbing costs $75,000 $750,000
CPU monitoring & control
$40,000 $400,000
UV-C sterilization $20,000 $200,000
Ozone sterilization $40,000 $400,000
Robotic feeding system $80,000 $800,000
Back-up generators 2x redundant 1000 kW/farm
2/2 $50,000 $300,000
Land prep $10,000 $50,000
Land purchase $54,684 $546,845
Building construction $400,000 $4,000,000
Total $1,286,041 $11,884,683

P a g e | 41
Draft – May 2010
Operating Costs: Operating costs, revenues, and income after costs are documented in Figure 22, Figure 24, and Figure 25. Calculations of operating costs assume that all mechanics (drum filters, pumps, etc.) are replaced over a five to seven-year period. Figure 22: Major Operating Costs
Line Item Unit Costs 100 MT Module 1,000 MT Farm
Cost of feed (Taplow ) $1.8/kg $378,000 $3,780,000
Cost to stocking $2.00/fish $70,000 $70,000
Cost of power $0.07/kWh $80,636 $806,358
Cost of harvest $0.5/kg $17,500 $175,000
Cost of mechanical replacements (Includes UV-C bulbs) $22,000 $220,000
Cost of labour
Farm module 3 FTE workers 40 k/yr PT manager @ 50% 100 k/yr PT millwright @ 50% 80 k/yr PT vet @ 50% 200 k/yr Farm 8 FTE workers 40 k/yr 1 FTE manager 100 k/yr 2 FTE millwright 80 k/yr 1 FTE vet 200 k/yr
$250,000 $780,000
Total Operating Costs ~ $818,725 ~ $6,467,246
Figure 23: Percentage Total Operating Costs

P a g e | 42
Draft – May 2010
Figure 24: Commodity-Based Annual Revenue & Income Statement for Annual Harvest Production for 175 MT Production from 100 MT Farm Modules and 1,750 MT Production from a 1,000 MT Farm
Line Item Unit Pricing 100 MT Module 1,000 MT Farm Market price of fish (FOB Seattle provided by Urner Barry Comtell)
$6.6/kg $1,155,000 $11,550,000
Market price of lettuce (estimated)
$0.3/head $373,973 $3,739,726
Market price of compost (estimated)
$0.3/kg $15,750 $157,500
Total Revenue $1,544,723 $15,447,226
Income from Fish After All Costs $336,275 $5,082,754
Income All Crops After All Costs $725,998 $8,979,980
Figure 25: Premium-Based Annual Revenue (25%) & Income Statement for Annual Harvest Production for 175 MT Production from 100 MT Farm Modules and 1,750 MT Production from a 1,000 MT Farm
Line Item Unit Pricing 100 MT Module 1,000 MT Farm
Market price of fish $8.25/kg $1,443,750 $14,437,500
Market price of lettuce $0.4/head $498,630 $4,986,301
Market price of compost $0.30/kg $15,750 $157,500
Total Revenue $1,958,130 $19,581,301
Income from Fish After All Costs $625,025 $8,169,142
Income All Crops After All Costs $1,139,405 $13,114,055

P a g e | 43
Draft – May 2010
Financial Assessment Summary for the Land-Based Full Recirculating Closed Containment Fish Farm Figure 21, Figure 22, Figure 24, and Figure 25 on the previous pages outline the capital expense, operating expenses, and estimated income from a farm yielding 1,000 MT of full-size fish and 750 MT of smaller fish per annum using the closed containment land-based recirculating design described earlier in this report. The collective tables of accounts are provided for both basic commodity and premium 25% pricing. The broad economic conclusions are tabulated for a farm harvesting 1750 MT of fish per annum in Figure 26 below. Figure 26: Financial Assessment Summaries
Attribute Value Capital Expense ~ M $12.0 Operating Expense (annual) ~ M $6.0 Commodity Pricing Revenue (annual) Fish ~ M $11.5 Fish, Aquaponics and Compost ~ M $15.4 Commodity Pricing Income After Costs Fish Only ~ M $5.0 Commodity Pricing Income After Costs All Crops ~ M $8.9 Premium (25%) Pricing Revenue (annual) Fish ~ M $14.4 Fish, Aquaponics and Compost ~ M $19.6 Premium Pricing Income After Costs Fish Only ~ M $8.1 Premium Pricing Income After Costs All Crops ~ M $13.1
The table illustrates that land-based closed containment is clearly economically viable. In summary, an $18 million investment (M $12 capital and M $6 working for the first 18 months) will yield an estimated $9 million per annum income for a twenty-year working lifespan. The investment can be further leveraged to yield an estimated revenue of $13.5 million per annum if low ocean impact feed sourcing and zero-chemical therapeutant husbandry practices are adopted. These practices, it is believed, will command a much higher premium at the farm gate than the 25% premium assumed in this report. It must also be noted that these returns assume that the value in the nutrient-laden waste is captured via aquaponics and compost. These incomes will be reduced by $3-4 million if aquaponics are not considered and a brackish water fish-only production strategy is used. It is also extremely important not to forget that the design presented is a very conservative redundant design that has higher power operating costs and higher capital costs than perhaps necessary.
P a g e | 44
Draft – May 2010
Some further analysis is required to estimate the operating expense reduction that could be achieved by including anaerobic decomposition as an augmentative energy source. At 500-2,000 kWh per ton of waste, this energy source needs to be considered. If this basic financial analysis is to be compared with current industry open net-pen farming practices, then the cost to transport feed to remote ocean locations, the longer growing cycle due to colder water conditions, and the cost to transport live fish from the ocean to the processing plant need to be accurately considered. It is hypothesized that these costs are commensurate with the cost of power needed to operate a land-based closed containment farm. It is also important to reflect upon the growth rates provisioned by a land-based closed containment facility operated at a stable temperature of 10oC. It is likely that the 18-month grow-out period for salmon will be reduced to 15 months or less. Thus over a 20-year period, 16-20 full harvests can be made from a land-based facility, compared to 13 harvests for an ocean-based farm. These additional harvests can yield between $15 million and $80 million in increased revenue, depending on whether commodity versus premium pricing is used and / or if aquaponics options are exercised. Careful examination of the detailed financial statements which compare a single 100 MT farm module to a 1,000 MT farm reveal that the three real-cost variables of highest consequence are feed, power, and labour. While feed and power scale linearly with farm size, labour does not. For labour costs, there is a minimum baseline that has to be overcome. In short, a 100 MT farm does not provision enough work to keep farm employees busy, yet the salary required for the 24-hour presence requirements places the basic farm module without aquaponics at an economic disadvantage. As the farm scales to 1,000 MT, the economics permit substantial profitability because the labour cost burden becomes fully utilized and is not wasted. This is an important observation because, like many agriculture endeavors, a small-scale undertaking is often a pathway to bankruptcy, while large-scale endeavors offer pathways to profit. This observation can be incorporated into the design by integrating 100 MT production units into existing farms to utilize stranded assets (empty swine and poultry barns) and diversify farm revenues. Furthermore, the opportunity to blend dairy (fiber) and aquaculture (protein) solid wastes will maximize bioenergetic production for those farms utilizing anaerobic decomposition. It should also be noted that profitability and economic stability could be achieved at 100 MT of production if high-value niche markets are considered. The discussion presented in the previous section assumes head-to-head competition in the commodity salmon market with the existing ocean net-pen industry. There are, however, examples of economically successful 100 MT closed containment farms; Aquaseed-Domsea farms in Washington produces a trim E Coho fillet on cedar plank for a substantial premium. This is an important consideration for it promotes economic diversification and access to profitable aquaculture in the context of rural coastal communities.
P a g e | 45
Draft – May 2010
Summary Assessment for a Land-Based Closed Containment Recirculating Fish Farm This report details the design, capital cost estimation, farm site criteria, and operating costs associated with a land-based closed containment salmon farm. The design is suitable for brackish water production of all species of salmon. Furthermore, the design supports the production of salmon in freshwater and the integration of aquaponics to capitalize upon the nutrient-rich waste from the farm to create an additional cash crop income. The investigation clearly demonstrates that the required equipment is readily available as commercial off-the-shelf components and that the operating costs do not present a barrier to success. It is also extremely important not to forget that the design presented is a very conservative redundant design and that further design effort would most likely result in lower capital costs. It should also be considered that this report uses a single design and that other approaches may provision lower power consumption and capital expenditures. The purpose of this design was to demonstrate technical and economic feasibility. The capital costs may be higher than the current practice of open net-pen farms but the potential shorter harvest period due to higher stable operating temperatures (9-10oC) is substantial when compared to 18-22 months of ocean grow-out conditions. This has huge investment repercussions because over a 20-year period, the 16 to 20 harvests provided in a land-based closed containment design (versus 8 to 13 achieved in the ocean environment) compound to a significant increase in the return on the original investment. These considerations are further amplified when the substantial reduction in the “value at risk” is evaluated for land-based closed containment versus ocean net-pen farms due to disease and escape.
P a g e | 46
Draft – May 2010
Report Conclusions This report concludes that there is no technical or economic barrier to closed containment salmon farm aquaculture for the production of salmon. Moreover, B.C. is advantageously provisioned for catalyzing an industrial change and for retaining the new emergent industry in B.C., specifically:
• Access to Crown land at commercially advantageous rates;
• Access to plentiful quality water sources;
• Temperate climate mediating heat and cooling costs;
• Processing and feed production infrastructure in-situ in the province; and
• Access to and retention of a trained labour force
It is often stated that a forced change to on-land closed containment aquaculture production will cause an industrial migration to key markets. The above list of attributes will mediate this, especially when producers realize that it is cheaper to move 100 tons of finished product to market than it is to move 120 tons of feed. Finally, public policy makers should deeply consider the lack of biosecurity in the current industry. When a disease outbreak occurs amongst the interconnected ocean farms, not only is the full harvest rapidly lost across all farms as the water-borne infection spreads, but the dependant rural economy is equally devastated as the industry eliminates jobs. This has happened in Chile. Thus, biosecurity equates to the economic security of rural communities. Land-based aquaculture mitigates the dependency of economic security from biosecurity issues. This is an extremely important consideration for rural communities in particular and for British Columbia as an entity.
P a g e | 47
Draft – May 2010
References [Stead et al, 2002] Handbook of Salmon Farming Selina M. Stead and Lindsay Laird Springer and Praxis 2002 ISBN 1852331194 [Timmons et al, 2007] Recirculating Aquaculture M.B. Timmons and J.M. Ebeling NRAC pub No. 01-007. ISBN 978-0-9712646-2-5. [Tal et al, 2009] Environmentally sustainable land-based marine aquaculture Yossi Tal, Harold J. Schreier, Kevin R Sowers, John D. Strubblefield, Allen R. Place, Yonathan Zohar Aquaculture 286 (2009) 28-35 Elsevier B.V. [Forsberg, 1997] The impact of varying feeding regimes on oxygen consumption and excretion of carbon dioxide and nitrogen in post-smolt Atlantic salmon Salmo salar L. O.I. Forsberg Aquaculture Research 28:29-41. [Forsberg, 1994] Modelling oxygen consumption rates of post-smolt Atlantic salmon in commercial-scale land-based farms O.I. Forsberg Aquaculture International 2:180-196. [Lee, 1994] A review of automated control systems for aquaculture and design criteria for their implementation. Philip G. Lee Aquaculture Engineering Volume 14, Issue 3, 1995, Pages 205-227 [Lee, 1998] Process control and artificial intelligence software for aquaculture Philip G. Lee 1998 Annual Meeting of the World Aquaculture Society, Session on Aquaculture Computer Tools. Las Vegas. [Vike et al, 2008] ISA virus in Chile: evidence of vertical transmission. S. Vike, S. Nylund, and A. Nylund Received: 4 July 2008 / Accepted: 29 October 2008 Published online: 26 November 2008_ Springer-Verlag 2008 Archives of Virology B.C. Pacific Salmon Forum Final Report and Recommendations to the Government of British Columbia. January 2009.