technology & engineering
TRANSCRIPT

©Mitsui Babcock Energy Limited 2005 All rights reserved.
This report is the property of Mitsui Babcock Energy Limited and shall not be used other than for the explicit purpose for which it was supplied and shall not be copied or supplied to others without the
permission in writing of Mitsui Babcock Energy Limited.
RD.204L
Technology & Engineering
IEA Greenhouse Gas R&D Programme: Oxy-Combustion Processes for CO2 Capture from Power Plant
Author(s): D J Dillon (Mitsui Babcock), V White (Air Products plc), R J Allam, (Air Products plc), R A Wall (Alstom Power) and J Gibbins (Imperial College London)
Report No :
E/04/031 Customer :
IEA Greenhouse Gas Research and Development Programme
Issue:
1 Order No.:
IEA/CON/03/97
Project/Sub-Proj :
78593/SD001 Sponsor :
Europe Technology
Confidentiality :
Confidential
Subject Code :
30 Date :
03/06/05
Engineering Investigation Report

Report No: E/04/031 Issue No.: 1 Confidential
3rd June 2005 Page 2 of 98 © Mitsui Babcock 2005
DISTRIBUTION LIST
IEA Greenhouse Gas R & D Programme M Haines 3
Director Technology & Engineering → Director Technology Business
J L King → J L Thomson → J M Farley → Library (Master Copy)
1
Director Technology Development J Macphail → B W Smith (circulate as appropriate) 1
Engineering Director → Engineering Manager S W Cameron → G Graham → Library (Lending Copy)
1
Principal Investigator/Lead Engineer D J Dillon → Project File 1
New Business Development R A Dennis (circulate as appropriate) 1
Director Engineering, Asia Pacific Crawley Operations
B D G Mantle 1
Chief Engineer USA M J Smith 1
Project Manager/Sponsor R S Panesar 1
Others A M Timms
P J Melling
1
1
TOTAL 13
AMENDMENT CONTROL
Issue Section Reason for Amendment
1 Final Issue
In the event that this report is provided as part of a contract obligation, this report is provided for the sole use and benefit of the Purchaser subject to the agreed Terms and Conditions of Contract, and Mitsui Babcock's responsibilities to the Purchaser are strictly governed by those Terms. Mitsui Babcock accepts no responsibility in relation to this report to anybody other than the Purchaser.

Report No: E/04/031 Issue No.: 1 Confidential
3rd June 2005 Page 3 of 98 © Mitsui Babcock 2005
SUMMARY
The IEA Greenhouse Gas R&D Programme has reported the cost of pre-combustion and post-combustion CO2 capture technologies for power generation, except for oxy-combustion based technologies.
The use of oxy-combustion (fossil fuel combusted with near pure oxygen and recycled flue gas or CO2 or water/steam) to produce a flue gas consisting essentially of CO2 and water is seen as having potential as a means of disposing of combustion related CO2. The advantage is that the flue gas is not diluted with nitrogen as when air is used for firing, and therefore can be disposed of with minimal further downstream processing.
A study was therefore commissioned by the IEA Greenhouse Gas R&D Programme and led by Mitsui Babcock with project partners Alstom Power, Air Products plc, and Imperial College London to confirm the feasibility and projected costs for CO2 capture using oxy-combustion technology as applied to new-build power generation plant.
The study covered the following greenfield power generation plant with CO2 capture:-
• Advanced Supercritical bituminous Pulverised Fuel (ASC PF)-Fired Power Plant • Natural Gas Combined Cycle (NGCC) Power Plant
In compliance with the IEA GHG study specification, the target net power output of the power plant was aimed at 500 MWe. To represent a reasonable baseline of oxy-combustion, the process evaluation was based on proven technology, where possible, with oxygen production based on cryogenic separation technology and the recycle system utilising either flue gas or CO2.
The minimum CO2 capture level specified for the study was 85% of all the CO2 generated. The CO2 was compressed to 110 bara before injection into the transfer pipeline. The economic analysis featured within this study is based on capture and CO2 compression, costs associated with transport and storage are excluded.
This report presents the results of the study:
• An overview of oxy-combustion processes.
• Process flow diagrams and heat and mass balance calculations for the ASC PF Power Plant with CO2 capture.
• Process flow diagrams and heat and mass balance calculations for the NGCC Power Plant with CO2 capture.
• Discussion of safety and operability issues.
• Costs and economics associated with both types of CO2 capture plants, including sensitivity to fuel price, discount rate and investment costs.
• Development requirements of oxy-combustion application for ASC PF and NGCC Power generation plants.

Report No: E/04/031 Issue No.: 1 Confidential
3rd June 2005 Page 4 of 98 © Mitsui Babcock 2005
Process flow diagrams (PFDs) were developed using proprietary software and heat and mass balances (HMBs) compiled to model the overall oxy-combustion process. For the PF-fired power plant case, the required recycle flue gas system took into consideration dust loading and milling plant requirements. Consideration was also given to possible integration opportunities and heat and power utilisation to maximise plant performance.
Optimised plant performance parameters were used for cryogenic air separation with 95% v/v oxygen purity to suit the required CO2 purity of 95% v/v with recognition of excess combustion oxygen and furnace/boiler tramp air ingress for the PF-fired power plant case.
The study compared both PF and NGCC plant with CO2 capture, therefore the size of the associated plants were required to be similar. The target net power output for both plants was specified as 500 MWe. After detailed modelling of the ancillary plant, particularly the ASUs and CO2 treatment plants, the net power output with CO2 capture achieved were:-
• 532 MWe for the ASC PF plant with CO2 capture
• 440 MWe for the NGCC plant power plant with CO2 capture.
The PFDs/HMBs analysis produced data which allowed specifications for the major plant items to be developed; this in turn allowed budget capital costs for the major components to be assessed and operating philosophies to be investigated.
The table below summarises the main findings of the above activities:

Report No: E/04/031 Issue No.: 1 Confidential
3rd June 2005 Page 5 of 98 © Mitsui Babcock 2005
ASC PF Air Fired Power
Plant Without CO2 Capture
ASC PF Oxy-Combustion Power
Plant With CO2 Capture
Typical NGCC Air Fired Power Plant
Without CO2 Capture
NGCC Oxy-Combustion
Power Plant WithCO2 Capture
Fuel Input kg/s 59.19 58.09 14.77 20.32Fuel Heating Value MJ/kg (LHV) 25.86 25.86 46.90 48.45Fuel Heat Input MWth (LHV) 1530.8 1502.2 692.9 984.5O2 Input (contained) tonne/day - 10,373 - 6,840Gross Power Output MWe 740 737 400 575ASU Power MWe - 87 - 90CO2 Compression & Purification MWe - 65 - 28Power Plant Auxiliaries MWe 63 54 12 18Net Power Output MWe 677 532 388 440Gross Efficiency % LHV 48.3 49.1 57.7 58.4Net Efficiency % LHV 44.3 35.4 56.0 44.7CO2 Capture Loss % points - 8.9 - 11.3Unit Investment Costs: (Including Contingency, Fees & Owners Cost)*
Coal & Ash Handling US$ x 106 79 79 - -Boiler Island US$ x 106 341 341 - -FGD Plant US$ x 106 119 - - -DeNOx Plant US$ x 106 26 - - -Steam Turbine Island US$ x 106 195 195 - -ASU US$ x 106 - 258 - 172CO2 Comp. & Purif. US$ x 106
- 102 - 39Balance of Plant US$ x 106 264 272 - -NGCC Power Plant US$ x 106 - - 217 447
Total Investment Costs US$ x 106 1024 1246 217 658Specific Investment Cost US$/kWe gross 1384 1691 543 1144Specific Investment Cost US$/kWe net 1513 2342 559 1495Fuel Cost US$/GJ 1.5 1.5 3.0 3.0Cost of Electricity US cents/kWh 4.98 7.28 3.35 6.13CO2 Emissions t/h 489 45 144 5CO2 Captured g/kWh (net) - 831 - 403
*For PF plant: contingency 10% of Installed Costs; Fees 2% of Installed Costs; Owners Costs 16% of Installed Costs.*For NGCC plant: contingency 10% of Installed Costs; Fees 2% of Installed Costs; Owners Costs 5% of Installed Costs.Load Factor defined as achieved output as a percentage of rated / nameplate capacity (taken as 45% for 1st year. 85% every year after).Exchange rate 1.2US$ = 1€Capital costs +/- 25%
The costs of electricity production for each of the above cases were based on the IEA Greenhouse Gas Standard Economic Spreadsheet and assessment criteria at a 10% discount rate and an operating life of 25 years at an assumed 85% availability. The gas base fuel price applied was 3.0 US$/GJ for natural gas and 1.5 US$/GJ for coal.
A rate of exchange of 1.2 US dollar to 1 Euro was applied to capital cost estimates in line with current exchange rates.
The two main factors found to influence the cost of electricity were unsurprisingly, the investment cost and the fuel price.

Report No: E/04/031 Issue No.: 1 Confidential
3rd June 2005 Page 6 of 98 © Mitsui Babcock 2005
Based on the technical and economic parameters presented in the report, the results show that for the ASC PF plant, the costs associated with the CO2 capture plant compared to the cost of the reference ASC PF plant without capture is equivalent to a cost delta of 2.3 US Cents/kWh. For the NGCC plant the cost associated with the CO2 capture plant compared to the cost of the plant without capture is equivalent to a cost delta of 2.8 Cents/kWh.
Whilst illustrating the envisaged potential, it is recognise that oxy-combustion technology needs further development in certain key areas in order to introduce the technology successfully to the marketplace.
Such areas requiring refinement are recognised as plant start up and control systems, burner and flame characterisation and materials issues.
A “stepped” approach in development is recommended for the case of the ASC PF plant by developing a “capture ready” plant that addresses many of the technical issues without committing utilities entirely to a CO2 capture route.
Similarly for both types of oxy-combustion plant, the opportunity for further improvements in efficiency and reductions in costs are envisaged as oxy-combustion boilers, ASU, CO2 compressors and gas turbine technologies advance.

Report No: E/04/031 Issue No.: 1 Confidential
3rd June 2005 Page 7 of 98 © Mitsui Babcock 2005
GLOSSARY OF TERMS ASC Advanced Supercritical ASU Air Supply Unit ADP Acid Dew Point BFW Boiler Feed Water BMS Burner Management System BOP Balance of Plant CoE Cost of Electricity DCAC Direct Contact After Cooler DCC Direct Contact Coolers DCS Distribution Control System DTI Department of Trade and Industry ESP Electro Static Precipitators FD Forced Draught FGD Flue Gas Desulphurisation FGR Flue Gas Recycle FWH Feed Water Heating GAS-ZEP Gas-Zero Emission Power Plant GHG Green House Gases GOX Gaseous Oxygen HMBs Heat and Mass Balances HP High Pressure HRSG Heat Recovery Steam Generator ID Induced Draught IEA International Energy Agency ITM Ion Transport Membranes IGCC Integrated Gasification Combined Cycle LOX Liquid Oxygen LP Low Pressure MAC Main Air Compressor MCR Maximum Conditions Rating MHE Main Heat Exchanger MP Medium Pressure NGCC Natural Gas Combined Cycle OTM Oxygen Transport Membranes OTSC Once Through SuperCritical PA Primary Air PFDs Process Flow Diagrams PF Pulverised Fuel PIC Pressure Integral Controller R&D Research and Development SCR Selective Catalytic Reduction TSA Thermal Swing Adsorption TIC Total Investment Cost UK United Kingdom ZEP Zero Emission Power plant

Report No: E/04/031 Issue No.: 1 Confidential
3rd June 2005 Page 8 of 98 © Mitsui Babcock 2005
CONTENTS
DISTRIBUTION LIST.......................................................................................................... 2
AMENDMENT CONTROL.................................................................................................. 2
SUMMARY ......................................................................................................................... 3
GLOSSARY OF TERMS .................................................................................................... 7
CONTENTS........................................................................................................................ 8
1. INTRODUCTION......................................................................................................... 9 1.1 Background............................................................................................................. 9 1.2 Scope Of Work ..................................................................................................... 10 1.3 Deliverables .......................................................................................................... 11
2. OVERVIEW OF OXY-COMBUSTION PROCESSES ............................................... 12 2.1 Oxy-Combustion Application to Utility Power Plant .............................................. 12 2.2 Oxy-Combustion Application to NGCC Power Plant ............................................ 17
3. ADVANCED SUPERCRITICAL (ASC) PF POWER PLANT WITH CO2 CAPTURE. 17 3.1 Design Basis, Process Description and Performance .......................................... 17 3.2 Safety and Operability .......................................................................................... 45
4. NGCC OXY-COMBUSTION POWER PLANT WITH CO2 CAPTURE ...................... 55 4.1 Process Description and Performance ................................................................. 55 4.2 Safety and Operability .......................................................................................... 73
5. ECONOMICS ............................................................................................................ 77 5.1 ASC PF Oxy-Combustion Power Plant with CO2 Capture.................................... 77 5.2 NGCC Oxy-Combustion Power Plant with CO2 Capture ...................................... 81 5.3 Summary of Economic Results fof CO2 Capture .................................................. 85
6. FUTURE DEVELOPMENTS ..................................................................................... 85 6.1 ASC PF Plant with CO2 Capture........................................................................... 85 6.2 NGCC Oxy-Combustion Plant with CO2 Capture ................................................. 88 6.3 Air Separation ....................................................................................................... 88 6.4 CO2 Compression and Purification ....................................................................... 91
7. CONCLUSIONS AND RECOMMENDATIONS......................................................... 92
8. ACKNOWLEDGEMENTS ......................................................................................... 94
9. REFERENCES.......................................................................................................... 95
PROCESS FLOW DIAGRAMS TABLES FIGURES APPENDIX 1: ECLIPSE MODELLING OF ASC PF POWER PLANT WITH CO2 CAPTURE

Report No: E/04/031 Issue No.: 1 Confidential
3rd June 2005 Page 9 of 98 © Mitsui Babcock 2005
1. INTRODUCTION
1.1 Background
The IEA Greenhouse Gas R&D Programme has assessed and reported the relative cost of pre-combustion[1] and post-combustion[1A] CO2 capture technologies for power generation, except for oxy-combustion based technologies. The use of oxy-combustion (fossil fuel combusted with near pure oxygen and recycled flue gas or CO2 or water/steam) to produce a flue gas consisting essentially of CO2 and water is seen as having potential as a means of disposing of combustion related CO2. The advantage is that the flue gas is not diluted with nitrogen as when air is used for firing and therefore can be disposed of with minimal further downstream processing.
Previous work from a number of authors [2,3,4,5] as well as pilot and laboratory scale studies[2] have indicated that retrofit of oxy-combustion based technology to existing fossil fuel fired plant is feasible with little or no changes to the existing boiler pressure parts. Projected costs have generally been comparable with those for current pre- and post combustion capture technologies, the major costs compared with conventional air firing being associated with the production of the oxygen and the compression and treatment of the CO2 product.
Given the perceived benefits, the IEA Greenhouse Gas R&D Programme commissioned Mitsui Babcock to undertake a study to confirm the feasibility and projected costs for CO2 capture using oxy-combustion technology as applied to new-build power generation plant. The study was to be based on a bituminous pulverised fuel (PF) power plant and a natural gas combined cycle power plant.
A small experienced project team was assembled by Mitsui Babcock to execute the oxy-combustion study. The project team comprised of the following partners along with their anticipated split in the scope of work.
Mitsui Babcock acted as main contractor. As a manufacturer of large combustion plant, Mitsui Babcock assessed the aspects relating to the application of oxy-combustion technology to a new-build state-of-the-art PF-fired power generation plant.
Alstom Power developed the oxy-combustion process as applied to the natural gas power generation plant as well as providing details on the steam turbine island for both power generation schemes. Application of oxy-combustion technology to a natural gas combined cycle power plant will necessitate the design of a novel gas turbine due to the very large changes in gas properties from air to carbon dioxide and water.
Air Products plc applied their considerable expertise in air separation technology, downstream CO2 processing and systems integration to the two power generation plants considered in this study. Oxygen separation was based on cryogenic air separation.

Report No: E/04/031 Issue No.: 1 Confidential
3rd June 2005 Page 10 of 98 © Mitsui Babcock 2005
Imperial College London investigated possible integration opportunities and heat and power utilisation to maximise efficiency and minimise the cost of CO2 capture for the two power generation plants considered in the study.
1.2 Scope Of Work
This report presents the results of the following activities: -
1.2.1 Overview of Oxy-Combustion Processes
A general overview of the applicable oxy-combustion process with simplified block schemes of the main component variants. The reasoning behind the selection of the two representative processes for large-scale power generation based on a PF fired plant and a natural gas fired plant is clarified.
1.2.2 Process Flow Diagram and Heat & Mass Balance Calculations for the PF Plant
A high level process flow diagram (PFD) is developed and heat and mass balances (HMBs) compiled to model the overall oxy-combustion process for PF plant. The overall PFD is generated from iterations between independent flowsheets. Mitsui Babcock was responsible for the Once Through Super Critical Boiler Island (OTSC) and flue gas recycle components; Air Products for the Air Separation Unit (ASU) and CO2 purification and compression components and integration with the power plant, and Alstom Power for providing the steam turbine island input. Mitsui Babcock collated the overall PFD based on partners inputs. Consideration was given to possible integration opportunities and heat and power utilisation to maximise plant efficiency as investigated by Imperial College London. A criteria of 500MWe net power output, as set by the IEA in line with previous studies on post- and pre- combustion technologies was targeted.
1.2.3 Process Flow Diagram and Heat & Mass Balance Calculations for the NGCC Plant
A high level PFD is developed and HMBs compiled to model the overall oxy-combustion process for NGCC plant. This work being led by Alstom Power with input from Air Products regarding the ASU and CO2 compression components. A criteria of 500MWe net power output, as set by the IEA in line with previous studies on post and pre combustion technologies was targeted, however, in practise due to Gas Turbine sizing, a lower figure was actually achieved.
1.2.4 Safety and Operability
Any aspects of the oxy-combustion process which impacts on the safety and operability of the power plant are highlighted in the study. The study outlines the safety and operability requirements, however, it is not intended to resolve these issues within this report.

Report No: E/04/031 Issue No.: 1 Confidential
3rd June 2005 Page 11 of 98 © Mitsui Babcock 2005
1.2.5 Development Requirements
The principle equipment development requirements leading to demonstration of the oxy-combustion technology as perceived by the Project Team are outlined together with an order of magnitude of development costs.
1.2.6 Costs and Economics
In order to arrive at the power cost per kWh, an economic analysis has been executed by Mitsui Babcock using the IEA Greenhouse Gas R&D Programme ‘Technical and Financial Assessment Criteria : Revision B : May 2003 and IEA Greenhouse Gas standard economic assessment spreadsheet. The basic cost elements being capital cost (± 25%), operating cost and agreed economic parameters.
In order to compare the influence of discount rate and fuel costs on power costs, a sensitivity analysis is undertaken based on a 5% discount rate (compared to 10% for the base case) and fuel price variation from the base case of ±100%.
1.3 Deliverables
The deliverables of the study for each of the two greenfield power generation plants are as follows:
• General overview of oxy-combustion processes and simplified block diagram.
• Process description.
• High level process flow diagram and heat & mass balance.
• Major equipment list.
• Budget capital cost estimate (to within ± 25%).
• Operating cost estimate.
• Economic analysis: power cost in US c/kWh and CO2 emissions in g/kWh.
• Overview of integration opportunities and heat and power utilisation to minimise the cost of CO2 capture.
• Sensitivity of performance and costs to CO2 purity: 95% mol vs. 98%mol, at 110 bara.
• Sensitivity of abatement costs to discount rate and fuel cost.
• Statement regarding additional processing requirements for reduced SO2 and O2 contaminants in the final CO2 product.

Report No: E/04/031 Issue No.: 1 Confidential
3rd June 2005 Page 12 of 98 © Mitsui Babcock 2005
• Statement on issues associated with materials, corrosion and build-up of impurities.
• Statement on the requirements for plant start-up and shutdown.
• Development requirements and order of magnitude of development costs.
• Statement on safety requirements for oxygen handling.
2. OVERVIEW OF OXY-COMBUSTION PROCESSES
2.1 Oxy-Combustion Application to Utility Power Plant
2.1.1 Basic Oxy-Combustion Pulverised Coal Concept
An outline block flow diagram for conventional air-fired pulverised coal combustion is shown in Figure 1. Combustion air is divided into two flows. Approximately 25%, the primary air, is mixed with coal in the mills where (after heating by the flue gases) it serves to dry the coal, to circulate it within the mill, to carry it to the burners to provide pre-mixed oxygen for the early combustion stages. The secondary air is also heated by the flue gas and sent to the burners to provide the balance of the combustion air.
The 21/79 volumetric oxygen/nitrogen (atmospheric nitrogen) ratio in air is the main factor determining peak flame temperatures in the furnace (~ 2000 ºC adiabatic flame temperature), with the nitrogen acting as an inert dilutent. The furnace is designed to cool the flue gases by radiation to a temperature of about 1000 ºC at the exit so that fly ash particles have solidified sufficiently not to form intractable deposits on the convective passes.
In oxy-combustion the desired overall combustion process is coal with essentially near pure oxygen but, to use existing, proven boiler technology, flue gas must be recycled to take the place of primary air for pulverised fuel transport from the mills and to be an inert dilutent to moderate peak and exit combustion temperatures in the furnace, as shown in Figure 2. Because of the higher heat capacity of carbon dioxide a reduced inert gas/O2 ratio is required (approaching 2.5:1 instead of 4:1 for air).
The primary and secondary recycle flows are each approximately equal to the net products of combustion, but exact values vary with configuration and operating parameters such as required temperatures, fuel/oxidant ratios and assumed air in-leakage rates. The flow configuration options for cleaning and heating the recycle flows can also vary, as discussed below.
2.1.2 Black Coal Characteristics and Consequences for Primary Recycle Requirements
Black (Bituminous) coals are characterised by:
Report No: E/04/031 Issue No.: 1 Confidential
3rd June 2005 Page 13 of 98 © Mitsui Babcock 2005
• low reactivity - must be finely ground (e.g. 80% <75µm) for satisfactory ignition and burnout
• low grindability – rolling element pulverised coal mills with classifiers and oversize recycling are required
• hence large coal inventory in the mill - danger of fires and deflagrations
• Limited mill exit temperatures (typically 60-80ºC) - due to fire risk and also tendency for some coals to melt and adhere to the burner (can then cause severe overheating).
These characteristics have important consequences for black coal oxy-combustion plants.
• Primary recycle must be dry - needs to be able to carry coal moisture as vapour at relatively low temperatures.
• No oxygen to the mill – due to the risk of explosion if oxygen gets too high or recycle gets too low (this makes coal ignition more difficult and requires a higher concentration of O2 in the secondary recycle and/or direct oxygen addition at the burner). No safety case based on O2 detection and interlocks is likely to be acceptable given the number of mills, the frequency of mill start/stops and the very serious consequences of a mill explosion at elevated oxygen levels.
• Primary recycle temperatures limited by mill constraints such as mill bearings to 250-300ºC.
• Limited range of primary recycle flow rates that will give acceptable solids entrainment within the mill and through the classifier and out of the mill to the burners.
• Cannot have risk of acid corrosion in the complex mill machinery, so must have low SO3 content in the primary recycle.
(Note that the situation is entirely different for low rank brown coal plants. These are already designed to recycle flue gas from the furnace exit for the primary recycle stream and can use once-through beater mills/blowers because brown coals are friable and reactive.)
Although other configurations are possible in theory, the constraints above leave little latitude in practice in the way the primary recycle is handled with black coals. The primary stream must be cooled and scrubbed (i.e. with the product gas) to remove moisture and soluble acid gas components such as SO3 and HCl and then be reheated to 250-300ºC before feeding the mills.

Report No: E/04/031 Issue No.: 1 Confidential
3rd June 2005 Page 14 of 98 © Mitsui Babcock 2005
The ratio of coal to primary recycle is also fixed for current mill technologies. A similar volumetric flow rate would be required to give the same solids-carrying ability and hence a proportionally higher mass flow rate.
It would probably be feasible as a future development to design pulverised coal mills to handle acid recycle gases, although the widespread use of corrosion-resistant alloys that this would require would add considerably to the capital cost. It is also possible, however, that an entirely satisfactory compromise between corrosion and abrasion resistance would not be achievable, leading to high maintenance costs. It would also be feasible to operate with lower primary recycle flows, although the energy required to dry the coal will limit the amount this can be reduced, depending on coal moisture content and allowable/achievable primary recycle temperatures.
An alternative option would be essentially an indirect milling system, with hot air or dry nitrogen from the ASU used to dry the coal and transport it through the mill. After the mill the pulverised coal and air or nitrogen is separated; the air or nitrogen is vented and the coal is re-entrained in recycled flue gas. There is no loss in discarding the latent heat in the coal moisture, since the mill exit temperature will almost certainly be lower than the effective final boiler exit temperature. Such an indirect milling system would remove the need for the dry primary recycle, thus allowing all recycle gas to be recycled hot, benefiting overall plant efficiency. However, the milling plant becomes more complex and difficult to operate, and significantly less similar to the proven and robust direct fired pulverised coal plant.
2.1.3 Secondary Recycle Configuration Options
Options do exist for the way the secondary flue gas recycle is handled (see Table 1). In all cases solids removal is required in an electrostatic precipitator (ESP) to avoid excessive ash concentrations in the boiler flue gas passes and erosion of the hot recirculating fan. The secondary recycle must then be recycled to the boiler at ~ 300ºC, to promote ignition, and possibly have oxygen added. Three options are possible, characterised by increasing operating temperatures for the ESP and recirculating fan and greater gas/gas heat exchanger duties.
A) Figure 3 - Secondary recycle cooled close to ambient (i.e. below acid dewpoint), moisture condensed and SO3 removed before recycling through a gas/gas heater. ESP temperature limited by the acid dewpoint to about ~160ºC. Note: Acid dewpoint based on method illustrated by Pierce[5A] with assumption made on SO3 / (SO2+ SO3) conversion rate of 1.0%.
B) Figure 4 - Secondary recycle cooled but not below acid dewpoint, no moisture removal, recycled through a gas/gas heater. ESP temperature determined by heat balance; 230-270ºC depending on recycle flows and economiser gas exit temperatures.
C1) Figure 5 - Secondary recycle not cooled, recycled at ESP temperature ~300ºC, variation C1 (parallel gas heater and FWH) for subsequent heat transfer from combined product and primary recycle stream.

Report No: E/04/031 Issue No.: 1 Confidential
3rd June 2005 Page 15 of 98 © Mitsui Babcock 2005
C2) Figure 6 - Secondary recycle not cooled, recycled at ESP temperature ~300ºC, variation C2 (series gas heater and FWH) for subsequent heat transfer from combined product and primary recycle stream.
C3) Figure 7 - Secondary recycle not cooled, recycled at ESP temperature ~300ºC, variation C3 (FWH only) for subsequent heat transfer from combined product and primary recycle stream.
Efficiencies are likely to increase slightly from A to C because the average temperature for potential low temperature heat recovery in the flue gas feed water heater will increase, but there is a finite scope to use heat at these temperatures in the steam cycle (for feed water heating). Equipment design moves further from conventional configurations from options A to C, possibly leading to higher costs and certainly affecting the ability to switch between oxy-combustion and air-fired operation.
In this study option B has been used as representing a reasonable compromise between optimising efficiency and matching current practice.
2.1.4 Excess Oxidant, Oxygen Addition and Air Leakage
Typically 15-20% excess air is required in pulverised coal combustion to ensure adequate burnout. The amount of excess air is thought to be largely determined by inevitable variations in air/fuel distribution between burners in multi-burner installations rather than the need to achieve a particular oxygen concentration. It is essential that burners with high fuel loadings and low air flow rates still have a slight excess of air, otherwise very high unburnt carbon levels will inevitable occur (typical burnout levels are of the order of 99% conversion). Non-ideal fuel distributions are still likely to occur with oxy-combustion. Oxygen distribution may also be at least as variable if it is added to the secondary recycle, since any mixing variations must be compounded with total flow variations. Improved (and more controllable) oxygen distribution could probably be achieved with direct oxygen supply to the burners. An excess oxygen level at the burner from all sources (recycle and added oxygen) equivalent to a 10-20% excess air would therefore appear reasonable.
As already discussed due to safety considerations, it appears inadvisable to add oxygen to the primary recycle. If all the combustion oxygen is added to the secondary recycle oxygen concentrations will be in the region of 50% by volume. Systems with oxygen purities greater than 40% by volume must comply with strict rules for metals selection and vapour velocity. Systems with oxygen purities from 23% to 40% by volume, in regards to metals selection, may be designed as an air system and the rules for oxygen velocity do not apply. However, the system shall still be designed as a clean gas system with full compliance for oxygen cleanliness and compatibility of non-metallic materials. It therefore appears that at least some of the oxygen must be added at the burner and that 23 mol% oxygen should be the limit set for the secondary recycle.

Report No: E/04/031 Issue No.: 1 Confidential
3rd June 2005 Page 16 of 98 © Mitsui Babcock 2005
Virtually all coal-fired boilers are designed to be operated under slight suction to avoid danger to operators and equipment from leakage of hot gases, dust and carbon monoxide and current construction methods appear unlikely to be suitable for any other approach. Even if an unusually gas-tight containment could be achieved with a newly commissioned plant thermal distortion and cracking is likely to lead to a decrease in containment integrity between major overhauls at 3-5 year intervals. Tramp air Leakage levels in line with expectations for current new plant (see Section 3.1.1) therefore appear likely. (Note: oil and gas boilers can be designed for pressurised operation).
With any appreciable level of air in-leakage it becomes impossible to avoid the need for inert gas removal from the CO2 product to achieve design purity. The extra capital and power associated with high purity oxygen is not justified. Lowering the oxygen purity will significantly reduce the power consumption of the ASU. An oxygen purity of 95% v/v used in this study is considered to represent a reasonable compromise between inert removal and oxygen production costs.
2.1.5 Integration and Performance Optimisation
The main scope for integration to optimise overall system performance is the appropriate use of the additional low-temperature heat available in the oxy-combustion configuration from:
• Flue gas cooling to ambient (in modern air-fired combustion plant with FGD, flue gas feed water heaters are in use for a similar duty).
• Heat rejected from gas compressors (the main air compressor in the ASU and the CO2 compressor are operated adiabatically with heat recovery to the condensate and boiler feedwater.)
Heat can (if available) be used at all temperatures up to the boiler feed water temperature at the economiser inlet for feed water heating (FWH). This displaces steam bled from the steam turbine for feed water heating and allows more power to be produced in the turbine.
Only limited amounts of heat can be used over any given temperature range, but sufficient scope exists for both of the above heat recovery options. It is also necessary to coordinate auxiliary feed water heating with the constraints on steam tapping pressures in the main steam cycle for the deaerator and higher pressure FWH.
In this study, two stages (before and after the deaerator) of flue gas FWH are employed using heat from the combined primary recycle and product gas stream after the ESP. Other feed water heating from the air separation unit compressor aftercoolers and CO2 compressor aftercoolers is used to replace steam abstraction from the low and intermediate pressure steam turbines for most of the conventional steam feed water heating requirements.

Report No: E/04/031 Issue No.: 1 Confidential
3rd June 2005 Page 17 of 98 © Mitsui Babcock 2005
2.2 Oxy-Combustion Application to NGCC Power Plant
2.2.1 Gas Turbine Oxy-Combustion Cycle Concept Selection
To date, numerous studies have been undertaken with regards gas turbine oxy-combustion concepts, notably by Mathieu and Bolland [6-25].
There is a choice[26] when considering a gas turbine combined cycle power generation system designed for CO2 capture.
• Pre-combustion CO2 removal from a fossil fuel[1] which would be converted into hydrogen which would fuel a conventional air cycle gas turbine having a combustion system designed for use with a hydrogen rich fuel gas.
• Oxy-combustion of a fossil fuel in a gas turbine involves combustion of the fossil fuel in near pure oxygen diluted with compressed recycled flue gas which would be predominantly CO2. This means that the gas turbine working fluid is CO2 rich gas and that all of the oxygen required for combustion must be provided from an air separation system. This gas turbine configuration will require a completely new gas turbine design since the physical properties of CO2 are different from air.
• Post-Combustion CO2 removal involving the separation of CO2 from flue gas by means of scrubbing the flue gas with a chemical solvent (usually amine) and then heating the solvent to release high purity CO2
[1A].
The oxy-combustion gas turbine with CO2-rich gas as the working fluid is the process system considered in this study.
3. ADVANCED SUPERCRITICAL (ASC) PF POWER PLANT WITH CO2 CAPTURE
3.1 Design Basis, Process Description and Performance
Section 3.1.1 below presents the summary of the ground rules used as the design basis for the study, as agreed with project partners. Descriptions of the base case ASC PF power plant without CO2 capture and the ASCl PF power plant with CO2 capture are presented alongside heat and mass balances and performance data for the respective processes are presented in Sections 3.1.2 and 3.1.3 respectively.
3.1.1 Technical & Financial Ground Rules
The main technical / financial ground rules for this study have been based on IEA GHG R&D programme Technical & Financial Assessment Criteria [27]. Key points are summarised below:

Report No: E/04/031 Issue No.: 1 Confidential
3rd June 2005 Page 18 of 98 © Mitsui Babcock 2005
Technical Design Basis:
Site Conditions
Ambient Air temperature: 9 °C
Ambient air relative humidity: 60%
Ambient air pressure 1.013 bar
CO2 Processing
Minimum CO2 capture level is to be 80%, with the preferred level 85%
CO2 is to be compressed to 110 bara before injection into the transfer pipeline.
Further detailed operating parameters for the ASC PF plant with CO2 capture were established based on discussions and agreement with all partners and the appropriate IEA GHG R&D programme representative. These parameters being specifically:
Size of Power Plant
The study would compare both PF and NGCC plant with CO2 capture, therefore the size of the associated plants were required to be similar. The net power output for both power plants was specified[27] as 500 MWe. Therefore, based on plant ancillary power approximations, a gross power output of 740 MWe was targeted for the PF power plant with CO2 capture and gross output of 575 MWe targeted for NGCC plant with CO2 capture based on GT size.
After detailed modelling of the ancillary plant, particularly the ASUs and CO2 treatment plants, the net power outputs with CO2 capture were 532 MWe for the PF plant and 440 MWe for the NGCC plant. The PF oxy-combustion process could be remodelled to converge on 500 MWe net output but time did not allow this level of interaction between all of the integrated plant elements.
O2 Purity
The O2 purity supplied by the Air Separation Unit (ASU) was specified at 95 %v/v, this figure being derived from previous studies[28] as the optimum purity associated with oxy-combustion PF plant given tramp air ingress as discussed below.
Recycle rate
A recycle rate of approximately two thirds of the flue gas was used in this study for the ASC PF Oxy-Combustion Power Plant, and is consistent with previous studies in the oxy-combustion field. This rate was set to maintain acceptable combustion temperatures based on current air–fired PF boiler technology.

Report No: E/04/031 Issue No.: 1 Confidential
3rd June 2005 Page 19 of 98 © Mitsui Babcock 2005
Coal Specification
The bituminous coal specification[27] is presented in Table 2.
Tramp Air Ingress
Tramp air ingress is a fact of life on large boiler plant with balanced draught. For safety reasons these boilers operate under suction from the burner exit (i.e. in the furnace chamber) through to the induced draft fan. Hot flue gases are therefore prevented from leaking out of the boiler casing; any leakage is of cold air into the flue gas stream. In conventional plant such in-leakage represents a loss in efficiency and active measures are taken to keep any such infiltration to a minimum. The major sources of air in-leakage are through openings in the furnace membrane wall, penetrations in the boiler casing for the hot pipework to the boiler heating surfaces, at the induced draft fan, in the ash removal unit and through any gaps/penetrations/expansion joints in the ducts and casings.
Obviously any air in-leakage has a detrimental effect on the efficiency of the proposed process as it can significantly increase the duty of the CO2 purification plant.
The ASC PF plant with CO2 capture performance model was based on sensible levels of tramp air ingress associated with boiler and balance of plant:
• Furnace + boiler air infiltration rate = 0.01kg air / kg flue gas
• Electrostatic precipitator (ESP) air infiltration rate = 0.02kg air / kg flue gas
Further cost may be incurred throughout the lifetime of the boiler, to ensure reasonable levels of sealing are maintained.
Water
The use of sea water is assumed for cooling; Average inlet temperature 12°C; maximum temperature rise 7°C; salinity 22 grams/litre.
Fuels
Bituminous coal and natural gas are used as the design fuels. The cost of the coal delivered to site is assumed to be 1.5 US$/GJ (LHV Basis). The cost of the natural gas delivered by pipeline to site is assumed to be 3.0 US$/GJ (LHV Basis). Sensitivity to the cost of power generated for a range of fuel prices (0-3 US$/GJ for coal and 0-6 US$/GJ) for gas is considered.

Report No: E/04/031 Issue No.: 1 Confidential
3rd June 2005 Page 20 of 98 © Mitsui Babcock 2005
Financial Assessment Base Data
Location
A green field site with no special civil works will be assumed. Adequate plant and facilities to make the plant self sufficient in site services will be included in the investment costs.
Currency
The results of the studies will be expressed in US $ applicable to a specific year. (Note: An exchange rate of 1 Euro = 1.2 US $ has been applied).
Design and Construction
As projected finances can be sensitive to the time required to erect the plant the following factors have been applied:
For PF: Year 1 20% investment
Year 2 45% investment
Year 3 35% investment
For NGCC Year 1 40% investment
Year 2 40% investment
Year 3 20% investment
Load Factor
Defined as the achieved output as a percentage of rated nameplate capacity. A load factor of 85% has been applied to both PF and NGCC cases.
Project Life
A design life of twenty five years is assumed as the basis for the economic appraisal.
Discount Rates
Discounted cash flow calculations will be expressed at a discount rate of 10% and to illustrate sensitivity, at 5%.
Contingencies
A contingency is added to the capital cost to allow for unforeseen set backs, cost under estimates, programme overruns. The value of the contingency is taken as 10% of the installed plant costs.

Report No: E/04/031 Issue No.: 1 Confidential
3rd June 2005 Page 21 of 98 © Mitsui Babcock 2005
Fees
Fees are taken as 2% of the installed plant costs. These include process/patent fees and costs, fees for agents or consultants, legal and planning costs land purchase surveys and general site preparation.
Owners Costs
Owners costs are 20% of the installed plant costs for the PF air firing plant. For the PF capture plant the owners costs were assumed as 16% due to the influence of the ASU and CO2 compression train which have a lower owners cost attributed of 5% of the installed plant costs.
Owners costs are 5% of the installed plant costs for the NGCC plant for both air-fired and CO2 capture plants.
Operating Costs
Operating costs are made up from variable costs and fixed costs. The fixed costs are generated from the sum of direct labour, administration and maintenance, where administration is considered at 30% of the labour costs and the maintenance 4% of the installed costs (excluding contingency). The variable cost is essentially the fuel costs.
3.1.2 ASC PF Air Fired Power Plant Without CO2 Capture: Base Case Process Description
3.1.2.1 Description
HP HEATER
MILL
HP PUMP
LP HEATER
STACK (START
UP)
ESP
ID FAN DEAERATOR
COAL
HP
IP
LP
CONDENSOR
COLD FD FAN
LP PUMP
AIR IN
ADVANCED SUPERCRITICAL BOILER
FGD
Figure 8: Conventional Air Fired PF Bituminous Plant Arrangement

Report No: E/04/031 Issue No.: 1 Confidential
3rd June 2005 Page 22 of 98 © Mitsui Babcock 2005
Figure 8 outlines the conventional plant arrangement for the combustion of pulverised coal for large scale steam raising electricity generation without CO2 capture.
Wet coal, containing around 10% moisture, is supplied to the milling plant where it is pulverised to typically 70% passing 75 micron. Whilst in the mill the coal is also dried, the air temperature at the mill inlet being controlled to give a mill outlet temperature of typically 90°C. The combustion air itself is preheated to typically 270°C in a regenerative airheater by the flue gases leaving the boiler. Around 20% of the combustion air is supplied to the mills and transports the pulverised coal pneumatically to the burners. The remaining 80% of the combustion air is supplied directly to the furnace chamber, either at the burners or as overfire air in the case of furnace air staging for NOx control.
The coal is burnt in a highly radiant flame where it releases its heat. About 35% of the heat is absorbed in the radiant furnace chamber, 15% to the radiant platen superheaters suspended in the upper region of the furnace chamber, and 40% by convective heat transfer to superheater, reheater and economiser surfaces in the boiler and to the airheater. The remaining 10% is lost, predominantly in the sensible heat of the flue gases exhausted to the stack, giving a typical overall thermal efficiency of the plant (i.e. chemical heat to steam) of around 90%.
In modern pulverised coal fired utility furnaces the coal is burnt with typically 17½% excess air, giving rise to a flue gas at the boiler exit of the following composition:-
% w/w % v/v
Oxygen 3.45 3.21
Carbon dioxide 20.92 14.14
Sulphur dioxide 0.39 0.18
Water 5.02 8.30
Nitrogen 70.21 74.18
100.00 100.00
The flue gases also contain NOx ash and Hg. The concentrations of these species can vary considerably from plant to plant and are dependent upon the equipment installed and how well it is maintained. For a modern well maintained plant within low NOx burners installed NOx emissions are typically around 350 ppm at 6% O2 v/v dry.
The scale of the required CO2 separation duty becomes apparent when one considers that a single 660 MWe unit produces 680 kg/s of this flue gas. Whilst there are a number of processes available to remove the CO2 from the flue gas the problem is one of size - the cost of treating such a large quantity of flue gas

Report No: E/04/031 Issue No.: 1 Confidential
3rd June 2005 Page 23 of 98 © Mitsui Babcock 2005
economically. It is by seeking to minimise the problem rather than treating the products arising from combustion which gives rise to the CO2 removal system upon which the project is based.
3.1.2.2 Case 1: ASC PF Air fired Power Plant without CO2 Capture: Process Flow Diagram
For the costing purposes of this study and to highlight differences between conventional plant and plant designed for CO2 capture, the key components of the ASC PF air-fired power plant without CO2 capture have been identified as units. PFD 1 illustrates the major components and process streams for a conventional ASC PF power plant. Namely:
Unit 100: Coal and ash handling
Unit 200: Boiler island
Unit 300: FGD and handling plant
Unit 400: DeNOx plant
Unit 500: Steam turbine island
Unit 800: BOP, electrical C&I
These can therefore be directly compared with the key equipment requirements of the PF power plant with CO2 capture.
3.1.2.3 Case1: ASC PF Air Fired Power Plant without CO2 Capture: Performance
A 740 MWe gross (677MWe net), balanced draught, advanced supercritical PF power plant with 290 bara/600oC main steam and single reheat to 620oC was employed as the base case (Case 1) scenario. The overall net cycle efficiency for the plant is 44.2% (LHV) based on a condenser pressure of 40mbar. The PF plant included Selective Catalytic Reduction (SCR) and Flue Gas Desulphurisation (FGD) equipment to meet current NOx and SOx emissions legislation.
The breakdown of the total auxiliary power consumption associated with this plant is presented in Table 3.
3.1.3 Case 2: ASC PF Oxy-Combustion Power Plant with CO2 Capture: Process Description
3.1.3.1 General Description
The flue gas produced by the combustion of coal in air is mostly nitrogen. If the air is separated into its constituent components prior to combustion and only oxygen is supplied to the furnace then the resulting flue gas will contain only the products of combustion - the inert nitrogen “ballast” will have been eliminated and the quantity of flue gas to be treated will be significantly reduced.

Report No: E/04/031 Issue No.: 1 Confidential
3rd June 2005 Page 24 of 98 © Mitsui Babcock 2005
This removal of the nitrogen ballast is at the heart of the proposed process. However the reduced mass and volume flow through the plant is perceived to lead to a number of difficulties if applied directly to conventional combustion plant. In the furnace chamber the introduction of the same quantity of heat to a reduced mass of combustion products is believed to result in greatly increased temperatures. As a result increased radiant heat pick-up, greater slagging and higher NOx emissions are all anticipated. Furthermore, the reduced volumetric flow (and hence gas velocity) in the convective passes of the boiler leads to lower heat transfer coefficients and reduced heat absorption. Therefore the overall balance of the heat absorbed throughout the unit is likely to be so disturbed as to make the plant inoperable without substantial modification to the heating surfaces.
The problem is simply resolved by recycling a proportion of the flue gas back to the furnace so as to maintain the mass/volume flow at an acceptable level. It is therefore possible to devise a conceptual process diagram whereby an existing pulverised coal fired utility boiler can be operated without nitrogen being present in the flue gas, resulting in a substantial reduction in the quantity of flue gas that must be treated in downstream processing equipment to capture the CO2.
Figure 9 shows the arrangement selected for the basis of this particular study. There are three key features that distinguish the process from conventional coal combustion plant
• The combustion air is separated prior to the furnace in an air separation plant - only the oxygen (95 mol% oxygen with 2 mol% nitrogen and 3 mol% argon) is supplied to the combustion process, the nitrogen/argon is vented to atmosphere.
• Part of the flue gas leaving the boiler, around one third of the total flow, is recirculated back to the burners to provide the part of the ballasting effect formerly carried out by the atmospheric nitrogen.
• The net flue gas is cooled and passed to the CO2 compression and inerts separation plant. The gas is further cooled by direct water contact which removes residual ash, the primary recycle is separated and recycled to the coal mill. The net product is compressed, dried, the inerts separated and the pure CO2 is further compressed to pipeline pressure of 110 bara.

Report No: E/04/031 Issue No.: 1 Confidential
3rd June 2005 Page 25 of 98 © Mitsui Babcock 2005
Figure 9: Oxy-Combustion ASC PF Power Plant with CO2 Capture: Plant Arrangement
Utilising oxy-combustion and flue gas recycling, the supercritical boiler takes 524 kg/s of feed water (325 bara @ 270°C) and generates 516 kg/s of HP steam (290 bara @ 600°C) and 411 kg/s of reheat steam (60 bara @ 620°C) at the steam turbines.
To ensure complete combustion excess O2 at the burners is maintained at 19% over the amount required for stoichiometric combustion (i.e. similar levels of excess air with air firing). The oxygen flow (127.1 kg/s) is supplied at 95%v/v purity to the burners via the ASU. This cryogenic system developed by Air Products is described in detail in (Section 3.1.3.2.3).
Two streams of recycle flue gas are required for the oxy-combustion system:
• Primary recycle (152 kg/s) which passes through the coal mills and transports the PF to the burners. The volumetric flow rate of primary recycle gas is maintained at value required for air firing.
• Secondary recycle (258 kg/s) which provides the additional gas ballast to the burners to maintain temperatures within the furnace at similar levels to air firing.
The combined primary and secondary gas recycle is approximately 67% of the original flue gas leaving the economiser.
The flue gas exiting the boiler at 340°C is used to heat the primary and secondary recycle flue streams via a regenerative gas / gas heater. The flue gas is de-dusted via the ESP. The clean flue gas is then split into two, with one stream forming the secondary recycle and returning back through the gas / gas heater (exit temp 330°C) to the burners. The remaining stream is cooled, dried and split again to form primary
HP HEATER
MILL
3
HP PUMP
LP HEATER
1 - IP STEAM BLEED 2 - HEAT FROM ASU ADIABATIC MAC 3 - CO2 COMPRESSOR STAGE HEAT 4 – FLUE GAS FEEDWATER HEATING
4
GAS DRIER
STACK (START
UP)
ESP
AIRINTAKE
START UP
ID FAN
FD / RECYCLE
FAN
GAS
/
GAS
DEAERATOR
COAL
NITROGEN
AIR
ASU
ADVANCED SUPERCRITICAL BOILER
HP
IP
LP
CONDENSOR
COLD PA FAN
SECONDARY RECYCLE
LP PUMP
GAS COOLER & WATER REMOVAL
CO2 PRODUCT FOR COMPRESSION
PRIMARY RECYCLE
OXYGEN
4
1 2 3 4
34
CO2 PURIFICATION
INERTS
2
3
Gas / Gas
Heater

Report No: E/04/031 Issue No.: 1 Confidential
3rd June 2005 Page 26 of 98 © Mitsui Babcock 2005
recycle and CO2 product streams respectively. The primary recycle passes through the gas / gas heater (exit temperature 250°C) and is delivered to the coal mills. The PF is dried in the mill using this flow (mill exit temperature 105°C) and transported to the burners.
The net flue gas is then passed through a compression and inerts removal stage that delivers a final CO2 product (126.96 kg/s) of 95% v/v purity, at 110 bara. The details of the compression and inerts removal are described in (Section 3.1.3.2.4).
Although the process concept is very simple in principle there are a number of possible options for its implementation on existing and new plant designs. These options have been discussed previously in Section 2.0 of the report. However, the main advantages / disadvantages associated with the process scheme (option B) adopted are as follows:
Advantages
• Low moisture content in primary recycle flue gas to milling plant.
• Minimum quantity of recycle gas being cooled and reheated, thus efficiency benefits.
• Concept applicable to normal start up with air firing.
• Concept utilises conventional plant equipment and layout (e.g. Gas Airheater and ESP positioning).
• Minimum number of fans required for air start up and oxy-combustion operation (3 fans x 2 flue gas streams or 3 fans x 1 flue gas stream depending on boiler flue gas configuration).
Disadvantages
• The design and performance of the ESP will require to take into consideration the impact of elevated flue gas inlet temperatures on ash resistivity based on the sulphur content of the range of coal qualities fired.
• Higher levels of flue gas recycle system impurities such as SO2 and HCl and their impact on the boiler flue gas passes.
3.1.3.2 Case 2: ASC PF Oxy-Combustion Power Plant with CO2 Capture: Process Flow Diagram
PFD 2 illustrates the major components and process streams the Case 2 ASC PF Power plant with CO2 capture:
Unit 100: Coal and ash handling
Unit 200: Boiler island
Report No: E/04/031 Issue No.: 1 Confidential
3rd June 2005 Page 27 of 98 © Mitsui Babcock 2005
Unit 500: Steam turbine island
Unit 600: Air Separation Unit
Unit 700: CO2 compression & inerts removal
Unit 800: BOP, electrical C&I
In comparison with the base case plant without CO2 capture (Case 1), Unit 300: FGD and Unit 400: DeNOx are no longer required with the addition of Unit: 600 Air Separation Unit and Unit: 700 CO2 Compression & Inerts Removal, a detailed description of these units and their stream data is provided in Sections 3.1.3.2.3 and 3.1.3.2.4.
Furthermore, for the CO2 capture Case 2, a greater degree of heat integration among separate units is possible. Both condensate heating and boiler feedwater heating is utilised between the steam turbine island, the ASU plant, the boiler island, and the CO2 compression and inerts removal plant. This is further discussed in Section 3.1.3.2.4.
3.1.3.2.1 Boiler Island
Mitsui Babcock, utilising the Eclipse simulation package generated a heat and mass balance for the overall power plant oxy-combustion process. The model is based around the boiler island with inputs from Alstom Power for Unit 500: steam turbine island and Air Products for Units 600: ASU and 700: CO2 compression / inerts removal. The detailed results of the Eclipse model are included in Appendix 1.
3.1.3.2.2 Steam Turbine Island
Figure 10 presents the proposed arrangement for the turbine island for the oxy-combustion PF power plant with CO2 Capture. The diagram shows the condensate preheat and feed water heating train utilising the available heat from the ASU, CO2 compression / inerts removal and flue gas sources in order to maximise the overall efficiency of the plant.
For air firing plant the condensate leaving the condenser would conventionally be heated utilising several feed water heaters fed with turbine bled steam, however, for the CO2 capture plant, only a single feed heater is required for condensate preheating prior to the deaerator, as some 124.3MWt of heat is sourced from the other plant units (18.7MWt from the flue gas, 55.3MWt from the ASU and 50.3MWt from the CO2 plant). This integration is later discussed in detail in Section 3.1.3.7.
Following the condensate preheating the water is passed through the deaerator (operating at 6 bara) and then pumped to the required operating pressure (339 bara). The high pressure stream is then split to make use of heat from two different sources. The first stream is heated by the flue gas (28MWt) and then further heated by a feed water heater using turbine bleed. The second stream bypasses the feed

Report No: E/04/031 Issue No.: 1 Confidential
3rd June 2005 Page 28 of 98 © Mitsui Babcock 2005
heater and is heated exclusively by the CO2 compression unit (16MWt) before being re-combined with the original stream. Two further feed heaters using turbine extracted stream, raise the temperature to the required economiser inlet temperature.
The ASC boiler elevates the temperature of the feedwater to 290 bara @ 600°C steam condition which is then delivered to the HP steam turbine. Steam is extracted from the later stages of the HP turbine to feed the last feed water heater (HP FWH 5). Upon exiting the HP turbine, a portion of steam is bled and utilised in the second to last feed water heater (HP FWH 4) with the remaining steam returned to the boiler to be reheated. Following reheat, the steam enters the IP turbine at 60 bara @ 620°C where a bleed is taken in the later stages of the turbine to feed the first stage feed water heater (HP FWH 3).
Some of the steam exiting the IP turbine en route to the LP turbine is sent to the deaerator. Within the LP turbine, steam is bled to the remaining single condensate feed heater (LP FWH 1). Finally, the vapour exiting the LP turbine is sent to the condenser (40 mbara) where seawater at 12°C provides the source of cooling that returns the stream to a condensate ready to be recirculated.
3.1.3.2.3 Air Separation Unit
The amount of oxygen required for the ASC PF boiler is 10,400 tonne/day. Currently, the largest plants in construction are 3,750 tonnes/day. The proposal for the production of oxygen in this case is to use two cryogenic ASUs of 5,200 tonnes/day. This is within the range of plant output currently being offered for sale. The single train axial flow air compressors required for this duty are available commercially.
The cycle chosen is one in which gaseous oxygen (GOX) is produced by boiling liquid oxygen (LOX) which is ideally suited to this application as the delivery pressure required is low. There is no requirement for either pumping the liquid O2 or compressing the gaseous product.
A low purity cycle was chosen, which produces 95% oxygen purity. Other studies have been carried out to show that for oxy-combustion plants this is the optimum purity. Even new balanced-draught boiler plant are expected to have air in-leakage, and therefore there will always be some inerts that must be removed in the CO2 purification plant. Also, the increase in power required for the ASU to produce 99.5% purity oxygen is greater than the increase in CO2 compression power required to remove the inerts introduced due to the lower purity oxygen.
Cycle Description
To minimise the ASU power consumption because of its importance in this application, an innovative cycle has been chosen that uses two high pressure columns. A process flow diagram of the process and the mass balance is given in PFD 3. A summary of the utility requirements is given below:

Report No: E/04/031 Issue No.: 1 Confidential
3rd June 2005 Page 29 of 98 © Mitsui Babcock 2005
Summary of Utility Requirements
Per Plant Total
Power, (MWe) 43.37 86.74
Cooling Water, (tonne/hr) 417 834
Steam for ASU TSA regeneration (at 170°C), (MWt) 3.5 7.0
Condensate Preheating, (MWt) 27.6 55.3
The standard double column cycle has a low pressure column (C105) with its reboiler (E103) integrated with the condenser of a high pressure column (C104). The column pressures are set to give a temperature driving force in the reboiler/condenser E103. In this cycle an extra column is added operating at an intermediate pressure (C103). The condenser (E104) for this column also integrates with a reboiler in the low pressure column but at a lower temperature, boiling a liquid stream higher up within the low pressure column.
This arrangement minimises the amount of feed air that must be compressed to the higher pressure of C104, leading to the low power requirement of this process cycle.
Due to the size of this plant and the two pressure levels of compression, another feature of this cycle is that there are dryers in two locations; after compression for feed to the intermediate pressure column and after compression to the high pressure column pressure, Thus requiring smaller vessels than if only one system were used for the total flow of air.
The plant consists of:
1) A compression system
2) An adsorption front end air purification system
3) A cold box containing the separation and the heat exchanger equipment
This process offers the benefits of high reliability, low maintenance cost and is simple to install and operate.
Air Compression and Cooling
Air is taken in through an inlet filter to remove dust and particulate matter prior to entering the main air compressor (MAC) where it is compressed to 3.5 bara using an adiabatic compression arrangement, shown in Figure 11. An axial compressor is used to compress the feed air without intercooling so as to provide a higher temperature air stream to use as a source of heat for preheating condensate for the ASC PF power plant.

Report No: E/04/031 Issue No.: 1 Confidential
3rd June 2005 Page 30 of 98 © Mitsui Babcock 2005
The air discharge is further cooled in the Direct Contact Aftercooler (DCAC) with chilled water from the Chiller Tower which uses evaporation of water into the dry waste nitrogen stream leaving the ASU cold box to further cool part of the plant cooling water. The air is cooled to a temperature of around 12°C. The main air compressor will be an in-line axial compressor driven by an electric motor. Around half of this compressed air stream is then further compressed in a single radial wheel to 5.0 bara, cooled to ambient and compressed in the compressor wheel of the coupled compressor/expander K103/K104 to 5.4 bara. The air is then cooled to 12°C in a second direct contact column.
Air Cleanup
Before the air is cooled to cryogenic temperatures, water vapour and carbon dioxide and other trace impurities such as hydrocarbons and nitrous oxide are removed in a pair of dual bed adsorbers. One pair is used to purify the 3.5 bara air stream and the other purifies the 5.4 bara stream. Removal of carbon dioxide and water avoids blockage of cryogenic equipment. The removal of impurities results in a clean, dry air stream free from contaminants which might cause blockages or safety problems in ASU operation. The adsorber operates on a staggered cycle, i.e. one vessel is adsorbing the contained impurities while the other is being reactivated by low pressure gaseous waste nitrogen using a temperature swing adsorber cycle. The nitrogen is heated to around 160°C against condensing steam in a reactivation gas heater followed by a period in which the bed is cooled down with ambient temperature nitrogen which bypasses the heater. The adsorbents used are generally selected for optimum operation at the particular site. They consist of layers of alumina or silica gel plus layers of zeolite. The adsorber vessels are vertical cylindrical units having annular adsorbent beds.
Principle of Cryogenic Air Separation
The industry standard method of cryogenic air separation consists of a double column distillation cycle comprising a high pressure (HP) column (C104) and a low pressure (LP) column (C105) as shown in PFD 3. The high pressure, higher temperature cryogenic distillation produces an overhead nitrogen product that is condensed against the low pressure, low temperature liquid oxygen in the LP column sump. The plate-fin condenser-reboiler (E103) sits in the LP column sump and thermally links the HP and LP column. The HP column nitrogen provides the boil up for the LP distillation column and the LP column oxygen provides the condensing duty for the HP column. Some of the condensed nitrogen returns to the high pressure column as reflux. The balance of the pure nitrogen reflux is cooled in the subcooler (E102) and flashed into the top of the low pressure column as reflux. The columns have aluminium structured packing optimised for cryogenic separation. In this cycle an extra column is added operating at an intermediate pressure (C103). The condenser E104 for this column also integrates with a reboiler in the low pressure column but at a lower temperature, boiling a liquid stream higher up within the low pressure column.

Report No: E/04/031 Issue No.: 1 Confidential
3rd June 2005 Page 31 of 98 © Mitsui Babcock 2005
Cooling and Refrigeration
Following the two front end adsorber systems (C101 and C102), both the intermediate and high pressure air streams are split in two. These four streams (4, 6, 14 and 18 as shown in PFD 3) are fed directly to the main heat exchanger (E101). This consists of a number of parallel aluminium plate-fin heat exchanger blocks manifolded together.
The intermediate pressure stream 4 is cooled close to its dew point (-178°C) and fed to the bottom of the intermediate pressure column (C103). The second intermediate pressure stream 6 is removed from the main heat exchanger at -171°C then expanded in a centrifugal single wheel expansion turbine K104 running on the same shaft as a single wheel centrifugal compressor K103 which adsorbs the expander power. The expanded air is fed to the middle of the low pressure column (C105) at a pressure of about 1.4 bara and –188°C to provide refrigeration for the operation of the ASU. The high pressure stream 18 is cooled close to its dew point (-173°C) and fed to the bottom of the high pressure column (C104). The second high pressure air stream is cooled and condensed in the main heat exchanger against boiling oxygen. The resulting liquid air from the main exchanger is fed to the middle of both the high pressure and intermediate pressure columns.
Distillation System
In the high (C104) and intermediate pressure (C103) columns, the gaseous air feed is separated in the distillation packing into an overhead nitrogen vapour and an oxygen-enriched bottom liquid. The nitrogen vapour from the high pressure column is condensed against boiling oxygen in the low pressure column sump and split into two parts. The first part is returned to the high pressure column as reflux, whilst the second part is subcooled, reduced in pressure and fed to the low pressure column (C105) as reflux. The nitrogen from the intermediate pressure column (C103) is condensed against a boiling liquid stream in the low pressure column. Part of this nitrogen is used as column reflux in the intermediate pressure column and part is subcooled and added to the reflux to the low pressure column.
Crude liquid oxygen is withdrawn from the sumps of the high and intermediate pressure columns, cooled in the subcooler (E102) against warming waste nitrogen and is flashed to the low pressure column as intermediate feeds. A portion of liquid air is also withdrawn from the middle of the high pressure column. This liquid is subcooled in the subcooler and fed to the middle of the low pressure column.
Low Pressure Column
The feeds to the low pressure column are separated into a waste nitrogen overhead vapour and a liquid oxygen bottom product, which reaches the required purity of 95% by volume. At present the nitrogen is vented to atmosphere, however, there is potential to utilise this warm dry nitrogen stream within the coal drying process.

Report No: E/04/031 Issue No.: 1 Confidential
3rd June 2005 Page 32 of 98 © Mitsui Babcock 2005
The waste nitrogen is withdrawn from the top of the low pressure column and warmed in the subcooler and the main heat exchanger. A portion of the nitrogen stream from the main exchanger is used for adsorber reactivation. The remaining dry nitrogen is vented through a Chilled Water Tower to produce chilled water by evaporative cooling. The chilled water is used to provide additional feed air cooling in the top section of the DCACs.
Pure liquid oxygen is withdrawn from the reboiler sump of the low pressure column and is returned to the main heat exchanger where it is vaporised and warmed up to ambient conditions against boosted air feed to the columns. The gaseous O2 is then regulated and supplied to the power plant. The pressure in the low pressure column is typically 1.35 bara. The hydrostatic head between the sump of the LP Column and the LOX boil heat exchanger results in the O2 product being available at approximately 0.6 barg.
Oxygen Backup
The PF boilers will be designed in such a way as to allow air-firing as a fall-back position should there be an interruption in supply from the ASUs. Therefore, adequate backup for the ASUs should be provided in order to allow a controlled change-over to air-firing.
Backup will be in the form of liquid oxygen (LOX) enough of which will be stored on site to allow controlled changeover to air-firing. A PFD for this backup system is shown in PFD 4. An isometric of the oxygen backup system is shown in Figure 12. The LOX will be held at a pressure of 2.5 bara in a 200 tonne capacity vacuum insulated storage tank which can be filled by gravity from the ASU. If backup oxygen is required from storage, detected by a pressure controller on the GOX header, the control valves will open to allow LOX to enter the vaporiser. Because of the short time lag in the system to initiate the GOX backup flow through the vaporiser, a temporary means of providing GOX is required. The GOX pressure is maintained in the system using a GOX buffer vessel kept at 30 bara pressure, which discharges into the GOX header under pressure control.
Air Separation Equipment
Multiple structural steel cold boxes and one column can are supplied as part of the equipment. The column can is a cylindrical enclosure of pre-formed/pre-rolled flanged sections which bolt together at site to complete the structure. Steel jacket panels can be welded or bolted for equipment access to the framework. The cold boxes and column vessel are inclusive of process equipment. The process equipment is supplied and constructed of material suitable for use at low temperature.
The column can encloses the high, intermediate and low pressure columns. The reboiler and condensers are contained in the low pressure column. All heat exchangers in the cold air separation equipment are multi-passage, extended surface aluminium / aluminium alloy, plate-fin heat exchangers.

Report No: E/04/031 Issue No.: 1 Confidential
3rd June 2005 Page 33 of 98 © Mitsui Babcock 2005
The main heat exchanger and subcooler are prefabricated. The main heat exchanger (MHE) box houses the main heat exchanger and the expander units. The subcooler box contains a multi-passage, extended surface plate fin heat exchanger.
The primary insulation material is expanded pearlite. Certain areas are packed with rockwool to allow access for maintenance of valves without pearlite removal.
A dry nitrogen purge system is included on all cold boxes and cans to prevent moist atmospheric air from leaking into the cold box/can during normal operation.
3.1.3.2.4 CO2 Treatment
The net flue gas from the 740 MWe gross ASC PF oxy-combustion coal-fired boiler must be cooled, dried, compressed, and purified to the required level. A summary of the performance of this system is shown below for one boiler unit:
Performance Summary for CO2 Treatment System : 95mol% CO2 Purity
Flue Gas Heater (from 170 to 300°C) (MWt) 5.0
Net Compressor/Expander/Pump Power (MWe) 64.7
Cooling Water (tonne/hr) 1,635
Seawater (tonne/hr) 10,711
Condensate Preheating (MWt) 50.3
Boiler Feedwater Preheating (MWt) 16.0
CO2 Captured: Purity (%v/v) 95.8
Contained CO2 (tonne/hr) 441.9
Recovery (%) 90.4
The CO2 treatment plant consists of:
• A venturi scrubber;V201
• An indirect contact cooler; C204
• A direct contact seawater cooler; C205
• A compression system; K205, K204, K202,K201
• BFW and Condensate preheating exchangers; E206 and E207
• A drier system
• A cold box containing CO2 purification equipment
The process is shown in the PFD 5 and PFD 6.

Report No: E/04/031 Issue No.: 1 Confidential
3rd June 2005 Page 34 of 98 © Mitsui Babcock 2005
The CO2-rich flue gas leaves the heat recovery system of the ASC PF oxy-combustion power plant at approximately 110°C. The first part of the CO2 treatment system, PFD 5, cools the flue gas, thus removing the moisture by condensation, and compresses it to 30 bara.
A venturi mixer V201 is used to quench the gas with water to a temperature where a conventional indirect seawater contact cooler can be used with standard plastic packing. A two column system is used. The first column C204 cools all of the flue gas to 35°C by direct contact with condensate that has been cooled against seawater in titanium plate-frame heat exchangers E205. Around half of this flue gas is then recycled to the boiler system as primary recycle gas, stream 4. The rest, stream 5, is further cooled against seawater to 13°C (stream 14) in a second direct contact cooler C205.
The net flue gas is now around 75% by volume CO2 and at atmospheric pressure and should be compressed to 30 bara for further drying before purification. Compression to 30 bara is carried out in two stages. First K205 compresses the CO2 adiabatically to 15bara. This compressor has 8 axial stages followed by 3 radial stages (see Figure 13 for compressor train layout details from MAN Turbocompressors). The heat of compression is then used to preheat 151 tonne/hr of boiler feedwater in E206 and 330 tonne/hr of condensate in E207. These two heat exchangers are stainless steel diffusion bonded compact heat exchangers. Cooling water is used in E208 to further cool the raw CO2 to 20°C before compression in a single radial stage K204 of the integrally geared CO2 compressor shown in Figure 13 to 30 bara with aftercooling in E209 using cooling water.
The process then moves on to PFD 6 where the raw CO2 is dried and the inerts (N2 and Ar) and oxygen are separated to give >95 mol% CO2. The CO2 is then compressed to 110 bara for pipeline transmission. Any excess O2, SO2 or NOX present in the CO2 need not be removed as the final CO2 product will be used either for enhanced oil recovery (EOR) or stored in aquifers. For specific EOR applications requiring higher purity CO2 >98% the process flowsheet can be modified to achieve this requirement as discussed in Section 3.1.3.5.
The raw CO2 gas passes through a temperature swing dual bed desiccant dryer (C201) to reach a dew point of below -55°C before entering the “cold box”. This desiccant dryer system prevents ice formation which could cause a blockage in the cold box as well as causing corrosion in the pipeline. The cold equipment is contained in a steel jacketed container or “cold box” with pearlite granular insulation.
The inerts removal process uses the principle of phase separation between condensed liquid CO2 and insoluble inerts gas at a temperature of –55°C which is very close to the triple point, or freezing temperature, of CO2. The CO2 partial pressure can be reduced to about 7 bara. The actual CO2 pressure levels used for the separation are fixed by the specification of >95 mol% CO2 product purity and the need to reduce the CO2 vented with the inerts to an economic minimum.

Report No: E/04/031 Issue No.: 1 Confidential
3rd June 2005 Page 35 of 98 © Mitsui Babcock 2005
The system proposed uses two flash separators C202 and C203 at temperatures of 25°C and -55°C. The CO2 feed gas pressure is at 30 bara. The necessary refrigeration for plant operation is obtained by evaporating liquid CO2 at pressure levels of 18.6 bara (stream 20) an 9.3 bara (stream 16) and compressing these two low pressure gas streams in the main CO2 product compressor to the final pipeline delivery pressure of 110 bara. The separated inert gas leaving the cold box at 29 bara (stream 7) can be heated and passed through a power recovery turbine. It is possible to reach a CO2 purity in excess of 96% using this method at inlet CO2 concentrations as low as 77% by volume with a CO2 recovery of better than 90%.
The dry gas is fed to the cold box and is cooled by heat exchange to –25°C with the returning evaporating and superheating CO2 streams and the waste streams in the main exchanger. The main heat exchangers, E201 and E202, are multi-stream plate-fin aluminium blocks. The cooled feed stream 3 is sent to a separator pot C202 at a temperature of –25°C where it is split into liquid and vapour; the liquid product, stream 18, contains part of the required CO2 product at 29.7 bara.
The vapour from the separator, stream 4, still contains a large proportion of CO2. In order to recover this CO2 the vapour is cooled further to –54°C where it partially condenses and is passed to another separator pot C203. The pressure at this point is critical in controlling the process since cooling the vapour below –56.2°C would lead to the formation of solid carbon dioxide. The vapour, stream 6, from the second separator, containing the separated inerts together with some CO2 at a partial pressure of about 7 bara, is sent back through the heat exchangers E202 and E201 where it is heated to 8°C. This stream of inerts, which is at a pressure of 29 bara, is then heated against hot compressed CO2 product (E210) and hot flue gas in the boiler area (E203) and expanded in a power producing turbo-expander (K203) before being vented.
Liquid, stream 18, from the first separator C202 containing part of the CO2 is expanded through a J-T valve to 18.8 bara (stream 19) and heated to 8°C (stream 20). The liquid, stream 12, from the second separator C203 , is heated, expanded through a valve to 9.7 bara and a temperature of about –55°C (stream 13) to provide refrigeration in E202 by evaporation, while the vapour formed is heated to 8°C. The CO2 vapour stream leaving E202 at 9.5 bara is then compressed in a single radial wheel (K202) to 18.7 bara, the same pressure as the CO2 stream from the first separator C202. The two streams are combined and compressed to the required pressure of 110 bara. This machine (K201) is a four stage integrally geared unit (Figure 13) which could be operated from the 18.7 bara to 110 bara level as either an intercooled compressor or as an adiabatic compressor with an aftercooler used to heat flue gas before expansion and condensate for the boiler system. In the latter case no cooling water would be required for this section of the compressor.
This project has selected K201 to be run adiabatically, with condensate being preheated in the aftercooler along with some of the flue gas heating duty. This has the benefit of simplifying the final stages of K201 since it avoids supercritical dense fluid CO2 forming in K201. The likelihood of dense fluid CO2 forming in K201 has

Report No: E/04/031 Issue No.: 1 Confidential
3rd June 2005 Page 36 of 98 © Mitsui Babcock 2005
meant that the four stage isothermal option only had one intercooler, to prevent the dense phase forming within the machine. Therefore the power penalty in removing this intercooler to give an adiabatic compressor is small but gives the benefit of a simpler machine, reduced cooling water requirement and saves low pressure steam that would have otherwise been used to preheat the condensate.
The plant is furnished complete with all structural, mechanical equipment, piping, supports, anchor bolts, electrical equipment, instrumentation, controls and accessories as required for continuous automatic operation. The controls are designed to interface with the existing systems. The intent would be to operate the plant from a remote central control room with periodic inspection.
The material of construction of the low pressure inlet gas piping, the venturi cooler, direct contact coolers and the parts of the compressor upstream of the drier must be resistant to wet gas corrosion taking account of the possible gas composition. Suitable materials are selected for piping and compressor parts in contact with the flue gas.
3.1.3.3 ASC PF Oxy-Combustion Power Plant With CO2 Capture: Performance
ASC PF oxy-combustion power plant with CO2 capture generates 737 MWe gross (532 MWe net) power output at a net cycle efficiency of 35.4% (LHV).
The penalty therefore in terms of net cycle efficiency associated with the oxy-combustion with CO2 capture process is calculated at 8.9 % points when compared to the efficiency of reference power plant without CO2 capture of 44.2% LHV.
The auxiliary power consumption for the ASC PF oxy-combustion power plant with CO2 capture is shown in Table 3. The draught plant power consumption has reduced as a direct consequence of the lower mass of flue gas being circulated compared to the air firing case. The power consumption of the ASU and CO2 compression & inerts removal units are as anticipated by Air Products.
The effect of removing the nitrogen when operating an oxy-combustion boiler is to increase the partial pressure of the CO2 and H2O which in turn raises the emissivity of the flue gas and improves the radiative heat transfer within the furnace. For the same fuel firing rate, an oxy-combustion boiler with a smaller sized furnace can therefore achieve similar steam conditions as its air-firing counterpart. The reduction in cost associated with the smaller furnace, however, has not been considered within this study as detail design of the furnace (i.e. furnace heat surface sizing) has not been undertaken. This cost saving is somewhat minor compared to cost of the overall oxy-combustion power plant and considering the target budget capital cost estimate of ± 30% stated as the basis of this study.
3.1.3.4 Emissions
In comparison with the air-fired PF plant base case, NOx and SOx emissions for the CO2 capture plant are proposed to be uncontrolled (i.e. no SCR and no FGD plant).

Report No: E/04/031 Issue No.: 1 Confidential
3rd June 2005 Page 37 of 98 © Mitsui Babcock 2005
Experimental testwork[29] has shown oxy-combustion will inherently result in a reduction in NOx emissions to levels comparable with SCR technology (i.e. 200 mg/Nm3 @ 6% O2).
All soluble acid gas components in the primary recycle and net CO2 product gas streams are removed by direct contact water scrubbing in C204 and C205. There is no tendency for any condensation of acid components or water in the coal mills. No FGD is required for an oxy-combustion PF coal fired boiler. SO2 and NOx are presently included in the CO2 product stream and have no diverse effect on hardware as long as sufficient dehydration is present to avoid acid corrosion. If the CO2 specification calls for very low levels of SO2 and NOx then a distillation unit can be included in the CO2 purification system which will remove all SO2 plus NO2 as a concentrated liquid at 30 bara pressure. This will result in a small cost increase.
NOx Emissions
The level of NOx present in the flue gas exiting the boiler (115 mg/MJ) in the oxy combustion PF case is approximately 50% of the NOx emissions expected for similar sized air fired PF Plant. (650 mg/Nm3 @ 6% O2 or 227mg/MJ). This assumption is based on published literature[29] from previous combustion tests of oxy-combustion with FGR.
Figure 14 shows the NOx levels in each of the major streams (note: these emissions presented are at actual oxygen levels). The primary and the secondary recycles return 32 mg/MJ and 49 mg/MJ respectively back to the furnace. Approximately 26 mg/MJ is removed via the CO2 compression and inerts removal process leaving 6 mg/MJ contained in the high pressure CO2 product stream for storage. Note the only emission of NOx to atmosphere is therefore 26 mg/MJ resulting from the vented inert gases. There is an option to remove all NOx in the low temperature CO2 purification plant by distillation. This would result in a NO2 component stream which would require further disposal. The associated disposal costs have not been considered under this study.
SOX Emissions
Figure 14 shows the SOx levels in each of the major streams (note: these emissions presented are at actual oxygen levels). The level of SOx present in the flue gas exiting the boiler in the oxy-combustion case is calculated at 2046 mg/MJ. The primary and the secondary recycles, return 559 mg/MJ and 872 mg/MJ respectively back to the furnace. Some 80 mg/MJ is believed to be removed in the condensate as a result of the contact cooling process prior to CO2 compression, leaving 534 mg/MJ remaining in the high pressure CO2 product stream for storage. There is an option to remove all SO2 in the low temperature CO2 purification plant by distillation. This would result in a SO2 component stream which would require further disposal. The associated disposal costs have not been considered under this study.

Report No: E/04/031 Issue No.: 1 Confidential
3rd June 2005 Page 38 of 98 © Mitsui Babcock 2005
Particulates
Figure 14 shows the particulate levels in each of the major streams (note: these emissions presented are at actual oxygen levels). The level of particulates present in the flue gas exiting the boiler in the oxy combustion case is calculated at 11 mg/MJ. The secondary recycle returns 5 mg/MJ to the furnace with the remaining particulates (5mg/MJ) removed upstream of the recirculation pump from the direct contact cooler C204.
Mercury Removal
If mercury is present in the coal it will appear as a contaminant in the feed to the CO2 compression and purification system. Mercury is a potential source of corrosion in the aluminium heat exchangers used in the CO2 purification plants. It can be removed from the 30 bar compressed cycle CO2 stream by adsorption and charcoal impregnated with sulphur. This technology was developed to remove mercury from natural gas streams prior to liquefaction in aluminium heat exchangers.
The Effect on Impurity Concentrations in the Flue Gas from Varying Recycle Flow
The concentration of SO2, SO3 and HCl in the net flue gas product and recycle flue gas streams depends only on the sulphur content and the chlorine content of the coal feed respectively and is independent of the recycle rate back to the boiler which is adjusted to control the combustion temperature.
3.1.3.5 Clean Up Technologies for CO2 Purity
The base case of this study produces CO2 at > 95 mol% using a simple process that gives the required purity at high (> 90%) recovery. This process is easily modified to give higher purities.
As it stands the basic process cycle produces a CO2 purity of 96.5 mol%. To produce 98 mol% purity CO2 a modification is required to the process. This is achieved by the addition of a third separation vessel to remove the non-condensed portion of stream 14 in PFD 6, shown in bold in PFD 7. To prevent a loss of CO2 from the process, since there will be non-condensed CO2 in this stream, this stream is compressed from around 10 bara to 30 bara, in a two-stage intercooled compressor and recycled by adding to the cold box feed after the dryers.
Pure (>99.99mol%) CO2 is also possible using distillation in place of separation in this flowsheet to remove a stream of higher boiling components comprising all of the nitrogen oxides as NO2, and SO2 plus some CO2 as a liquid stream from the bottom of a distillation column which replaces C202. A second column in place of C203 at the cold end removes traces of inert gases including O2.

Report No: E/04/031 Issue No.: 1 Confidential
3rd June 2005 Page 39 of 98 © Mitsui Babcock 2005
3.1.3.6 Performance and Cost Sensitivity to CO2 Purity
The performance of the CO2 treatment plant with 98 mol% purity CO2 is shown below. Compared to the 95 mol% purity case 0.5 MWe less power is required but the flue gas heater is larger by 1.9MW to accommodate the extra flow of vented inerts. A small amount of extra cooling water is also required. There is a reduction in CO2 capture efficiency of the process, down from 90.4% to 88.4%, resulting in 2.3% less CO2 being captured.
Capital costs will be slightly increased due to the recycle compressor, extra separation vessel and the extra passages through the exchangers, but this will be minimal. The main penalties for the increased CO2 purity are a reduction in CO2 captured from the process and an increase in the amounts of NO2 and SO2 vented.
Performance Summary for the CO2 Treatment System for 98 mol% CO2Purity
Flue Gas Heater (from 170 to 300°C) (MWt) 6.9
Net Compressor/Expander/Pump Power (MWe) 64.2
Cooling Water (tonne/hr) 1,770
Seawater (tonne/hr) 10,771
Condensate Preheating (MWt) 50.2
Boiler Feedwater Preheating (MWt) 16.0
CO2 Captured Purity (% v/v) 98.3
Contained CO2 (tonne/hr) 431.9
Recovery (%) 88.4
Although not presented the cost and performance penalties of pure CO2 will be higher than those for 98 mol% purity CO2.
3.1.3.7 Overview of Integration Activities
Oxy-combustion PF power plants offer potential opportunities for efficiency improvements through integration of the additional oxy-combustion process units with the steam cycle:
Option A: Heat recovery from additional flue gas cooling
Option B: Heat recovery from adiabatic compression in the ASU and CO2 treatment plants
Option C: Direct mechanical drives (i.e. small steam turbines) for compressors
In this study options A and B have been implemented.

Report No: E/04/031 Issue No.: 1 Confidential
3rd June 2005 Page 40 of 98 © Mitsui Babcock 2005
Option C was considered but rejected. The isentropic efficiency of the large main sream turbine for power generation was much higher than could be achieved in smaller turbines (5-10 percentage points) and the latter would also have greatly complicated the steam cycle and start-up procedures. Consequently all compressor drives are electric.
The relevant areas of the power plant where heat integration takes place are listed in the table below:
Heat Recovery From Additional Flue Gas Cooling
Heat recovered from cooling flue gases after the ESP can be used for condensate/feed water heating and avoids the need to extract steam from the turbine for this purpose. With the acid dew point approximately 160 °C and the flue gas temperature exiting heat exchangers approximately 110°C, acid condensation will occur in these coolers and appropriate construction materials must be used. Proven designs are available for similar duties in modern conventional PF plants to cool flue gases before the FGD unit.
It is obviously advantageous to use the heat recovered at as high a temperature as possible so multiple (two in this study) stages of water heating are likely to be used. In practice, economics will determine the degree of heat recovery from the net product flue gas.
Heat Recovery From Compressors
Adiabatic compression has been used in the oxy-combustion process flowsheet place of isothermal compression in several places. The heat of compression is then used to preheat either condensate or boiler feedwater (see Section 3.1.3.2.2)
Summary of Heat Integration Sources
Heat Source Amount (MWt) Heat Transferred To
ASU Adiabatic Compressors 55 Condensate
CO2 Adiabatic Compression (Early & later stages)
50 Condensate
CO2 Adiabatic Compression (Early stages)
16 BFW
Flue Gas 28 BFW
Flue Gas 18 Condensate
Flue Gas 5 Vented Inert Gases
Report No: E/04/031 Issue No.: 1 Confidential
3rd June 2005 Page 41 of 98 © Mitsui Babcock 2005
depending upon the temperature of the compressed gas. This eliminates the requirement for intercoolers and aftercoolers and reduces the overall cooling water requirement. The extra power that is required for the compressors is more than compensated by the saving in bleed steam that would have been used to preheat the same condensate and boiler feedwater for the boiler system, thus allowing this steam to produce more power in the steam turbines. The design of the compressors is also simplified by using adiabatic compression since no intercoolers are required, removing equipment, pressure drop and complex piping and resulting in less plot area and lower construction costs.
In this work, the main compressors for the two ASUs are adiabatic, as is the first (K205) section of CO2 compression, to 15 bara, and the final stages of CO2 compression (K201) to 110 bara.
In order to produce power from the high pressure inert stream and to maintain an outlet temperature in which the vent gases are buoyant, the inerts, at around 30 bara, from the CO2 purification system are heated to around 300°C before being expanded to atmospheric pressure. Part of this heat is provided by cooling part of the hot CO2 at 110 bara, leaving the adiabatic compressor K201. The remaining heat, from 170°C to 300°C, could be provided by heat interchange of a suitable high temperature stream within the boiler system.
3.1.3.8 Materials and Corrosion Issues
In this section a short description of the principal technical concerns associated with the selection of the materials of construction of key plant components is presented. This description is restricted to the identification of the key technical issues, and no attempt is made to provide appropriate detailed design and materials solutions.
The Coal Milling and Firing System
It is proposed that the medium for milling the coal and conveying the pulverised coal to the burners will be recycled flue gases, from the primary recycle system. This stream has a significant SO2 concentration, and is saturated with water at 35ºC, but very low SO3 and HCl concentrations, since the HCl and SO3 have been removed to high efficiency in the gas cooler and water removal system in the primary recycle.
The Furnace and Boiler Convective Section
The principal concern here is the increased acid gas (SO2, SO3 and HCl) concentrations in the combustion gases, and the potential impacts on the metal wastage rates due to gas-side corrosion of the boiler tubes, particularly in the furnace and the superheater/reheater sections of the boiler. The calculated gas composition data indicate that could be as much as a five-fold increase in these concentrations over the normal levels associated with conventional pulverised coal combustion systems.
Report No: E/04/031 Issue No.: 1 Confidential
3rd June 2005 Page 42 of 98 © Mitsui Babcock 2005
In the furnace, the principal concern is associated with the increased risks of accelerated metal wastage of sidewall tubes, associated with advanced primary NOx control techniques, and exacerbated by the increased concentrations of HCl and the sulphur oxides in the furnace gases.
The main concerns in the superheater/reheater section are associated with the risks of increased gas-side corrosion rates due to the increased acid gas concentrations.
These issues will have to be examined carefully in that long-term plant operating experience and measured corrosion rate data for very high acid gas concentrations in boiler flue gases are relatively rare. Careful consideration of the metal surface temperatures and the materials will be required.
The Gas-Gas Heater
The gas-gas heater is located upstream of the electrostatic precipitators and operates under the following conditions:
Flue gas inlet and outlet temperatures 340-264ºC
Primary recycle inlet temperature 35ºC
Secondary recycle inlet temperature 264ºC
It is inevitable, therefore, that the gas-gas heater at the primary recycle inlet will be operating at temperatures below the acid dew point, and perhaps the water dew point, on the flue gas side, and that the condensation of acidic aqueous species on the heat exchanger surfaces will occur. For this reason, the gas-gas heat exchanger will need very careful design, particularly with regard to the materials of construction, and to avoid excessive coal ash fouling at the flue gas entry.
The ID fan, Gas Recycle Fans and Ductwork
The ID fan, the secondary recycle fan and the associated ductwork and windboxes are located downstream of the gas-gas heater and the electrostatic precipitators. These gases have relatively high SO2/SO3 and HCl concentrations, but are operating at temperatures around 264ºC and, as such, there are no dew point issues or high temperature corrosion issues.
The primary recycle fan and associated ductwork will operate with flue gas from the gas cooler and water removal system. This gas stream is at 35ºC, has a significant SO2 concentration, and is saturated with water. The HCl and SO3 have been removed to high efficiency. The gases are at or close to the water dew point, however, and the design and materials selection in this section will need careful consideration.

Report No: E/04/031 Issue No.: 1 Confidential
3rd June 2005 Page 43 of 98 © Mitsui Babcock 2005
Feed Water Pre-Heaters and the Gas Cooler and Water Removal System
The primary gas recycle system has a series of feed water heaters designed to reduce the gas temperatures from 264 to 110ºC prior to entry to the gas cooler and water removal system. The feedwater heaters will be operating at temperatures below the sulphuric acid dew point temperature for the recycled gas, and will require very careful design and materials selection.
The gas cooler and water removal vessel and associated systems will reduce the gas temperatures from 100 to 35ºC, with the condensation of water and removal of both SO3 and HCl from the gases. The liquors contained in the vessel and the water recycle system will be highly acidic and extremely corrosive, and the system will require very careful design and materials selection.
Under normal operating conditions, the mill outlet temperature will be significantly in excess of the water dew point, and no water condensation on the mill internal surfaces or the pulverised coal pipework is anticipated. It may be necessary to purge the mills and pulverised coal pipework with fresh air if the mill is to be shut down for a prolonged period of time, otherwise the primary recycle stream appears to be a suitable coal milling and firing medium. There are no specific materials issues.
Low-Temperature Corrosion
Low temperature corrosion occurs when temperature conditions favour the condensation of sulphuric acid. The sulphur present in pulverised coal will oxidise to SO2 and SO3, and combining with the water vapour, will form sulphurous and sulphuric acids. The temperature of the condensation (the acid dew point) is important as surfaces below this temperature will condense acid: the lower the temperature of the surface the greater the corrosion.
If such a condition arises it is necessary to protect the exposed surfaces using materials that offer exceptional resistance to sulphuric acid corrosion, for example high silicon cast-iron inserts, polypropylene and glass reinforced plastics.
Under oxygen-combustion conditions, the dew point increases to approximately 160°C and thus corrosion in both the later stage of heat exchangers and the cooler parts that follow, such as ducting and draught plant, become a distinct possibility. In addition, with oxy-combustion the problem is aggravated by the fact that recycle streams themselves require to be heated whilst containing some oxidised sulphur compounds.
For the ASC PF oxy-combustion boiler case with CO2 capture, the temperature in the early stages of the economiser is not a concern as the high inlet temperature (~300°C) of the feedwater at this stage is well above the acid dew point of the flue gas. Likewise, secondary recycle, whilst containing SOx, only reduces to temperatures of approximately 260°C on its course back to the furnace, therefore the acid dew point is not an issue. The ESP is also operated at temperatures (260°C) above the acid dew point.

Report No: E/04/031 Issue No.: 1 Confidential
3rd June 2005 Page 44 of 98 © Mitsui Babcock 2005
However, the heat exchangers positioned in the flue gas stream, which are utilised for boiler feed water heating and condensate preheating, feature inlet water-side temperatures below the acid dew point and would therefore require to be protected against corrosion. The associated ductwork in this area would also be required to be lined to prevent acid corrosion damage.
Following these exchangers the flue gas is passed through the venturi water contactor and the two direct contact coolers which condense the water content of the flue gas. The water saturated stream leaving the first direct contact cooler at 35°C is split with one stream forming the primary recycle and the other the feed to the second direct contact cooler which further cools the net flue gas to 13°C before entering the CO2 compression and inerts removal stage. The primary recycle stream contains no soluble acid components as a result of the direct water cooling removing any SO3 and HCl present.
CO2 Compressor Materials
Compressor material selection for the wet CO2 compression needs careful consideration due to the possibility of wet SO2 being present. Previous studies have suggested doubling the nickel content in 316 stainless steel to 904 austenitic stainless steel to combat this problem. An appropriate material specification would be:
Alloy 20Cb-3 (UNS No: NO8020) – 20Cr2.2Mo34Ni3.5Cu austenitic stainless steel for impact areas or cold areas such as volutes, impeller, intercoolers and internals Alloy 2205 – 22Cr5Ni3Mo duplex stainless steel for shafting.
Fouling and Deposition
The recycled flue gas from oxy-combustion of pulverised coal will contain particulate material (predominantly ash with a small amount of unburnt carbon). Removal of this dust burden upstream of the FGR fans will be necessary to avoid premature wear/erosion of the impellers.
However, complete removal of the particulate burden is unlikely, therefore there is risk of increased dust/ash deposition within the boiler flue gas passes, particularly within the convective pass.
Rig scale tests[2] indicated that sootblowing frequency may have to be increased in order to prevent detrimental deposition.
In addition these tests have indicated that deposition rates during flue gas recycle are greater than conventional air firing, however, quantitative comparison was not possible. High flue gas recycle rates were not observed to exacerbate deposition when compared to low recycle rates. Further investigation is recognised as being required in this area.

Report No: E/04/031 Issue No.: 1 Confidential
3rd June 2005 Page 45 of 98 © Mitsui Babcock 2005
3.2 Safety and Operability
It is of paramount importance that oxy-combustion technology can be implemented safely and without significant impact upon operational flexibility.
The following sections highlight the key safety and operability concerns relating to oxy-combustion, with specific regard to pulverised coal utility plant.
3.2.1 Control Strategy
For the process flow sheets developed under this work the boiler will be started on air with the FD fan drawing air into the process and a PA fan stripping a portion of this air for delivery to the mills. An ID fan positioned after the ESP will draw the combustion products through the boiler to the stack as shown in Figure 9.
Power produced by the steam turbine-generator whilst operating on air can be used to start the ASU. The boiler will then be converted to oxy-combustion firing by progressively increasing the oxygen flow to the burners and reducing the air flow while simultaneously introducing the hot flue gas recycle and increasing the recycle rate to maintain acceptable combustion temperatures. During this period, the net flue gas production will be vented through the main stack. It, however, will be necessary to cool a part of the flue gas and separate the water vapour and this can be accomplished by commissioning the water venturi quench and the direct contact cooling tower. Once the boiler is operating with no air feed, and the monitored flue gas CO2/N2 levels at the ID fan exit are within acceptable limits, then the full net flue gas flow can be directed to the cooling system and the CO2 compressors and low temperature CO2 purifier plant can be started.
Returning the plant to air-firing requires a reversal of the above procedure, i.e. divert the majority of the flue gas to the flue stack whilst maintaining a primary recycle to the coal mills via the direct contact cooler. The compression plant will then be taken off line. The oxygen supply to the furnace will then be reduced whilst reintroducing air rather than the recycled flue gas, through the FD fan. Finally, the switch to an air supply for the mills will be made with the primary recycle reduced accordingly.
It is initially envisaged that the boiler will operate on low loads only up to the point of minimum stable combustion and no higher whilst firing on air. Therefore in this study, for a new build oxy-combustion plant, air firing mode is perceived as a means to achieving oxy-combustion. The plant is not intended to operate for any persistent length of time on air firing other than that necessary to permit changeover to and from oxy-combustion mode of operation.
Note: for the short period of time envisaged in which the air-firing is utilised, no means of NOx and SOx emission abatement are present, i.e. SCR and FGD plants exclusively for the start-up and shut down scenarios are not costed within this study. At the point of power generation, the plant will operate in oxy-combustion mode in order to provide compliance with emission limits.

Report No: E/04/031 Issue No.: 1 Confidential
3rd June 2005 Page 46 of 98 © Mitsui Babcock 2005
3.2.1.1 Economiser Exit Flue Gas Oxygen
For air-firing plant, the control of combustion air is based on a function of the measured fuel flow, the measured air flow at the FD fan and the measured economiser exit flue gas oxygen content.
For oxy-combustion firing, a new control loop would be required to control the oxygen flow, the fuel flow and the recycle flue gas flow to the burners. This control loop would measure the oxygen concentration downstream of the oxygen injection point and drive the oxygen injection flow demand for that stream, as a function of this, the FGR flow and the economiser exit flue gas oxygen. This loop may also require additional feed forward terms relating to load depending on the response time of the ASU plant.
Given the oxygen concentration is maintained in the combined O2 and CO2 recycle stream at the windbox by the above control loop during oxygen/flue gas recycle firing, then the economiser exit flue gas oxygen control loop can now be a similar function to that used for air-firing, but driving the FGR flow demands instead of the air flow demands.
3.2.1.2 Furnace Draught Pressure
The furnace draught pressure can remain as a control function of the ID fan speed.
3.2.1.3 ID Fan Exit Process Control
The ID fan exit ducts will require control dampers to divert the flue gas flow from the flue stack inlet to the flue gas cooler and CO2 compression plant. In addition flue gas monitoring equipment will indicate to the boiler operator when it is safe to start supplying the CO2 plant with boiler exit flue gases.
If the CO2 compressor flow demand creates a negative pressure local to the control dampers at the flue stack, then this will tend to induce a back flow of leakage ambient air from the flue stack to the compressor inlet which will contaminate the flue gas flow with N2 and O2. The ID fan exit pressure should therefore be maintained at slight positive gauge pressure during oxy-combustion firing. Depending on the rundown time of the compressor when tripped, the stack inlet / compressor inlet diverting dampers may need to act quickly.
Whilst guillotine dampers are the power industry norm for gas tight applications, the use of a water sealing mechanism for the dampers may be required to provide the level of sealing necessary to minimise any losses to stack or further in-leakage to the compression system.
3.2.1.4 Alarms
The following additional alarms are envisaged for the ASC PF oxy-combustion power plant when operating in oxygen-combustion mode:

Report No: E/04/031 Issue No.: 1 Confidential
3rd June 2005 Page 47 of 98 © Mitsui Babcock 2005
• ASU O2 Outlet Temperature Low - To detect a failure of the O2 heating supply from the ASU.
• Combined O2 and CO2 recycle stream Temperature High - To detect the possibility of combustion taking place before the burner, between some of the added O2 and any unburned combustibles in the FGR flow.
• Superheater Metal Temperature High - To detect high metal temperatures due to burner/flame parameters changing due to oxygen/flue gas recycle combustion.
• ID Fan Exit Pressure Low - To detect if the duct pressure becomes negative enough for there to be a danger of inducing a reverse flow in the flue stack and drawing air into the CO2 compression stream through the damper.
3.2.1.5 Trips
Trips envisaged for oxy-combustion firing would include but not be limited to the following:
Fan Trips For oxy-combustion firing a ‘Windbox Gas Flow Low’ trip is required to replace the ‘FD Fan Tripped’ on the air-firing case. This allows the draft plant BMS trips to remain active during the changeover from air firing to oxy-combustion firing.
ASU Trip Assuming there is sufficient O2 storage to maintain the plant while air-firing is brought on line, then changeover to the air-firing would keep the boiler on line. This would decrease the sensitivity of the plant in the unlikely event of an ASU trip (ASU availability will be 98-99% and this includes planned shutdowns which could be scheduled with planned boiler shutdowns and to the effect of the ASU on the overall availability will be very low). If the ASU tripped a trip signal would be sent to the boiler controller to initiate changeover to air-firing.
Boiler Trip Any ‘Boiler Trip’ would require the ASU feed to be tripped and the ID exit flue gases to be directed to the flue stack.
Compressor Trip When oxy-combustion firing, a ‘Compressor Trip’ will require that the ID fan exit flue gases be diverted to the flue stack. If this can be done within the rundown time of the compressor, the boiler need not be tripped. If this is not the case, then the back pressure through the flue gas pass will lift the furnace pressure and trip the boiler. If it is deemed unlikely that the diversion to the stack can take place quickly enough to avoid a boiler trip, then the plant should be tripped directly from a ‘Compressor Trip’.

Report No: E/04/031 Issue No.: 1 Confidential
3rd June 2005 Page 48 of 98 © Mitsui Babcock 2005
3.2.1.6 Purging
The presence of FGR flow loops necessitates that these flue gas passes are adequately purged prior to the introduction of fuel to the furnace.
Flow will be required to be generated through the FGR ducts as part of the flue gas pass purge. Some extension of furnace purge time is required to take account of the re-introduction of furnace exit purge flue gases being re-introduced to the furnace by the FGR fans. In addition, since it is possible for combustibles to enter the compressor flue gas pass (under ‘Boiler Trip’ conditions, or economiser exit flue gas oxygen control loop failure), then this flue gas pass will require to be purged in addition to the flue stack duct, prior to trial for ignition.
In this context the oxygen system will require to be proven to be isolated from the boiler for purging purposes.
3.2.2 ASU Safety Issues
Safety is a major factor in the design and operating strategy of ASUs[30A]:
• Rapid oxidation (which falls into two categories: Accumulating fuel in O2 enriched streams, and O2 enriched streams reacting with normally non-combustible materials).
• Interfaces between the ASU and downstream equipment, with the risk for sending high pressures and cold temperatures that are incompatible with the downstream equipment.
• Building high pressures due to vaporising cryogenic liquids.
• Oxygen enriched and deficient atmospheres.
There is a strong commitment to safety from the ASU equipment manufacturers based on nearly 100 years of operating experience as the air separation industry has developed. Safety standards are the responsibility of the industry as a whole[30B] and are a result of the cooperation between companies on a continuing basis. Notable areas of activity in recent years have included:
• Standards for materials compatibility with oxygen, covering flammability and material properties
• Design standards for oxygen compressor systems, both centrifugal and reciprocating
• Considerations for the design of reboiler/condenser systems
These specific safety considerations are backed by procedures used in the design, construction, operation and maintenance of air separation equipment.

Report No: E/04/031 Issue No.: 1 Confidential
3rd June 2005 Page 49 of 98 © Mitsui Babcock 2005
The following specific items form an integral part of the design of the plant to ensure safe operation:
• The design allows for the elimination of potential hydrocarbon build-up due to the location of the fuel burning power generation facility.
• The oxygen plant is designed for fail-safe emergency shutdown as a result of internal or external upset. All process control power supplies are connected to an uninterruptible power supply, that will provide a power back-up for 30 minutes.
• The design of oxygen injection system into the fuel burners which would include direct oxygen injection into the burner and mixing of oxygen with recirculating hot flue gas.
• The location of vents and drains to avoid discharge of oxygen deficient or oxygen rich gas or liquid streams that might be hazardous to the surroundings.
The plant and equipment is designed in accordance with recognised national/international codes and standards appropriate to its location and its point of manufacture.
3.2.3 ASU Plant Process Control
3.2.3.1 Control System Design Philosophy
The control system is designed to meet the following overall objectives:
• To provide a safe system.
• To meet the plant reliability and availability targets.
• To enable the plant to run routinely within the particular operation constraints.
3.2.3.2 Control Strategy
The following control strategy outlines the control loops in place on a typical companded LOX boil ASU such as the one considered for this study. There will be an overall supervisory control program which will allow the ASU and CO2 compression and purification systems to be adjusted automatically in response to planned load changes on the power boiler system in response to changing electrical demand from the grid. This control program will also allow for a controlled rate change of oxygen from the ASU by ramping the plant up or down at a rate between 2-3% of full flow per minute.

Report No: E/04/031 Issue No.: 1 Confidential
3rd June 2005 Page 50 of 98 © Mitsui Babcock 2005
3.2.3.3 ASU Air Supply
Main Air Compressor
Air to the cold box supplied by the Main Air Compressor (MAC) is flow controlled by varying the guide vanes on the compressor. As the guide vanes are opened up, the flow rate through the compressor will increase which will ultimately increase the product flow of O2 with a delay subject to the time constant of the system. There will be an associated increase in the discharge pressure of the MAC and this is monitored by a separate pressure control loop which will vent the MAC product air should the calculated approach to the compressor surge line become unacceptably close.
Air Purification System
The air to the main exchanger is passed through the adsorber beds where water, carbon dioxide, acetylene and heavy hydrocarbons and some N2O are adsorbed.
The beds operate on a Thermal Swing Adsorption process (TSA), with bed regeneration obtained by heating the adsorbent at low pressure. Regeneration heat is provided by heating part of the low pressure waste N2 stream leaving the Main Heat Exchanger (E101) as shown in PFD 3 in a steam reactivation heater and passing it through the bed in the reverse direction. This is followed by a cooling period when the heater is by-passed. The on-stream time for each bed is typically 3 to 6 hours, and while one vessel is on-line the other undergoes regeneration. The changeover of the on-line bed and subsequent regeneration is controlled entirely by a pre-programmed sequence in the DCS.
During the sequence when no re-generation gas is required, all waste gas is vented under pressure control. When the sequence moves from the depressurisation step onto the heating step the required valves are ramped slowly under automatic control minimising disturbance to the plant. Feed forward control is used when switching from the cooling step to the re-pressurisation step to further minimise disturbance to the ASU when the TSA inlet valve closes.
The temperature of the regeneration gas is controlled by regulating the regen gas flow through the reactivation heater. The steam supply through the heater has no temperature control and can vary, therefore there is a bypass of the reactivation gas around the heater to help to control the heating of the reactivation gas. The temperature controller acts to limit the reactivation feed flow through the heater by increasing the bypass flow to control the outlet temperature.
Automated front-end regeneration is provided for plant start-up, returning air from the on-line bed as regeneration gas through the reactivation heater. A coldbox trip also sets the TSA to front-end regeneration, allowing the compressor and TSA to continue running. There is a CO2 analyser to sample the CO2 content of the air to the coldbox leaving the TSA. The analyser is switched to sample the reboiler sump at regular intervals, generally coinciding with molecular sieve bed changeover.

Report No: E/04/031 Issue No.: 1 Confidential
3rd June 2005 Page 51 of 98 © Mitsui Babcock 2005
Main Heat Exchanger
The air leaving the TSA adsorbers is passed through the main heat exchanger (E101) as shown in PFD 3, where it is cooled by counter current heat transfer with the returning waste N2 and product GOX flows. The total air flow is controlled by the MAC guide vanes, with the split between expander and HP column flow controlled by the expander inlet guide vanes. The boosted air flow is determined by a temperature controller at the cold end of the main heat exchanger which regulates the flow of liquid air to the HP column via the JT valve.
ASU Compander
The energy produced by the expander part of the compander is used to drive the air booster compressor part. The Medium Pressure (MP) air flow through the expander is controlled by the expander inlet guide vanes and the booster discharge pressure varies as the booster and expander flows are adjusted.
3.2.3.4 ASU Column System
The general principle for maintaining the correct mass balance for the column section is detailed in the following sections. Air flow into the plant and product flows out are all flow controlled hence any gas not taken as product leaves the plant as waste.
Distillation Columns
The amount of nitrogen reflux flow from the condensers to the high and intermediate pressure columns is modulated using remotely operated control valves to maintain the correct column operating composition profile in both columns. Liquid air is withdrawn from the middle of the HP column and fed to the LP column via the subcooler under flow control.
Level controllers maintain the sump levels in the high and intermediate pressure columns by controlling the transfer of liquid to the LP column. These streams enter the LP column as crude LOX.
The LP column is split into three sections. In the top section, a waste nitrogen stream is taken off under pressure control at the warm end of the MHE. Liquid air from the high pressure column enters at the top of the second section and the Crude LOX (from the high and intermediate pressure column sumps) and LP air (from the expander) are fed to the column at the top of the third section. The LOX product collects in the column sump and is fed to the main heat exchanger where it is boiled and warmed to form the GOX product against cooling and condensing liquid air.
GOX Product
LOX from the LP column sump is vaporised and warmed in the main heat exchanger as described above. The GOX product is delivered to the plant on both pressure control and flow control. The pressure control acts by controlling the amount of LOX

Report No: E/04/031 Issue No.: 1 Confidential
3rd June 2005 Page 52 of 98 © Mitsui Babcock 2005
taken off the LP column sump and the flow rate is controlled by adjustment of the air flow from the MAC. A vent valve is provided to discharge excess oxygen if downstream problems arise.
The oxygen flowrate required by the oxy-combustion system determines the total demand on the two ASUs. At any total flow below the maximum, the two ASUs will automatically adjust their flows to produce the required total oxygen flow. As the total oxygen flow approaches maximum, the computer system will be programmed to indicate to the operators the oxygen flow and enable adjustments in demand to be made.
LOX Storage Control
Should an ASU trip a 30 minute supply of back-up oxygen at full flowrate can be provided to allow the ASC boiler to be changed from oxy-combustion to air-firing with no disturbance to steam generation or electrical power output or to allow the ASC boiler to be reduced in load to match the available oxygen form the remaining ASU. Backup LOX flows from the storage tank through a steam vaporiser into the back-up oxygen pipeline. To minimise any pressure disturbance an ASU trip signal initiates the back-up system response activating the LOX flow to the vaporiser.
Note: despite the high reliability of the ASU, in the event of one unit being out of service it is envisaged that the ASC boiler would be able to operate at 50% MCR load on a single ASU.
A pressure controller on backup GOX header opens the control valve on the discharge of the vaporiser. Because of the time lag in the system to initiate the GOX back-up flow through the vaporiser, a temporary means of providing GOX is required. The GOX pressure is maintained by a GOX buffer vessel at 30 bara pressure, which discharges into the GOX header under pressure control (PIC). Once the backup supply from storage is at full capacity the buffer vessel supply route is backed out, and the vessels are recharged by a small compressor, set to start on a low pressure switch and stop on a high pressure switch.
Liquid oxygen is stored in a vacuum insulated cryogenic vessel under a pressure of 2.5 bara. Two pressure controllers control the storage tank pressure. One acts on the tank vent valve to reduce the storage pressure. The other allows liquid to pass through a vaporiser and return to the tank as pressurising vapour. The set point of the vent valve controller is set to a higher value to avoid controller run-away.
3.2.4 CO2 Recovery Plant Process Control
The CO2 recovery plants would typically be designed to interface with the boiler control system, allowing ease of use and high reliability.
The design of the instrumentation and Distributed Control System (DCS) enables safe operation of the CO2 recovery plant and provides the necessary control while handling disturbances and certain levels of process or instrumentation degradation.

Report No: E/04/031 Issue No.: 1 Confidential
3rd June 2005 Page 53 of 98 © Mitsui Babcock 2005
The instrumentation and distributed control system is made to be sufficiently reliable and robust so as to require no operator involvement during normal plant operation.
The cooling water flow demand to the venturi mixers and Direct Contact Coolers (DCC) will be controlled under flow control. The level in the DCC sumps is controlled by the liquid flow leaving the vessel.
The drier operation is controlled by the DCS. Valve switching and sequencing will be automated for the entire adsorber cycle, including the on-stream and regeneration steps. The amount of moisture in the gas stream leaving the drier is monitored to ensure the performance of the system.
Dry crude CO2 at 30 bara enters the plate fin heat exchanger where it is cooled to –55°C in two stages. The cooling is accomplished by evaporating two CO2 streams taken from the intermediate separator at 18.4 bara and from the cold separator at 10.5 bara. These pressures are controlled using inlet guide vanes for flow control of the CO2 product compressor at the appropriate points.
Level control is used to remove condensed liquid CO2 in the two separators. The critical cold end temperature which ensures maximum inerts removal without CO2 freezeout is obtained by partial bypass of the low pressure CO2 refrigeration stream around the cold end section of the heat exchanger. The inerts stream is removed from the final separator warmed to ambient and passed through an expansion turbine whose guide vanes are on pressure control.
3.2.5 Oxygen Injection at Burners / Oxygen Handling
The oxygen generated in the ASUs must be distributed to the ASC boiler. In order to be able to use carbon steel piping, the pipeline network must be designed to a velocity limit to avoid the risk of fire caused by impingement of foreign objects within the piping against the pipe walls. In addition to the velocity restriction, there is also a restriction on the configuration of the piping so as to avoid situations in which impingement would be worse. Therefore, only long radius bends are used and T-junctions can only be used when flow goes from the main into the branch.
The key factor in supplying the oxygen for PF oxy-combustion combustion is that oxygen cannot safely be injected into the recycle flue gas flow through the coal mills i.e. via the primary recycle route. Whilst safe concentrations for oxygen in the primary recycle flow are likely to be of an order of similar to air, any significant increase above this is likely to result in the PF dust inside the mill igniting, with potentially disastrous results. In practical power plant operation, with mills being brought in and out of service to meet changes in electricity demand, the possibility of transient mismatches between recycle and oxygen flows appears significant, in addition to risks from equipment failures (e.g. oxygen flow control valve, recycle fan failure, blockages due to excessive coal in the mill).
Therefore the oxygen for the burners will be injected into the hot secondary gas recycle up to a maximum oxygen composition of 23% by volume. Any additional

Report No: E/04/031 Issue No.: 1 Confidential
3rd June 2005 Page 54 of 98 © Mitsui Babcock 2005
oxygen requirements will be injected directly into the burners and/or through overfire ‘air’ ports.
Injection of O2 directly at the burner may lead to poor and unstable combustion as the full mixing requirements may not be achieveable in the furnace volume.
The alternative is to inject O2 downstream of the mills but upstream of the burner ensuring that the O2 levels added to the PA / PF stream are no greater than those which would be present in the PA / PF stream on an air-fired plant. The advantage of this scenario is that better mixing is envisaged which would directly contribute to burner combustion stability. A conventional burner design is also retained.
Note that this pulverised coal preparation/combustion arrangement is similar to that found in current pulverised coal plants burning high moisture (e.g. ~ 60% by weight), friable low rank brown coals (principally in Germany and Australia). Flue gas is recycled at approximately 1000ºC from the furnace exit to contact raw coal as it falls down a 'drying shaft' into a beater mill that also acts as circulating fan. Gas temperatures fall rapidly in the shaft, and drying is completed in the mill to give an exit temperature of about 120ºC and a coal moisture content of approximately 15% by weight. A cyclone may be inserted in the pulverised coal/flue gas riser to inject a fuel-rich mixture at the main burner level, promoting stable ignition. The moisture-laden remainder flue gases are injected at a higher level, after combustion is established. The oxygen for combustion, apart from a small amount in the recycle flow, is all supplied from the secondary air, which must be mixed with the primary coal/flue gas stream before combustion can take place.
Oxy-combustion arrangements do not match so directly those in pulverised coal plants for less reactive, higher rank coals that require much finer grinding in vertical spindle or ball/rod mills with internal oversize particle recycling and, conventionally, a flow of primary air through the mill to dry and transport the coal. In this case, volatiles combustion can be initiated using the oxygen in the primary air stream, with no need for mixing with the secondary air.
No insuperable difficulties are anticipated for oxy-combustion in this latter, more widely used, pulverised coal preparation/combustion configuration, but modified burners will need to be developed to ensure efficient and stable combustion.
The relative advantages for combustion, operability and safety of the various possible permutations of:
• Injecting some or all oxygen directly at the burner
• Injecting a fraction of the oxygen in the secondary recycle flow
• Injecting a fraction of the oxygen in the primary recycle flow downstream of the milling plant to promote stable combustion and to avoid burner modifications for direct oxygen injection

Report No: E/04/031 Issue No.: 1 Confidential
3rd June 2005 Page 55 of 98 © Mitsui Babcock 2005
• Injecting oxygen at an overfire 'air' port
are beyond the scope of this study to determine, but overall plant cost and performance can be estimated irrespective of such configuration details.
4. NGCC OXY-COMBUSTION POWER PLANT WITH CO2 CAPTURE
4.1 Process Description and Performance
Section 4.1 initially presents the ground rule basis for the study, as agreed by the project partners based on the requirements of the IEA GHG R&D programme. Descriptions of a base case typical NGCC air-fired power plant without CO2 capture and the NGCC oxy-combustion power plant with CO2 capture are presented alongside heat and mass balances and performance data for the respective processes.
The NGCC Power Plant, designed for CO2 capture, utilises turbomachinery designed to operate with thermodynamic and transport properties of CO2/steam mixtures, using conventional design criteria. This plant is based essentially on the Gas-ZEP concept [31]. Other cycle options with water recycle or steam/CO2 recycle are possible, however, the more conventional CO2 recycle has been selected as the basis for this study. Characteristically, turbo-machinery speeds are reduced in CO2 relative to air due to differences in gas properties which translates into smaller power-plant output at synchronous speeds for heavy duty machines.
4.1.1 Technical and Financial Ground Rules
The main technical and financial ground rules for this study are included in Section 3.0 based on the study requirements as stated in the IEA GHG R&D programme document[27].
Size of plant
The net power output[27] of the NGCC plant was targeted as 500MWe in order to provide a reasonable comparison with the ASC PF power plant. In practice it is not possible to match the 500MWe criterion due to gas turbine size. For this study there was a choice between the NGCC plant being based on one GT resulting in a power output of less than 500MWe or two GTs with greater power output. Therefore the reference Case 3 is 1 x GT and the CO2 capture case is 2 x GT.
Oxygen Purity
The O2 purity supplied by the ASU was specified at 95% v/v. The justification for this is described in Section 4.1.3.1.2
4.1.2 Case 3: Typical NGCC Air Fired Power Plant Without CO2 Capture Base Case Process Description

Report No: E/04/031 Issue No.: 1 Confidential
3rd June 2005 Page 56 of 98 © Mitsui Babcock 2005
4.1.2.1 Description and Performance
A schematic of a simple combined cycle system consisting of a single gas turbine generator, a HRSG a single steam turbine generator, a condenser and associated auxiliary systems is shown in Figure 15.
ELECTRICITY
SupplementalFuel
Bypass
GAS TURBINE GENERATOR
Fuel
Air Intake
Superheated SteamExhaust Flue
Gas
PUMP PUMPDeaerator
ELECTRICITY
STEAM TURBINE GENERATOR
STACK
HEAT RECOVERY STEAM GENERATOR
CONDENSER
ELECTRICITY
SupplementalFuel
Bypass
GAS TURBINE GENERATOR
Fuel
Air Intake
Superheated SteamExhaust Flue
Gas
PUMP PUMPDeaerator
ELECTRICITY
STEAM TURBINE GENERATOR
STACK
HEAT RECOVERY STEAM GENERATOR
CONDENSER
Figure 15: Conventional Air Fired NGCC Power Plant Arrangement
The 400MWe gross (388MWe net) base case originates from a current state-of-the-art design where a single 9FA type gas turbine provides direct electrical power and a Heat Recovery Steam Generator (HRSG) generates steam at three pressure levels from the flue gases which in turn provides additional power via the use of a single steam turbine set. The overall net cycle efficiency associated with this NGCC plant was taken as 56.0% (LHV).
4.1.2.2 Typical NGCC Air Fired Power Plant Without CO2 Capture: Process Flow Diagram
For the costing purposes of this study and to highlight differences between conventional NGCC plant which uses once through air as the working fluid and plant designed for CO2 capture the key components of the NGCC plant are listed below:
Unit 1000: NGCC Power plant
(1 Gas Turbine Island; 1HRSG Island; 1 Steam Turbine Island)
PFD 8 illustrates the major components and process streams for a conventional NGCC plant:

Report No: E/04/031 Issue No.: 1 Confidential
3rd June 2005 Page 57 of 98 © Mitsui Babcock 2005
4.1.3 Case 4: NGCC Oxy-Combustion Power Plant With CO2 Capture Process Description
The combined cycle power plant concept employs a semi closed loop gas turbine with near stoichiometric combustion of natural gas in a mixture of CO2 and oxygen to produce a mixture of CO2 and steam (PFD 8). CO2 is captured from the products of combustion after flue gas condensation and cooling to standard atmospheric conditions to facilitate conventional turbomachinery mechanical design.
Near stoichiometric combustion with 2% O2 margin is required to ensure complete combustion of fuel for the expected degree of gas mixing in the combustion chamber (i.e. 2% over and above the stoichiometric requirement). Products of combustion are a mixture of CO2 and H2O which is expanded through the turbine for power generation in the gas turbine and to provide heat for the steam cycle.
Flue gas emerges from the HRSG at its dewpoint, 84°C, and is subsequently cooled to ~15°C, and water removed for recycle to GT, in order to preserve conventional turbomachinery design inlet conditions, minimise compressor flow size and maximise cycle performance potential.
Figure 16 shows the impact of recirculation temperature on net cycle performance and volumetric flow rate into the compressor.
Figure 16: NGCC Power Plant with CO2 Capture, The Effect of Flue gas Recirculation Temperature on Gas Turbine Performance
Cycle performance improves with less flue-gas cooling but volumetric specific power reduces by ~40%. Implication is that maximum volumetric specific power equals minimum capital cost in spite of the marginal loss of cycle efficiency. Also dry CO2 at 288K is more attractive from compressor materials corrosion point of view.

Report No: E/04/031 Issue No.: 1 Confidential
3rd June 2005 Page 58 of 98 © Mitsui Babcock 2005
Compression work is increased by higher compressor inlet temperature and flow with water content without complete flue gas condensation.
Water is removed from the flue gas, by direct contact with cold water, in readiness for capture and purification of surplus CO2 produced in combustion. The flue gas cooler may form part of a district heating system and benefit the power plant thermo economics.
Captured CO2 (~8% flue gas) is compressed to 30 bara, 31°C, in readiness for purification and separation of residual oxygen, argon and nitrogen, prior to sequestration at 110 bara. Inter-cooling requirement prevents more efficient compression in the Gas Turbine compressor.
Remaining CO2 is recirculated and compressed to 30 bara from standard atmospheric conditions, in the gas turbine, prior to the addition of sufficient oxygen, provided by means of a cryogenic air separation unit, for near stoichiometric combustion.
Gas turbine compressor inlet flow is dictated by the requirement to deliver power at synchronous speed, 3000 RPM. Speed is determined by compressor stage loading required for adequate performance and stall margin. Stage loading is defined in terms of stage vector triangles which define blade angles and velocities in terms of stage work and mean blade speed (Enthalpy change / Mean blade speed squared).
Velocity triangles then provide an empirical description of aerodynamic diffusion loading for a given aerofoil section. Change in gas properties from air to CO2 produces a reduction in speed for CO2 because the enthalpy reduces for a given pressure ratio in CO2 relative to air. Figure 17 shows typical compressor stage vector triangles illustrating the relationship between stage work and blade relative velocities.
DH/USQ
VX/UMα1
α2 β1β2
VR1 VA2VR2 VA1 BladeSpeed
UM
Aerodynamic Load = 1- VR22/VR1
2
β1
β2
Compressor Vector Triangles
Figure 17: GT Compressor Vector Triangles

Report No: E/04/031 Issue No.: 1 Confidential
3rd June 2005 Page 59 of 98 © Mitsui Babcock 2005
Figure 18 shows the difference between combined cycle power output for CO2 and air for cycle pressure ratio of 30. Speed reduction for similar flow and power translates into significant reduction in system power at the same synchronous power output.
Figure 18: NGCC Power Plant, Gas Turbine Effect of Synchronous Speed Requirements on Combined Cycle Power Requirements
Firing temperature (1389°C) is adjusted to facilitate single shaft rotor design with zero turbine blade cooling requirement for the last turbine stage. Turbine exit temperature is higher than conventional air design due to the effects of CO2 gas properties. However, the reduction in rotational speed, due to the compressor loading requirements for CO2, reduces turbine blade stress levels and compensates for the increased temperature to maintain adequate blade mechanical creep rupture life. Figure 19 shows the relationship between metal temperature requirements for adequate creep rupture life for a range of unspecified materials.

Report No: E/04/031 Issue No.: 1 Confidential
3rd June 2005 Page 60 of 98 © Mitsui Babcock 2005
Figure 19: NGCC Power Plant, Average Creep Rupture Properties for Constant Life
Twin shaft design could provide relief for the last turbine stage rotor mechanical design by facilitating a reduction of power turbine rotational speed. This could facilitate a firing temperature increase, for performance improvement, but may exceed the limitations set by steam generator/steam turbine materials as well as high pressure turbine cooling design technology requirements.
Twin shaft justification with further increase in cycle pressure ratio would tend to reduce the gas turbine exit temperature, due to increased compression work, in a way that is sympathetic to increasing turbine rotor blade stress due to resulting flow increase.
Alternatively the use of reheat may facilitate increased power density without exceeding HP turbine cooling design technology while achieving maximum exhaust heat for the steam cycle.
Single shaft design is more desirable, for system operability, since shaft speed excursions due to rapid load changes are resisted by turbomachinery inertia. Twin shaft system would require blow off valves to release the stored energy in the gas path during rapid load reduction. This prevents power turbine over-speed and avoids exceeding disc-bursting speeds.
Turbine cooling is achieved with CO2 bled from compressor inter-stage ports with appropriate source pressure levels to ensure adequate pressure margins for nozzle guide vane leading edge film cooling in each turbine stage. Normal cooling flow requirements for adequate blade life are facilitated by combination of colder coolant temperature and lower shaft speed due to CO2 gas properties.
The steam cycle is conventional and has three pressure levels (HP, IP and LP) with reheat with maximum steam temperature of 600°C entering the high pressure and intermediate pressure steam turbines.
Average Creep Rupture Properties
0
100
200
300
400
500
600
700
800
900
500.0 550.0 600.0 650.0 700.0 750.0 800.0 850.0 900.0 950.0 1000.0
Metal Temperature .C

Report No: E/04/031 Issue No.: 1 Confidential
3rd June 2005 Page 61 of 98 © Mitsui Babcock 2005
4.1.3.1 Case 4: NGCC Oxy-Combustion Power Plant With CO2 Capture Process Flow Diagram
For the purposes of this study, two gas turbines each with their associated HRSGs were combined to supply steam to a single steam turbine set on the basis of targeting 500MWe net power output. PFD 9 illustrates the major components for the NGCC power plant with CO2 capture:
Unit 1000: NGCC Power Plant
Unit 2000: ASU
Unit 3000: CO2 Purification and Compression
Properties of the fluid streams connecting power plant components are shown in PFD 9. Note: all the flows are the combined values for the duplicate streams.
4.1.3.1.1 Thermodynamic Process
The power plant system comprises a Brayton cycle gas turbine and a Rankine steam cycle linked by the Heat Recovery Steam Generator (HRSG) designed to utilise gas turbine waste heat for steam production.
Recirculated CO2 is mixed with sufficient oxygen, from the Air Separation Unit (ASU) after compression, to provide for near stoichiometric combustion of natural gas with 2% excess O2. The GT compressor outlet flow is depleted by the need for turbine cooling.
PFD 9 shows the relationship between components in the Gas ZEP (Zero Emission Power plant) process. The outputs from the system include combined cycle power and a flow of 88% purity net CO2 product flow at 30 bara which is then ready for purification to 95% by volume and further compression to 110 bara.
4.1.3.1.2 Air Separation Unit
The NGCC plant requires two ASUs each providing 3420 tonne/day of contained oxygen at 40 barg. The cycle chosen for this duty is one in which gaseous oxygen (GOX) is produced by pumping liquid oxygen (LOX) to the required 40 barg pressure and allowing this stream to be boiled against condensing high pressure air. There is no requirement for a separate oxygen compressor.
A low purity pumped LOX cycle was chosen, which produces 95% by volume oxygen purity. Other studies[4] have been carried out to show that for oxy-combustion plants this is the optimum purity. Even with no air inleakage the increase in power required for the ASU to produce 99.5% purity oxygen is greater than the increase in CO2 compression power required to remove the inerts introduced due to the lower purity oxygen. This is illustrated in Figure 20 which gives a plot of the net power required for oxygen production and CO2 treatment for given purities of oxygen.

Report No: E/04/031 Issue No.: 1 Confidential
3rd June 2005 Page 62 of 98 © Mitsui Babcock 2005
Cycle Description
To minimise the ASU power, a cycle has been chosen that uses two high pressure columns. A PFD and the mass balance of the process is given in PFD 10. A summary of the utility requirements are given in the table below. The standard double column cycle has a low pressure column (C105) with its reboiler (E103) integrated with the condenser of a high pressure column (C104). The column pressures are set to give a temperature driving force in the reboiler/condenser E103. In this cycle an extra column is added operating at an intermediate pressure (C103). The condenser (E104) for this column also integrates with a reboiler in the low pressure column but at a lower temperature, boiling a liquid stream higher up within the low pressure column which has a lower boiling point.
This arrangement minimises the amount of feed air that must be compressed to the higher pressure of C104, leading to the low power requirement of this process cycle.
The plant consists of: -
• a compression system;
• an adsorption front-end air purification system;
• a cold box containing the separation and the heat exchanger equipment.
This process offers the benefits of high reliability, low maintenance cost and it is simple to install and operate.
Air Compression and Cooling
Air is taken in through an inlet filter to remove dust and particulate matter prior to entering the main air compressor (K101A) where it is compressed to 3.4 bara using an intercooled axial compressor. The air discharge is cooled in the Direct Contact Aftercooler (DCAC), in the lower section with cooling water and in the upper section with chilled water from the chiller tower. This uses evaporation of water into the dry waste nitrogen stream leaving the ASU cold box to further cool part of the plant cooling water. The air is cooled to a temperature of around 12°C. The main air compressor will be an in-line axial compressor driven by an electric motor. Around half of this compressed air stream is then further compressed in a single radial wheel (K101B) to 5.2 bara, cooled to ambient and compressed in the compressor/expander
Per Plant Total
Power, (MWe) 45.0 90.0
Cooling Water, (tonne/hr) 3767 7534
Steam for ASU TSA regeneration (at 170°C), (MW) 3.0 6.0

Report No: E/04/031 Issue No.: 1 Confidential
3rd June 2005 Page 63 of 98 © Mitsui Babcock 2005
K103/K104 to 5.4 bara. Part of this high pressure air stream is further compressed to 90 bara in a multi-stage integrally geared centrifugal compressor with intercooling.
Air Cleanup
Before the air is cooled to cryogenic temperatures, water vapour and carbon dioxide and other trace impurities such as hydrocarbons and nitrous oxide are removed in a dual bed adsorber (C101). Removal of carbon dioxide and water avoids blockage of cryogenic equipment. The removal of impurities results in a clean, dry air stream free from contaminants which might cause blockages or safety problems in ASU operation. The adsorber operates on a staggered cycle, i.e. one vessel is adsorbing the contained impurities while the other is being reactivated by low pressure gaseous waste nitrogen using a temperature swing adsorber cycle. The nitrogen is heated to around 160°C against condensing steam in a reactivation gas heater followed by a period in which the bed is cooled down with ambient temperature nitrogen which bypasses the heater. The adsorbents used are generally selected for optimum operation at the particular site. They consist of layers of alumina or silica gel plus layers of zeolite. The adsorber vessels are vertical cylindrical units having annular adsorbent beds.
Principle of Cryogenic Air Separation
The industry standard method of cryogenic air separation consists of a double column distillation cycle comprising a high pressure and a low pressure column. The high pressure, higher temperature cryogenic distillation produces an overhead nitrogen product that is condensed against the low pressure, low temperature liquid O2 in the LP column sump. The plate-fin condenser-reboiler sits in the LP column sump and thermally links the HP and LP column. The HP column provides the boil up for the LP distillation column and the LP column O2 provides the condensing duty for the HP column. Some of the condensed nitrogen returns to the high pressure column as reflux. The balance of the pure nitrogen reflux is cooled in the subcooler and flashed into the top of the low pressure column as reflux. The columns have aluminium structured packing optimised for cryogenic separation. In this cycle an extra column is added operating at an intermediate pressure (C103 as shown in PFD 10). The condenser (E104) for this column also integrates with a reboiler in the low pressure column but at a lower temperature, boiling a liquid stream higher up within the low pressure column.
Cooling and Refrigeration
Following the front end adsorber and compression of around half of the air stream to the pressure of the high pressure column, both the intermediate and high pressure air streams are split in two. Three of these four streams (7, 9 and 22 as shown in PFD 10) are fed directly to the main heat exchanger, E101, which consists of a number of parallel aluminium plate-fin heat exchanger blocks manifolded together. The fourth, stream 17, is compressed in a multi-stage intercooled compressor to 90 bara (K105) before entering E101 as stream 18.

Report No: E/04/031 Issue No.: 1 Confidential
3rd June 2005 Page 64 of 98 © Mitsui Babcock 2005
The intermediate pressure stream 7 in PFD 10 is cooled close to its dew point (-171°C) and fed to the bottom of the intermediate pressure column. The second intermediate pressure stream 9 is removed from the main heat exchanger at -175°C then expanded in a centrifugal single wheel expansion turbine K104 running on the same shaft as a single wheel centrifugal compressor K103 which adsorbs the expander power. The expanded air is fed to the middle of the low pressure column at a pressure of about 1.4 bara and –184°C to provide refrigeration for the operation of the ASU. The high pressure stream 22 is cooled close to its dew point (-173°C) and fed to the bottom of the high pressure column. The high pressure air stream that has been boosted to 90 bara is cooled and condensed in the main heat exchanger against boiling oxygen at 40 barg. The resulting liquid air from the main exchanger is fed to the middle of both the high pressure and intermediate pressure columns.
Distillation System
In the high and intermediate pressure columns, the gaseous air feed is separated in the distillation packing into an overhead nitrogen vapour and an oxygen-enriched bottom liquid. The nitrogen vapour from the high pressure column (C104) is condensed against boiling oxygen in the low pressure column sump, and split into two parts. The first part is returned to the high pressure column as reflux, whilst the second part is subcooled in the subcooler (E102), reduced in pressure and fed to the low pressure column as reflux. The nitrogen from the intermediate pressure column is condensed against a boiling liquid stream in the low pressure column (C105). Part of this nitrogen is used as column reflux in the intermediate pressure column and part is subcooled and added to the reflux to the low pressure column.
Crude liquid oxygen is withdrawn from the sumps of the high and intermediate pressure columns, cooled in the subcooler (E102) against warming waste nitrogen and is flashed to the low pressure column as intermediate feeds. A portion of liquid air is also withdrawn from the middle of the high pressure column. This liquid is subcooled in the subcooler (E102) and fed to the middle of the low pressure column.
Low Pressure Column
The feeds to the low pressure column are separated into a waste nitrogen overhead vapour and a liquid oxygen bottom product, which reaches the required purity of 95% by volume.
The waste nitrogen is withdrawn from the top of the low pressure column and warmed in the subcooler (E102) and the main heat exchanger (E101). A portion of the nitrogen stream from the main exchanger is used for adsorber reactivation. The remaining dry nitrogen is vented through a chilled water tower to produce chilled water by evaporative cooling. The chilled water is used to provide additional feed air cooling in the top section of the DCAC.
Unlike the ASC PF Oxy-combustion plant pure liquid oxygen is withdrawn from the reboiler sump of the low pressure column, pumped to 40 barg and is returned to the main heat exchanger where it is vaporised and warmed up to ambient conditions
Report No: E/04/031 Issue No.: 1 Confidential
3rd June 2005 Page 65 of 98 © Mitsui Babcock 2005
against boosted air feed to the columns. The gaseous oxygen is then regulated and supplied to the NGCC power plant.
Oxygen Backup
Since the NGCC will not be designed to be able to operate on air, there is no benefit in the extra expense of backup for the ASU. Therefore, should the ASU fail to produce oxygen, the NGCC plant will be tripped.
Air Separation Equipment
Multiple structural steel cold boxes and one column can are supplied as part of the equipment. The column can is a cylindrical enclosure of pre-formed / pre-rolled flanged sections which bolt together at site to complete the structure. Steel jacket panels can be welded or bolted for equipment access to the framework. The cold boxes and column vessel are inclusive of process equipment. The process equipment is supplied and constructed of material suitable for use at low temperature.
The column can encloses the high, intermediate and low pressure columns. The reboiler and condensers are contained in the low pressure column. All heat exchangers in the cold air separation equipment are multi-passage, extended surface aluminium / aluminium alloy, plate-fin heat exchangers.
The main heat exchanger and subcooler are prefabricated. The main heat exchanger (MHE) box houses the main heat exchanger and the expander units. The subcooler box contains a multi-passage, extended surface plate fin heat exchanger.
The primary insulation material is expanded pearlite. Certain areas are packed with rockwool to allow access for maintenance of valves without pearlite removal.
A dry nitrogen purge system is included on all cold boxes and cans to prevent moist atmospheric air from leaking into the cold box/can during normal operation.
4.1.3.1.3 CO2 Treatment
The net flue gas, essentially raw CO2, leaves the NGCC plant at 1.03 bara and is compressed to 30 bara and is the feed to the process shown in PFD 11. A summary of the performance of this system is given below.

Report No: E/04/031 Issue No.: 1 Confidential
3rd June 2005 Page 66 of 98 © Mitsui Babcock 2005
Performance Summary for CO2 Treatment System : 95% CO2 purity
Flue Gas Heater (to 325°C) (MWe) 1.3
Feed CO2 Compressor power to 30 bar (MWe) 23.6
Net Compressor/Expander Power (MWe) 5.4
Cooling Water (tonne/hr) 1554.92
CO2 leaving cold box @ 9.7 bar 11.5 (%)
@ 21.5 bar 88.5 (%)
CO2 Captured Purity 95.89 (% v/v)
Contained CO2 177.18 (tonne/hr)
Recovery 97.16 (%)
The CO2 treatment plant consists of:
• A drier system
• A cold box containing CO2 purification equipment
• A compression system
The raw CO2 is dried and the inerts (N2 and Ar) and oxygen are separated to give >95 mol% CO2. The CO2 is then compressed to 110 bara for pipeline transmission. Any excess oxygen (there is no SO2 or NOX in the flue gas) present in the CO2 need not be removed as the final CO2 product will be used either for enhanced oil recovery (EOR) or stored in aquifers. The heat and mass balance for this process is given in PFD 11.
The raw CO2 gas passes through a temperature swing dual bed desiccant dryer C201 to reach a dew point of below -55°C before entering the “cold box”. The cold equipment is contained in a steel jacketed container or “cold box” with pearlite granular insulation. This desiccant dryer system prevents ice formation which could cause a blockage in the cold box as well as causing corrosion in the pipeline.
The inerts removal process uses the principle of phase separation between condensed liquid CO2 and insoluble inerts gas at a temperature of –55°C which is very close to the triple point or freezing temperature of CO2. The CO2 partial pressure can be reduced to about 7 bara. The actual CO2 pressure levels used for the separation are fixed by the specification of >95 mol% CO2 product purity and the need to reduce the CO2 vented with the inert to an economic minimum.
As shown in PDF 11, the system proposed uses two flash separators, C202 and C203, at temperatures of -27°C and -55°C. The CO2 feed gas pressure is at 30 bara.

Report No: E/04/031 Issue No.: 1 Confidential
3rd June 2005 Page 67 of 98 © Mitsui Babcock 2005
The necessary refrigeration for plant operation is obtained by evaporating liquid CO2 at pressure levels of 21.5 bara (stream 19) and 10.1 bara (stream 13) and compressing these two low pressure gas streams in the main CO2 product compressor to the final pipeline delivery pressure of 110 bara. The separated inert gas at 29 bara leaving the cold box can be heated and passed through a power recovery turbine. It is possible to reach a CO2 purity in excess of 96% by volume using this method at inlet CO2 concentrations as low as 77% by volume with a CO2 recovery of better than 90%.
The dry gas is fed to the cold box and is cooled by heat exchange to –27°C with the returning evaporating and superheating CO2 streams and the waste streams in the main exchanger. The main heat exchangers, E201 and E202, are multi-stream plate-fin aluminium blocks. The cooled feed stream 3 is sent to a separator pot C202, the stream is split into liquid and vapour; the liquid produced, stream 17, contains part of the required CO2 product.
The vapour from the separator, stream 4, still contains a large proportion of CO2. In order to recover this CO2 the vapour is cooled further to –55°C where it partially condenses and is passed to another separator pot C203. The pressure at this point is critical in controlling the process, cooling the vapour below –56.2°C would lead to the formation of solid carbon dioxide. The vapour, stream 6, from the second separator (C203), containing the separated inerts together with some CO2 at a partial pressure of about 7 bara, is sent back through the heat exchangers E201 and E202 where it is heated to 21.6°C. This stream of inerts which is at a pressure of 29 bar is heated against hot flue gas in the boiler island and expanded in a power producing turbo-expander (K203) before being vented.
Liquid, stream 17, from the first separator C202 containing part of the CO2 is expanded through a J-T valve to 21.7 bara and heated to 21.6°C. The liquid, stream 11, from the second separator, is heated, expanded through a valve to 10.1 bara and a temperature of about –56°C to provide refrigeration in E202 by evaporation, while the vapour formed is heated to 21.6°C in E202 and E201. The CO2 vapour is then compressed in a single radial wheel (K202) to 21.7 bara (C202 stream 19), the same pressure as the CO2 stream from the first separator. The two streams are combined (stream 20) and compressed to the required pressure of 110 bara (stream 21) This machine (K201) is a four stage unit (see Figure 21) which could be operated from the 21.6 bara to 110 bara level as either an intercooled compressor or as an adiabatic compressor with an aftercooler used to heat condensate. Since the adiabatic compression heat cannot be used in this case to preheat condensate, only the intercooled option is considered here. The likelihood of dense fluid CO2 forming in K201 has meant that the machine has only one intercooler, to prevent the dense phase forming within the machine
The plant is furnished complete with all structural, mechanical equipment, piping, supports, anchor bolts, electrical equipment, instrumentation, controls and accessories as required for continuous automatic operation. The controls are to be

Report No: E/04/031 Issue No.: 1 Confidential
3rd June 2005 Page 68 of 98 © Mitsui Babcock 2005
designed to interface with the power plant systems. The intent would be to operate the plant from a remote central control room with periodic inspection.
4.1.3.2 Case 4: NGCC Oxy-Combustion Power Plant With CO2 Capture: Performance
The actual combined cycle power plant system, being studied, consists of two gas turbines with corresponding ASU oxygen supply accompanied by a single steam cycle to provide 575MWe gross (440MWe net) at 44.7% net efficiency (LHV) with allowance for ASU power, feedwater pumping power, CO2 compression and inerts removal, and generator losses. This allows comparison of this type of configuration with the 532MWe net ASC PF oxy-combustion power plant equivalent.
The penalty therefore in terms of net cycle efficiency associated with the NGCC CO2 capture plant is calculated at 11.3% points when compared to the reference NGCC power plant without CO2 capture
The auxiliary power consumption for the NGCC CO2 capture plant is shown in Table 3.
4.1.3.2.1 CO2 vs Air-Firing Cycle Performance
Comparison of CO2 with air at 20 bar cycle pressure ratio shows the impact of ASU power requirement on gas turbine efficiency which is reflected in the overall combined cycle efficiency. The table below shows the effect of CO2 and cycle pressure ratio on performance. Note CO2 capture power loss is excluded from these figures.
Comparison between 30 bar and 20 bar cycles, with CO2 working fluid, shows a 4% points improvement in the gas turbine efficiency. The GT pressure ratio of 30 bar represents the current limit for conventional gas turbines and was therefore selected for in depth design comparison with conventional gas turbine design technology.
4.1.3.2.2 Performance Potential
CO 2 vs. Air Cycle Performance
AIR CO2 CO 2
GT Pressure Ratio 20 20 30 ST Inlet Pressure (BAR) 145 190 190 Steam Process 3 Press RH 3 Press RH 3 Press RH
GT Efficiency 0.38 0.202 0.24 ST Efficiency 0.308 0.299 0.297 CC Efficiency 0.57 0.441 0.466
GT Specific Power kJ /Kg 393 232 297 ST Specific Power kJ / K g 198 273 278 CC Specific Power kJ /Kg
591 524 596 Note: CO2 capture power is excluded from these figures

Report No: E/04/031 Issue No.: 1 Confidential
3rd June 2005 Page 69 of 98 © Mitsui Babcock 2005
Figure 22 below indicates the remaining performance potential as a function of cycle pressure ratio, for single shaft design, where the design is constrained by gas turbine cooling requirements for zero cooling in the final stage turbine. Full potential of such a system is likely to be ~50% cycle efficiency using existing cryogenic air separation unit and CO2 capture systems and with the additional benefit of steam cooling which can be worth ~2% points cycle efficiency.
Figure 22: NGCC Power Plant with CO2 Capture, Effect of GT Pressure Ratio on Cycle Efficiency
4.1.3.2.3 NGCC GT Compressor Design
Table 4 shows how much the change in gas properties from air to CO2 changes the speed requirement for equal stage loading with corresponding reduction in GT compressor exit temperature. Changing the working fluid from air to CO2 effectively reduces the speed to 77% of the value for air with the same number of stages. Increasing the pressure ratio at the same speed increases the stage number to 18 for the same stage loading. Loading is defined as:-
(Compressor Enthalpy Rise per Stage) / (Mean blade speed) 2
4.1.3.2.4 Turbine Blade Cooling
The corresponding effect of changed gas properties during expansion is to increase the turbine exit temperature which conspires to make turbine cooling and mechanics more severe by virtue of the higher temperature gradient through the turbine blade surface with cooler CO2 coolant. Table 5 illustrates how the turbine boundary conditions alter when changing the working fluid from air to CO2 indicating a significant increase in turbine exit temperature due to gas properties. Increasing
Effect of Cycle Pressure Ratio on Cycle Performance
-3
-2
-1
0
1
2
3
500 520 540 560 580 600 620 640 660Specific Power Kj/Kg
Del
ta E
ffici
ency
%
1300
1400
1500
1600
1700
1800
1900
Burner Exit Temperature
% Delta Efficiency
20
3040 50
Concept Design B
urne
r Exi
t Tem
pera
ture
.K
Cycle Pressure
Ratio

Report No: E/04/031 Issue No.: 1 Confidential
3rd June 2005 Page 70 of 98 © Mitsui Babcock 2005
cycle pressure ratio for CO2 allows an increase of firing temperature for the same turbine exit temperature and rotational speed.
However, the associated reduction in speed compensates for the increased severity in temperature gradient to provide a satisfactory blade cooling solution. Figure 23 illustrates the difference in cooling characteristics for a 30 bar Gas ZEP compared to a 20 bar conventional industrial machine. Although the heat transfer is higher for Gas ZEP the coolant volumetric flow rate is lower for blades and vanes due to the density increase. This implies a relatively lower blade cross sectional area requirement for CO2 comparing V1 and R1 for each design.
(Nomenclature of chart is V1 = Stage 1 Vane, R1 = Stage 1 Rotor Blade etc).
Figure 23: NGCC Power Plant with CO2 Capture, Effect of CO2 and Cycle Pressure Ratio on GT Turbine Rotor Blade Cooling
4.1.3.2.5 Effect of Oxygen and CO2 Purity on Cycle Performance
Interaction of supplied oxygen purity with captured CO2 purity, with cycle performance, is shown in Figure 24, indicating increasing power losses with increasing purity of both CO2 and oxygen.
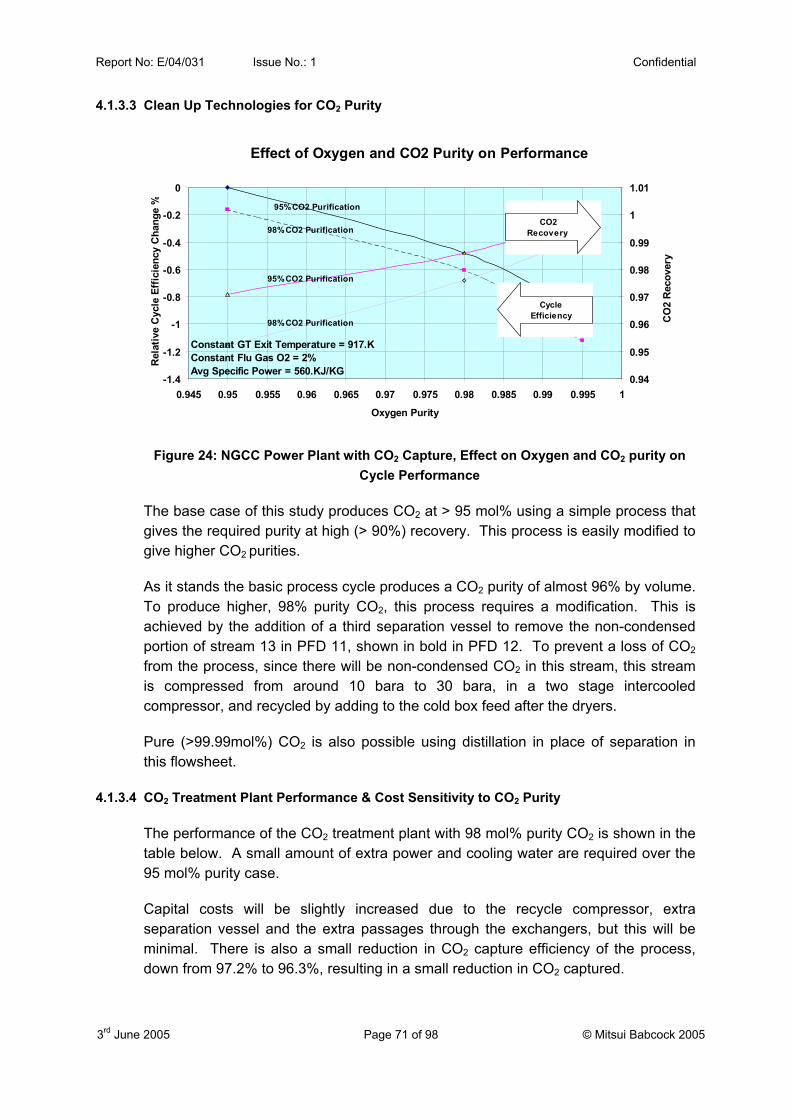
Report No: E/04/031 Issue No.: 1 Confidential
3rd June 2005 Page 71 of 98 © Mitsui Babcock 2005
4.1.3.3 Clean Up Technologies for CO2 Purity
Figure 24: NGCC Power Plant with CO2 Capture, Effect on Oxygen and CO2 purity on Cycle Performance
The base case of this study produces CO2 at > 95 mol% using a simple process that gives the required purity at high (> 90%) recovery. This process is easily modified to give higher CO2 purities.
As it stands the basic process cycle produces a CO2 purity of almost 96% by volume. To produce higher, 98% purity CO2, this process requires a modification. This is achieved by the addition of a third separation vessel to remove the non-condensed portion of stream 13 in PFD 11, shown in bold in PFD 12. To prevent a loss of CO2 from the process, since there will be non-condensed CO2 in this stream, this stream is compressed from around 10 bara to 30 bara, in a two stage intercooled compressor, and recycled by adding to the cold box feed after the dryers.
Pure (>99.99mol%) CO2 is also possible using distillation in place of separation in this flowsheet.
4.1.3.4 CO2 Treatment Plant Performance & Cost Sensitivity to CO2 Purity
The performance of the CO2 treatment plant with 98 mol% purity CO2 is shown in the table below. A small amount of extra power and cooling water are required over the 95 mol% purity case.
Capital costs will be slightly increased due to the recycle compressor, extra separation vessel and the extra passages through the exchangers, but this will be minimal. There is also a small reduction in CO2 capture efficiency of the process, down from 97.2% to 96.3%, resulting in a small reduction in CO2 captured.
Effect of Oxygen and CO2 Purity on Performance
-1.4
-1.2
-1
-0.8
-0.6
-0.4
-0.2
0
0.945 0.95 0.955 0.96 0.965 0.97 0.975 0.98 0.985 0.99 0.995 1
Oxygen Purity
Rel
ativ
e C
ycle
Eff
icie
ncy
Cha
nge
%
0.94
0.95
0.96
0.97
0.98
0.99
1
1.01
CO
2 R
ecov
ery
Constant GT Exit Temperature = 917.KConstant Flu Gas O2 = 2%Avg Specific Power = 560.KJ/KG
95% CO2 Purification
98% CO2 Purification
95% CO2 Purification
98% CO2 Purification
CO2 Recovery
Cycle Efficiency
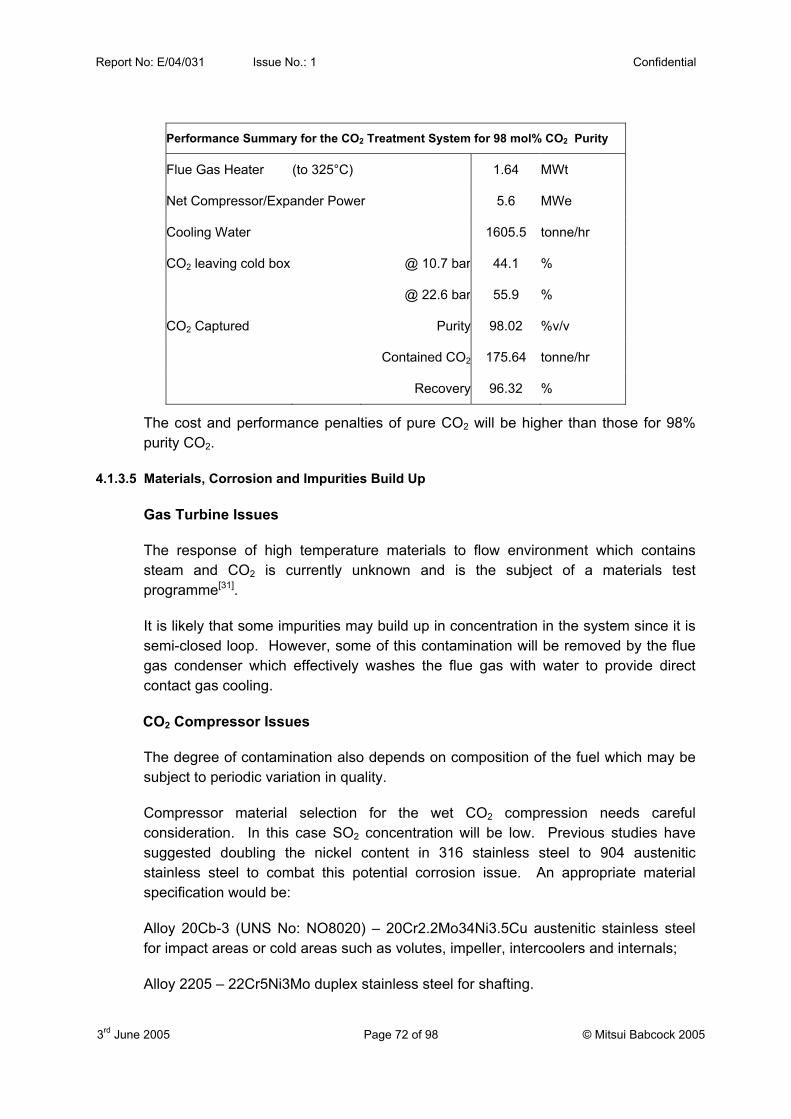
Report No: E/04/031 Issue No.: 1 Confidential
3rd June 2005 Page 72 of 98 © Mitsui Babcock 2005
Performance Summary for the CO2 Treatment System for 98 mol% CO2 Purity
Flue Gas Heater (to 325°C) 1.64 MWt
Net Compressor/Expander Power 5.6 MWe
Cooling Water 1605.5 tonne/hr
CO2 leaving cold box @ 10.7 bar 44.1 %
@ 22.6 bar 55.9 %
CO2 Captured Purity 98.02 %v/v
Contained CO2 175.64 tonne/hr
Recovery 96.32 %
The cost and performance penalties of pure CO2 will be higher than those for 98% purity CO2.
4.1.3.5 Materials, Corrosion and Impurities Build Up
Gas Turbine Issues
The response of high temperature materials to flow environment which contains steam and CO2 is currently unknown and is the subject of a materials test programme[31].
It is likely that some impurities may build up in concentration in the system since it is semi-closed loop. However, some of this contamination will be removed by the flue gas condenser which effectively washes the flue gas with water to provide direct contact gas cooling.
CO2 Compressor Issues
The degree of contamination also depends on composition of the fuel which may be subject to periodic variation in quality.
Compressor material selection for the wet CO2 compression needs careful consideration. In this case SO2 concentration will be low. Previous studies have suggested doubling the nickel content in 316 stainless steel to 904 austenitic stainless steel to combat this potential corrosion issue. An appropriate material specification would be:
Alloy 20Cb-3 (UNS No: NO8020) – 20Cr2.2Mo34Ni3.5Cu austenitic stainless steel for impact areas or cold areas such as volutes, impeller, intercoolers and internals;
Alloy 2205 – 22Cr5Ni3Mo duplex stainless steel for shafting.
Report No: E/04/031 Issue No.: 1 Confidential
3rd June 2005 Page 73 of 98 © Mitsui Babcock 2005
4.2 Safety and Operability
4.2.1 NGCC Power Plant Operability and Control
Semi-closed loop power plant operability will require increased controls and instrumentation than conventional air-fired NGCC plant to account for the variation in gas turbine working fluid composition due to variation in fuel composition, ASU supply oxygen purity, CO2 capture purity, flue gas cooling variation and power demand during normal operation.
Compressor inlet conditions must be maintained near standard atmospheric values of 15°C and 1 bar at whatever flow is demanded to satisfy power requirements for any gas composition.
Purity of the CO2 for capture will depend on composition of the fuel as well as oxygen purity delivered from the ASU and therefore gas turbine control system needs to be integrated with the ASU and CO2 capture sub-systems.
Transient loads will require some form of compensation for the amount of stored energy contained within the flue gas return ducting. Recirculation conduit is required to transfer flue gas from HRSG exit to Compressor Inlet. Typically blow-off valves are used to release stored energy to accommodate such load transients. It is anticipated that normal load transients will cycle between 50% and 100% power at constant speed. This variation is facilitated by compressor variable guide vanes in steady state operation.
Load rejection may require more drastic action since complete shutdown is implied with the possibility of a hot restart. Special procedures will be required to ensure that all systems can function immediately following a shutdown.
Thermal soakage distorts casing and rotors, creating a tip clearance problem which is distinct from a cold restart. This would degrade design operation if it were uncontrolled.
4.2.2 ASU Safety Issues
See section 3.2.2.
4.2.3 ASU Plant Process Control
4.2.3.1 Control System Design Philosophy
The control system is designed to meet the following overall objectives:
• To provide a safe system.
• To meet the plant reliability and availability targets.
• To enable the plant to run routinely within the particular operation constraints.

Report No: E/04/031 Issue No.: 1 Confidential
3rd June 2005 Page 74 of 98 © Mitsui Babcock 2005
4.2.3.2 Control Strategy
The following control strategy outlines the control loops in place on a typical pumped LOX ASU such as the one considered for this study. There will be an overall supervisory control program which will allow the ASU and CO2 compression and purification systems to be adjusted automatically in response to planned load changes on the NGCC plant in response to changing electrical demand from the grid. This control program will also allow for a controlled rate change of oxygen from the ASU by ramping the plant up or down at a rate between 2-3% of full flow per minute.
4.2.3.3 ASU Air Supply
Main Air Compressor
Air to the cold box supplied by the Main Air Compressor (MAC) is flow controlled by varying the guide vanes on the compressor. As the guide vanes are opened up, the flow rate through the compressor will increase which will ultimately increase the product flow of O2 with a delay subject to the time constant of the system. There will be an associated increase in the discharge pressure of the MAC and this is monitored by a separate pressure control loop which will vent the MAC product air should the calculated approach to the compressor surge line become unacceptably close.
Air Purification System
All the air to the ASU at a pressure of 3.36 bara is passed through a set of adsorber beds where water, carbon dioxide, acetylene and heavy hydrocarbons and some N2O are adsorbed.
The beds operate on a Thermal Swing Adsorption process (TSA), with bed regeneration obtained by heating the adsorbent at low pressure. Regeneration heat is provided by heating part of the low pressure waste N2 stream leaving the Main Heat Exchanger (E101) as shown in PFD 10 in a steam reactivation heater and passing it through the bed in the reverse direction to the air. This is followed by a cooling period when the heater is by-passed. The on-stream time for each bed is typically 3 to 6 hours, and while one vessel is on-line the other undergoes regeneration. The changeover of the on-line bed and subsequent regeneration is controlled entirely by a pre-programmed sequence in the control system.
During the sequence when no re-generation gas is required, all waste gas is vented under pressure control. When the sequence moves from the depressurisation step onto the heating step the required valves are ramped slowly under automatic control minimising disturbance to the plant. Feed forward control is used when switching from the cooling step to the re-pressurisation step to further minimise disturbance to the ASU when the TSA inlet valve closes.
The temperature of the regeneration gas is controlled by regulating the regen gas flow through the reactivation heater. The steam supply through the heater has no

Report No: E/04/031 Issue No.: 1 Confidential
3rd June 2005 Page 75 of 98 © Mitsui Babcock 2005
temperature control and can vary, therefore there is a bypass of the reactivation gas around the heater to help to control the temperature of the reactivation gas. The temperature controller acts to limit the reactivation feed flow through the heater by increasing the bypass flow to control the outlet temperature.
Automated front-end regeneration is provided for plant start-up, returning air from the on-line bed as regeneration gas through the reactivation heater. A coldbox trip also sets the TSA to front-end regeneration, allowing the compressor and TSA to continue running. There is a CO2 analyser to sample the CO2 content of the air to the coldbox leaving the TSA. The analyser is switched to sample the reboiler sump at regular intervals, generally coinciding with molecular sieve bed changeover.
Main Heat Exchanger
The air leaving the TSA adsorbers is passed through the main heat exchanger (E101 as shown in PFD 10), where it is cooled by counter current heat transfer with the returning waste N2 and product GOX flows. The total air flow is controlled by the MAC guide vanes, with the split between LP and MP plus HP column flow controlled by the guide vanes on the K102 air compressor. The expander flow is controlled by the setting up of the expander inlet guide vanes. The boosted air flow is determined by a temperature controller at the cold end of the main heat exchanger which regulates the flow of liquid air to the HP column via the JT valve. The booster compressor guide vanes control the air flow.
ASU Compander
The energy produced by the expander part of the compander is used to drive the air booster compressor part. The medium pressure (MP) air flow through the expander is controlled by the expander inlet guide vanes and the booster discharge pressure varies as the booster and expander flows are adjusted.
4.2.3.4 ASU Column System
The general principle for maintaining the correct mass balance for the column section is detailed in the following sections. Air flow into the plant and product flows out are all flow controlled hence any gas not taken as product leaves the plant as waste.
Distillation Columns
The amount of nitrogen reflux flow from the condensers to the high and intermediate pressure columns is modulated using remotely operated control valves to maintain the correct column operating composition profile in both columns. Liquid air is withdrawn from the middle of the HP column and fed to the LP column via the subcooler under flow control.
Level controllers maintain the sump levels in the high and intermediate pressure columns by controlling the transfer of liquid to the LP column. These streams enter the LP column as crude LOX.
Report No: E/04/031 Issue No.: 1 Confidential
3rd June 2005 Page 76 of 98 © Mitsui Babcock 2005
The LP column is split into three sections. In the top section, a waste nitrogen stream is taken off under pressure control at the warm end of the MHE. Liquid air from the high pressure column enters at the top of the second section and the Crude LOX (from the high and intermediate pressure column sumps) and LP air (from the expander) are fed to the column at the top of the third section. The LOX product collects in the column.
GOX Product
LOX from the LP column sump is pressurised in a liquid pump, vaporised and warmed in the main heat exchanger against cooling and condensing air. The GOX product is delivered to the plant on both pressure control and flow control. The pressure control acts by controlling the amount of LOX taken off the LP column sump and the flow rate is controlled by adjustment of the air flow from the MAC. A vent valve is provided to discharge excess oxygen if downstream problems arise.
The oxygen flowrate required by the oxy-combustion system determines the total demand on the two ASUs. At any total flow below the maximum, the two ASUs will automatically adjust their flows to produce the required total oxygen flow. As the total oxygen flow approaches maximum, the computer system will be programmed to indicate to the operators the oxygen flow and enable adjustments in demand to be made.
4.2.4 CO2 Recovery Plant Process Control
The CO2 recovery plants would typically be designed to interface with the Gas turbine control system, allowing ease of use and high reliability.
The design of the instrumentation and Distributed Control System (DCS) enables safe operation of the CO2 recovery plant and provides the necessary control while handling disturbances and certain levels of process or instrumentation degradation. The instrumentation and distributed control system is made to be sufficiently reliable and robust so as to require no operator involvement during normal plant operation.
The drier operation is controlled by the DCS. Valve switching and sequencing will be automated for the entire adsorber cycle, including the on-stream and regeneration steps. The amount of moisture in the gas stream leaving the drier is monitored to ensure the good performance of the system.
Dry crude CO2 at 30 bara enters the plate fin heat exchanger where it is cooled to –55°C in two stages. The cooling is accomplished by evaporating two CO2 streams taken from the intermediate separator at 21.5 bara and from the cold separator at 10.1 bara. These pressures are controlled using inlet guide vanes for flow control of the CO2 product compressor at the appropriate points.
Level control is used to remove condensed liquid CO2 in the two separators. The critical cold end temperature which ensure maximum inerts removal without CO2 freezeout is obtained by partial bypass of the low pressure CO2 refrigeration stream

Report No: E/04/031 Issue No.: 1 Confidential
3rd June 2005 Page 77 of 98 © Mitsui Babcock 2005
around the cold end section of the heat exchanger. The inerts stream is removed from the final separator warmed to ambient and passed through an expansion turbine whose guide vanes are on pressure control.
4.2.5 NGCC Oxy-Combustion Power Plant Start Up Issues
Start-up is anticipated to require special procedures since the Gas Turbine flowpath will need to be primed with CO2 in order to satisfy the turbomachinery flow requirements until self sustaining speed is reached by the system, typically 50%. This will necessitate a CO2 liquid storage and vaporisation system requirement.
5. ECONOMICS
The technical and financial ground rules used for this study are included in Section 3.0
5.1 ASC PF Oxy-Combustion Power Plant with CO2 Capture
In order to evaluate the economics of the ASC PF oxy-combustion power plant with CO2 capture, investment costs and O&M costs were generated for:
Case 1: 740MWe gross ASC PF air-fired plant without CO2 capture; and
Case 2: 740MWe gross ASC PF oxy-combustion power plant with CO2 capture.
Note the economic analysis featured within this study is based on CO2 capture and CO2 compression to 110 bara, costs associated with transport and storage are excluded as they are generally site specific.
Investment Costs
Tables 6 and 7 illustrates the installed capital costs in Euros associated with Case 1 and Case 2 respectively. The installed costs are given and the owners costs (including contingency and fees) are added as a percentage of the installed costs to arrive at the Total Investment Costs (TIC).
The estimated accuracy of figures quoted is ± 25%.
The costs have been normalised to US$ in line with the IEA guidelines[27]. Note: In compiling costs some of the units were estimated in US$ whilst others were in Euros. In the case of dollar pricing a conversion has been made at the rate of 1 Euro = 1.2 US$.
For each of the cases the following major power plant units have been identified and the costs associated with the respective unit expressed.
• Case 1: 740 MWe Gross ASC PF Air-Fired Power Plant Without CO2
Capture

Report No: E/04/031 Issue No.: 1 Confidential
3rd June 2005 Page 78 of 98 © Mitsui Babcock 2005
Unit 100 Coal and Ash Handling Unit 200 Boiler Island
Unit 300 FGD Plant and Handling Plant Unit 400 DeNOx Plant Unit 500 Steam Turbine Island Unit 800 BoP, Electrical, I&C
• Case 2: 740 MWe Gross ASC PF Oxy-Combustion Power Plant with CO2 Capture
Unit 100 Coal and Ash Handling Unit 200 Boiler Island
Unit 500 Steam Turbine Island Unit 600 ASU Unit 700 Inert Removal and CO2 Compression
Unit 800 BoP, Electrical, I&C
The outline equipment list for each of the above cases is given in Tables 8 and 9.
The direct field costs DFC are defined as
• Direct Materials: Including equipment and bulk materials.
• Construction: Including mechanical erection, instrument and electrical installation, civil works and where applicable buildings and site preparation.
• Other costs Including temporary facilities, solvents, catalysts, chemicals, training, commissioning, start up costs and spare parts.
• EPC services Including contractors home services and construction supervision and freight.
The indirect field costs (IFC) are:
• Contingency: 10% of the total installed costs
• Fees: 2% of the total installed costs
• Owner Costs: 16% of the total installed costs
Note: these costs are inherently site specific. The IEA GHG basic criteria for owners costs was suggested as 5% and this was used for ASU and CO2 compression plant equipment. However, the resulting 16% is the overall weighted average figure for the power plant with CO2 capture [32].

Report No: E/04/031 Issue No.: 1 Confidential
3rd June 2005 Page 79 of 98 © Mitsui Babcock 2005
Land, taxes, project management, transmission lines to an existing grid system, other infrastructure changes and financing can add >40%[32] onto a basic EPC price. For the purposes of this study, the indirect field costs have been taken as 32% of the EPC of the basic PF Power Plant based on Mitsui Babcock’s in-house cost data base.
The summing of the above costs generates the Total Investment Cost (TIC) for each of the major power plant units. (i.e. TIC = DFC + IFC).
Table 10 shows the percentage contribution of each unit to the overall Total Investment Cost for Case 1 and Case 2.
The Total Investment Costs for Case 1 and Case 2 are expressed as a function of their gross and net power output to arrive at the Specific Investment costs associated with each power plant, namely:
• Case 1: 1152 Euro/kWe Gross (1382 US$/kWe Gross)*
1260 Euro/kWe Net (1512 US$/kWe Net)*
• Case 2: 1408 Euro/kWe Gross (1690 US$/kWe Gross)*
1951 Euro/kWe Net (2342 US$/kWe Net)*
*Note: the above figures are based on exchange rate of 1 Euro = 1.2 US$.
Where possible the resulting specific investment cost have been checked against market prices to ensure the estimates prepared in this study are representative of the current market prices.
For comparisons capital costs of supercritical PF plant quoted in literature range widely. Kjaer[32] quotes 1400 US$/kWe (assumed gross) for a 400 MWe plant in Europe, while the world bank quotes 1000-1200 US$/kWe for advanced plant. However, site specific factors, exchange rate, price of steel and owners costs have a significant influence on the TIC.
Operation and Maintenance Costs
The operating and maintenance cost figure is formed from a fixed cost and variable cost.
The variable cost element in the total operating and maintenance cost figure is derived from the consumables associated with each plant. The consumables associated with Case 1and Case 2 are listed in Table 11 and are based on 7446 operating hours in a year (85% load factor following commissioning and start up).
The fixed cost contribution to the total operating and maintenance cost figure is shown in Table 12. These costs are calculated using:
• Operator cost and supervision (50k US$/yr per operator)

Report No: E/04/031 Issue No.: 1 Confidential
3rd June 2005 Page 80 of 98 © Mitsui Babcock 2005
• Administration and general overheads (30% of direct labour)
• Maintenance 4% of installed costs per year as excluding contingency fees and owner costs as per IEA technical specification[27].
Therefore the total operation and maintenance costs calculated for both plants are:
Case 1: 99.571 M Euro per year (119.485 M US$ per year)
Case 2: 102.140 M Euro per year (122.568 M US$ per year)
CO2 Abatement Costs for PF Plant
In order to generate the Cost of Electricity (CoE) in USc/kWh and the Cost of CO2 avoidance (US$/ton CO2) associated with the PF base case and the CO2 capture case, the figures generated above were entered into IEA’s GHG standard economic spreadsheet version 01, February 2003.
The sensitivity of the model results to varying fuel cost (± 100%), discount rate (10% and 5%) and Total Investment Cost (-20%) were then evaluated.
The results of the spreadsheet models are shown in:
Case 1: PF Power Plant without CO2 Capture
Table 13: Case 1: ASC PF Air Fired Power Plant Without CO2 Capture: 10% Discount Rate
Table 14: Case 1: ASC PF Air Fired Power Plant Without CO2 Capture: 10% Discount Rate & +100% Fuel Price
Table 15: Case 1: ASC PF Air Fired Power Plant Without CO2 Capture: 10% Discount Rate & -100% Fuel Price
Table 16: Case 1: ASC PF Air Fired Power Plant Without CO2 Capture: 5% Discount Rate
Table 17: Case 1: ASC PF Air Fired Power Plant Without CO2 Capture: 10% Discount Rate & -20% TIC
Case 2: PF Oxy-combustion Power Plant with CO2 Capture
Table 18: Case 2: ASC PF Oxy-Combustion Power Plant with CO2 capture: 10% Discount Rate
Table 19: Case 2: ASC PF Oxy-Combustion Power Plant with CO2 capture: 10% Discount Rate & +100% Fuel Price
Table 20: Case 2: ASC PF Oxy-Combustion Power Plant with CO2 capture: 10% Discount Rate & -100% Fuel Price

Report No: E/04/031 Issue No.: 1 Confidential
3rd June 2005 Page 81 of 98 © Mitsui Babcock 2005
Table 21: Case 2: ASC PF Oxy-Combustion Power Plant with CO2 capture: 5% Discount Rate
Table 22: Case 2: ASC PF Oxy-Combustion Power Plant with CO2 capture: 10% Discount Rate & -20% TIC
The Effect on Cost of Electricity Resulting from CO2 Capture on ASC PF Plant
The results of the above simulations and sensitivities are summarised in Table 23.
As expected the investment cost and the fuel price dominate the CoE. The reference air-fired case for the ASC PF plant resulted in a calculated CoE of 4.98 US Cents/kWh.
This study is 44.2% net LHV, 1152 Euros/kWe gross (1384 US$/kWe gross) and IEA GHG economic parameters give 4.98 US Cents/kWh. Previous studies[33] quote for 41.2% LHV (assumed net) and 1150 US$/kWe (assumed gross) a CoE of 4.4 US Cents/kWh. This difference in CoE is due to TIC, thermal efficiency and economic assumptions in fuel price, load factor and capital charges. Reference[34] for 46% LHV (assumed net) and 1020 US$/kWe (assumed gross) gives 3.7 US Cents/kWh based on the same economic parameters based as this study.
The CoE associated with the ASC PF with CO2 capture plant is calculated at 7.28 USc/kWh assuming no CO2 credits. Therefore the penalty in CoE associated with CO2 capture is 2.3 US Cents/kWh.
The cost of avoidance of CO2 emission is calculated at 36 US$/t CO2 (30 Euros/t CO2). Under the recently introduced (2005) EU Emissions Trading Scheme Directive (EU ETS), utilities would need to sell their CO2 emission quota at a price higher than that associated with capture. However, until such time as emission trading is fully established and penalties enforced, there can be no true market price placed on avoided CO2 emissions.
Therefore, the only accurate comparison that can be currently undertaken is the difference in cost per kWh sold which results between equivalent technologies with and without CO2 capture.
As shown in Table 23 fuel cost is seen to influence the penalty in CoE associated with CO2 capture from 2.3 US Cents/kWh to 2.0 US Cents/kWh. However, the discount rate from 10% to 5% resulted in the lowest penalty in CoE associated with CO2 capture at 1.7 US Cents/kWh. This discount rate 5% reduction was also more significant in influencing the CoE associated with CO2 capture than the effect of a 20 % reduction in Total Investment Cost.
5.2 NGCC Oxy-Combustion Power Plant with CO2 Capture
In order to evaluate the economics of the NGCC oxy-combustion power plant with CO2 capture, Investment costs and O&M costs were generated for:

Report No: E/04/031 Issue No.: 1 Confidential
3rd June 2005 Page 82 of 98 © Mitsui Babcock 2005
• Case 3: 400MWe gross NGCC conventional air-fired power plant without CO2
capture; and
• Case 4: 575MWe gross NGCC oxy-combustion power plant with CO2 capture.
The costs for the latter were based on the costs of a mature product with the development costs included in the final figure.
Investment Costs
Tables 24 and 25 illustrate the installed capital costs associated with Case 3 and Case 4 respectively (Note: The estimated accuracy of figures quoted is ±25%).
For each of the cases the following major power plant units have been identified and the costs associated with the respective unit expressed.
• Case 3: 400MWe MWe Gross Typical NGCC Air Fired Power Plant Without CO2 Capture
Unit 1000 NGCC Power Plant
• Case 4: 575 MWe Gross NGCC Oxy-Combustion Power Plant With CO2 Capture
Unit 1000 NGCC Power Plant Unit 2000 ASU
Unit 5000 CO2 Purification & Compression
The outline equipment list for each of the above cases is given in Tables 26 and 27.
The direct field costs (DFC)[1] are defined as:
• Direct Materials: Including equipment and bulk materials.
• Construction: Including mechanical erection, instrument and electrical installation, civil works and where applicable buildings and site preparation.
• Other costs Including temporary facilities, solvents, catalysts, chemicals, training, commissioning, start up costs and spare parts.
• EPC services including contractors home services and construction supervision and freight.
The indirect field costs (IFC) are:
• Contingency: 10% of the total installed costs
• Fees: 2% of the total installed costs

Report No: E/04/031 Issue No.: 1 Confidential
3rd June 2005 Page 83 of 98 © Mitsui Babcock 2005
• Owner Costs: 5% of the total installed costs
Note as discussed earlier, owner costs are inherently site specific. The IEA GHG economic criteria[27] for owners costs propose 5% for NGCC plant and this has been used in the economic analysis presented within this study. The 5% owners costs figure is viewed by Alstom Power as conservative and may in fact rise to some 13% depending on the site.
The summing of the above generates the Total Investment Cost (TIC) for each of the major power plant units. (i.e. TIC = DFC + IFC).
Table 28 shows the percentage contribution of each unit to the overall Total Investment Cost for Case 3 and Case 4.
The Total Investment Cost for Case 3 and Case 4 are expressed as a function of their gross and net power output to arrive at a the Specific Investment Cost associated with each plant; namely:
• Case 3: 452 Euro/kWe Gross (542 US$/kWe Gross)*
466 Euro/kWe Net (559 US$/kWe Net)*
• Case 4: 954 Euro/kWe Gross (1144 US$/kWe Gross)*
1246 Euro/kWe Net (1495 US$/kWe Net)*
*Note: the above figures are based on exchange rate of 1 Euro = 1.2 US$.
Operation and Maintenance Costs
The operating and maintenance cost figure is formed from a fixed cost and variable cost.
The variable cost element in the total operating and maintenance cost figure is derived from the consumables associated with each plant. The consumables associated with Case 3 and Case 4 are listed in Table 29 and are based on 7446 operating hours in a year (85% load factor following commissioning and start up compared to 90% specified by IEA GHG[27] ).
The fixed cost contribution to the total operating and maintenance cost figure for both plants are shown in Table 30. These costs are calculated using:
• Operator cost and supervision (50k US$/yr per operator)
• Administration and general overheads (30% of direct labour)
• Maintenance 4% of installed cost per year compared to 2% for NGCC[27]. (However, it is believed this percentage should be equal for both the NGCC plant and the ASC PF Plant case as the actual costs are reflected in the difference in installed costs.)

Report No: E/04/031 Issue No.: 1 Confidential
3rd June 2005 Page 84 of 98 © Mitsui Babcock 2005
Therefore the total operation and maintenance costs calculated for the capture plant are:
• Case 3: 65.2 M Euro per year (78.2 M US$ per year)
• Case 4: 98.7 M Euro per year (118.4 M US$ per year)
CO2 Abatement Costs for NGCC Plant
To generate the CoE and the Cost of CO2 avoidance associated with the NGCC base case and the NGCC CO2 capture case, the figures generated above were entered into IEA’s GHG standard economic spreadsheet version 01, February 2005.
The sensitivity of the model results to varying fuel cost (±100%), discount rate (10% and 5%) and Total Investment Cost (-20%) were then evaluated.
The results of the spreadsheet models are shown in:
Case 3: NGCC Power Plant without CO2 Capture
Table 31: Case 3: Typical NGCC Air Fired Power Plant Without CO2 Capture: 10% Discount Rate
Table 32: Case 3: Typical NGCC Air Fired Power Plant Without CO2 Capture: 10% Discount Rate & +100% Fuel Price
Table 33: Case 3: Typical NGCC Air Fired Power Plant Without CO2 Capture: 10% Discount Rate & -100% Fuel Price
Table 34: Case 3: Typical NGCC Air Fired Power Plant Without CO2 Capture: 5% Discount Rate
Table 35: Case 3: Typical NGCC Air Fired Power Plant Without CO2 Capture: 10% Discount Rate & -20% TIC
Case 4: NGCC Oxy-Combustion Power Plant with CO2 Capture
Table 36: Case 4: NGCC Oxy-Combustion Power Plant With CO2 Capture: 10% Discount Rate
Table 37: Case 4: NGCC Oxy-Combustion Power Plant With CO2 Capture: 10% Discount Rate & +100% Fuel Price
Table 38: Case 4: NGCC Oxy-Combustion Power Plant With CO2 Capture: 10% Discount Rate & -100% Fuel Price
Table 39: Case 4: NGCC Oxy-Combustion Power Plant With CO2 Capture: 5% Discount Rate

Report No: E/04/031 Issue No.: 1 Confidential
3rd June 2005 Page 85 of 98 © Mitsui Babcock 2005
Table 40: Case 4: NGCC Oxy-Combustion Power Plant With CO2 Capture: 10% Discount Rate & -20% TIC
The Effect on Cost of Electricity Resulting from CO2 Capture on NGCC Plant
The results of the above simulations and sensitivities are summarised in Table 41.
The reference case for the typical NGCC Air Fired Power Plant Without CO2 Capture resulted in a calculated CoE of 3.35 US Cents/kWh.
The CoE associated with the NGCC Oxy-Combustion Power Plant With CO2 Capture is calculated at 6.13 US Cents/kWh assuming no CO2 credits. Therefore the penalty in CoE associated with CO2 capture is 2.8 US Cents/kWh.
The cost of avoidance of CO2 emission is calculated at 78 US$/t CO2 (65 Euros/t CO2).
A fuel cost variation of -100% is seen to influence the penalty in CoE associated with CO2 capture reducing from 2.8 US Cents/kWh to 2.3 US Cents/kWh. However, the discount rate from 10% to 5% resulted in the lowest CoE associated with CO2 capture at 2.2 US Cents/kWh. This discount rate 5% reduction was also more significant in influencing the CoE associated with CO2 capture than the effect of a 20 % reduction in Total Investment Cost.
5.3 Summary of Economic Results for CO2 Capture
The penalty in the cost of electricity as a result of CO2 capture is slightly lower for an ASC PF plant (2.3 US Cents/kWh) than the NGCC plant (2.8 US Cents/kWh) assuming no CO2 tax credits and baseline economic parameters.
Figure 25 shows the cost of electricity as a function of the fuel price for both plants with and without CO2 capture.
The fuel price applied for the purposes of the study was 3.0 US $/GJ for natural gas and 1.5 US $/GJ for coal. Whilst the coal price has remained relatively stable, the present gas price is somewhat higher (current figures suggest 5.1 US $/GJ based on UK NBP gas price (Jan 2005) of 30 pence/therm [35]: exchange rate £ to US$ 1 to 1.8). The graph shows that a gas cost in excess of 5.5 US $/GJ would result in the cost of electricity generated from NGCC plant being greater than that of electricity generated via its ASC PF counterpart.
6. FUTURE DEVELOPMENTS
6.1 ASC PF Plant with CO2 Capture
For a realistic chance of success, the development of a purpose designed oxy-combustion PF boiler must follow a stepwise procedure from research through

Report No: E/04/031 Issue No.: 1 Confidential
3rd June 2005 Page 86 of 98 © Mitsui Babcock 2005
prototype development to large-scale demonstration. To offset the considerable decrease in efficiency, the plant design must take advantage of the continuous development of higher efficiency units[36] such as advanced supercritical pulverised coal technology that produces less CO2 per megawatt generated. (Figure 26)
Research programmes aimed at finding cost effective ways to recover CO2 from an oxygen fired fossil fuel combustion process are underway in Canada, USA, Australia and more recently in Europe (as part of the EC 6th Framework Programme ENCAP) as well as the UK DTI 4th Call Cleaner Coal Technology R&D Programme for retrofit options for Advanced Supercritical PF CO2 Capture Plant.
The oxy-combustion process concept lends itself for accommodating a staged approach to the implementation of CO2 capture into a new build power plant as ‘capture ready’ plant specifically designed for subsequent easy retrofit of suitable CO2 capture plant.
This novel integrated multi-pollutant control scheme could potentially have some economic advantages[37] when compared to a conventional air-fired PF plant and importantly provides a stepping stone to the full CO2 capture plant.
The financial advantages perceived from the oxy-combustion boiler are the elimination of the FGD, DeNOx and Hg plant due to the possibility of total removal of virtually all normal emission of SOx, NOx, HCl, Hg and dust from the compressed net product CO2. Furthermore the enhanced heat transfer from the CO2 rich combustion products of oxy-combustion allow the potential for a reduction in boiler’s heating surface area and thus reduced capital outlay of the boiler. However, these benefits have to be offset against the substantial outlay for an ASU and a CO2 treatment system.
As part of the development of the ASC oxy-combustion ‘capture ready’ plant, the key areas required to be addressed are: -
• The successful demonstration of full-scale burners under conditions of combustion in oxygen and recycle flue gas building on the results of previous pilot-scale test work[2, 29].
• Full appraisal of the slagging and fouling nature of the ash arising from the oxy-combustion process and their impact on boiler heating surface arrangement and choice of boiler materials.
• The impact of radiant and convective heat transfer [3] from the novel flue gas composition on boiler plant design.
• General issues associated with materials, corrosion, build-up of impurities, and requirements for plant start-up, shutdown, oxy-combustion boiler control systems, recycle flue gas purging and the effect of plant trips on the boiler system.

Report No: E/04/031 Issue No.: 1 Confidential
3rd June 2005 Page 87 of 98 © Mitsui Babcock 2005
• Further process optimisation, integration and automation to reduce cost, improve performance and increase energy efficiency.
An important milestone in realisation of the oxy-combustion technology for carbon Capture and Storage (CCS) is the European 30MWth Oxyfuel PF Pilot Plant[38] planned for operation in 2008. The pilot plant test programme would aim to address the key areas outlined above and provide the design basis for scale-up of the technology to European power generation scale of 600MWe.
In order to attribute sensible costs to an oxy-combustion process for comparison with other CO2 capture technologies the oxy-combustion boiler plant considered within this study is recognised as somewhat conservative in its design (the cost of a basic boiler typically accounts for around 25% of the cost of a new power plant).
Based essentially on current air fired plant technology, albeit applied to oxy-combustion, it is far from a radical, innovative purpose built oxy combustion boiler. It is however recognised that once ‘capture ready’ technology is established and accepted in the marketplace, more radical steps to refine the plant can be attempted and that such steps may considerably reduce cost and complexity. More radical areas of oxy-combustion boiler development for CO2 capture currently recognised are:
• Combustion process intensification: Oxy-combustion burners/slagging combustor designs aimed at combustion of PF in essentially pure O2 or in a mixture of O2 and alternative recycle flue gas rates. Potentially this could lead to significant reductions in the overall size of the boiler plant [39] resulting in significant savings in both capital and operating costs when compared to conventional power generation plant.
• Plant start up based purely on oxygen combustion, which would remove the need for initial air firing and shut down and the associated equipment and additional control systems this currently generates.
A further long term oxy-combustion possibility is high pressure oxy-combustion burners with direct water quench for high carbon content fuels, such as coals, bitumen or petroleum coke. Potentially, it may be possible to produce fully oxidised combustion products, with a steam content of typically 80-90% at pressures of, say, 250-500 bar, and temperatures of 600-1200°C. The combustion products would contain predominantly CO2 with fully oxidised impurities from the coal such as SO2, NOx, HCl. Advanced steam turbines based on gas turbine technology would be required for power generation. CO2 rich gas would be produced from the steam condenser at the back end of the plant. Theoretical efficiencies with CO2 capture of over 50% might be possible with such a system. Effective ash removal systems would need to be derived and significant efforts required with regards to fouling and corrosion prevention. High pressure direct oxidation systems with water quench have been demonstrated[40] for megawatt production of steam using both hydrogen and natural gas as fuel burning almost stoichiometrically with oxygen.

Report No: E/04/031 Issue No.: 1 Confidential
3rd June 2005 Page 88 of 98 © Mitsui Babcock 2005
6.2 NGCC Oxy-Combustion Plant with CO2 Capture
Principal development requirements include combustion and materials technology together with demonstration of system components into a validated power plant to demonstrate operability of system and components.
Near stoichiometric combustion with CO2 will require non-standard design to ensure that mixing of oxygen takes place properly and appropriate cooling and flow dilution takes place with CO2 distribution in the burner. Development testing will be required to validate design assumptions.
Materials test programs are currently in place to screen typical materials found in high temperature regions of the gas turbine and HRSG. Some experience has been gained in the nuclear power industry with different materials.
Turbomachinery is feasible using conventional design techniques but requires validation of aeromechanics, aero-cooling, lubrication and control systems. Blade aero-mechanics subject to forced vibration in higher density CO2 may require aspect ratio tuning to avoid flutter response in both compressor and turbine high aspect ratio blade rows. Turbine blade fracture mechanics may require special attention given the higher temperature gradient between gas and coolant described earlier. Special lubrication fluid may be required to avoid contamination and consequent degradation.
Compressor operability would need to be understood empirically since the stage matching requirements would change as a result of different gas properties.
This programme would be a major undertaking and constitute a novel engine development programme for which there is no precedent. Cost is therefore difficult to predict.
Further long-term advancements might include increased cycle pressure ratio with reheat, component efficiency and advanced blade cooling (utilising steam). These additions will add growth potential and increase both cycle efficiency and specific power. This should form the basis for further study in order to realise the full potential of the Gas-ZEP concept which may approach 50% combined cycle efficiency without change to ASU technology. Clearly the incentive exists for development of a non-cryogenic ASU in order to reduce the power associated with oxygen production.
6.3 Air Separation
Current knowledge of cryogenic oxygen plant design and components such as air compressors, drive motors and cold equipment fabrication leads to the conclusion that the large size oxygen plants required for the PF and NGCC oxy-combustion systems can be constructed now at capacities of currently up to about 7000 tonne/day. Cryogenic air separation is a mature technology and major improvements in either efficiency or capital cost cannot be expected in the future.

Report No: E/04/031 Issue No.: 1 Confidential
3rd June 2005 Page 89 of 98 © Mitsui Babcock 2005
HotHotCompressed Compressed
AirAir
OxygenOxygenProductProduct
O2-
e-
Figure 27: Mixed conducting Ion Transport Membrane
Figure 28 : Schematic of ITM Oxygen Planar Supported Membrane Device
Ion transport membranes (ITM or OTM) are being developed for production of oxygen using high temperature mixed oxide materials such as perovskites which will simultaneously conduct electrons and oxygen ions (see Figure 27) when there is a difference in the activity such as a difference in oxygen partial pressure across the material. The ITM system, as configured by Air Products, consists of flat square section hollow plates arranged sequentially on a hollow collector tube Figure 28 and mounted in a pressure vessel through which heated air from the gas turbine flows over the “fins”. Oxygen diffuses through the membrane surfaces due to a pressure gradient and pure oxygen is collected, cooled and compressed to delivery pressure.

Report No: E/04/031 Issue No.: 1 Confidential
3rd June 2005 Page 90 of 98 © Mitsui Babcock 2005
Figure 29: Basic Scheme for Integration of an ITM Oxygen Air Separation Unit into a Gas Turbine Power Cycle
The integration of the ITM with a gas turbine is shown with integration into a coal fired integrated gasification combined cycle (IGCC) system in Figure 29. The air from the compressor section of the gas turbine is heated to the required operating temperatures of the ITM (800°C to 900°C) and passed through the ITM tubes. The air flows between the fins, oxygen diffuses into the fins and then to the central collector tube. The ITM tubes are sealed into metallic collector headers which are manifolded together within the pressure vessel.
Allam et al [41] studied the oxyfuel conversion of boilers and heaters on a refinery site using an ITM Oxygen system to produce the oxygen. This showed that when integrated into the current steam system the ITM Oxygen system resulted in a cost of CO2 capture around half that of the traditional cryogenic ASU. These advantages would be most apparent in this study with the PF oxyfuel system since the gas turbine HRSG could be used for condensate and boiler feed water heating duties within the boiler steam cycle. With the NGCC oxyfuel system in this report the integration with the ITM Oxygen system would most likely be achieved by combining the HRSG duties of the NGCC gas turbine and the ITM Oxygen gas turbine.
The integration of the ITM with a gas turbine is shown with integration into a coal fired integrated gasification combined cycle (IGCC) system in Figure 30. Here the fuel for the gas turbine is provided using gasified coal.
One interesting feature of this type of integration arises when producing CO2-free power by burning hydrogen, by shifting the syngas produced in the gasifier, or a

Report No: E/04/031 Issue No.: 1 Confidential
3rd June 2005 Page 91 of 98 © Mitsui Babcock 2005
natural gas reformer, and then capturing the CO2 from this stream. In this case there is no separate N2 stream available for hydrogen dilution, but the hydrogen would be burnt in a nitrogen/oxygen stream from which part of the oxygen had been removed. The maximum oxygen product produced from a gas turbine will depend on the design of the combustor considering flammability limits and flame stability when burning pure hydrogen in O2 depleted air.
In order to take advantage of the potential cost reduction, both capital and operating, inherent in the use of ITM oxygen production systems, current systems analysis would suggest the integration of ITM with a gas turbine as shown Figure 30. This would imply conversion of part of the coal in a gasification system with shift conversion and CO2 removal to produce pure hydrogen as fuel for the gas turbine. Hydrogen can undergo stable combustion with a much lower oxygen concentration than natural gas which increases the oxygen recovery from a given size of gas turbine with a given maximum air flow.
It has been proposed to use the ITM principle in a fuel rich burner rather than an oxygen rich burner configuration. The equilibrium partial pressure on the combustion side in a reducing atmosphere would be so low that diffusion of oxygen could take place into a high pressure stream from air at atmospheric pressure. The power producing cycle would then involve expansion of the high pressure CO2-rich combustion gas with separation of excess fuel gas for recycle to the burner. Burners of this type may become available in the 2020 time frame[42].
6.4 CO2 Compression and Purification
CO2 compressors of the necessary single train size (50 to 100 MW) can be supplied now and constructed using proven components and design procedures. Drive systems using steam turbines, or two pole motors are commercially available.
The low temperature CO2 purification system, although never before built, is made up of proven equipment and is designed using known technology procedures and data.
The challenge in the design of the CO2 compression system is producing a mechanical design that can accommodate the supercritical properties of CO2 at the pressure required for CO2 capture processes.
The critical pressure of pure CO2 is around 75 bar. With impurities this pressure increases. Supercritical fluid in the dense phase will not be suitable for compression within a compressor and should be pumped. However, compression is required to reach this point. The compression system design needs to accommodate the change from gas, or gas-like properties, to dense fluid, incompressible liquid-like properties, with the change happening due to cooling in a condenser, rather than within the compression machinery. Also, the compression train should be designed for the highest possible efficiencies. The current design fulfils these objectives by using an adiabatic high pressure system which avoids gross changes in CO2 physical properties while recovering heat of compression for condensate and boiler feed water heating.

Report No: E/04/031 Issue No.: 1 Confidential
3rd June 2005 Page 92 of 98 © Mitsui Babcock 2005
CO2 compression trains for the pressures required by CO2 capture projects are relatively rare at the moment. Therefore, the compression equipment, wheel sizes, etc, are not best suited to this duty. Compressor manufacturers will, once the market for such compressors opens, optimise their offerings for CO2 compression and will have a better understanding of the transition from compression to pumping. Therefore, costs should reduce and efficiencies improve.
Where it is possible to use adiabatic compression, and use the low grade heat for condensate or boiler feedwater preheating, further developments in the compression equipment will be required to accommodate the higher compressor discharge temperatures.
All of these scenarios require large amounts of motive force to drive the compressors. If the process into which these compressors are integrated allows, steam turbines could be used to drive the compressor trains. At the moment the large steam turbines used in the power generation process are 10% or so higher in efficiency than the small turbines that would be needed to drive the CO2 compression train, negating the savings in motor and gear box losses by using steam turbine drives. However, should the efficiency of the smaller steam turbine drives increase then the CO2 compression train would be made simpler by the use of steam turbine drives.
7. CONCLUSIONS AND RECOMMENDATIONS
Plant Performance:
The study has shown that for an advanced supercritical PF plant designed to capture CO2 the penalty in terms of cycle efficiency loss is approximately 9 percentage points compared to a similar sized plant with no CO2 capture. (I.e. a plant net efficiency reduction of 44.3% to 35.4% LHV).
Careful consideration of integration of feed water heating with available heat from the flue gas and oxy-combustion plant components such as the air separation unit and CO2 compression unit has contributed significantly to reducing the cycle efficiency penalty of the advanced supercritical PF oxy-combustion plant with CO2 capture.
For the case of a NGCC plant with CO2 capture the penalty in terms of cycle efficiency loss is calculated at approximately 11 percentage points compared to a similar sized NGCC plant with no CO2 capture (i.e. a plant net efficiency reduction of 56.0% to 44.7%, LHV).
Economics
The cost associated with the advanced supercritical PF power plant with CO2 capture compared to the study reference case advanced supercritical plant without CO2
capture is equivalent to a cost delta of 2.3 US Cents/kWh.
Report No: E/04/031 Issue No.: 1 Confidential
3rd June 2005 Page 93 of 98 © Mitsui Babcock 2005
For the NGCC plant the cost associated with the capture plant compared to the cost of the plant without capture is equivalent to a cost delta of 2.8 US Cents/kWh.
These costs were based on coal price of 1.5 US$/GJ and a gas price of 3.0 US$/GJ with no allowance for CO2 credits.
Recommendations
Whilst illustrating the envisaged potential, it is recognised that oxy-combustion technology applied to both plant types requires further development in key areas in order introduce the technology successfully to the marketplace. The specific areas requiring refinement are identified as
Plant start up and control systems;
Burner and flame characterisation;
Materials issues
None of these development areas are likely to represent technical show-stoppers.
To offset the considerable efficiency penalties, it is recommended that ASC PF plant must take advantage of the continuous development of higher efficiency units that produce less CO2 per Megawatt generated.
Further radical improvements in oxygen production technology using high temperature ceramic membranes currently at an advanced state of development will lead to significant reduction in oxygen costs compared to the current cryogenic air separation systems.
The application and integration of ITM technology to NGCC and PF plant is recommended as a subject for further study.
Similarly, developments in air-fired gas turbine technology materials and blade cooling techniques need to be continually incorporated into the oxy-combustion gas turbine design.
A “stepwise” approach for the case of the ASC PF plant from research through prototype development, to large scale demonstration is suggested. A 30 MWth PF oxy-combustion pilot plant[38] is already planned for operation in 2008 and will represent an important milestone in technology development.
A recognised significant “stepping stone” to a fully operational CO2 capture plant is the “capture ready” plant. This novel integrated pollutant control scheme could potentially have economic advantages compared with conventional air fired PF plant and should be investigated on this basis. The attractiveness of a “capture ready” plant is that it may provide a pathway which addresses the technical issues associated with oxy-combustion and competes with existing PF clean coal

Report No: E/04/031 Issue No.: 1 Confidential
3rd June 2005 Page 94 of 98 © Mitsui Babcock 2005
technology systems in its own right, without committing vendors entirely to CO2 capture.
Radical areas of oxy-combustion boiler development recognised within this study are:
• Combustion process intensification (i.e. very little, if any, flue gas recycle).
• Start up based on oxygen combustion exclusively.
It is recommended that the feasibility of these options be explored accordingly.
8. ACKNOWLEDGEMENTS
Mitsui Babcock on behalf of all the project partners wishes to thank the International Energy Agency Greenhouse Gas R&D Programme for the funding of this study.

Report No: E/04/031 Issue No.: 1 Confidential
3rd June 2005 Page 95 of 98 © Mitsui Babcock 2005
9. REFERENCES
[1] IEA Greenhouse Gas R&D Programme. Potential for Improvements in Gasification Combined Cycle Power Generation with CO2 Capture, IEA Greenhouse Gas R&D Programme Report PH4/19, May 2003.
[1A] IEA Greenhouse Gas R&D Programme. Potential for improvement in Power Generation with Post-Combustion capture of CO2, IEA Greenhouse Gas Report PH/33, November 2004.
[2] Mitsui Babcock, Air Products plc, University of Ulster and University of Naples. Pulverised coal combustion system for CO2 capture, CEC Joule II Programme Contract No JOU2-CT92-0062.
[3] Wilkinson, M B, Boden, J C, Panesar, R S and Allam, R J. A study on the capture of carbon dioxide from a large refinery power station boiler by conversion to oxyfuel operation, International Conference on Greenhouse Gas Control Technologies, Cairns, Australia, 13-16 August 2000.
[4] Wilkinson, M B, Boden, J C, Panesar, R S and Allam, R J. CO2 capture via Oxyfuel Firing: optimisation of a retrofit design concept for a refinery power station, First National Conference on Carbon Sequestration, 15-17 May 2001, Washington DC.
[5] Wilkinson, M B, Simmonds M, Allam, R J and White, V. Oxyfuel conversion of heaters and boilers for CO2 capture, Second National Conference on Carbon Sequestration, 5-8 May 2003, Washington DC.
[5A] RR Pierce. Estimating Acid dewpoints in stack gases. Chemical Engineering 1977 April.
[6] Mathieu, P et al. Behaviour of Gas Turbine Cycles using CO2/H2O/Ar as the working fluid, International Symposium on CO2 Fixation and Efficient Utilization of Energy, Kyoto, Japan, 1994.
[7] Mathieu, P et al. The Use of CO2 Gas Turbines in Combined Cycle Plants, ECOS 95 Conference, Istanbul, Turkey, 1995.
[8] Mathieu, P. The use of CO2 Gas Turbines, Power-Gen Europe 94 Conference, Cologne, Germany, 1994.
[9] Mathieu, P. Zero Emission Power Generation : a dream or reality?, Newsletter published by the IEA Greenhouse Gas R&D Programme, 1st annual workshop on Zero Emission Power Plants, organized in Liège (Begium) Greenhouse Issue No. 30, 1997.
[10] Mathieu, P and Bolland, O. Comparison of two CO2 removal options in Combined Cycle Power Plants, FLOWERS '97, Florence (Italy), July 1997.
[11] Mathieu, P and Iantovski, E. Highly efficient zero emission CO2 based power plants, Energy Conversion and Management, 1997,Vol 38 ,suppl 1, pp S141-146.

Report No: E/04/031 Issue No.: 1 Confidential
3rd June 2005 Page 96 of 98 © Mitsui Babcock 2005
[12] Mathieu, P. Report on the 2nd annual workshop on Zero Emission Power Plants, organized in Liège (Begium)", Greenhouse Issue No. 34, 1998.
[13] Mathieu, P. Presentation of an innovative zero emission cycle for mitigation of the global climate change, Int Jl of Applied Thermodynamics, First issue, vol 1, pp 21-31, 1998.
[14] Mathieu, P and Nihart, R. Sensitivity analysis of the Matiant cycle, Energy Conversion and Management, Vol 40 (15-16 issues), pp 1687-1700, 1999.
[15] Mathieu, P. Zero Emission MATIANT cycle, Transactions of the ASME, Journal of Engineering for Gas Turbines and Power Plants, pp. 116-121, 1999.
[16] Mathieu, P. AMPERE Report, Belgian Ministry of Economic Affairs, 2000 (contribution on advanced coal and gas technologies and on nuclear power).
[17] Mathieu, P, Houyou, S, and Nihart, R. Techno-economic comparison of different options of very low CO2 emission technologies, 5th International Conference on GreenHouse Gas Control Technologies, Cairns (Australia) 2000.
[18] Mathieu, P and Mathieu, P P. Zero Emission Technologies- a key strategic option for climate change mitigation, Mathieu Greenhouse Issue No. 63, 2002.
[19] Mathieu, P. Towards a world based on near zero CO2 emission energy systems, International Conference on Clean Coal Technologies for our Future, Sardinia, 2002.
[20] Mathieu, P, Cycles leading to a full CO2 sequestration, Experts conference on "Cycle for low CO2 production", Cranfield University (UK), 2003.
[21] Mathieu, P. Zero Emission from coal, Energy choices for Europe, 2003, European Parliament, Brussels.
[22] Mathieu, P. Overview of CO2 capture technologies, CAN Europe (Climate Action Network, NGO) workshop on CO2 capture and storage and Hydrogen, Brussels, 23-24 Sept 2003.
[23] Mathieu, P. Mitigation of CO2 emission using low and near zero emission power plants; Int Jl on Energy for a Clean Environment, 2003, vol 4 also presented at the 6th International Conference on Technologies and Combustion for a Clean Environment, Porto (Portugal), 2001.
[24] Mathieu, P. Near zero emission power cycles : performance and costs, First Int Conf on Industrial Gas Turbines Technologies, Thematic Network CAME-GT, Brussels, 2003.
[25] Mathieu, P and Mathieu, P P. Economics of climate change mitigation using zero emission technologies, International Conference on Technologies and Combustion for a Clean Environment, Lisbon (Portugal), 2003.
[26] Bolland, O. Options for oxy-fuels & pre-combustion decarbonisation cycles, Presentation for Alstom Cross Segment CO2 Mitigation Group, October 11th

Report No: E/04/031 Issue No.: 1 Confidential
3rd June 2005 Page 97 of 98 © Mitsui Babcock 2005
2002 (http://www.tev.ntnu.no/Olav.Bolland/pdf/Alstom_Power_Oct_2002_Bolland.pdf).
[27] IEA Greenhouse Gas R&D Programme, Technical and Financial Assessment Criteria, Revision B May 2000.
[28] Panesar, R S (Mitsui Babcock), Wheeler, R J (Mitsui Babcock) and Allam, R J (Air Products plc). Oxyfuel Combustion Concept for BP Amoco, Mitsui Babcock Report No. E/99/059.
[29] Châtel-Pélage, F et al. A pilot-scale demonstration of oxy-combustion with flue gas recirculation in a pulverized coal-fired boiler, The 28th International Technical Conference on Coal Utilization & Fuel Systems, 10-13 March 2003, Clearwater, FL.
[30A] Schmidt, W P et al. Safe Design and Operation of a Cryogenic Air Separation Unit, AIChE 35th Annual Loss Prevention Symposium, April 2001, TX, USA.
[30B] CGA Publication P-9, Safe Practice Guide for Cryogenic Air Separation Plants.
[31] Foresight Link Award (FLA3) Project, Natural Gas Fired Zero Emission Plant (GAS-ZEP)- Revised Specification for GAS-ZEP Optimum Concept OXY1, Alstom Power Technology Centre Report No. U21625/009, July 2003.
[32] Supercritical Steam Cycles for Power Generation Applications, DTI Technology Status Report, TSR009, January 1999.
[33] IEA Working Party on Fossil Fuels. Solutions for the 21st Century: Zero Emission Technologies for Fossil Fuels, Technology Status Report, May 2002.
[34] IEA Working Party on Fossil Fuels. CO2 Capture and Storage, Technology Status Report, June 2000.
[35] UK NBP Gas Price, Power In Europe, Issue 442, 17 January 2005.
[36] Kjaer, S et al. The advanced supercritical 700oC pulverised coal-fired power plant, VGB Power Tech 7/2002.
[37] Marin, O et al. Economic analysis of oxygen-fired coal boilers, The 28th International Technical Conference on Coal Utilization & Fuel Systems, 10-13 March 2003, Clearwater, FL.
[38] Vattenfall commits to CCS Plant, Power In Europe, 23 May 2005.
[39] Thambimuthu, K. CANMET Energy Technology Centre - CETC’s Oxyfuel Combustion Project Brochure, January 2004.
[40] D’Aquino, R. Zero Emission Power Generation – Pure Rocket Science, Chemical Engineering Progress Magazine, August 2003.
[41] R J Allam, C J McDonald, V White, V E Stein, M Simmonds. Oxyfuel Conversion Of Refinery Process Equipment Utilising Flue Gas Recycle For CO2 Capture, Proceedings of the 7th International Conference on Greenhouse

Report No: E/04/031 Issue No.: 1 Confidential
3rd June 2005 Page 98 of 98 © Mitsui Babcock 2005
Gas Control Technologies. Volume 1: Peer-Reviewed Papers and Plenary Presentations, Vancouver, BC, September 5-9, 2004.
[42] Asen, I K et al. Process For Generating Power and/or Heat Comprising a Mixed Conducting Membrane Reactor, United States Patent, Patent No. US 6,237,339 B1, 29th May 2001.

Report No: E/04/031 Issue No.: 1 Confidential
3 June, 2005 Process Flow Diagrams © Mitsui Babcock 2005
PROCESS FLOW DIAGRAMS

Report No: E/04/031 Issue No.: 1 Confidential
3 June, 2005 Process Flow Diagram 1: Page 1 of 1 © Mitsui Babcock 2005
C78593 : IEA GHG Programme - Oxy-Combustion Processes for CO2 Capture from Power Plant>> PF Case 1 Block Diag DJD Iss 1.xls : DJD Issue 1 09.05.04 Updated Issue 1 09.05.04 <<
ASC PF Case 1 : 740 MWe Gross PF Power Plant : Block Flow Diagram
Unit 100Coal & Ash Handling
Unit 200Boiler Island
Unit 300FGD & Handling Plant
Unit 500Steam Turbine Island
Unit 400DeNOx Plant
Air
Coal
Flyash
Bottom Ash
FeedWater
HP Steam
IP Steam
Cold R/H
Flue Gas
Sea Water
Sea Water
Ammonia
Air
Limestone Water
Gypsum Effluent
Flue Gas
Flue Gas
Unit 800BOP, Electrical I&C
CASE 1 : AIR-FIRED ASC PF POWER PLANT PROCESS BLOCK FLOW DIAGRAM
PFD 1

Report No: E/04/031 Issue No.: 1 Confidential
3 June, 2005 Process Flow Diagram 2: Page 1 of 4 © Mitsui Babcock 2005
C78593 : IEA GHG Programme - Oxy-Combustion Processes for CO2 Capture from Power Plant>> PF Case 2 Block Diag DJD Iss 1.xls : DJD Issue 1 29.04.04 Updated Issue 1 29.04.04 <<
ASC PF Case 2 : 740 MWe Gross PF Power Plant with Oxy-Combustion for CO2 Capture: Block Flow Diagram
Unit 100Coal & Ash Handling
Flyash
Bottom Ash
Unit 200Boiler Island
Unit 700CO2 Compression + Inerts Removal
Unit 600Air Separation Unit
Unit 500Steam Turbine Island10
11
1
Condensate
O2
CoalFlue Gas after Sec Recycle
Primary Recycle
12
13
Condensate
Condensate Return
16
17
2726
Sea Water
BFW for Heating
BFW Return
CO2 Product
Condensate Return
Con
dens
ate
Ret
urn
BFW
for H
eatin
g
BFW
Ret
urn
19
BFW
to E
cono
mis
er
HP
Stea
m
21
Col
d R
ehea
t
22
Con
dens
ate
14
IP S
team
Air6
Inerts
42
25
Sea Water
28
InertsAir in Leakage
24
15
8
929
18 23
20
3
5
7
Unit 800BOP,Electrical I&C
CASE 2 : ASC PF POWER PLANT WITH CO2 CAPTURE : PROCESS FLOW BLOCK DIAGRAM
PFD 2

Report No: E/04/031 Issue No.: 1 Confidential
3 June, 2005 Process Flow Diagram 2: Page 2 of 4 © Mitsui Babcock 2005
CASE 2 : ASC PF POWER PLANT WITH CO2 CAPTURE : PROCESS FLOW BLOCK DIAGRAM STREAMS 1 - 10
PFD 2

Report No: E/04/031 Issue No.: 1 Confidential
3 June, 2005 Process Flow Diagram 2: Page 3 of 4 © Mitsui Babcock 2005
CASE 2 : ASC PF POWER PLANT WITH CO2 CAPTURE : PROCESS FLOW BLOCK DIAGRAM STREAMS 11 - 20
PFD 2

Report No: E/04/031 Issue No.: 1 Confidential
3 June, 2005 Process Flow Diagram 2: Page 4 of 4 © Mitsui Babcock 2005
CASE 2 : ASC PF POWER PLANT WITH CO2 CAPTURE : PROCESS FLOW BLOCK DIAGRAM STREAMS 21 - 29
PFD 2

Report No: E/04/031 Issue No.: 1 Confidential
3 June, 2005 Process Flow Diagram 3: Page 1 of 2 © Mitsui Babcock 2005
CASE 2 : ASC PF POWER PLANT WITH CO2 CAPTURE : ASU PROCESS FLOW DIAGRAM
PFD 3
LPGOX
Waste
Air 11
22 33
44
55
66
77 88
99
1010 1111
12121313
1414
1515
1616 1717
1818
1919
2020
2121
2222
2323
2424
2525
2626
2727
2828
2929
3030
3131
3232
3333
3434
E101
K101 K102K103
K104
C101 C102
C103
C104
C105
E102
E103
E104
C101 Dual Bed Absorber C102 Dual Bed Absorber C103 IP Column C104 HP Column C105 LP Column E101 Main Heat Exchanger E102 Subcooler E103 Reboiler E104 Condensor K101 Main Air Compressor K103 Centrifugal Compressor K104 Expansion Turbine

Report No: E/04/031 Issue No.: 1 Confidential
3 June, 2005 Process Flow Diagram 3: Page 2 of 2 © Mitsui Babcock 2005
STREAM No. 1 2 3 4 5 6 7 8 9 10 11 12 13Composition - (mol%)Nitrogen 77.308 77.308 77.763 78.120 78.120 78.120 78.120 78.120 77.763 77.763 77.763 77.763 77.763Argon 0.920 0.920 0.926 0.930 0.930 0.930 0.930 0.930 0.926 0.926 0.926 0.926 0.926Oxygen 20.732 20.732 20.854 20.950 20.950 20.950 20.950 20.950 20.854 20.854 20.854 20.854 20.854Water 1.000 1.000 0.417 0.000 0.000 0.000 0.000 0.000 0.417 0.417 0.417 0.417 0.417Carbon Dioxide 0.040 0.040 0.040 0.000 0.000 0.000 0.000 0.000 0.040 0.040 0.040 0.040 0.040Molecular Weight kg/kmol 28.86 28.86 28.92 28.96 28.96 28.96 28.96 28.96 28.92 28.92 28.92 28.92 28.92Flowrate kg/hr 962,422 962,422 958,904 188,577 188,577 290,223 290,223 290,223 478,563 478,563 478,563 478,563 478,563
Nm3/hr 747,095 747,095 742,721 145,862 145,862 224,485 224,485 224,485 370,672 370,672 370,672 370,672 370,672 Phase Vapour Vapour Vapour Vapour Vapour Vapour Vapour Vapour Vapour Vapour Vapour Vapour VapourPressure bar(a) 1.01 3.50 3.50 3.10 3.02 3.10 3.01 1.46 3.50 4.96 4.96 5.41 5.41Temperature °C 9.00 144.39 12.00 20.00 -178.54 20.00 -171.44 -188.16 12.00 46.19 20.00 28.92 20.00STREAM No. 14 15 16 17 18 19 20 21 22 23 24 25 26Composition - (mol%)Nitrogen 78.120 78.120 78.120 78.120 78.120 78.120 54.410 54.410 58.892 58.892 78.120 78.120 98.822Argon 0.930 0.930 0.930 0.930 0.930 0.930 1.554 1.554 1.527 1.527 0.930 0.930 0.287Oxygen 20.950 20.950 20.950 20.950 20.950 20.950 44.036 44.036 39.581 39.581 20.950 20.950 0.891Molecular Weight kg/kmol 28.96 28.96 28.96 28.96 28.960 28.96 29.954 29.954 29.773 29.773 28.960 28.960 28.084Flowrate kg/hr 240,378 240,378 44,788 195,590 236,650 236,650 110,843 110,843 152,635 152,635 145,882 145,882 133,723
Nm3/hr 185,930 185,930 34,643 151,287 183,046 183,046 82,890 82,890 114,836 114,836 112,839 112,839 106,659Phase Vapour Liquid Liquid Liquid Vapour Vapour Liquid Liquid Liquid Liquid Liquid Liquid LiquidPressure bar(a) 5.30 5.10 5.10 5.10 5.30 5.09 3.02 2.92 5.09 4.99 5.10 5.00 4.99Temperature °C 20.00 -176.75 -176.75 -176.75 20.00 -173.52 -180.78 -187.04 -174.64 -183.74 -176.75 -188.68 -179.06STREAM No. 27 28 29 30 31 32 33 34Composition - (mol%)Nitrogen 98.822 98.254 98.254 99.040 99.040 99.040 1.981 1.981Argon 0.287 0.400 0.400 0.352 0.352 0.352 3.033 3.033Oxygen 0.891 1.347 1.347 0.608 0.608 0.608 94.985 94.985Molecular Weight kg/kmol 28.08 28.12 28.12 28.08 28.08 28.08 32.16 32.16Flowrate kg/hr 133,723 122,522 122,522 727,040 727,040 727,040 228,788 228,788
Nm3/hr 106,659 97,615 97,615 579,970 579,970 579,970 159,354 159,354Phase Liquid Liquid Liquid Vapour Vapour Vapour Liquid VapourPressure bar(a) 4.89 2.92 2.82 1.36 1.31 1.20 1.72 1.60Temperature °C -190.52 -185.39 -190.43 -193.00 -178.53 15.54 -180.05 15.54
CASE 2 : ASC PF POWER PLANT WITH CO2 CAPTURE PLANT : ASU PROCESS FLOW DIAGRAM STREAMS 1 - 34 PFD 3

Report No: E/04/031 Issue No.: 1 Confidential
3 June, 2005 Process Flow Diagram 4: Page 1 of 1 © Mitsui Babcock 2005
LOX storage
LOX from ASU 1
LOX from ASU 2
Steam Vaporiser
Vent
High Pressure GOX backup
Backup GOX to PipelineCompressor to
charge GOX backup vessels
Steam
CASE 2 : ASC PF POWER PLANT WITH CO2 CAPTURE : OXYGEN BACK UP SYSTEM
PFD 4

Report No: E/04/031 Issue No.: 1 Confidential
3 June, 2005 Process Flow Diagram 5: Page 1 of 2 © Mitsui Babcock 2005
Seawater
Indirect Contact Cooler
Flue gas from PC plant
11
Venturi Scrubber
1518Direct Contact
Seawater Cooler
To Driers
Seawater
Seawater Return
22
Dried Flue gas to PC plant
Condensate
33
44 55
66
7788
99
1010
1111 1212
1313
1414
1616 1717
1919
2020
21212222
2424
BFW preheating
Condensate preheating
2323
Cooling Water
K204
K205C205C204
P201
E205
V201
E206
E207
E208
E209
CASE 2 : ASC PF POWER PLANT WITH CO2 CAPTURE : CO2 COOLING AND COMPRESSION TO 30 BAR (a)
PFD 5
C204 Indirect Contact Cooler C205 Direct Contact Cooler E205 Plate Frame Heat Exchanger E206 BFW Preheater E207 Condenaste Preheater E208 CO2 Cooler E209 CO2 Aftercooler K205 CO2 Compression to 15 bara K204 CO2 Compression to 30 bara V201 Venturi Scrubber

Report No: E/04/031 Issue No.: 1 Confidential
3 June, 2005 Process Flow Diagram 5: Page 2 of 2 © Mitsui Babcock 2005
CASE 2 : ASC PF POWER PLANT WITH CO2 CAPTURE : CO2 COOLING AND COMPRESSION TO 30 BAR (a) STREAMS 1 - 24
PFD 5
STREAM No. 1 2 3 4 5 6 7 8 9 10 11 12 Composition - (mol%) Carbon Dioxide 62.20 59.27 71.46 71.46 71.46 0.00 0.00 0.04 0.04 0.04 0.04 0.00 Oxygen 5.12 4.88 5.88 5.88 5.88 0.00 0.00 0.00 0.00 0.00 0.00 0.00 Argon 2.01 1.91 2.31 2.31 2.31 0.00 0.00 0.00 0.00 0.00 0.00 0.00 Nitrogen 12.48 11.89 14.34 14.34 14.34 0.00 0.00 0.00 0.00 0.00 0.00 0.00 Water 17.85 21.71 5.62 5.62 5.62 100.00 100.00 99.95 99.95 99.95 99.95 100.00 Sulphur Dioxide 0.30 0.29 0.35 0.35 0.35 0.00 0.00 0.01 0.01 0.01 0.01 0.00 NO 0.035 0.033 0.040 0.040 0.040 0.000 0.000 0.000 0.000 0.000 0.000 0.000 NO2 0.001 0.001 0.001 0.001 0.001 0.000 0.000 0.002 0.002 0.002 0.002 0.000 Molecular Weight kg/kmol 36.73 35.85 39.52 39.52 39.52 18.02 18.02 18.03 18.03 18.03 18.03 18.02 Flow kg/hr 1,251,499 1,281,820 1,171,841 557,562 614,279 9,407,225 9,407,225 79,657 3,670,468 30,321 3,640,147 1,303,688 Nm3/hr 763,192 800,867 664,217 316,035 348,183 11,697,021 11,697,021 98,975 4,560,598 37,675 4,522,923 1,621,016 Phase Vapour 2 Phase Vapour Vapour Vapour Liquid Liquid Liquid Liquid Liquid Liquid Liquid Pressure bar(a) 1.02 1.02 1.02 1.02 1.02 4.00 3.00 4.00 4.00 3.00 3.00 1.00 Temperature °C 110.95 61.09 35.00 35.00 35.00 12.00 19.00 35.02 35.02 17.00 17.00 12.00 STREAM No. 13 14 15 16 17 18 19 20 21 22 23 24 Composition - (mol%) Carbon Dioxide 0.06 74.34 74.34 74.34 74.34 75.54 75.54 75.54 0.00 0.00 0.00 0.00 Oxygen 0.00 6.14 6.14 6.14 6.14 6.24 6.24 6.24 0.00 0.00 0.00 0.00 Argon 0.00 2.41 2.41 2.41 2.41 2.45 2.45 2.45 0.00 0.00 0.00 0.00 Nitrogen 0.00 14.98 14.98 14.98 14.98 15.22 15.22 15.22 0.00 0.00 0.00 0.00 Water 99.93 1.77 1.77 1.77 1.77 0.18 0.18 0.18 100.00 100.00 100.00 100.00 Sulphur Dioxide 0.01 0.32 0.32 0.32 0.32 0.32 0.32 0.32 0.00 0.00 0.00 0.00 NO 0.000 0.042 0.042 0.042 0.042 0.042 0.042 0.042 0.000 0.000 0.000 0.000 NO2 0.000 0.000 0.000 0.000 0.000 0.000 0.000 0.000 0.000 0.000 0.000 0.000 Molecular Weight kg/kmol 18.04 40.38 40.38 40.38 40.38 40.74 40.74 40.74 18.02 18.02 18.02 18.02 Flow kg/hr 1,317,061 600,906 600,906 600,906 600,906 596,546 596,546 596,546 150,956 150,956 330,635 330,635 Nm3/hr 1,635,819 333,380 333,380 333,380 333,380 328,031 328,031 328,031 187,700 187,700 411,114 411,114 Phase Liquid Vapour Vapour Vapour 2 Phase Vapour Vapour Vapour Liquid Liquid Liquid Liquid Pressure bar(a) 1.01 1.01 15.00 15.00 15.00 15.00 30.00 30.00 338.53 338.53 6.00 6.00 Temperature °C 19.00 13.01 278.27 185.00 50.00 20.00 82.18 20.00 165.00 250.00 33.37 93.20

Report No: E/04/031 Issue No.: 1 Confidential
3 June, 2005 Process Flow Diagram 6: Page 1 of 2 © Mitsui Babcock 2005
CO2product
Flue Gas Expander
Flue Gas Vent
Warm Exchanger
Cold Exchanger
K201
32 4 5
6781011
12
13
141516
17
18
19
20
21
1K202
K203
E204
E201 E202
C202C203
C201
2nd Flue Gas HeaterE203
30 bar Raw CO2
9
8 2626
2525
2222
2323
24241st Flue GasHeaterE210
Condensate preheating
E211
1st Flue GasHeaterE210
9
CASE 2 : ASC PF POWER PLANT WITH CO2 CAPTURE : CO2 INERTS REMOVAL AND COMPRESSION TO 110 BAR (a)
PFD 6
C201 Dual Bed Dryer C202 Separator Pot C203 Separator Pot E201 Warm Heat Exhanger E202 Cold Heat Exchanger E203 2nd Flue Gas Heater E210 1st Flue Gas Heater E211 Condensate Preheater K201 Adiabatic Compressor K202 Compressor K203 Flue Gas Expander

Report No: E/04/031 Issue No.: 1 Confidential
3 June, 2005 Process Flow Diagram 6: Page 2 of 2 © Mitsui Babcock 2005
CASE 2 : ASC PF POWER PLANT WITH CO2 CAPTURE : CO2 INERTS REMOVAL AND COMPRESSION TO 110 BAR(a)
STREAMS 1 – 26 PFD 6
STREAM No. 1 2 3 4 5 6 7 8 9 10 11 12 13 Composition - (mol%) Carbon Dioxide 75.54 75.67 75.67 63.69 63.69 24.62 24.62 24.62 24.62 24.62 24.62 95.06 95.06 Oxygen 6.24 6.25 6.25 9.41 9.41 19.42 19.42 19.42 19.42 19.42 19.42 1.37 1.37 Argon 2.45 2.45 2.45 3.62 3.62 7.12 7.12 7.12 7.12 7.12 7.12 0.82 0.82 Nitrogen 15.22 15.25 15.25 23.14 23.14 48.72 48.72 48.72 48.72 48.72 48.72 2.59 2.59 Water 0.18 0.00 0.00 0.00 0.00 0.00 0.00 0.00 0.00 0.00 0.00 0.00 0.00 Sulphur Dioxide 0.32 0.32 0.32 0.07 0.07 0.00 0.00 0.00 0.00 0.00 0.00 0.13 0.13 NO 0.042 0.043 0.043 0.063 0.063 0.118 0.118 0.118 0.118 0.118 0.118 0.018 0.018 NO2 0.000 0.000 0.000 0.000 0.000 0.000 0.000 0.000 0.000 0.000 0.000 0.000 0.000 Molecular Weight kg/kmol 40.74 40.78 40.78 39.04 39.04 33.58 33.58 33.58 33.58 33.58 33.58 43.42 43.42 Flow kg/hr 596,546 596,069 596,069 362,868 362,868 138,989 138,989 138,989 138,989 138,989 138,989 223,879 223,879 Nm3/hr 328,031 327,438 327,438 208,218 208,218 92,720 92,720 92,720 92,720 92,720 92,720 115,498 115,498 Phase Vapour Vapour 2 Phase Vapour 2 Phase Vapour Vapour Vapour Vapour Vapour Vapour Liquid 2 Phase Pressure bar(a) 30.00 30.00 29.72 29.72 29.45 29.45 29.17 28.90 28.90 28.90 1.10 29.45 29.24 Temperature °C 20.00 20.00 -24.51 -24.51 -54.69 -54.69 -42.17 7.47 170.00 300.00 20.17 -54.69 -46.44 STREAM No. 14 15 16 17 18 19 20 21 22 23 24 25 26 Composition - (mol%) Carbon Dioxide 95.06 95.06 95.06 95.06 96.60 96.60 96.60 95.84 95.84 95.84 95.84 0.00 0.00 Oxygen 1.37 1.37 1.37 1.37 0.74 0.74 0.74 1.05 1.05 1.05 1.05 0.00 0.00 Argon 0.82 0.82 0.82 0.82 0.41 0.41 0.41 0.61 0.61 0.61 0.61 0.00 0.00 Nitrogen 2.59 2.59 2.59 2.59 1.48 1.48 1.48 2.03 2.03 2.03 2.03 0.00 0.00 Water 0.00 0.00 0.00 0.00 0.00 0.00 0.00 0.00 0.00 0.00 0.00 100.00 100.00 Sulphur Dioxide 0.13 0.13 0.13 0.13 0.75 0.75 0.75 0.45 0.45 0.45 0.45 0.00 0.00 NO 0.018 0.018 0.018 0.018 0.007 0.007 0.007 0.013 0.013 0.013 0.013 0.000 0.000 NO2 0.000 0.000 0.000 0.000 0.000 0.000 0.000 0.000 0.000 0.000 0.000 0.000 0.000 Molecular Weight kg/kmol 43.42 43.42 43.42 43.42 43.82 43.82 43.82 43.62 43.62 43.62 43.62 18.02 18.02 Flow kg/hr 223,879 223,879 223,879 223,879 233,201 233,201 233,201 457,080 457,080 457,080 457,080 378,478 378,478 Nm3/hr 115,498 115,498 115,498 115,498 119,220 119,220 119,220 234,718 234,718 234,718 234,718 470,602 470,602 Phase 2 Phase 2 Phase Vapour Vapour Liquid 2 Phase Vapour Vapour Vapour Vapour Liquid Liquid Liquid Pressure bar(a) 9.74 9.54 9.33 18.69 29.72 18.80 18.59 18.59 110.00 110.00 110.00 6.00 6.00 Temperature °C -55.69 -42.17 7.47 65.63 -24.51 -31.27 7.47 19.39 187.79 148.55 43.00 33.37 93.20

Report No: E/04/031 Issue No.: 1 Confidential
3 June, 2005 Process Flow Diagram 7: Page 1 of 1 © Mitsui Babcock 2005
CO2product
Flue Gas Expander
Flue Gas Vent
Warm Exchanger
Cold Exchanger
K201
32 4 5
6781011
12
13
141516
17
18
19
20
21
1K202
K203
E204
E201 E202
C202C203
C201
2nd Flue Gas HeaterE203
30 bar Raw CO2
9
8 2626
2525
2222
2323
24241st Flue GasHeaterE210
Condensate preheating
E211
1st Flue GasHeaterE210
9
Recycle Compressor
CASE 2 : ASC PF POWER PLANT WITH CO2 CAPTURE : CO2 COMPRESSION AND INERTS REMOVAL (98% v/v CO2 PURITY)
PFD 7
C201 Dual Bed Dryer C202 Separator Pot C203 Separator Pot E201 Warm Heat Exhanger E202 Cold Heat Exchanger E203 2nd Flue Gas Heater E210 1st Flue Gas Heater E211 Condensate Preheater K201 Adiabatic Compressor K202 Compressor K203 Flue Gas Expander

Report No: E/04/031 Issue No.: 1 Confidential
3 June, 2005 Process Flow Diagram 8: Page 1 of 1 © Mitsui Babcock 2005
CASE 3 : CONVENTIONAL NGCC POWER PLANT : PROCESS FLOW BLOCK DIAGRAM
PFD 8
GTCompressor
GTCombustor
GTTurbine
Flue Gas To stack
HRSG
SteamDeaerator
Fuel
SteamCondenser
SteamTurbine
UNIT 1000

Report No: E/04/031 Issue No.: 1 Confidential
3 June, 2005 Process Flow Diagram 9: Page 1 of 4 © Mitsui Babcock 2005
CASE 4 : NGCC OXY-COMBUSTION POWER PLANT WITH CO2 CAPTURE : PROCESS FLOW BLOCK DIAGRAM
PFD 9
ASU
GT Com pressor
GT Combustor
GT Turbine
Flue GasCondenser
HRSG
CO2 Purification&
CO2 Comprerssion
Steam Deaerator
FuelMixer
14
1
2
7 8
10
11
12
15
9
3 4 5
181920
21
22
23 24
17
13
Fuel CombustorGT Mixer ASU
TurbineGT GT
Compressor
HRSG
Steam Deaerator
Flue Gas Condenser
SplitterSplitter Steam
Condenser
SteamTurbine
6
16
UNIT 1000 UNIT 2000
UNIT 3000
UNIT 2000
CO2 Compressor
(30 Bara)
CO2 Compressor
(30 Bara)

Report No: E/04/031 Issue No.: 1 Confidential
3 June, 2005 Process Flow Diagram 9: Page 2 of 4 © Mitsui Babcock 2005
CASE 4 : NGCC OXY-COMBUSTION POWER PLANT WITH CO2 CAPTURE : PROCESS FLOW BLOCK DIAGRAM STREAMS 1 - 6
PFD 9
Gas Turbine Cold Flow

Report No: E/04/031 Issue No.: 1 Confidential
3 June, 2005 Process Flow Diagram 9: Page 3 of 4 © Mitsui Babcock 2005
CASE 4 : NGCC OXY-COMBUSTION POWER PLANT WITH CO2 CAPTURE : PROCESS FLOW BLOCK DIAGRAM STREAMS 7 - 16
PFD 9
Hot Gas Flow
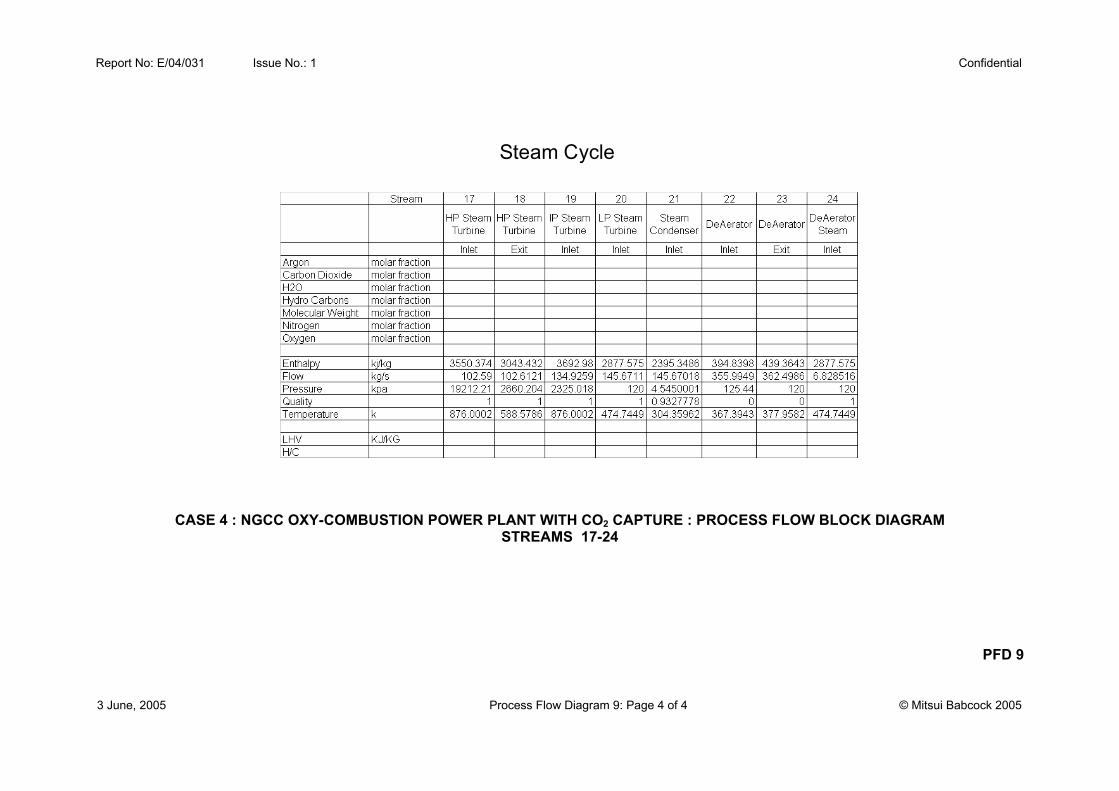
Report No: E/04/031 Issue No.: 1 Confidential
3 June, 2005 Process Flow Diagram 9: Page 4 of 4 © Mitsui Babcock 2005
CASE 4 : NGCC OXY-COMBUSTION POWER PLANT WITH CO2 CAPTURE : PROCESS FLOW BLOCK DIAGRAM STREAMS 17-24
PFD 9
Steam Cycle
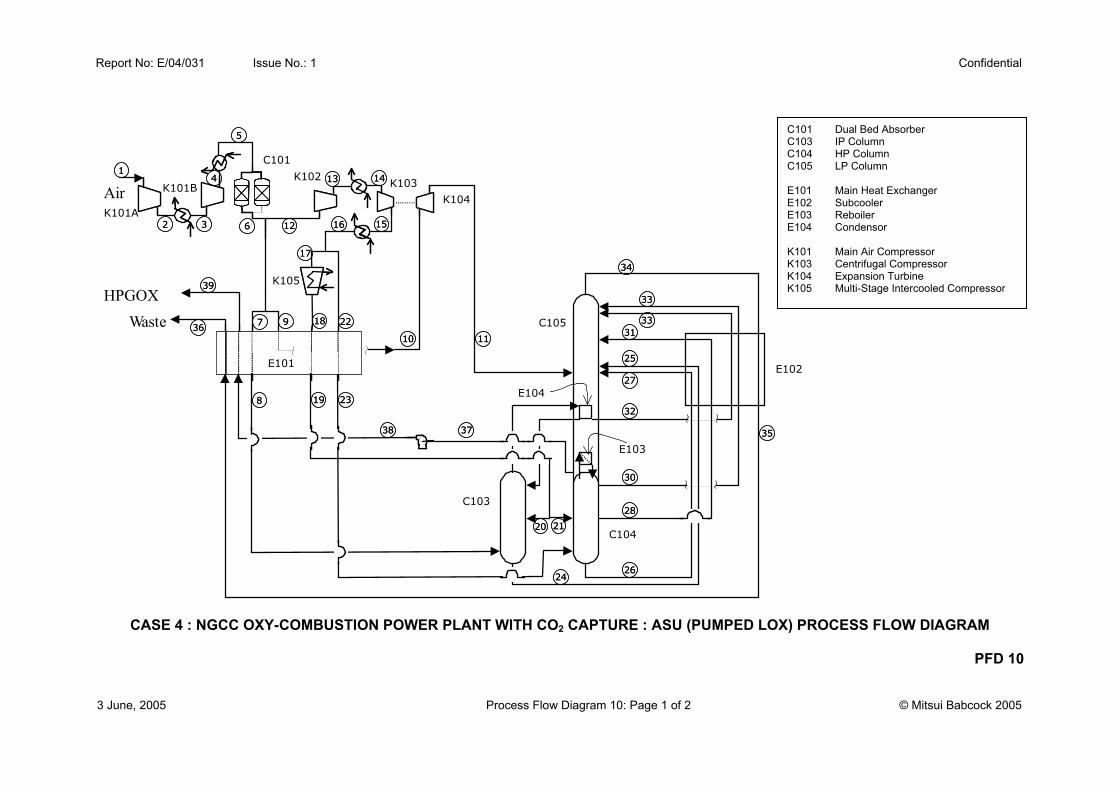
Report No: E/04/031 Issue No.: 1 Confidential
3 June, 2005 Process Flow Diagram 10: Page 1 of 2 © Mitsui Babcock 2005
HPGOX W aste
Air 1 1
22 6 6
7 7
8 8
9 9 1010
1313
1616
1414
18 18
19 19
2020 2121
2222
2323
2424
25 25
26 26
27 27
28 28
31 31
30 30
33 33
32 32
33 33
34 34
3535
3636
3737
3939
33
44
5 5
1111
12 12 1515
17 17
3838
E101
K101A
K102 K103
K104
C101
K105
C103
C104
C105
E102
E103
E104
K101B
CASE 4 : NGCC OXY-COMBUSTION POWER PLANT WITH CO2 CAPTURE : ASU (PUMPED LOX) PROCESS FLOW DIAGRAM
PFD 10
C101 Dual Bed Absorber C103 IP Column C104 HP Column C105 LP Column E101 Main Heat Exchanger E102 Subcooler E103 Reboiler E104 Condensor K101 Main Air Compressor K103 Centrifugal Compressor K104 Expansion Turbine K105 Multi-Stage Intercooled Compressor

Report No: E/04/031 Issue No.: 1 Confidential
3 June, 2005 Process Flow Diagram 10: Page 2 of 2 © Mitsui Babcock 2005
STREAM No. 1 2 3 4 5 6 7 8 9 10 11 12 13Composition - (mol%)Nitrogen 77.308 77.308 77.308 77.308 77.525 78.120 78.120 78.120 78.120 78.120 78.120 78.120 78.120Argon 0.920 0.920 0.920 0.920 0.923 0.930 0.930 0.930 0.930 0.930 0.930 0.930 0.930Oxygen 20.732 20.732 20.732 20.732 20.790 20.950 20.950 20.950 20.950 20.950 20.950 20.950 20.950Water 1.000 1.000 1.000 1.000 0.722 0.000 0.000 0.000 0.000 0.000 0.000 0.000 0.000Carbon Dioxide 0.040 0.040 0.040 0.040 0.040 0.000 0.000 0.000 0.000 0.000 0.000 0.000 0.000Molecular Weight kg/kmol 28.86 28.86 28.86 28.86 28.89 28.96 28.96 28.96 28.96 28.96 28.96 28.96 28.96Flowrate kg/hr 629,481 629,481 629,481 629,481 628,382 625,173 149,219 149,219 152,557 152,557 152,557 323,397 323,397
Nm3/hr 488,643 488,643 488,643 488,643 487,277 483,565 115,419 115,419 118,002 118,002 118,002 250,144 250,144 Phase Vapour Vapour Vapour Vapour Vapour Vapour Vapour Vapour Vapour Vapour 2 Phase Vapour VapourPressure bar(a) 1.01 1.84 1.84 3.36 3.36 3.36 3.36 3.24 3.36 3.27 2.31 3.36 5.19Temperature °C 9.00 67.98 20.00 81.34 20.00 20.00 20.00 -170.83 20.00 -175.41 -183.64 20.00 64.57STREAM No. 14 15 16 17 18 19 20 21 22 23 24 25 26Composition - (mol%)Nitrogen 78.120 78.120 78.120 78.120 78.120 78.120 78.120 78.120 78.120 78.120 53.871 53.871 64.134Argon 0.930 0.930 0.930 0.930 0.930 0.930 0.930 0.930 0.930 0.930 1.653 1.653 1.391Oxygen 20.950 20.950 20.950 20.950 20.950 20.950 20.950 20.950 20.950 20.950 44.476 44.476 34.475Molecular Weight kg/kmol 28.96 28.96 28.96 28.96 28.960 28.960 28.960 28.960 28.960 28.960 29.983 29.983 29.554Flowrate kg/hr 323,397 323,397 323,397 198,867 198,867 198,867 34,860 164,007 124,530 124,530 88,961 88,961 122,262
Nm3/hr 250,144 250,144 250,144 153,821 153,821 153,821 26,964 126,858 96,323 96,323 66,462 66,462 92,668Phase Vapour Vapour Vapour Vapour Vapour Liquid Liquid Liquid Vapour Vapour Liquid Liquid LiquidPressure bar(a) 5.19 5.36 5.26 5.26 90.00 89.80 89.80 89.80 5.26 5.14 3.24 3.14 5.14Temperature °C 20.00 23.26 20.00 20.00 20.00 -160.32 -160.32 -160.32 20.00 -173.38 -179.86 -183.78 -175.12STREAM No. 27 28 29 30 31 32 33 34 35 36 37 38 39Composition - (mol%)Nitrogen 64.134 78.120 78.120 98.420 98.420 99.347 99.347 99.266 99.266 99.266 1.922 1.922 1.922Argon 1.391 0.930 0.930 0.260 0.260 0.297 0.297 0.323 0.323 0.323 3.118 3.118 3.118Oxygen 34.475 20.950 20.950 1.320 1.320 0.355 0.355 0.411 0.411 0.411 94.960 94.960 94.960Molecular Weight kg/kmol 29.55 28.96 28.96 28.10 28.10 28.06 28.06 28.07 28.07 28.07 32.17 32.17 32.17Flowrate kg/hr 122,262 86,189 86,189 80,087 80,087 95,117 95,117 474,316 474,316 474,316 150,857 150,857 150,857
Nm3/hr 92,668 66,666 66,666 63,847 63,847 75,921 75,921 378,521 378,521 378,521 105,044 105,044 105,044Phase Liquid Liquid Liquid Liquid Liquid Liquid Liquid Vapour Vapour Vapour Liquid Liquid VapourPressure bar(a) 5.04 89.80 89.70 5.04 4.94 3.14 3.04 1.38 1.33 1.20 1.48 41.24 41.00Temperature °C -183.95 -160.32 -185.32 -178.88 -190.04 -184.66 -188.84 -192.91 -174.82 16.18 -179.90 -176.92 16.18
CASE 4 : NGCC OXY-COMBUSTION POWER PLANT WITH CO2 CAPTURE : ASU (PUMPED LOX) PROCESS FLOW DIAGRAM STREAMS 1 - 39
PFD 10

Report No: E/04/031 Issue No.: 1 Confidential
3 June, 2005 Process Flow Diagram 11: Page 1 of 2 © Mitsui Babcock 2005
CO2 product
Flue Gas Expander
Flue Gas Vent
Flue Gas Heater
Warm Exchanger
Cold Exchanger
K201
32 4 5
678910
11
12
131415
16
17
18
19
20
21
1K202
K203
E204
E201 E202
C202C203
C201
E203
CASE 4 : NGCC OXY-COMBUSTION POWER PLANT WITH CO2 CAPTURE CO2 COMPRESSION AND INERTS REMOVAL PROCESS FLOW DIAGRAM
PFD 11
C201 Dual Bed Dryer C202 Flash Separator C203 Flash Separator E201 Warm Heat Exhanger E202 Cold Heat Exchanger E203 Flue Gas Heater K201 Adiabatic Compressor K202 Compressor K203 Flue Gas Expander

Report No: E/04/031 Issue No.: 1 Confidential
3 June, 2005 Process Flow Diagram 11: Page 2 of 2 © Mitsui Babcock 2005
CASE 4 : NGCC OXY-COMBUSTION POWER PLANT WITH CO2 CAPTURE CO2 COMPRESSION AND INERTS REMOVAL PROCESS FLOW DIAGRAM STREAMS 1 – 21
PFD 11
STREAM No. 1 2 3 4 5 6 7 8 9 10 11 Composition - (mol%) Carbon Dioxide 88.14 88.32 88.32 58.34 58.34 23.85 23.85 23.85 23.85 23.85 93.39 Oxygen 2.28 2.28 2.28 8.40 8.40 15.55 15.55 15.55 15.55 15.55 1.14 Argon 5.64 5.66 5.66 18.82 18.82 33.44 33.44 33.44 33.44 33.44 3.97 Nitrogen 3.74 3.75 3.75 14.44 14.44 27.16 27.16 27.16 27.16 27.16 1.51 Water 0.20 0.00 0.00 0.00 0.00 0.00 0.00 0.00 0.00 0.00 0.00 Molecular Weight kg/kmol 42.86 42.91 42.91 39.93 39.93 36.44 36.44 36.44 36.44 36.44 43.47 Flow kg/hr 201,505 201,338 201,338 39,082 39,082 17,976 17,976 17,976 17,976 17,976 21,106 Nm3/hr 105,320 105,113 105,113 21,926 21,926 11,051 11,051 11,051 11,051 11,051 10,875 Phase Vapour Vapour 2 Phase Vapour 2 Phase Vapour Vapour Vapour Vapour Vapour Liquid Pressure bar(a) 30.39 30.39 30.11 30.11 29.84 29.84 29.56 29.29 29.29 1.05 29.84 Temperature °C 31.00 31.00 -27.45 -27.45 -55.00 -55.00 -42.25 21.63 325.37 35.00 -55.00 STREAM No. 12 13 14 15 16 17 18 19 20 21 Composition - (mol%) Carbon Dioxide 93.39 93.39 93.39 93.39 93.39 96.22 96.22 96.22 95.89 95.89 Oxygen 1.14 1.14 1.14 1.14 1.14 0.67 0.67 0.67 0.72 0.72 Argon 3.97 3.97 3.97 3.97 3.97 2.19 2.19 2.19 2.39 2.39 Nitrogen 1.51 1.51 1.51 1.51 1.51 0.93 0.93 0.93 1.00 1.00 Water 0.00 0.00 0.00 0.00 0.00 0.00 0.00 0.00 0.00 0.00 Molecular Weight kg/kmol 43.47 43.47 43.47 43.47 43.47 43.69 43.69 43.69 43.67 43.67 Flow kg/hr 21,106 21,106 21,106 21,106 21,106 162,256 162,256 162,256 183,362 183,362 Nm3/hr 10,875 10,875 10,875 10,875 10,875 83,187 83,187 83,187 94,062 94,062 Phase 2 Phase 2 Phase 2 Phase Vapour Vapour Liquid 2 Phase Vapour Vapour Liquid Pressure bar(a) 29.63 10.08 9.87 9.66 21.64 30.11 21.74 21.54 21.54 110.00 Temperature °C -45.03 -56.35 -42.25 21.63 95.25 -27.45 -31.87 21.63 21.43 20.00

Report No: E/04/031 Issue No.: 1 Confidential
3 June, 2005 Process Flow Diagram 12: Page 1 of 1 © Mitsui Babcock 2005
CO2 product
Flue Gas Expander
Flue Gas Vent
Flue Gas Heater
Warm Exchanger
Cold Exchanger
K201
32 4 5
678910
11
12
131415
16
17
18
19
20
21
1K202
K203
E204
E201 E202
C202C203
C201
E203
Recycle Compressor
CASE 4 : NGCC OXY-COMBUSTION POWER PLANT WITH CO2 CAPTURE CO2 COMPRESSION AND INERTS REMOVAL PROCESS FLOW DIAGRAM - HIGH CO2 PURITY CASE (98% v/v)
PFD 12
C201 Dual Bed Dryer C202 Flash Separator C203 Flash Separator E201 Warm Heat Exhanger E202 Cold Heat Exchanger E203 Flue Gas Heater K201 Adiabatic Compressor K202 Compressor K203 Flue Gas Expander

Report No: E/04/031 Issue No.: 1 Confidential
3 June, 2005 Tables: Page 1 of 42 © Mitsui Babcock 2005
TABLES

Report No: E/04/031 Issue No.: 1 Confidential
3 June, 2005 Tables: Page 2 of 42 © Mitsui Babcock 2005
Option Secondary Flue Gas Recycle Primary Flue Gas Recycle Figure No.
ESP Temp
Cooled Cleaned Dried Reheated Cooled Cleaned Dried Reheated
A Cold Gas/gas heater prior to ESP
FWH after ESP
3
B Warm No Gas/gas heater prior to ESP
FWH after ESP
4
C1 Hot No No No Parallel gas / gas heater and FWH after ESP
5
C2 Hot No No No Series gas / gas heater and FWH after ESP
6
C3 Hot No No No FWH after ESP
Primary recycle water heated
7
FLUE GAS RECYCLE ARRANGEMENT OPTIONS FOR ASC PF OXY-COMBUSTION POWER PLANT WITH CO2 CAPTURE
TABLE 1

Report No: E/04/031 Issue No.: 1 Confidential
3 June, 2005 Tables: Page 3 of 42 © Mitsui Babcock 2005
Proximate analysis weight % Coal (dry, ash-free) 78.3 Ash 12.2 Moisture 9.5 Ultimate Analysis: DAF Carbon 82.5 Hydrogen 5.6 Oxygen 9.0 Nitrogen 1.8 Sulphur 1.1 Chlorine 0.03 Ash Analysis: SiO2 50.0 Al2O3 30.0 TiO2 2.0 Fe2O3 9.7 CaO 3.9 MgO 0.4 NA2O 0.1 K2O 0.1 P2O5 1.7 SO3 1.7 Gross CV 27.06 MJ/kg Net CV 25.87 MJ/kg Hardgrove index 45 Ash Fusion Point (reducing atmosphere) 1350 °C This coal specification is based on an open cut coal from Eastern Australia
COAL SPECIFICATION (BITUMINOUS)
TABLE 2

Report No: E/04/031 Issue No.: 1 Confidential
3 June, 2005 Tables: Page 4 of 42 © Mitsui Babcock 2005
ASC PF & NGCC POWER PLANTS AUXILIARY POWER CONSUMPTION WITH & WITHOUT CO2 CAPTURE
TABLE 3
Case CASE 1 CASE 2 CASE 3 CASE 4 Name ASC PF ASC PF CAP NGCC NGCC CAPALSTOM Turbine Heat Balance Ref
Fuel Input kg/s 59.19 58.09 14.77 20.32 Fuel NCV MJ/kg 25.86 25.86 46.90 48.452 Fuel Heat Input (Wf x NCV) MWt 1530.8 1502.2 692.9 984.5 GROSS OUTPUT MWe 740 737 400 575 Power plant auxiliaries MWe 8 12
FW Pumps, Condensate, CW Pumps MWe 35 35Draught Plant MWe 7 5Coal & Ash Handling, Mills & Feeders MWe 4 4ESP MWe 2 2Miscellaneous MWe 7 8
FGD MWe 7 0
DENOX MWe 0.3 0.0
Sub-total Power Plant MWe 62.5 53.7 8 12 ASU MWe 0 87 90
CO2 Compression & Inerts Removal MWe 0 65 28 Utility Sytems MWe 0 0 4 6 Sub-Total Capture Costs MWe 0 152 4 124 Total Losses MWe 63 205 12 135 Contingency (0% of subtotal) % 0 0 0 0 TOTAL LOSS MWe 63 205 12 135 NET OUTPUT MWe 677 532 388 440
62 54Gross Efficiency % LHV 48.3 49.1 57.7 58.4 Net Efficiency % LHV 44.3 35.4 56.0 44.7 Delta Net Efficiency (Base - CO2 Capture) 8.9 11.3

Report No: E/04/031 Issue No.: 1 Confidential
3 June, 2005 Tables: Page 5 of 42 © Mitsui Babcock 2005
Gas Air CO2 CO2 GT Pressure Ratio 20 20 30
Gamma 1.3965 1.299 1.299 Rgas kJ/kg/K 0.287 0.194 0.194 WRT/AP(0.5Mn) 30.19 35.50 35.50 Relative Inlet Flow 1.0 1.175 1.175 Enthalpy Rise kJ/kg 438.3 261.6 311.7 Comp. Exit Temp K 711 561 608 Stage No. (Nstg) 15 15 18 Rel. Stage Load 1.0 1.0 1 Rel. Shaft Speed 1.0 0.772 0.772
NGCC POWER PLANT EFFECT OF CO2 PRESSURE RATIO ON GT COMPRESSOR DESIGN
TABLE 4
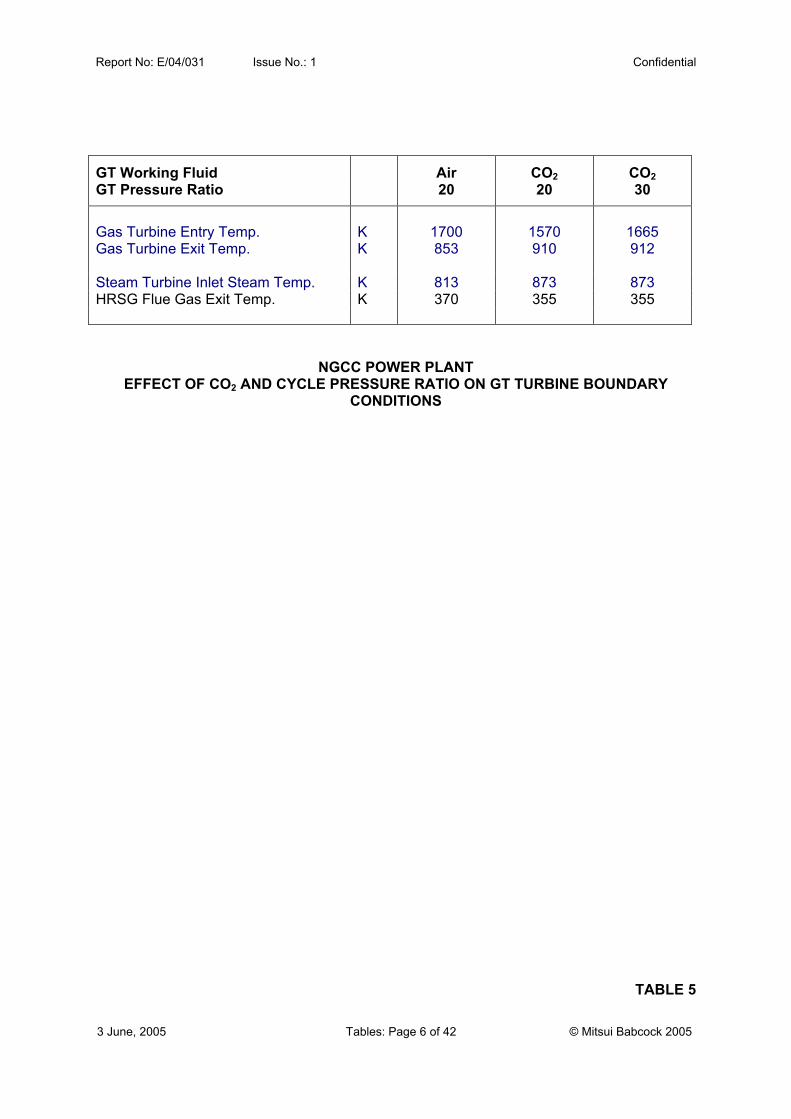
Report No: E/04/031 Issue No.: 1 Confidential
3 June, 2005 Tables: Page 6 of 42 © Mitsui Babcock 2005
GT Working Fluid Air CO2 CO2 GT Pressure Ratio 20 20 30
Gas Turbine Entry Temp. K 1700 1570 1665 Gas Turbine Exit Temp. K 853 910 912 Steam Turbine Inlet Steam Temp. K 813 873 873 HRSG Flue Gas Exit Temp. K 370 355 355
NGCC POWER PLANT EFFECT OF CO2 AND CYCLE PRESSURE RATIO ON GT TURBINE BOUNDARY
CONDITIONS
TABLE 5

Report No:E/04/031 Issue No.: 1 Confidential
3 June, 2005 Tables: Page 7 of 42 © Mitsui Babcock 2005
INSTALLED CAPITAL COSTS CASE 1: 740 MWe (Gross) ASC PF AIR-FIRED POWER PLANT WITHOUT CO2 CAPTURE TABLE 6

Report No:E/04/031 Issue No.: 1 Confidential
3 June, 2005 Tables: Page 8 of 42 © Mitsui Babcock 2005
INSTALLED CAPITAL COSTS CASE 2: 740 MWe (Gross) ASC PF OXY-COMBUSTION POWER PLANT WITH CO2 CAPTURE TABLE 7

Report No: E/04/031 Issue No.: 1 Confidential
3 June, 2005 Tables: Page 9 of 42 © Mitsui Babcock 2005
CASE 1: EQUIPMENT LIST
100 UNIT : COAL & ASH HANDLING
Coal delivery equipmentBunkersYard equipmentTransfer towersDust suppression equipment 400 UNIT : DENOx PLANTVentilation equipmentBelt feeders FluesMetal detection Reactor casingBelt weighing equipment Catalyst Miscellaneous equipment Ammonia injection equipmentBottom ash systems Handling equipmentFly ash systems Control system
500 UNIT : STEAM TURBINE 200 UNIT : BOILER ISLAND
HP, IP & LP TurbinesFurnace Associated PipeworkReheater Feedwater heatersSuperheater DeaeratorEconomiser CondenserRegenerative Airheaters LP PumpPiping HP PumpAir / Flue Gas Draught Plant Sea water Circulation PumpsStructures Water treatment plantFans: ID, FD and PA Sea water inlet /outlet worksPumpsCoal feeders 800 UNIT : BoP, ELECTRICAL, I&CSoot blowersDrains systems Balance of Power PlantDosing equipment ControlsMills Instruments Auxiliary boiler ElectricsMiscellaneous equipmentBurners BuildingsESP
300 UNIT : FGD PLANT & HANDLING
Priced as a turnkey package
CASE 1: ASC PF POWER PLANT WITHOUT CO2 CAPTURE OUTLINE EQUIPMENT LIST
TABLE 8

Report No: E/04/031 Issue No.: 1 Confidential
3 June, 2005 Tables: Page 10 of 42 © Mitsui Babcock 2005
CASE 2: EQUIPMENT LIST
100 UNIT : COAL & ASH HANDLING 500 UNIT : STEAM TURBINE
Coal delivery equipment HP, IP & LP TurbinesBunkers Associated PipeworkYard equipment Feedwater heatersTransfer towers DeaeratorDust suppression equipment CondenserVentilation equipment LP PumpBelt feeders HP PumpMetal detection Sea water Circulation PumpsBelt weighing equipment Water treatment plantMiscellaneous equipment Sea water inlet /outlet worksBottom ash systemsFly ash systems
600 UNIT : ASU
200 UNIT : BOILER ISLAND Main air compressorsAir purification system
Furnace main heat exchangerReheater ASU companderSuperheater ASU Column SystemEconomiser PumpsRegenerative Gas / Gas heaters Backup storage vesselPipingFlue gas recycle systemStructuresFans: ID, FD and PAPumpsCoal feeders 700 UNIT : INERTS REMOVAL & CO2
Soot blowersDrains systems Venturi scrubberDosing equipment Indirect contact coolerMills Direct contact seawater coolerAuxiliary boiler CompressorsMiscellaneous equipment Heat exchangersBurners Flue gas expanderESP
800 UNIT : BoP, ELECTRICAL, I&C
Balance of Power PlantControlsInstruments Electrics
Buildings
CASE 2: ASC PF POWER PLANT WITH CO2 CAPTURE
OUTLINE EQUIPMENT LIST TABLE 9
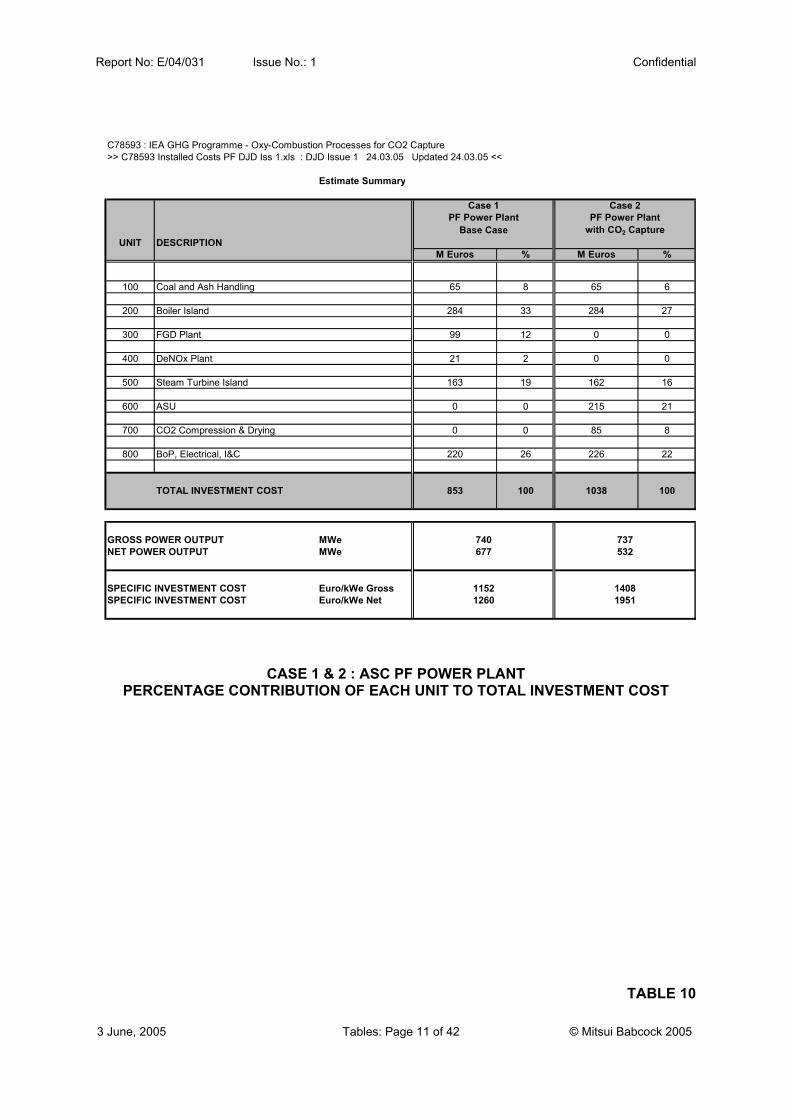
Report No: E/04/031 Issue No.: 1 Confidential
3 June, 2005 Tables: Page 11 of 42 © Mitsui Babcock 2005
C78593 : IEA GHG Programme - Oxy-Combustion Processes for CO2 Capture>> C78593 Installed Costs PF DJD Iss 1.xls : DJD Issue 1 24.03.05 Updated 24.03.05 <<
Estimate Summary
UNIT DESCRIPTIONM Euros % M Euros %
100 Coal and Ash Handling 65 8 65 6
200 Boiler Island 284 33 284 27
300 FGD Plant 99 12 0 0
400 DeNOx Plant 21 2 0 0
500 Steam Turbine Island 163 19 162 16
600 ASU 0 0 215 21
700 CO2 Compression & Drying 0 0 85 8
800 BoP, Electrical, I&C 220 26 226 22
TOTAL INVESTMENT COST 853 100 1038 100
GROSS POWER OUTPUT MWeNET POWER OUTPUT MWe
SPECIFIC INVESTMENT COST Euro/kWe GrossSPECIFIC INVESTMENT COST Euro/kWe Net
Case 2PF Power Plant
with CO2 Capture
Case 1PF Power Plant
Base Case
740 737677 532
11521260
14081951
CASE 1 & 2 : ASC PF POWER PLANT PERCENTAGE CONTRIBUTION OF EACH UNIT TO TOTAL INVESTMENT COST
TABLE 10

Report No: E/04/031 Issue No.: 1 Confidential
3 June, 2005 Tables: Page 12 of 42 © Mitsui Babcock 2005
C78593 : IEA GHG Programme - Oxy-Combustion Processes for CO2 Capture>> C78593 O&M Costs PF DJD Iss 1.xls : DJD Issue 1 07.04.05 Updated Issue 1 07.04.05 <<
Yearly Variable Costs : Case 1 and Case 2
Yearly Operating hours = 7446
Consumables Unit Cost Operating Costs Operating Costs€/t Hourly Yearly (yearly basis) Hourly Yearly (yearly basis)
kg/h t/y kg/h t/y
Fuel Fired (kg/s) 59.164 58.090FeedstockCoal (see notes 1, 2) 38.8 212,990 1,585,927 61,541,879 209,124 1,557,137 60,424,713
Auxiliary FeedstockFGD Make-up water 0.1 41,012 305,376 30,538 0 0 0
Solvents
DeNOx CatalystPlate-type Catalyst (3 years life) (see note 3) 2,960,000 0
ChemicalsLimestone (see note 4) 17.0 5,694 42,401 720,813 0 0 0Ammonia (see note 5) 330.8 374 2,788 922,201 0 0 0
Waste DisposalBottom Ash 0.0 6,496 48,371 0 6,378 47,493 0Fly Ash 0.0 19,489 145,112 0 19,135 142,478 0Gypsum 0.0 10,324 76,875 0 0 0 0FGD Chloride Purge 0.0 530 3,950 0 0 0 0
Miscellaneous (see note 6) 275,502 275,502
TOTAL YEARLY OPERATING COSTS 66,450,932 60,700,215
Notes1 - Exchange Rate assumed as $1= €1.02 - Based on $1.5/GJ and Fuel NCV = 25870 kJ/kg from IEA GHG Tech Spec IEA/CON/03/973 - Based on $300/ft3 from World Bank4 - Based on $15/ton from National Lime Association January 20035 - Based on $2.55/lb-mole nitrogen from EPRI6 - Based on €0.05/MWh
Case 1 Case 2
ConsumptionConsumption
Base Case 740 MWe PF Power Plant 740 MWe PF Power Plant
Oxy-Combustion & CO2 Capture
CASE 1 & 2 : ASC PF POWER PLANT - CONSUMABLES
TABLE 11

Report No: E/04/031 Issue No.: 1 Confidential
3 June, 2005 Tables: Page 13 of 42 © Mitsui Babcock 2005
C78593 : IEA GHG Programme - Oxy-Combustion Processes for CO2 Capture>> C78593 O&M Costs PF DJD Iss 1.xls : DJD Issue 1 07.04.05 Updated Issue 1 07.04.05 <<
Total O&M Costs : Case 3 and Case 4c
Case 1 Case 2POS DESCRIPTION 740 MWe 740 MWe
Base Case CO2 Capture€/year €/year
No. of Operators 112 136A1 Direct Labour (see note 1, 2) 5,600,000 6,800,000
A2 Administration / General Overheads (30% of A1) (see Note 3) 1,680,000 2,040,000
A3 Maintenance (4% of Installed costs (contingency excluded)) 25,840,000 32,600,000
A FIXED COSTS 33,120,000 41,440,000
B VARIABLE COSTS 66,451,000 60,700,000
99,571,000 102,140,000
Notes1 - Base Case : €7/kW per year and 8 FGD Operators from National Lime Association January 2003 assumed at €50,000 per year2 - CO2 Capture Case : €7/kW per year and 32 ASU+CO2 Plant Operators from Air Products assumed at €50,000 per year3 - Based on EPRI, Technical Assessment Guide for the Power Industry
TOTAL OPERATION AND MAINTENANCE COSTS
CASE 1 & 2: ASC PF POWER PLANT
TOTAL OPERATING AND MAINTENANCE COSTS
TABLE 12
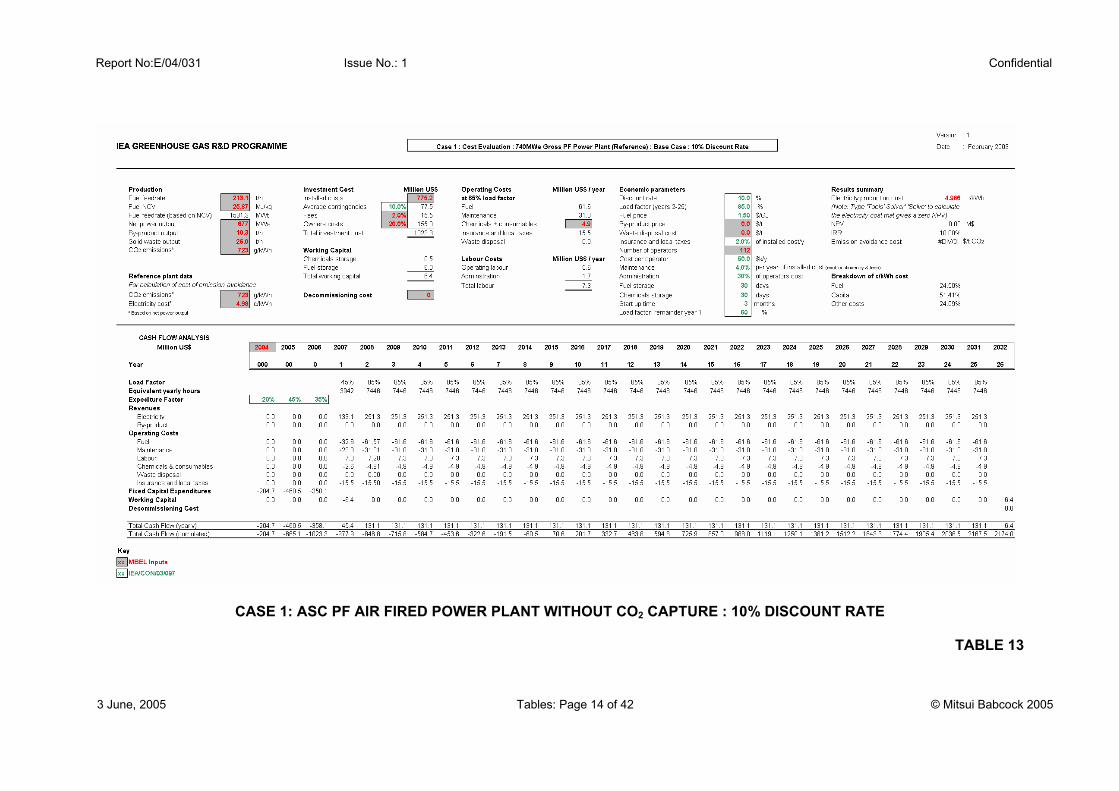
Report No:E/04/031 Issue No.: 1 Confidential
3 June, 2005 Tables: Page 14 of 42 © Mitsui Babcock 2005
CASE 1: ASC PF AIR FIRED POWER PLANT WITHOUT CO2 CAPTURE : 10% DISCOUNT RATE
TABLE 13

Report No:E/04/031 Issue No.: 1 Confidential
3 June, 2005 Tables: Page 15 of 42 © Mitsui Babcock 2005
CASE 1: ASC PF AIR FIRED POWER PLANT WITHOUT CO2 CAPTURE : 10% DISCOUNT RATE & +100% FUEL PRICE
TABLE 14
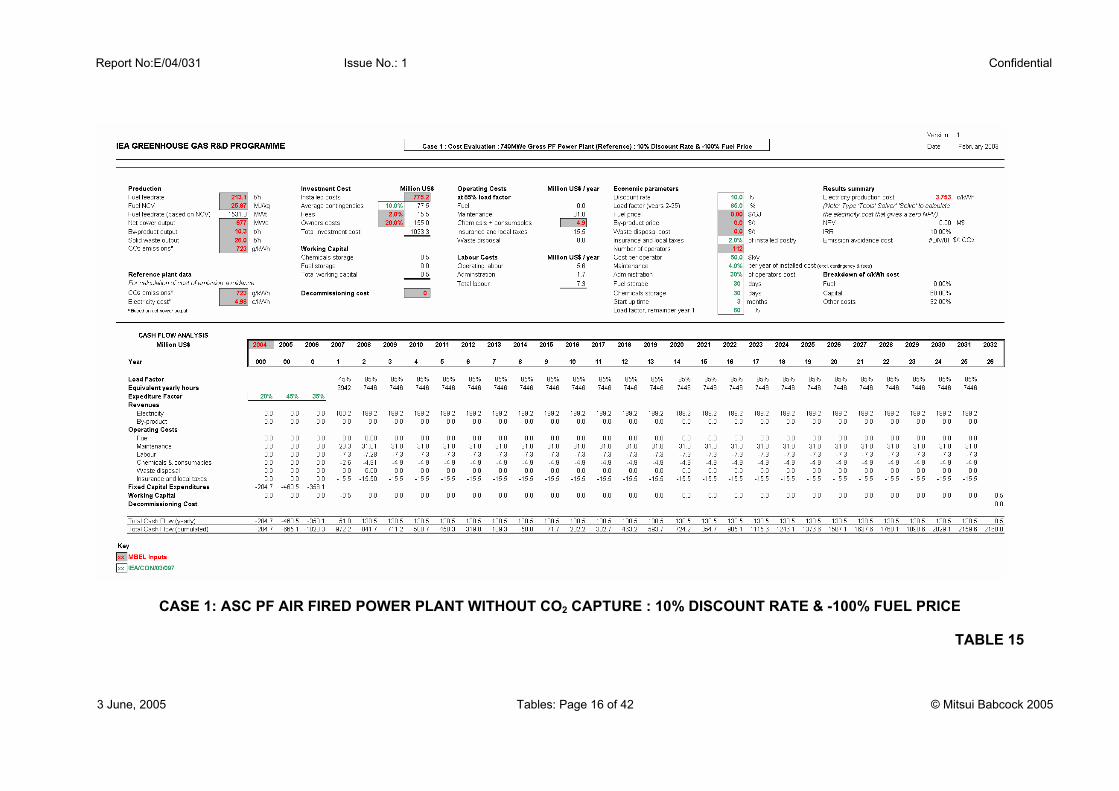
Report No:E/04/031 Issue No.: 1 Confidential
3 June, 2005 Tables: Page 16 of 42 © Mitsui Babcock 2005
CASE 1: ASC PF AIR FIRED POWER PLANT WITHOUT CO2 CAPTURE : 10% DISCOUNT RATE & -100% FUEL PRICE
TABLE 15

Report No:E/04/031 Issue No.: 1 Confidential
3 June, 2005 Tables: Page 17 of 42 © Mitsui Babcock 2005
CASE 1: ASC PF AIR FIRED POWER PLANT WITHOUT CO2 CAPTURE : 5% DISCOUNT RATE
TABLE 16
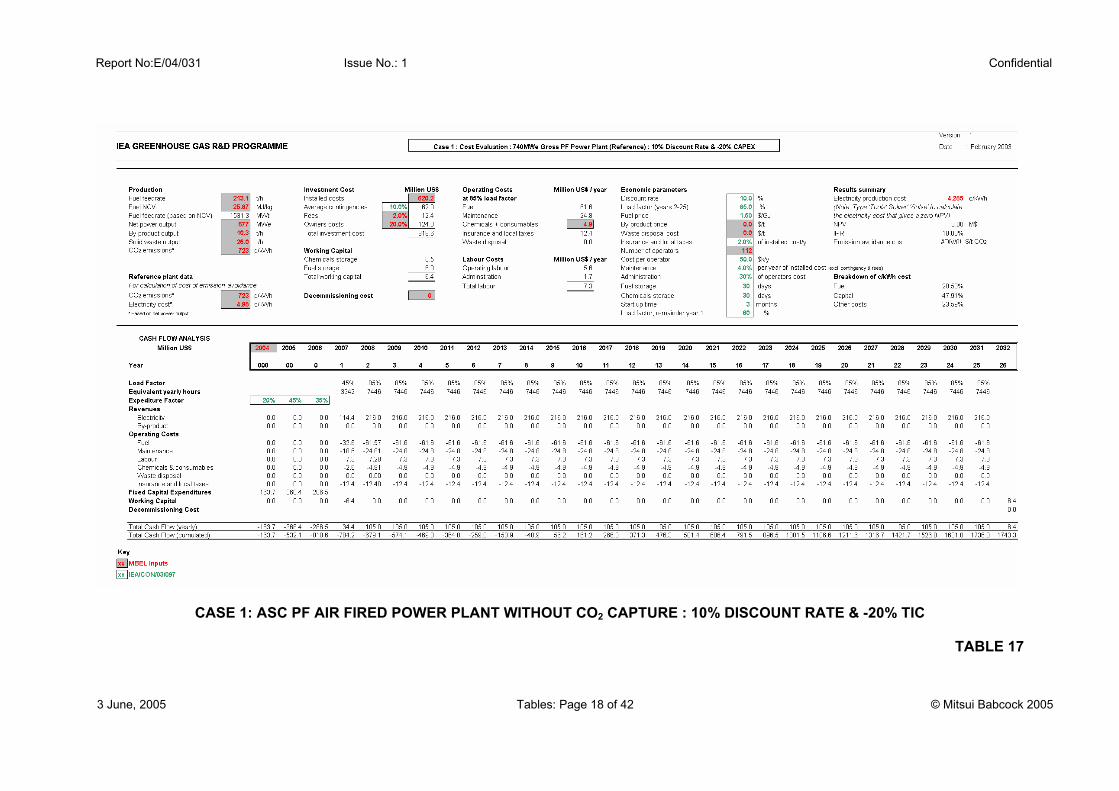
Report No:E/04/031 Issue No.: 1 Confidential
3 June, 2005 Tables: Page 18 of 42 © Mitsui Babcock 2005
CASE 1: ASC PF AIR FIRED POWER PLANT WITHOUT CO2 CAPTURE : 10% DISCOUNT RATE & -20% TIC
TABLE 17

Report No:E/04/031 Issue No.: 1 Confidential
3 June, 2005 Tables: Page 19 of 42 © Mitsui Babcock 2005
CASE 2: ASC PF OXY-COMBUSTION POWER PLANT WITH CO2 CAPTURE : 10% DISCOUNT RATE
TABLE 18

Report No:E/04/031 Issue No.: 1 Confidential
3 June, 2005 Tables: Page 20 of 42 © Mitsui Babcock 2005
CASE 2: ASC PF OXY-COMBUSTION POWER PLANT WITH CO2 CAPTURE : 10% DISCOUNT RATE & +100% FUEL PRICE
TABLE 19

Report No:E/04/031 Issue No.: 1 Confidential
3 June, 2005 Tables: Page 21 of 42 © Mitsui Babcock 2005
CASE 2: ASC PF OXY-COMBUSTION POWER PLANT WITH CO2 CAPTURE : 10% DISCOUNT RATE & -100% FUEL PRICE
TABLE 20

Report No:E/04/031 Issue No.: 1 Confidential
3 June, 2005 Tables: Page 22 of 42 © Mitsui Babcock 2005
CASE 2: ASC PF OXY-COMBUSTION POWER PLANT WITH CO2 CAPTURE:5% DISCOUNT RATE TABLE 21
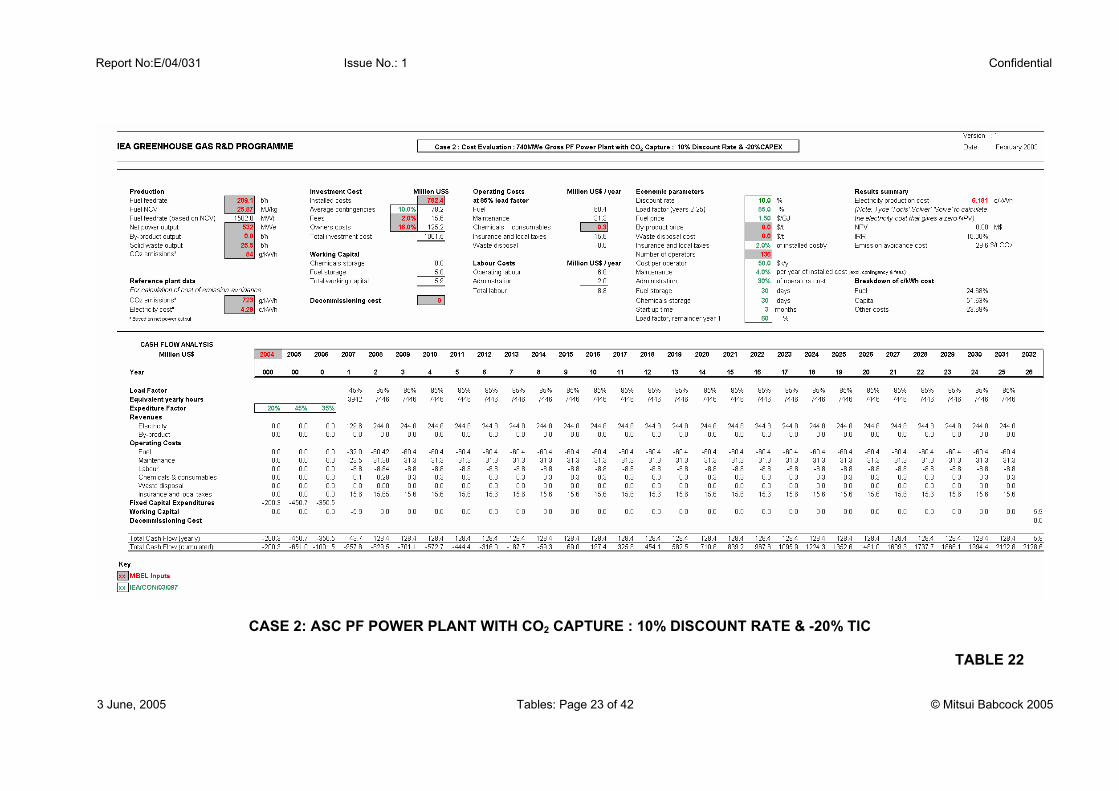
Report No:E/04/031 Issue No.: 1 Confidential
3 June, 2005 Tables: Page 23 of 42 © Mitsui Babcock 2005
CASE 2: ASC PF POWER PLANT WITH CO2 CAPTURE : 10% DISCOUNT RATE & -20% TIC
TABLE 22
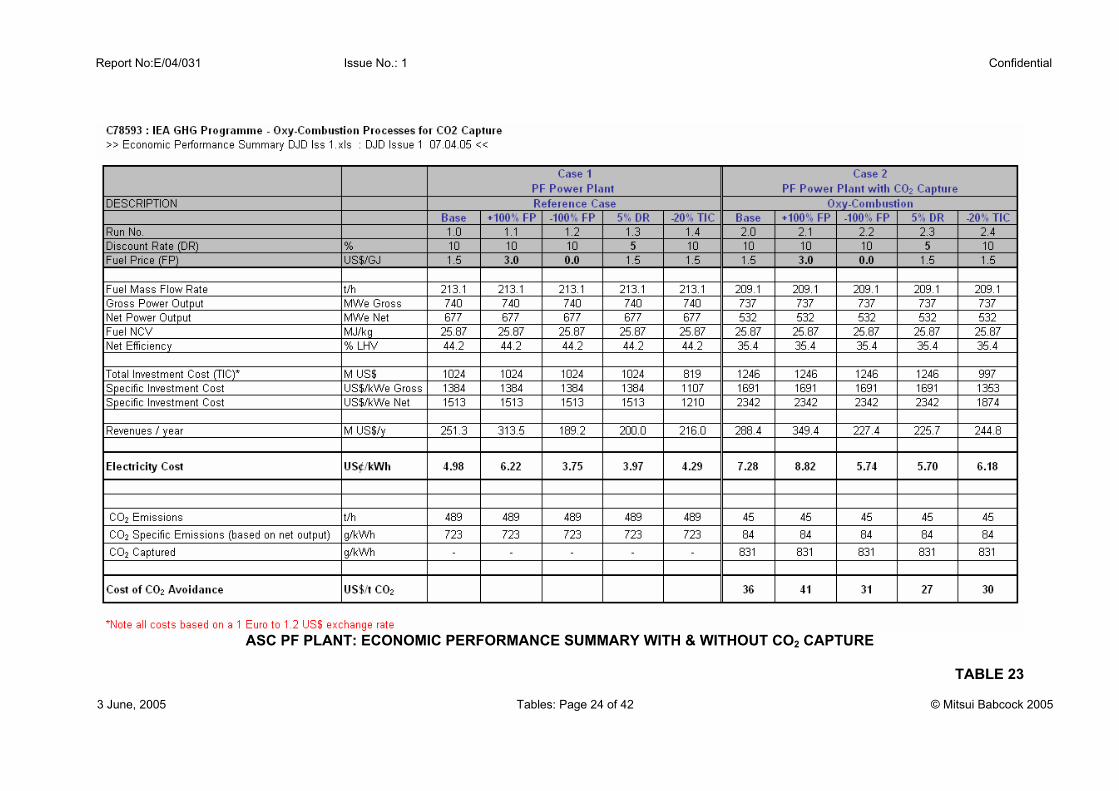
Report No:E/04/031 Issue No.: 1 Confidential
3 June, 2005 Tables: Page 24 of 42 © Mitsui Babcock 2005
ASC PF PLANT: ECONOMIC PERFORMANCE SUMMARY WITH & WITHOUT CO2 CAPTURE
TABLE 23

Report No: E/04/031 Issue No.: 1 Confidential
3 June, 2005 Tables: Page 25 of 42 © Mitsui Babcock 2005
C78593 : IEA GHG Programme - Oxy-Combustion Processes for CO2 Capture>> C78593 Installed Costs NGCC DJD Iss 1.xls : DJD Issue 1 24.03.05 Updated 24.03.05 <<
Case 3 : 400 MWe Gross NGCC Power Plant : Base Case
POS DESCRIPTION 1000 TOTAL REMARKS M Euros M Euros
1 DIRECT MATERIALS - 0 1) Estimate accuracy +/- 25%
2 CONSTRUCTION - 0
3 OTHER COSTS - 0 UNIT
4 EPC Services - 0 1000 NGCC Power Plant [1]
A Installed Costs (contingency excluded) 154 154
B Contingency % of A 10 10Euros 15 15
C Fees % of A 2 2Euros 3 3
D Owner Costs % of A 5 5Euros 8 8
TOTAL INVESTMENT COST 181 0 0 181
Definitions (according to IEA GHG Gasification Power Generation Study Report No. PH4/19, May 2003) ==>
1. Direct Materials, including equipment and bulk materials.2. Construction, including mechanical erection, instrument and electrical installation, civil works and, where applicable, buildings and site preparation.3. Other Costs, including temporary facilities, solvents, catalysts, chemicals, training, commissioning and start-up costs, spare parts etc.4. EPC Services including Contractor's home office services and construction supervision, freight
Notes 1. TIC Based on 542 US$/kWe Gross (ref: IEA Technology Status Report : Solutions for 21st Century, May 2002, p25)2. NGCC Plant based on : 1 x 9FA GT (250MWe) + 1 ST (150MWe) = 400MWe (Combined Cycle)
UNIT
INSTALLED CAPITAL COSTS CASE 3 : 400 MWe (Gross) NGCC AIR FIRED POWER PLANT WITHOUT CO2 CAPTURE
TABLE 24

Report No: E/04/031 Issue No.: 1 Confidential
3 June, 2005 Tables: Page 26 of 42 © Mitsui Babcock 2005
C78593 : IEA GHG Programme - Oxy-Combustion Processes for CO2 Capture>> C78593 Installed Costs NGCC DJD Iss 1.xls : DJD Issue 1 24.03.05 Updated 24.03.05 <<
Case 4 : 575 MWe Gross NGCC Power Plant with CO2 Capture
POS DESCRIPTION 1000 2000 3000 TOTAL REMARKSM Euros M Euros M Euros M Euros
AlstomAir
ProductsAir
Products1 DIRECT MATERIALS 172 73 13 258 1) Estimate accuracy +/- 25%
2 CONSTRUCTION 78 32 7 117
3 OTHER COSTS 17 4 2 23 UNIT
4 EPC Services 52 13 5 70 1000 NGCC Power Plant 2000 ASU
A Installed Costs (contingency excluded) 318 123 28 469 3000 CO2 Purification & Compression
B Contingency % of A 10 10 10 10Euros 32 12 3 47
C Fees % of A 2 2 2 2Euros 6 2 1 9
D Owner Costs % of A 5 5 5 5Euros 16 6 1 23
TOTAL INVESTMENT COST 373 144 32 548 548
Definitions (according to IEA GHG Gasification Power Generation Study Report No. PH4/19, May 2003) ==>
1. Direct Materials, including equipment and bulk materials.2. Construction, including mechanical erection, instrument and electrical installation, civil works and, where applicable, buildings and site preparation.3. Other Costs, including temporary facilities, solvents, catalysts, chemicals, training, commissioning and start-up costs, spare parts etc.4. EPC Services including Contractor's home office services and construction supervision, freight
Notes1. Unit 1000 derived from Alstom Power email dated 25.05.04 for total plant costs, contingency of 10% separated.2. Units 2000 & Unit 3000 costs as per Air Products email dated 21.05.04, contingency of 10% separated.
UNIT
INSTALLED CAPITAL COSTS CASE 4: 575 MWe (Gross) NGCC OXY-COMBUSTION POWER PLANT WITH CO2
CAPTURE
TABLE 25

Report No: E/04/031 Issue No.: 1 Confidential
3 June, 2005 Tables: Page 27 of 42 © Mitsui Babcock 2005
CASE 3: EQUIPMENT LIST
1000 UNIT : NGCC Power Plant
Gas Turbine power generatorsSteam Turbine power generatorsTriple pressure HRSG with reheatCondensorFeed water pumpsCondensate pumpsDeaeratorBlowdown & Drains vesselControlsInstruments ElectricsWater treatment plantFlue StackFlue gas ductwork
CASE 3: CONVENTIONAL NGCC POWER PLANT WITHOUT CO2 CAPTURE OUTLINE EQUIPMENT LIST
TABLE 26
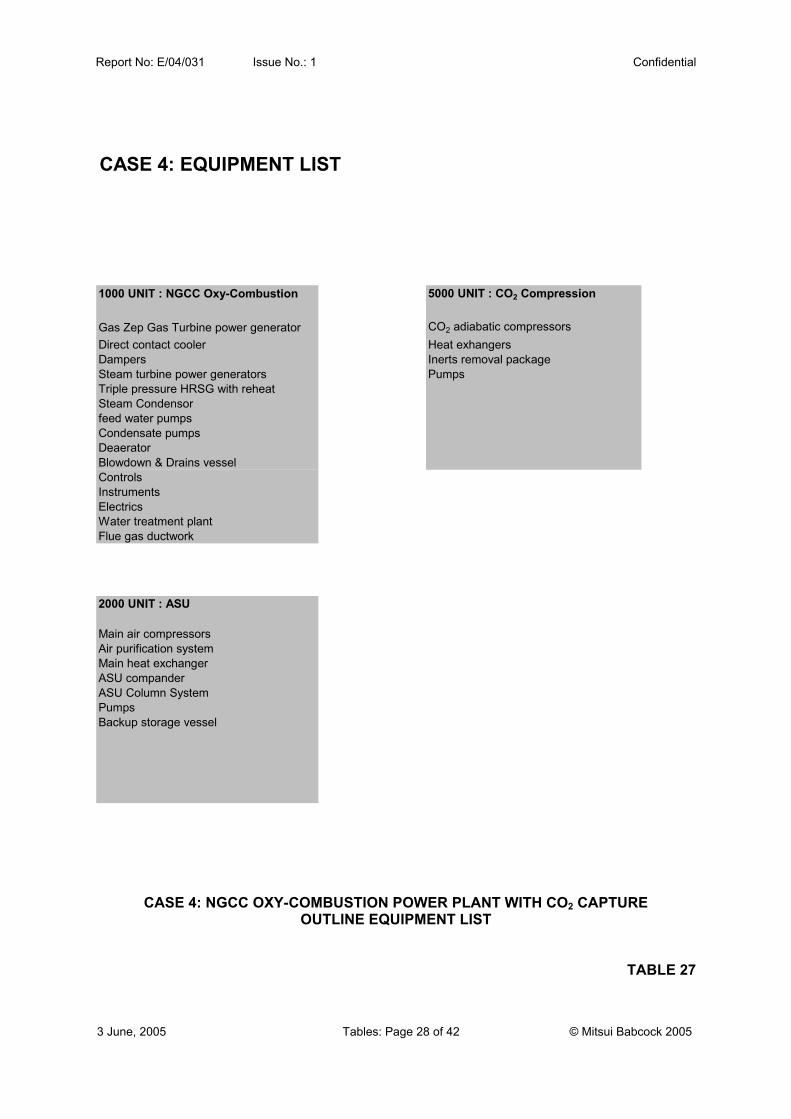
Report No: E/04/031 Issue No.: 1 Confidential
3 June, 2005 Tables: Page 28 of 42 © Mitsui Babcock 2005
CASE 4: EQUIPMENT LIST
1000 UNIT : NGCC Oxy-Combustion 5000 UNIT : CO2 Compression
Gas Zep Gas Turbine power generator CO2 adiabatic compressorsDirect contact cooler Heat exhangersDampers Inerts removal packageSteam turbine power generators PumpsTriple pressure HRSG with reheatSteam Condensorfeed water pumpsCondensate pumpsDeaeratorBlowdown & Drains vesselControlsInstruments ElectricsWater treatment plantFlue gas ductwork
2000 UNIT : ASU
Main air compressorsAir purification systemMain heat exchangerASU companderASU Column SystemPumpsBackup storage vessel
CASE 4: NGCC OXY-COMBUSTION POWER PLANT WITH CO2 CAPTURE OUTLINE EQUIPMENT LIST
TABLE 27

Report No: E/04/031 Issue No.: 1 Confidential
3 June, 2005 Tables: Page 29 of 42 © Mitsui Babcock 2005
CASE 3 & 4 : NGCC POWER PLANT PERCENTAGE CONTRIBUTION OF EACH UNIT TO TOTAL INVESTMENT COST
TABLE 28

Report No: E/04/031 Issue No.: 1 Confidential
3 June, 2005 Tables: Page 30 of 42 © Mitsui Babcock 2005
C78593 : IEA GHG Programme - Oxy-Combustion Processes for CO2 Capture>> C78593 O&M Costs NGCC DJD Iss 1.xls : DJD Issue 1 07.04.05 Updated Issue 1 07.04.05 <<
Yearly Variable Costs : Case 3 and Case 4
Yearly Operating hours = 7446
Consumables Unit Cost Operating Costs Operating Costs€/t Hourly Yearly (yearly basis) Hourly Yearly (yearly basis)
t/h t/y € t/h t/y €
FeedstockNatural Gas (€/MWh, MWh/h, GWh/a) 145.3 51.5 383 55,718,046 73.2 545 79,195,358
Auxiliary Feedstock- 0.0 0 0 0 0 0 0
Solvents- 0.0 0 0 0 0 0 0
Catalystno SCR 0.0 0 0 0 0 0 0
Chemicalsneglectible 0.0 0 0 0 0 0 0
Waste Disposalneglectible (e.g. waste water) 0.0 0 0 0 0 0 0
Miscellaneous neglectible (e.g. propane, service water) 0.0 0 0 0 0 0 0
TOTAL YEARLY OPERATING COSTS € 55,718,046 € 79,195,358
Consumption
NGCC Plant Case 575MWe Gross NGCC Power Plant
Case 4
NGCC Plant Case
Consumption
400MWe Gross NGCC Power PlantCase 3
CASE 3 & 4 : NGCC POWER PLANT – CONSUMABLES
TABLE 29

Report No: E/04/031 Issue No.: 1 Confidential
3 June, 2005 Tables: Page 31 of 42 © Mitsui Babcock 2005
C78593 : IEA GHG Programme - Oxy-Combustion Processes for CO2 Capture>> C78593 O&M Costs NGCC DJD Iss 1.xls : DJD Issue 1 07.04.05 Updated Issue 1 07.04.05 <<
Total O&M Costs : Case 3 and Case 4
Case 3 Case 4POS DESCRIPTION 400MWe 575MWe
NGCC Plant NGCC Plant€/year €/year
A1 Direct Labour 1,600,000 3,000,000
A2 Administration/General Overheads (30% of A1) 480,000 900,000
A3 Maintenance (4% of Installed costs (contingency excluded)) 6,160,000 18,760,000
A FIXED COSTS 8,240,000 22,660,000
B VARIABLE COSTS (Fuel) 55,718,000 79,195,000
63,958,000 101,855,000 TOTAL OPERATION AND MAINTENANCE COSTS
CASE 3 & 4: NGCC POWER PLANT TOTAL OPERATING AND MAINTENANCE COSTS
TABLE 30
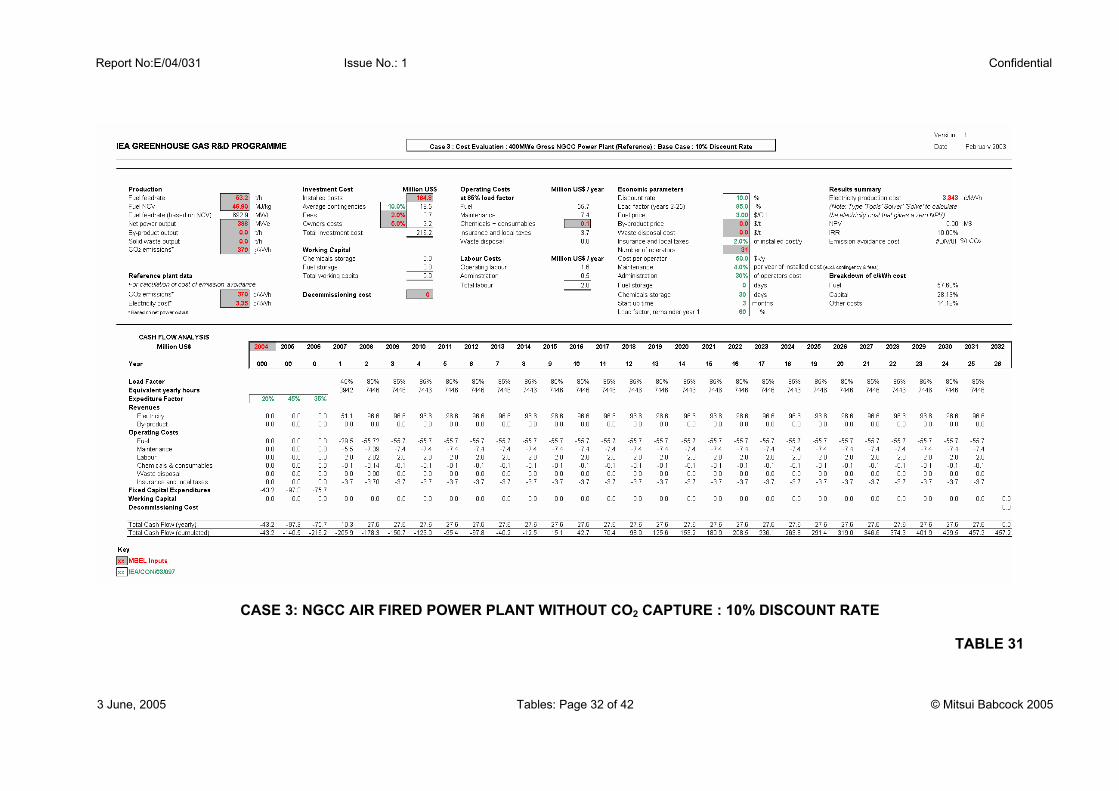
Report No:E/04/031 Issue No.: 1 Confidential
3 June, 2005 Tables: Page 32 of 42 © Mitsui Babcock 2005
CASE 3: NGCC AIR FIRED POWER PLANT WITHOUT CO2 CAPTURE : 10% DISCOUNT RATE
TABLE 31

Report No:E/04/031 Issue No.: 1 Confidential
3 June, 2005 Tables: Page 33 of 42 © Mitsui Babcock 2005
CASE 3: NGCC AIR FIRED POWER PLANT WITHOUT CO2 CAPTURE : 10% DISCOUNT RATE & +100% FUEL PRICE
TABLE 32

Report No:E/04/031 Issue No.: 1 Confidential
3 June, 2005 Tables: Page 34 of 42 © Mitsui Babcock 2005
CASE 3: NGCC AIR FIRED POWER PLANT WITHOUT CO2 CAPTURE : 10% DISCOUNT RATE & -100% FUEL PRICE
TABLE 33

Report No:E/04/031 Issue No.: 1 Confidential
3 June, 2005 Tables: Page 35 of 42 © Mitsui Babcock 2005
CASE 3: NGCC AIR FIRED POWER PLANT WITHOUT CO2 CAPTURE : 5% DISCOUNT RATE
TABLE 34

Report No:E/04/031 Issue No.: 1 Confidential
3 June, 2005 Tables: Page 36 of 42 © Mitsui Babcock 2005
CASE 3: NGCC AIR FIRED POWER PLANT WITHOUT CO2 CAPTURE : 10% DISCOUNT RATE & -20% TIC
TABLE 35

Report No:E/04/031 Issue No.: 1 Confidential
3 June, 2005 Tables: Page 37 of 42 © Mitsui Babcock 2005
CASE 4: NGCC OXY-COMBUSTION POWER PLANT WITH CO2 CAPTURE :10% DISCOUNT RATE TABLE 36
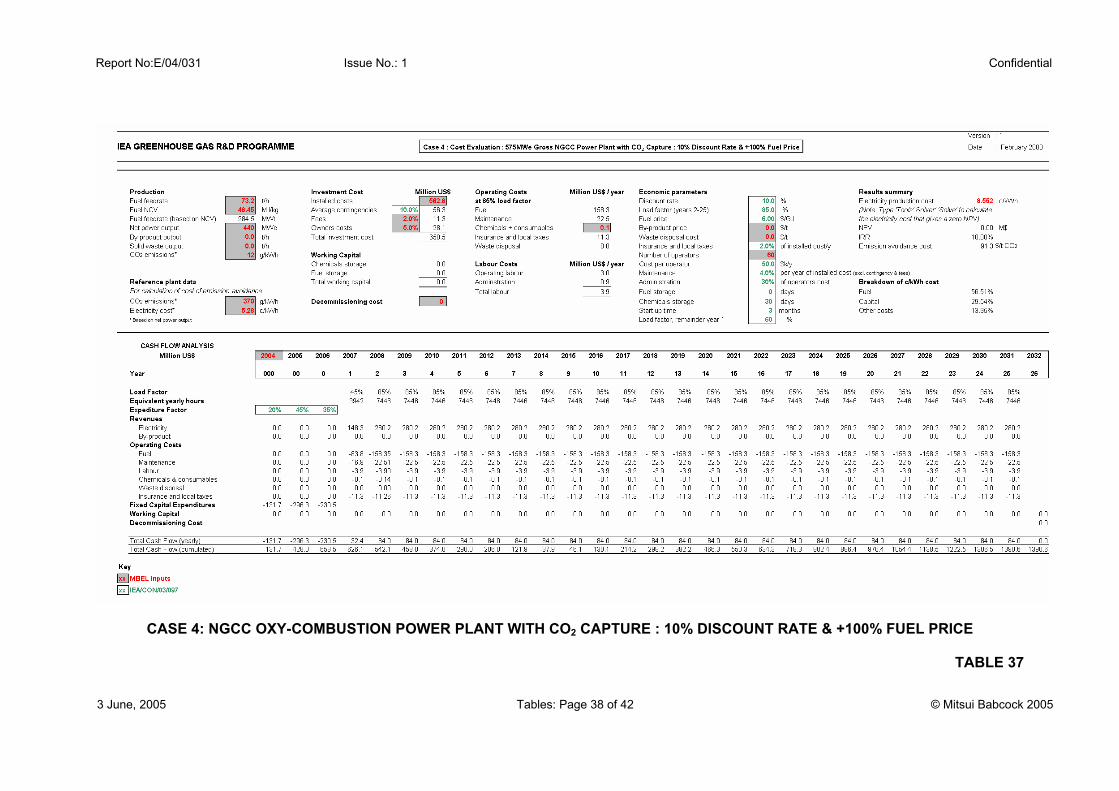
Report No:E/04/031 Issue No.: 1 Confidential
3 June, 2005 Tables: Page 38 of 42 © Mitsui Babcock 2005
CASE 4: NGCC OXY-COMBUSTION POWER PLANT WITH CO2 CAPTURE : 10% DISCOUNT RATE & +100% FUEL PRICE
TABLE 37

Report No:E/04/031 Issue No.: 1 Confidential
3 June, 2005 Tables: Page 39 of 42 © Mitsui Babcock 2005
CASE 4: NGCC OXY-COMBUSTION POWER PLANT WITH CO2 CAPTURE:10% DISCOUNT RATE & -100% FUEL PRICE TABLE 38

Report No:E/04/031 Issue No.: 1 Confidential
3 June, 2005 Tables: Page 40 of 42 © Mitsui Babcock 2005
CASE 4: NGCC OXY-COMBUSTION POWER PLANT WITH CO2 CAPTURE : 5% DISCOUNT RATE
TABLE 39

Report No:E/04/031 Issue No.: 1 Confidential
3 June, 2005 Tables: Page 41 of 42 © Mitsui Babcock 2005
CASE 4: NGCC OXY-COMBUSTION POWER PLANT WITH CO2 CAPTURE : 10% DISCOUNT RATE & -20% TIC
TABLE 40

Report No:E/04/031 Issue No.: 1 Confidential
3 June, 2005 Tables: Page 42 of 42 © Mitsui Babcock 2005
NGCC POWER PLANT : ECONOMIC PERFORMANCE SUMMARY WITH & WITHOUT CO2 CAPTURE
TABLE 41

Report No:E/04/031 Issue No.: 1 Confidential
3 June, 2005 Figures: Page 1 of 31 © Mitsui Babcock 2005
FIGURES

Report No:E/04/031 Issue No.: 1 Confidential
3 June, 2005 Figures: Page 2 of 31 © Mitsui Babcock 2005
CONVENTIONAL AIR-FIRED PULVERISED COAL (BITUMINOUS) COMBUSTION POWER PLANT
BASIC AIR COMBUSTION BLOCK DIAGRAM
FIGURE 1
FURNACE CONVECTIVEPASSES
ECONOMISER
MILL
COALIN
FLUEGAS
TO STACK
AIRIN
SECONDARYAIR
PRIMARYAIR
Emissions
Control Equipment

Report No:E/04/031 Issue No.: 1 Confidential
3 June, 2005 Figures: Page 3 of 31 © Mitsui Babcock 2005
OXY-COMBUSTION PULVERISED COAL (BITUMINOUS) COMBUSTION POWER PLANT
BASIC OXY-COMBUSTION BLOCK DIAGRAM
FIGURE 2
FURNACE CONVECTIVEPASSES
ECONOMISER
MILL
INERTSREMOVAL
ANDCOMPRESION
OXYGENIN
COALIN
CO2OUT
PRIMARYRECYCLE
SECONDARYRECYCLE
INERTS REMOVAL AND COMPRESSION
ESP

Report No:E/04/031 Issue No.: 1 Confidential
3 June, 2005 Figures: Page 4 of 31 © Mitsui Babcock 2005
OXY-COMBUSTION PULVERISED COAL (BITUMINOUS) COMBUSTION
OPTION A : COLD SECONDARY RECYCLE
FIGURE 3
FURNACE CONVECTIVEPASSES
ECONOMISER
MILL
ESP
GAS SCRUBBER
PRIMARY ANDSECONDARY
RECYCLEHEATER
FLUEGAS /GASCOOLER
FLUEGASFWH
OXYGENADDITION
INERTSREMOVAL
ANDCOMPRESION
OXYGENIN
COALIN
CO2OUT
INERTS REMOVAL AND COMPRESSION
Key Mass Flowrate Heat Transfer

Report No:E/04/031 Issue No.: 1 Confidential
3 June, 2005 Figures: Page 5 of 31 © Mitsui Babcock 2005
OXY-COMBUSTION PULVERISED COAL (BITUMINOUS) COMBUSTION
OPTION B : WARM SECONDARY RECYCLE
FIGURE 4
FURNACE CONVECTIVEPASSES
ECONOMISER
MILL
ESP
GAS SCRUBBER
PRIMARYRECYCLEHEATER
FLUEGAS /GASCOOLER
FLUEGASFWH
OXYGENADDITION
INERTSREMOVAL
ANDCOMPRESION
OXYGENIN
COALIN
CO2OUT
SECONDARYRECYCLEHEATER
INERTS REMOVAL AND COMPRESSION
INERTS REMOVAL AND COMPRESSION
Key Mass Flowrate Heat Transfer

Report No:E/04/031 Issue No.: 1 Confidential
3 June, 2005 Figures: Page 6 of 31 © Mitsui Babcock 2005
OXY-COMBUSTION PULVERISED COAL (BITUMINOUS) COMBUSTION
OPTION C1 : HOT SECONDARY RECYCLE / PARALLEL GAS HEATER AND FWH
FIGURE 5
FURNACE CONVECTIVEPASSES
ECONOMISER
MILL
ESP
GAS SCRUBBER
PRIMARYRECYCLEHEATER
FLUEGAS /GASCOOLER
FLUEGASFWH
OXYGENADDITION
INERTSREMOVAL
ANDCOMPRESION
OXYGENIN
COALIN
CO2OUT
INERTS REMOVAL AND COMPRESSION
Key Mass Flowrate Heat Transfer

Report No:E/04/031 Issue No.: 1 Confidential
3 June, 2005 Figures: Page 7 of 31 © Mitsui Babcock 2005
OXY-COMBUSTION PULVERISED COAL (BITUMINOUS) COMBUSTION
OPTION C2 : HOT SECONDARY RECYCLE / SERIES GAS HEATER AND FWH
FIGURE 6
FURNACE CONVECTIVEPASSES
ECONOMISER
MILL
ESP
GAS SCRUBBER
PRIMARYRECYCLEHEATER
FLUEGAS /GASCOOLER
FLUEGASFWH
OXYGENADDITION
INERTSREMOVAL
ANDCOMPRESION
OXYGENIN
COALIN
CO2OUT
INERTS REMOVAL AND COMPRESSION

Report No:E/04/031 Issue No.: 1 Confidential
3 June, 2005 Figures: Page 8 of 31 © Mitsui Babcock 2005
OXY-COMBUSTION PULVERISED COAL (BITUMINOUS) COMBUSTION
OPTION C3 : HOT SECONDARY RECYCLE / WATER HEATING FOR PRIMARY RECYCLE
FIGURE 7
FURNACE CONVECTIVEPASSES
ECONOMISER
MILL
ESP
GAS SCRUBBER
PRIMARYRECYCLEHEATER
FLUEGASFWH
OXYGENADDITION
INERTSREMOVAL
ANDCOMPRESION
OXYGENIN
COALIN
CO2OUT
INERTS REMOVAL AND COMPRESSION
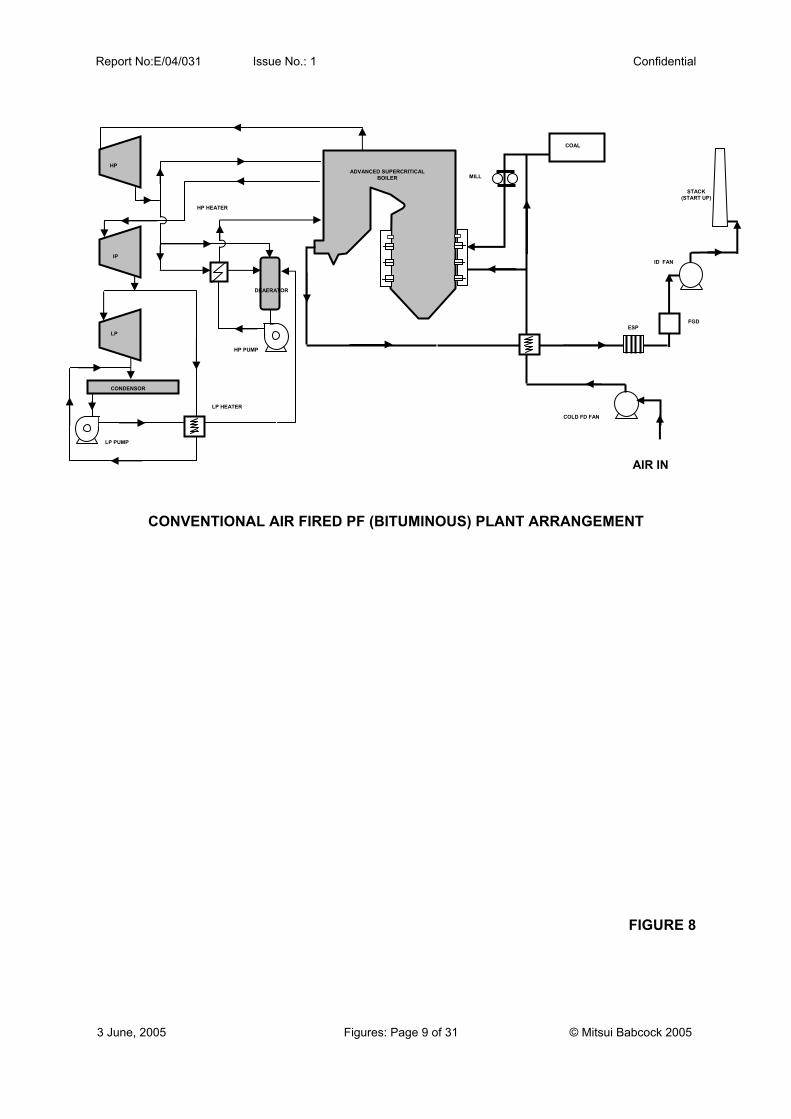
Report No:E/04/031 Issue No.: 1 Confidential
3 June, 2005 Figures: Page 9 of 31 © Mitsui Babcock 2005
DEAERATOR
CONVENTIONAL AIR FIRED PF (BITUMINOUS) PLANT ARRANGEMENT
FIGURE 8
HP HEATER
MILL
HP PUMP
LP HEATER
STACK (START UP)
ESP
ID FAN
COAL
HP
IP
LP
CONDENSOR
COLD FD FAN
LP PUMP
AIR IN
ADVANCED SUPERCRITICAL BOILER
FGD

Report No:E/04/031 Issue No.: 1 Confidential
3 June, 2005 Figures: Page 10 of 31 © Mitsui Babcock 2005
DEAERATOR
ASU
ADVANCED SUPERCRITICAL BOILER
4
1 2 3 4
3
CO2 PURIFICATION
INERTS
OXY-COMBUSTION ASC PF POWER PLANT WITH CO2 CAPTURE ARRANGEMENT
FIGURE 9
HP HEATER
MILL
3
HP PUMP
LP HEATER
1 - IP STEAM BLEED 2 - HEAT FROM ASU ADIABATIC MAC 3 - CO2 COMPRESSOR STAGE HEAT 4 – FLUE GAS FEEDWATER HEATING
STACK (START
UP)
ESP
AIRINTAKE
START UP
ID FAN
FD / RECYCLE FAN
GAS
/ GAS
HEATER
COAL
NITROGEN
AIR
HP
IP
LP
CONDENSOR
SECONDARY RECYCLE
LP PUMP
GAS COOLER & WATER REMOVAL
CO2 PRODUCT FOR COMPRESSION
PRIMARY RECYCLE
4
2
3
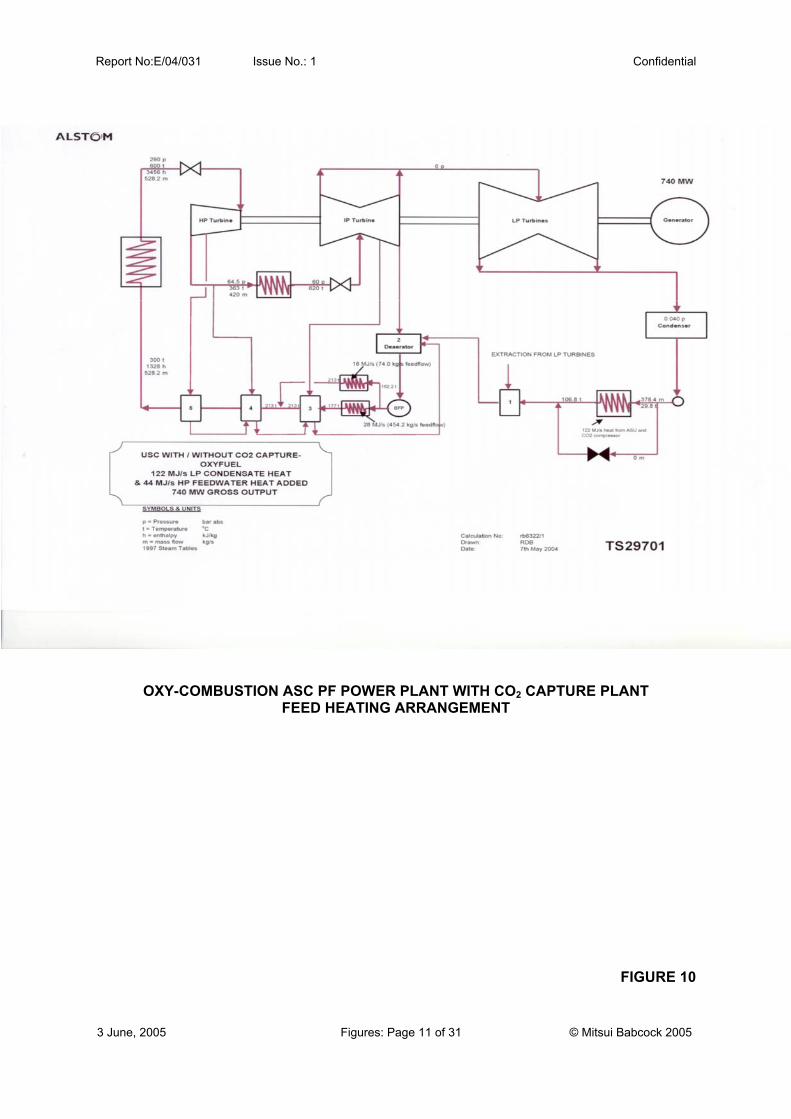
Report No:E/04/031 Issue No.: 1 Confidential
3 June, 2005 Figures: Page 11 of 31 © Mitsui Babcock 2005
OXY-COMBUSTION ASC PF POWER PLANT WITH CO2 CAPTURE PLANT FEED HEATING ARRANGEMENT
FIGURE 10

Report No:E/04/031 Issue No.: 1 Confidential
3 June, 2005 Figures: Page 12 of 31 © Mitsui Babcock 2005
Air9°C534.7 kg/s
43°C
Boiler Feed Water33.4°C16 bara358.5 kg/s
MAC
144°C3.5 bara
70.8°C
Waste N2
Direct Contact After Cooler Chill Tower
Waste N2Air to H2O/CO2 removal
Note: Flowrates are totals over both ASUs
ADIABATIC MAIN AIR COMPRESSOR (MAC) ARRANGEMENT
FIGURE 11

Report No:E/04/031 Issue No.: 1 Confidential
3 June, 2005 Figures: Page 13 of 31 © Mitsui Babcock 2005
OXYGEN BACK UP SYSTEM ISOMETRIC
FIGURE 12

Report No:E/04/031 Issue No.: 1 Confidential
3 June, 2005 Figures: Page 14 of 31 © Mitsui Babcock 2005
K205
K204 K202
K201/1 K201/2
K201/4 K201/3
K203/1
K203/2
K203/3
ASC PF POWER PLANT WITH CO2 CAPTURE CO2 COMPRESSION TRAIN LAYOUT
FIGURE 13

Report No:E/04/031 Issue No.: 1 Confidential
3 June, 2005 Figures: Page 15 of 31 © Mitsui Babcock 2005
Note : Emissions presented are at actual oxygen levels and have not been normalised to 6% O2, v/v, dry
OXY-COMBUSTION ASC PF POWER PLANT WITH CO2 CAPTURE EMISSONS SUMMARY
FIGURE 14
NOx EmissionsSec Recycle
49.02 mg/MJ
Boiler exit115.23 mg/MJ
CO2 ProductPrim recycle 6.37 mg/MJ
31.83 mg/MJ
Inerts removal25.85 mg/MJ
SOx Emissions
Sec Recycle872.15 mg/MJ
Boiler exit2046.05 mg/MJ
CO2 ProductPrim recycle 534.11 mg/MJ
559.32 mg/MJ
Inerts removal0.00 mg/MJ
ParticulatesSec Recycle
4.65 mg/MJ
Boiler exit10.82 mg/MJ
CO2 ProductPrim recycle 0.00 mg/MJ
0.00 mg/MJ
Inerts removal0.00 mg/MJ
1 2
3
4
5
contact cooler
1 2
3
4
5
contact cooler
1 2
3
4
5
contact cooler

Report No:E/04/031 Issue No.: 1 Confidential
3 June, 2005 Figures: Page 16 of 31 © Mitsui Babcock 2005
CONVENTIONAL AIR FIRED NGCC POWER PLANT ARRANGEMENT
FIGURE 15
ELECTRICITY
SupplementalFuel
Bypass
GAS TURBINE GENERATOR
Fuel
Air Intake
Superheated SteamExhaust Flue
Gas
PUMP PUMPDeaerator
ELECTRICITY
STEAM TURBINE GENERATOR
STACK
HEAT RECOVERY STEAM GENERATOR
CONDENSER
ELECTRICITY
SupplementalFuel
Bypass
GAS TURBINE GENERATOR
Fuel
Air Intake
Superheated SteamExhaust Flue
Gas
PUMP PUMPDeaerator
ELECTRICITY
STEAM TURBINE GENERATOR
STACK
HEAT RECOVERY STEAM GENERATOR
CONDENSER

Report No:E/04/031 Issue No.: 1 Confidential
3 June, 2005 Figures: Page 17 of 31 © Mitsui Babcock 2005
NGCC POWER PLANT WITH CO2 CAPTURE THE EFFECT OF FLUE GAS RECRCULATION TEMPERATURE ON GAS TURBINE
PERFORMANCE
FIGURE 16

Report No:E/04/031 Issue No.: 1 Confidential
3 June, 2005 Figures: Page 18 of 31 © Mitsui Babcock 2005
GT COMPRESSOR VECTOR TRIANGLES
FIGURE 17
DH/USQ
VX/UMα1
α2 β1β2
VR1 VA2VR2 VA1 BladeSpeed
UM
Aerodynamic Load = 1- VR22/VR1
2
β1
β2
Compressor Vector Triangles
Nomenclature for Vector Triangles : DH Stage Enthalpy rise VX Axial Velocity UM Mean Blade Speed VA1 Rotor Inlet Absolute Velocity VA2 Rotor Exit Absolute Velocity VR1 Rotor Inlet Relative Velocity VR2 Rotor Exit Relative Velocity α1 Rotor Inlet Absolute Flow Angle
α2 Rotor Exit Absolute Flow Angle β1 Rotor Inlet Relative Flow Angle β2 Rotor Exit Relative Flow Angle

Report No:E/04/031 Issue No.: 1 Confidential
3 June, 2005 Figures: Page 19 of 31 © Mitsui Babcock 2005
NGCC POWER PLANT : GAS TURBINE EFFECT OF SYNCHRONOUS SPEED REQUIREMENTS ON COMBINED CYCLE POWER
OUTPUT
FIGURE 18

Report No:E/04/031 Issue No.: 1 Confidential
3 June, 2005 Figures: Page 20 of 31 © Mitsui Babcock 2005
NGCC POWER PLANT : GAS TURBINE AVERAGE CREEP RUPTURE PROPERTIES FOR CONSTANT LIFE
FIGURE 19
Average Creep Rupture Properties
0
100
200
300
400
500
600
700
800
900
500.0 550.0 600.0 650.0 700.0 750.0 800.0 850.0 900.0 950.0 1000.0
Metal Temperature .C
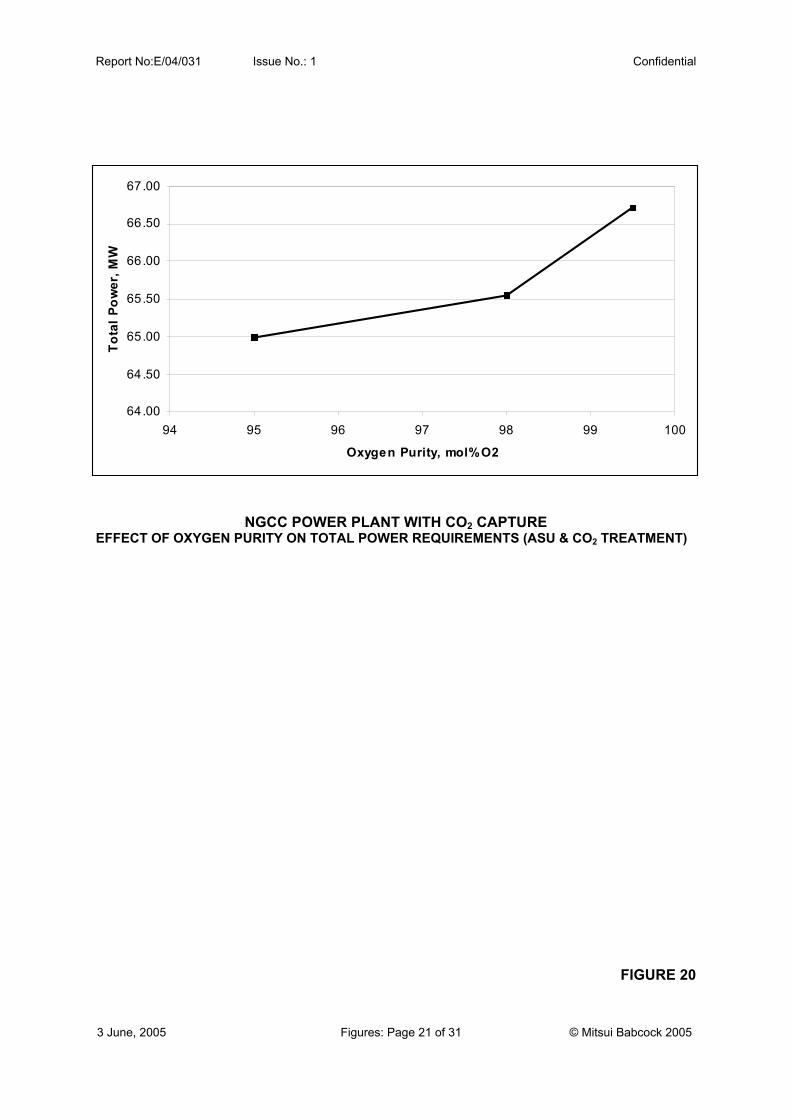
Report No:E/04/031 Issue No.: 1 Confidential
3 June, 2005 Figures: Page 21 of 31 © Mitsui Babcock 2005
NGCC POWER PLANT WITH CO2 CAPTURE EFFECT OF OXYGEN PURITY ON TOTAL POWER REQUIREMENTS (ASU & CO2 TREATMENT)
FIGURE 20
64.00
64.50
65.00
65.50
66.00
66.50
67.00
94 95 96 97 98 99 100
Oxygen Purity, mol% O2
Tota
l Pow
er, M
W

Report No:E/04/031 Issue No.: 1 Confidential
3 June, 2005 Figures: Page 22 of 31 © Mitsui Babcock 2005
K204
K201/1 K201/2
K201/4K201/3
K203/1
K203/2
K203/3
NGCC POWER PLANT WITH CO2 CAPTURE CO2 COMPRESSION TRAIN LAYOUT
FIGURE 21

Report No:E/04/031 Issue No.: 1 Confidential
3 June, 2005 Figures: Page 23 of 31 © Mitsui Babcock 2005
Effect of Cycle Pressure Ratio on Cycle Performance
-3
-2
-1
0
1
2
3
500 520 540 560 580 600 620 640 660Specific Power Kj/Kg
Del
ta E
ffici
ency
%
1300
1400
1500
1600
1700
1800
1900
Burner Exit Temperature
% Delta Efficiency
20
3040 50
Concept Design B
urne
r Exi
t Tem
pera
ture
.K
Cycle Pressure
Ratio
Note : Delta cycle efficiency excludes CO2 compression power requirements
NGCC POWER PLANT WITH CO2 CAPTURE EFFECT OF GT PRESSURE RATIO ON CYCLE EFFICIENCY
FIGURE 22

Report No:E/04/031 Issue No.: 1 Confidential
3 June, 2005 Figures: Page 24 of 31 © Mitsui Babcock 2005
NGCC POWER PLANT WITH CO2 CAPTURE EFFECT OF CO2 & CYCLE PRESSURE RATIO ON GT TURBINE ROTOR BLADE COOLING
FIGURE 23
Key V1 Vanes Stage 1 V2 Vanes Stage 2 V3 Vanes Stage 3 V4 Vanes Stage 4 R1 Stage 1 Rotor Blade R2 Stage 2 Rotor Blade R3 Stage 3 Rotor Blade R4 Stage 4 Rotor Blade

Report No:E/04/031 Issue No.: 1 Confidential
3 June, 2005 Figures: Page 25 of 31 © Mitsui Babcock 2005
Effect of Oxygen and CO2 Purity on Performance
-1.4
-1.2
-1
-0.8
-0.6
-0.4
-0.2
0
0.945 0.95 0.955 0.96 0.965 0.97 0.975 0.98 0.985 0.99 0.995 1
Oxygen Purity
Rel
ativ
e C
ycle
Eff
icie
ncy
Cha
nge
%
0.94
0.95
0.96
0.97
0.98
0.99
1
1.01
CO
2 R
ecov
ery
Constant GT Exit Temperature = 917.KConstant Flu Gas O2 = 2%Avg Specific Power = 560.KJ/KG
95% CO2 Purification
98% CO2 Purification
95% CO2 Purification
98% CO2 Purification
CO2 Recovery
Cycle Efficiency
NGCC POWER PLANT WITH CO2 CAPTURE EFFECT OF OXYGEN AND CO2 PURITY ON CYCLE PERFORMANCE
FIGURE 24

Report No:E/04/031 Issue No.: 1 Confidential
3 June, 2005 Figures: Page 26 of 31 © Mitsui Babcock 2005
Sensitivity of Cost of Electricity to Fuel Price
0
1
2
3
4
5
6
7
8
9
10
0 1 2 3 4 5 6 7
Fuel Price US $/GJ
Cos
t of E
lect
ricity
US¢
/kW
h
ASC PFASC PF with CO2 CaptureNGCC NGCC with CO2 Capture
ASC PF POWER PLANT & NGCC POWER PLANT
SENSITIVITY OF COST OF ELECTRICITY TO FUEL PRICE : WITH & WITHOUT CO2 CAPTURE
FIGURE 25

Report No:E/04/031 Issue No.: 1 Confidential
3 June, 2005 Figures: Page 27 of 31 © Mitsui Babcock 2005
CO2 ABATEMENT BY EFFICIENCY IMPROVEMENT
FIGURE 26
1990 2000 2010 2015
-30%
-20%
-10%
0% Traditional NaturalCirculation Boiler
AdvancedSupercritical
Boilers
HEMWEG
COST 522TARGET
THERMIE 700TARGET
1990 2000 2010 2015
30%
-20%
-10%
0%Traditional Natural Circulation Boiler
AdvancedSupercritical
Boilers
HEMWEG
MBEL BAT
COST 522 TARGET
THERMIE 700 TARGET
% CO2 REDUCTION
YEAR
Net Cycle Efficiency, LHV: Old NC Plant 35% Modern NC Plant 38% Older SC Plant 42% BAT SC Plant 46% Future SC Plant 50-55% NC = Natural Circulation SC = SuperCritical

Report No:E/04/031 Issue No.: 1 Confidential
3 June, 2005 Figures: Page 28 of 31 © Mitsui Babcock 2005
HotHotCompressed Compressed
AirAir
OxygenOxygenProductProduct
O2-
e-
MIXED CONDUCTING ION TRANSPORT MEMBRANE
FIGURE 27
Oxygen anions move counter to electrons at high temperature in the same material under an oxygen activity gradient

Report No:E/04/031 Issue No.: 1 Confidential
3 June, 2005 Figures: Page 29 of 31 © Mitsui Babcock 2005
SCHEMATIC OF ITM OXYGEN PLANAR SUPPORTED MEMBRANE DEVICE
FIGURE 28

Report No:E/04/031 Issue No.: 1 Confidential
3 June, 2005 Figures: Page 30 of 31 © Mitsui Babcock 2005
NGCC POWER PLANT BASIC SCHEME FOR INTEGRATION OF AN ITM OXYGEN AIR SEPARATION UNIT INTO A GAS
TURBINE POWER CYCLE (Process outputs are oxygen, power and steam)
FIGURE 29

Report No:E/04/031 Issue No.: 1 Confidential
3 June, 2005 Figures: Page 31 of 31 © Mitsui Babcock 2005
AIR
IONTRANSPORTMEMBRANE
STEAM TURBINEBOTTOMING
CYCLE
ELECTRICPOWER
ELECTRICPOWER
COALGASIFIER
SYNGASTREATING
SYNGAS
OXYGEN
STEAM
BFW
COAL
OXYGEN
BASIC SCHEME FOR INTEGRATION OF AN ITM OXYGEN AIR SEPARATION UNIT
INTO A IGCC POWER CYCLE
FIGURE 30

Report No: E/04/031 Issue No.: 1 Confidential
3 June, 2005 Appendix 1 : Page 1 of 10 © Mitsui Babcock 2005
APPENDIX 1 ECLIPSE Modelling of ASC PF Power Plant with CO2 Capture
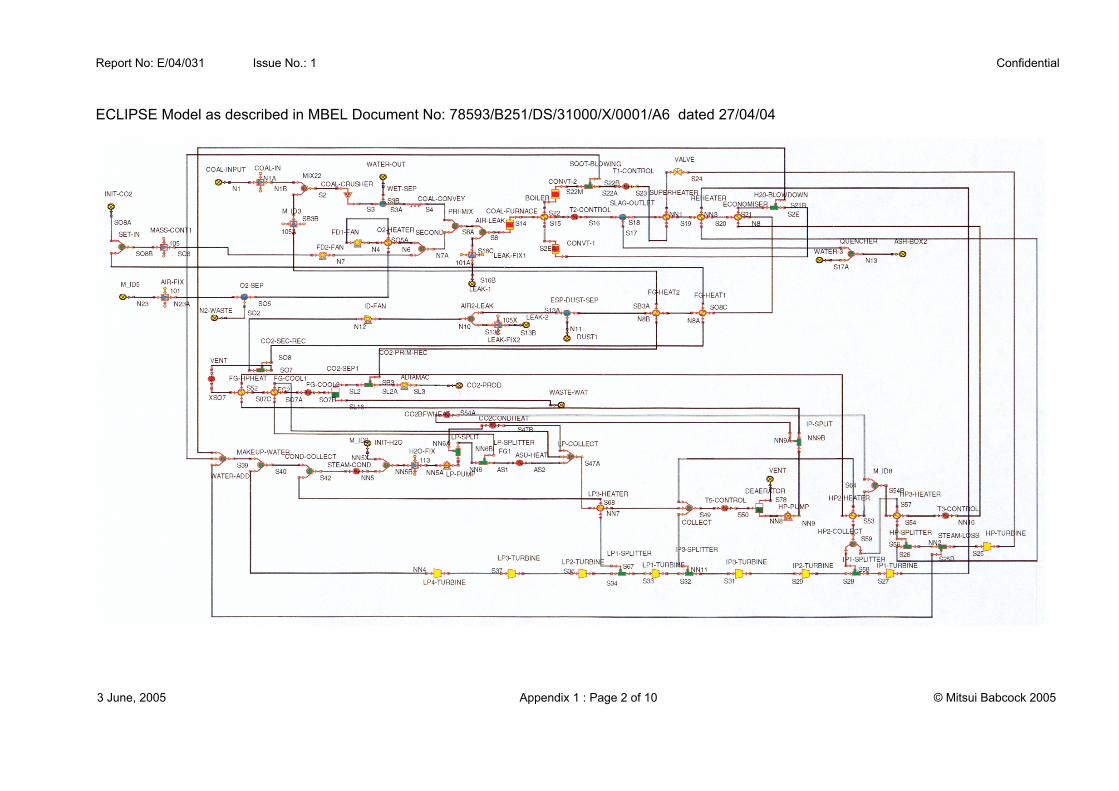
Report No: E/04/031 Issue No.: 1 Confidential
3 June, 2005 Appendix 1 : Page 2 of 10 © Mitsui Babcock 2005
ECLIPSE Model as described in MBEL Document No: 78593/B251/DS/31000/X/0001/A6 dated 27/04/04

Report No: E/04/031 Issue No.: 1 Confidential
3 June, 2005 Appendix 1 : Page 3 of 10 © Mitsui Babcock 2005

Report No: E/04/031 Issue No.: 1 Confidential
3 June, 2005 Appendix 1 : Page 4 of 10 © Mitsui Babcock 2005

Report No: E/04/031 Issue No.: 1 Confidential
3 June, 2005 Appendix 1 : Page 5 of 10 © Mitsui Babcock 2005

Report No: E/04/031 Issue No.: 1 Confidential
3 June, 2005 Appendix 1 : Page 6 of 10 © Mitsui Babcock 2005

Report No: E/04/031 Issue No.: 1 Confidential
3 June, 2005 Appendix 1 : Page 7 of 10 © Mitsui Babcock 2005
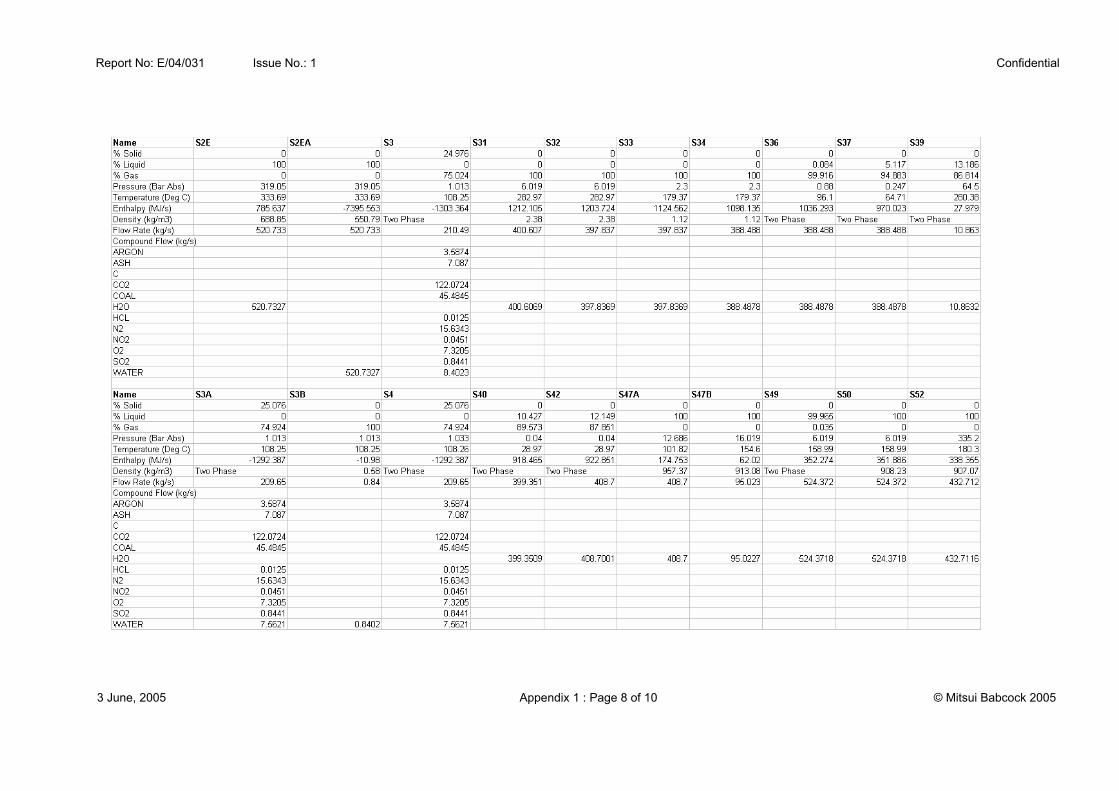
Report No: E/04/031 Issue No.: 1 Confidential
3 June, 2005 Appendix 1 : Page 8 of 10 © Mitsui Babcock 2005

Report No: E/04/031 Issue No.: 1 Confidential
3 June, 2005 Appendix 1 : Page 9 of 10 © Mitsui Babcock 2005

Report No: E/04/031 Issue No.: 1 Confidential
3 June, 2005 Appendix 1 : Page 10 of 10 © Mitsui Babcock 2005