technology entrepreneurship and ecosystemsymorg.fon.bg.ac.rs/proceedings/2018/papers...aleksandar...
TRANSCRIPT

TECHNOLOGY ENTREPRENEURSHIP
AND ECOSYSTEM

TECHNOLOGY ENTREPRENEURSHIP AND ECOSYSTEM
Maja Levi Jakšić, Jovana Rakićević, Ondrej Jaško
COMPETITIVE INNOVATION AND ENTREPRENEURSHIP ECOSYSTEM FRAMEWORK
Jovana Rakićević, Maja Levi Jakšić, Nina Ukropina
THE ROLE OF SUPPORT ORGANIZATIONS IN TECHNOLOGY ENTREPRENEURSHIP ECOSYSTEM:
CASE OF SERBIA
Aleksandar Vekić, Jelena Borocki, Angela Fajsi
CREATING ENTREPRENEURIAL ECOSYSTEM THROUGH UNIVERSITIES SPIN OFF AND STARTUP
COMPANIES - EXAMPLE OF THE UNIVERSITY OF NOVI SAD
Milica Jovanović, Miloš Jevtić, Jasna Petković
THE ROLE OF CULTURE IN ENTREPRENEURIAL ECOSYSTEM: WHAT MATTERS MOST?
Goran Kutnjak, Dejan Miljenović, Ana Obradović
DIMENSIONING THE CONTEXT OF CORPORATE SOCIAL RESPONSIBILITY
Nikola Mehandžić, Sanja Marinković
APPLICATION OF BIOMETRIC TECHNOLOGY IN ELECTRONIC PAYMENT AUTHENTICATION

COMPETITIVE INNOVATION AND ENTREPRENEURSHIP ECOSYSTEM FRAMEWORK
Maja Levi Jakšić*1, Jovana Rakićević
1, Ondrej Jaško
1
1University of Belgrade, Faculty of Organizational Sciences
*e-mail: [email protected]
Abstract: The research aim is to develop a conceptual framework which is relevant in the process of developing the Innovation and Entrepreneurship Ecosystem (IEE) towards achieving the goals of increasing competitiveness of national economy and regions. The development of competitive IEE is viewed as a process involving changes in all the relevant domains, actors, stakeholders, networks and relationships, and links present in the ecosystem. It is argued that the government, with a smart policy mix of measures and instruments, plays a significant role in the process of creating the ambience of the external environment influencing the crucial domains of the ecosystem. In this paper, it is argued that the “ecosystem approach“ is comprehensive, encompassing the firm and the external environment considerations and includes both the micro and macro perspectives of competitiveness. The contemporary research findings point to innovation and entrepreneurship as the relevant pillars of economic growth. The concept of competitive Innovation and Entrepreneurship Ecosystem (IEE) integrates the holistic approach for identifying the main forces leading to feasible and sustainable economic growth. In this respect, global innovation and global entrepreneurship indices are compared for correspondence, coincidence and compatibility as a step towards identifying the crucial domains, determinants and factors of IEE. The IEE framework provides support to policy decision makers involved in national and regional sustainable innovation and entrepreneurship ecosystems development. The relevance of the suggested framework is found in its conceptual and methodological contributions to identifying relevant factors for better understanding the crucial domains of the IEE, their evaluation and monitoring, and ultimately leading to actions that will increase its overall strengths and competitiveness. Keywords: Innovation, Entrepreneurship, Ecosystem Approach, Competitiveness, Framework
1. INTRODUCTION
The research aim is to develop a conceptual framework as decision support to policy decision makers involved in national and regional sustainable innovation and entrepreneurship ecosystems development. The Innovation and Entrepreneurship Ecosystems (IEE) are recognized as the crucial forces boosting development of nations worldwide. Numerous institutions, experts, and teams have engaged in developing methodology, models and tools for measuring, monitoring, and continuously improving the innovation and entrepreneurship environments. Contemporary research results, both in theory and in practice, as reported in relevant literature, indicate a convergence between innovation, entrepreneurship and competitiveness. These results also indicate a convergence between the macro and micro research perspectives resulting in integrating the relevant factors of both. It is widely ascertained that in order to achieve competitiveness and economic growth it is necessary to focus efforts at strengthening the three crucial domains of innovation, entrepreneurship, and competitiveness and this implies integrating the relevant actors, resources, relationships, networks, and linkages in the analysis. The rising interest in this field has resulted in multiple approaches, concepts and models found in relevant literature, e.g. National innovation Systems, Ecosystems, Triple (Quadruple) Helix, Sustainable Development, PESTLE (Political, Economic, Social, Technology, Legal, and Environmental) analysis, Key Enabling Technology- KET, Global Indices and Models. There is a wide range of institutions, organizations and individuals that contribute to these efforts: universities, research institutions, European and World Organizations, academics, researchers. With no intention to give the complete list, we name some of them as follows: European Institute for Innovation and Technology (EIT), World Economic Forum (WEF), European Commission Joint Research Centre, (EC JRC), EC High Expert Group (EC HEG), World Intellectual Property Organization (WIPO), OECD, World Bank, EBRD, INSEAD, Cornell University, Aspen Group, Global Entrepreneurship and Development Institute (GEDI). The different approaches are in accordance and based on the assent that external environment and the overall ambiance for innovation and entrepreneurship is crucial in enhancing competitiveness of national economies, regions, and firms.
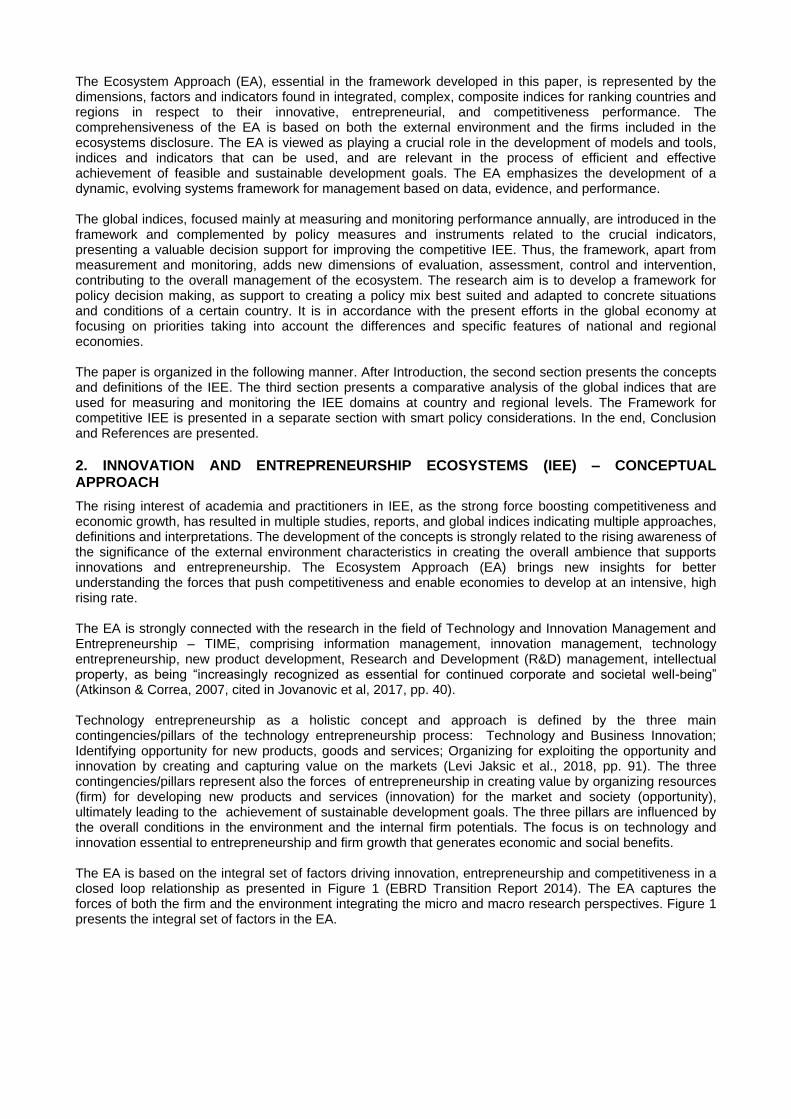
The Ecosystem Approach (EA), essential in the framework developed in this paper, is represented by the dimensions, factors and indicators found in integrated, complex, composite indices for ranking countries and regions in respect to their innovative, entrepreneurial, and competitiveness performance. The comprehensiveness of the EA is based on both the external environment and the firms included in the ecosystems disclosure. The EA is viewed as playing a crucial role in the development of models and tools, indices and indicators that can be used, and are relevant in the process of efficient and effective achievement of feasible and sustainable development goals. The EA emphasizes the development of a dynamic, evolving systems framework for management based on data, evidence, and performance. The global indices, focused mainly at measuring and monitoring performance annually, are introduced in the framework and complemented by policy measures and instruments related to the crucial indicators, presenting a valuable decision support for improving the competitive IEE. Thus, the framework, apart from measurement and monitoring, adds new dimensions of evaluation, assessment, control and intervention, contributing to the overall management of the ecosystem. The research aim is to develop a framework for policy decision making, as support to creating a policy mix best suited and adapted to concrete situations and conditions of a certain country. It is in accordance with the present efforts in the global economy at focusing on priorities taking into account the differences and specific features of national and regional economies. The paper is organized in the following manner. After Introduction, the second section presents the concepts and definitions of the IEE. The third section presents a comparative analysis of the global indices that are used for measuring and monitoring the IEE domains at country and regional levels. The Framework for competitive IEE is presented in a separate section with smart policy considerations. In the end, Conclusion and References are presented.
2. INNOVATION AND ENTREPRENEURSHIP ECOSYSTEMS (IEE) – CONCEPTUAL APPROACH
The rising interest of academia and practitioners in IEE, as the strong force boosting competitiveness and economic growth, has resulted in multiple studies, reports, and global indices indicating multiple approaches, definitions and interpretations. The development of the concepts is strongly related to the rising awareness of the significance of the external environment characteristics in creating the overall ambience that supports innovations and entrepreneurship. The Ecosystem Approach (EA) brings new insights for better understanding the forces that push competitiveness and enable economies to develop at an intensive, high rising rate. The EA is strongly connected with the research in the field of Technology and Innovation Management and Entrepreneurship – TIME, comprising information management, innovation management, technology entrepreneurship, new product development, Research and Development (R&D) management, intellectual property, as being “increasingly recognized as essential for continued corporate and societal well-being” (Atkinson & Correa, 2007, cited in Jovanovic et al, 2017, pp. 40). Technology entrepreneurship as a holistic concept and approach is defined by the three main contingencies/pillars of the technology entrepreneurship process: Technology and Business Innovation; Identifying opportunity for new products, goods and services; Organizing for exploiting the opportunity and innovation by creating and capturing value on the markets (Levi Jaksic et al., 2018, pp. 91). The three contingencies/pillars represent also the forces of entrepreneurship in creating value by organizing resources (firm) for developing new products and services (innovation) for the market and society (opportunity), ultimately leading to the achievement of sustainable development goals. The three pillars are influenced by the overall conditions in the environment and the internal firm potentials. The focus is on technology and innovation essential to entrepreneurship and firm growth that generates economic and social benefits. The EA is based on the integral set of factors driving innovation, entrepreneurship and competitiveness in a closed loop relationship as presented in Figure 1 (EBRD Transition Report 2014). The EA captures the forces of both the firm and the environment integrating the micro and macro research perspectives. Figure 1 presents the integral set of factors in the EA.

Figure 1: Ecosystem Approach based on integral set of factors driving innovation, entrepreneurship and competitiveness (Source: EBRD Transition Report 2014)
Focus on the firms (industry and business) in the IEE is related to their central role in improving productivity and competitiveness of the economy. It is the individual firm that harnesses innovation to create new value. At the same time the firms are not “isolated islands” and the EA emphasizes the environment factors and conditions (external and internal) in boosting the overall competitiveness and growth. The competitive ecosystem is created by nourishing high growth competitive firms as the motor force of the development of the economy. As stated in the Report “Regardless of a country’s level of economic development or its progress along the transition path, individual firms can make a difference” (EBRD Transition Report 2014, pp.4). It is ascertained that the competitiveness of the economy is positively related to the ecosystem dynamics. All the domains of the ecosystem are engaged in fostering the dynamics of new firms entering the markets, developing and growing at a high rate and incumbents ceasing to operate. The fast growing firms (Mason & Brown, 2014) are the key, competitive firms whose market share growth effects the growth of the economy. It is the ecosystem that creates the fertile grounds for the firms with the high growth potential to flourish and in the dynamic ecosystem there is more opportunity for firms to emerge, grow and create employment (Rosted, 2012). The central role of the firm within the ecosystem is presented in Figure 2 indicating six relevant dimensions of the ecosystem: The Firm, Infrastructure and Institutions, Education and Public research System, Innovation Policies, Market Demand, and Other Firms (Hao et al., 2017).
Figure 2: The six Ecosystem dimensions (Hao et al., 2017, pp. 8) The term ecosystem has emerged for the first time in the 1990s (Moore, 1993). Multiple models of innovation and entrepreneurial ecosystems have emerged in the recent years. According to Mason and Brown (2014, pp. 5), the entrepreneurial ecosystem represents a holistic approach focusing on: actors, resource providers, entrepreneurial connectors, and entrepreneurial environment. It is noted that an influential approach has been developed by Daniel Isenberg, leader of the Babson College Project with reference to the “entrepreneurship ecosystem strategy for economic development” (Isenberg, 2011). It is postulated that this is a novel and cost-effective strategy for stimulating economic prosperity. This approach potentially “replaces” or becomes a “pre-condition” for the successful deployment of cluster strategies, innovation systems, knowledge economy or national competitiveness policies (Isenberg, 2011). The ecosystem includes six domains: a conducive culture, enabling policies and leadership, availability of appropriate finance, quality human capital, venture friendly markets for products, and a range
External Firm Environment Factors
Internal Firm Environment Factors
THE FIRM
Education and Public Research System
Innovation Policies
Market demand,
customers, buyers
Other Firms: suppliers,
contractors, partners,
joint ventures
Infrastructu-re and
Institutions

of institutional supports (Mason & Brown, 2014, pp. 5). Figure 3 provides a graphic representation of the Isenberg’s Entrepreneurial Ecosystem.
Figure 3: Isenberg’s Entrepreneurship Ecosystem (modified source: based on Isenberg, 2011)
Based on the analysis of definitions found in the relevant literature, we propose a synthesized definition of the Innovation and Entrepreneurship Ecosystem as a set of interconnected entrepreneurial actors (organizations, institutions) and entrepreneurial processes playing relevant roles in the three essential domains (pillars) of entrepreneurship: creating opportunity, innovation and organizations, and bearing responsibilities in developing policies, measures, instruments for connecting, mediating and governing the performance within the local innovation and entrepreneurial environment.
3. IEE METRICS: GLOBAL INNOVATION AND ENTREPRENEURSHIP INDICES - COMPARATIVE ANALYSIS
Mapping and measuring the existing innovation and entrepreneurship ecosystem is the first step in the efforts aimed at enhancing its competitiveness. Managing ecosystem performance is based on comprehensive performance measurement. Global indices are recognized as valuable tools serving the purpose of measuring and monitoring the ecosystem. We have reviewed six relevant ecosystem measurement approaches, reported as global indices, for comparative analysis: European Innovation Scoreboard (EIS), Global Innovation Index (GII), Babson, OECD - Entrepreneurship Measurement Framework, Doing Business (DB) and Global Competitiveness Index (GCI). Brief summary of the selected indices is presented. 1. The European Innovation Scoreboard (EIS), created by European Commission, postulates the main
domains grouped as Enablers, comprising Human resources, Finance and Support; Firm Activities comprising Firm investments, Linkages and Entrepreneurship; and Output comprising Innovators and Economic Effects. It was first published in 2001 and in 2017 performance is measured by 27 indicators structured around 4 main types: Framework conditions, Investments, Innovation Activities, and Impacts which are further developed into 10 Innovation Dimensions. Within the Framework conditions the dimensions are: Human Resources, Attractive Research Systems, and Innovation friendly. The dimensions of Investments are: Finance and Support, Firm Investment; Innovation activities are represented by the dimensions: Innovators, Linkages, Intellectual Assets; and Impacts have the dimensions: Employment, Sales. Each of the dimensions is represented by 2-3 indicators.
2. The Global Innovation Index (GII), co-published by INSEAD, World Intellectual Property Organization (WIPO) and Cornell University, GII has two sub-indices: input and output (Cornell University, INSEAD, and WIPO, 2017). The Input Sub-index covers the following domains: Institutions, Human Capital, Research Infrastructure, Market sophistication, and Business Sophistication. The Output Sub-index covers Knowledge, Technology and Creative Outputs. It comprises 83 indicators, referenced in the Report for 2017. The first version was created in 2008, and since then published annually.
3. Babson College - Babson Entrepreneurship Ecosystem Project, with Daniel Isenberg as the Project Leader defines an entrepreneurship ecosystem as “a set of networked institutions with the objective of aiding the entrepreneur to go through all the stages of the process of new venture development”. It consists of 6 domains: policy, finance, culture, supports, human capital, and markets (Isenberg, 2011).
4. The OECD framework is extensive, listing 57 key indicators to measure the determinants of entrepreneurship in a country (Organization for Economic Co-operation and Development (OECD) -
Policy
Finance
Culture
Supports
Human Capital
Markets

Entrepreneurship Measurement Framework). The OECD framework seeks to inform policy makers and help to create a sound base for internationally comparable indicators of entrepreneurship. Entrepreneurial activities, as defined in the Framework, represent “the pursuit of the generation of value through the creation or expansion of economic activity, by identifying and exploiting new products, processes or markets”. The OECD conceptualizes the ecosystem of entrepreneurship as the combination of three factors: opportunities, skilled people, and resources, represented by 6 key determinants: regulatory framework, market conditions, access to finance, R&D and technology, entrepreneurial capabilities, and culture. The OECD Framework also specifies the variety of indicators for measuring each of these determinants.
5. The World Bank’s Doing Business framework specifically focuses on policy and the enabling environment. The Report for 2018 (Doing Business, 2018) is the 15th annual report based on quantitative indicators on regulations and intellectual property rights protection that influences business activity. It covers 11 areas related to the ease of doing business: starting a new business, dealing with construction permits, getting electricity, registering property, getting credit, protecting minority investors, paying taxes, trading across borders, enforcing contracts, and resolving insolvency. The eleventh area is labor market regulation and it has not been included in this year’s Report.
6. Global Competitiveness Index (GCI) has been published by World Economic Forum (WEF). WEF has published for more than three decades Global Competitiveness Reports, and since 2005 WEF has based its competitiveness analysis on the GCI that “measures the microeconomic and macroeconomic foundations of national competitiveness” (WEF 2012-2013, pp 4). It comprises 12 pillars of competitiveness: Institutions, Infrastructure, Macroeconomic environment, Health and Primary education, Higher Education and training, Goods market efficiency, Labor market efficiency, Financial market development, Technological readiness, Market size, Business sophistication, and Innovation. Within the pillars there are multiple indicators organized according to some characteristics, adding up to the total of 115 indicators.
The different approaches can be classified based on the geographic unit of analysis, their level of detail, and their sector or domain focus. The comparative analysis based on their domain focus is conducted and the research results presented as the synthesis in Table 1. The Table presents the relevant domains found in 6 selected Global Indices, and the presence of a certain domain is designated in the concrete measurement index. The Table is constructed with the aim of comparing the degree of comprehensiveness of the domains and indicators in the selected six global indices. Table 1: Comparison of 6 Global Indices in relation to the relevant Domains
Domains GII EIS Babson OECD Doing
Business WEF- GCI
Policy x x x Finance x x x x Infrastructure x x x x x Markets x x x x Human Capital x x x x x Support/Services/Connections x x R&D/Innovation x x x x x Quality of Life x Macroeconomic Conditions x x x x Institutions x x Firms/Business x x x Health and Education x x
The comparative analysis synthesized in Table 1 shows that there is high correspondence between the indices in treating certain domains, i.e. Infrastructure, R&D/Innovation and Human Capital are considered in 5 Indices; Finance, Markets, and Macroeconomic Conditions in 4; Policy and Firms/ Business are considered in 3 indices. Support/Services/Connections, and Health and Education are treated by 2 indices, while only 1 Index treats the Quality of Life domain. It should be noted also that the most (9) of the 12 domains are measured by the WEF GCI, 8 domains are measured by GII, Babson and OECD, 5 by EIS, and DB reports on 2 domains. This leads to the conclusion that the selected indices under inspection cover a wide range of the domains and are comprehensive in treating the ecosystems. There is also a high degree of coincidence among them, indicating the tendency of covering multiple areas regardless of their main designation as being global innovation, entrepreneurship or competitiveness indices.
4. THE COMPETITIVE IEE FRAMEWORK: DEVELOPING A SMART POLICY MIX
Relevant literature review points to the general agreement that “it is important that policy makers develop metrics in order to determine the strengths and weaknesses of individual ecosystems so that their strengths
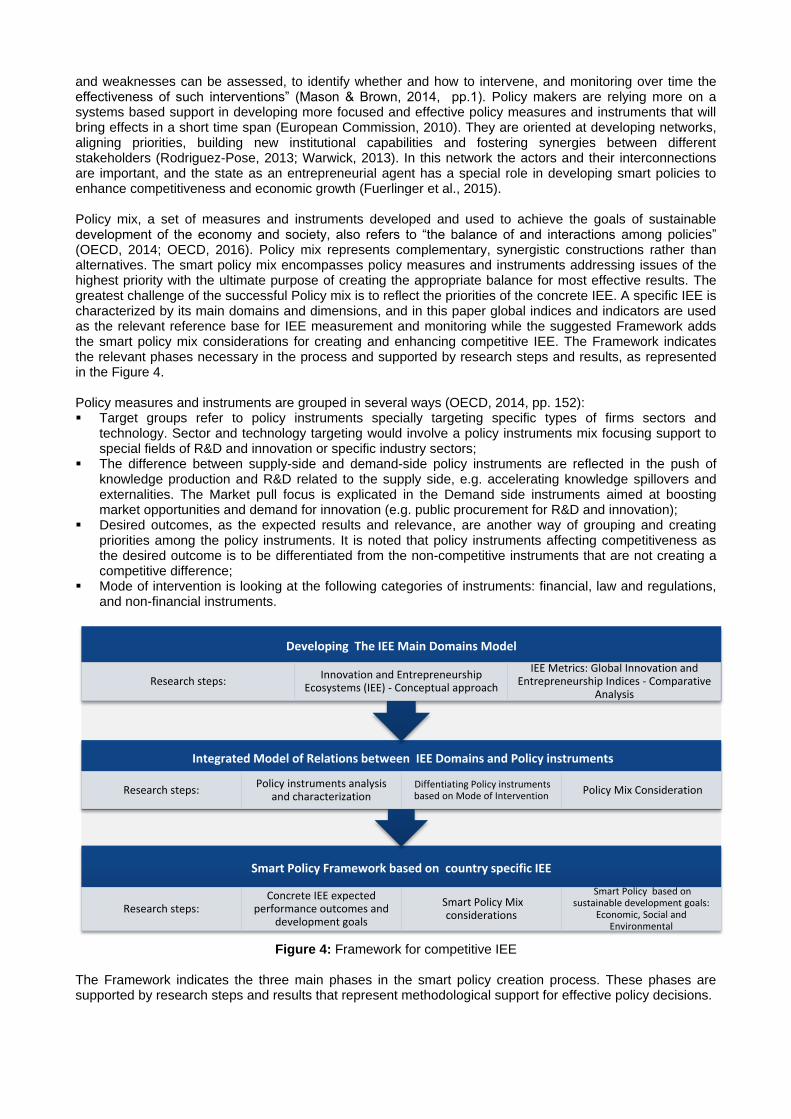
and weaknesses can be assessed, to identify whether and how to intervene, and monitoring over time the effectiveness of such interventions” (Mason & Brown, 2014, pp.1). Policy makers are relying more on a systems based support in developing more focused and effective policy measures and instruments that will bring effects in a short time span (European Commission, 2010). They are oriented at developing networks, aligning priorities, building new institutional capabilities and fostering synergies between different stakeholders (Rodriguez-Pose, 2013; Warwick, 2013). In this network the actors and their interconnections are important, and the state as an entrepreneurial agent has a special role in developing smart policies to enhance competitiveness and economic growth (Fuerlinger et al., 2015). Policy mix, a set of measures and instruments developed and used to achieve the goals of sustainable development of the economy and society, also refers to “the balance of and interactions among policies” (OECD, 2014; OECD, 2016). Policy mix represents complementary, synergistic constructions rather than alternatives. The smart policy mix encompasses policy measures and instruments addressing issues of the highest priority with the ultimate purpose of creating the appropriate balance for most effective results. The greatest challenge of the successful Policy mix is to reflect the priorities of the concrete IEE. A specific IEE is characterized by its main domains and dimensions, and in this paper global indices and indicators are used as the relevant reference base for IEE measurement and monitoring while the suggested Framework adds the smart policy mix considerations for creating and enhancing competitive IEE. The Framework indicates the relevant phases necessary in the process and supported by research steps and results, as represented in the Figure 4. Policy measures and instruments are grouped in several ways (OECD, 2014, pp. 152): Target groups refer to policy instruments specially targeting specific types of firms sectors and
technology. Sector and technology targeting would involve a policy instruments mix focusing support to special fields of R&D and innovation or specific industry sectors;
The difference between supply-side and demand-side policy instruments are reflected in the push of knowledge production and R&D related to the supply side, e.g. accelerating knowledge spillovers and externalities. The Market pull focus is explicated in the Demand side instruments aimed at boosting market opportunities and demand for innovation (e.g. public procurement for R&D and innovation);
Desired outcomes, as the expected results and relevance, are another way of grouping and creating priorities among the policy instruments. It is noted that policy instruments affecting competitiveness as the desired outcome is to be differentiated from the non-competitive instruments that are not creating a competitive difference;
Mode of intervention is looking at the following categories of instruments: financial, law and regulations, and non-financial instruments.
Figure 4: Framework for competitive IEE
The Framework indicates the three main phases in the smart policy creation process. These phases are supported by research steps and results that represent methodological support for effective policy decisions.
Smart Policy Framework based on country specific IEE
Research steps: Concrete IEE expected
performance outcomes and development goals
Smart Policy Mix considerations
Smart Policy based on sustainable development goals:
Economic, Social and Environmental
Integrated Model of Relations between IEE Domains and Policy instruments
Research steps: Policy instruments analysis
and characterization Diffentiating Policy instruments based on Mode of Intervention
Policy Mix Consideration
Developing The IEE Main Domains Model
Research steps: Innovation and Entrepreneurship
Ecosystems (IEE) - Conceptual approach
IEE Metrics: Global Innovation and Entrepreneurship Indices - Comparative
Analysis

5. CONCLUSION
The ecosystems approach enables capturing the main forces driving social development and economic growth. In the last decade, multiple global indices and indicators have been created for measuring innovation, entrepreneurship, and competitiveness thus leading to country ranking reports and indicating different positioning of countries based on these indices. Global innovation, entrepreneurship, and competitiveness indices are compared; it is found that there is a high degree of their correspondence, coincidence, and compatibility. They represent one of research steps in the suggested Framework related to the first phase: Developing the IEE Main Domains Model. It is argued that only with an integrated approach within a comprehensive Framework, consistent rankings between countries are made possible serving simultaneously as a valuable tool for policy makers to trace paths for improving the country’s position in respect to the potentials, capacities, and results in the domains of innovation, entrepreneurship, and competitiveness. The relevance of the suggested framework presented in the paper is found in its conceptual and methodological contributions to identifying relevant factors for better understanding of the crucial domains of the IEE. The focus is on policy decision making support in relation to recognizing opportunities, priorities and developing smart strategic solutions that fulfil economic, environmental, and social development goals. In the research, the bibliographical method and relevant literature review is mainly used for both theoretical considerations and empirical data found in the up-to-date reports and activities of relevant international bodies and organizations. Secondary data sources are used to argument and demonstrate the rationale of the comprehensive framework. It is viewed as a contribution to the ongoing, continuous efforts of research and development of the methodology for identifying, measuring the factors and forces that influence the upgrading of Innovation and Entrepreneurship Ecosystems on the scales of competitiveness and growth.
REFERENCES
Atkinson, R. D., & Correa, D. K. (2007). The 2007 State New Economy Index: Benchmarking Economic Transformation in the States. The Information Technology and Innovation Foundation.
Cornell University, INSEAD, and WIPO (2017). The Global Innovation Index 2017: Innovation Feeding the World. Ithaca, Fontainebleau, and Geneva.
Doing Business. (2018). Doing Business 2018: Reforming to Create Jobs. Washington DC: International Bank for Reconstruction and Development - The World Bank. Retrieved from: www.worldbank.orgis
EBRD Transition Report. (2014). Innovation in Transition. European Bank for Reconstruction and Development. Digital version available at: www.ebrd.com/documents/comms-and-bis/pdf-transition-
report-2014-english.pdf European Commission. (2010). EUROPE 2020 - A strategy for smart, sustainable and inclusive growth.
Brussels: European Commission. Fuerlinger, G., Fandl, U., & Funke, T. (2015). The role of the state in the entrepreneurship ecosystem:
insights from Germany. Triple Helix, 2(1), 3. Hao, J. X., Van Ark, B., & Ozyldirim, A. (2017). Signposts of Innovation: A Review of Innovation Metrics.
Economics Working Papers Series, The Conference Board. Isenberg, D. (2011). The entrepreneurship ecosystem strategy as a new paradigm for economic policy:
Principles for cultivating entrepreneurship. Presentation at the Institute of International and European Affairs.
Jovanovic, M., Rakicevic, J., Levi Jaksic, M., Petkovic, J., & Marinkovic, S. (2017). Composite Indices in Technology Management: A Critical Approach, in Jeremic, V., Radojicic, Z., Dobrota, M. (eds), Emerging Trends the Development and Application of Composite Indicators. IGI Global, USA.
Levi Jaksic, M., Marinkovic, S., Petkovic, J., Rakicevic, J., & Jovanovic, M. (2018). Tehnolosko preduzetnistvo. Beograd: FON.
Mason, C., & Brown, R. (2014). Entrepreneurial ecosystems and growth oriented entrepreneurship. OECD LEED Programme.
Moore, J. F. (1993). Predators and prey: a new ecology of competition. Harvard business review, 71(3), 75-86.
OECD. (2014). Science, Technology and Industry Outlook 2014. OECD Publishing. OECD. (2016). Science, Technology and Industry Outlook 2016. OECD Publishing. Rodriguez-Pose, A., (2013). Do Institutions matter for regional Development?. Regional Studies, 47, 1034-
1047. Rosted, J. (2012). Understanding Business Ecosystems. FORA Group. Warwick, K. (2013). Beyond industrial policy: Emerging issues and new trends. OECD Science, Technology
and Industry Policy Papers/Ken Warwick. OECD Lilibrary: website, (2), 57. WEF (2012-2013). The Global Competitiveness Index 2012-2013: Strengthening Recovery by Raising
productivity. World Economic Forum.

THE ROLE OF SUPPORT ORGANIZATIONS IN TECHNOLOGY ENTREPRENEURSHIP ECOSYSTEM: CASE OF SERBIA
Jovana Rakićević*1, Maja Levi Jakšić
1, Nina Ukropina
1
1University of Belgrade, Faculty of Organizational Sciences
*Corresponding author, e-mail: [email protected]
Abstract: Both academia and policy makers observe technology entrepreneurship as one of the most important forces influencing economic growth and development of countries. To flourish and grow, technology entrepreneurship needs special supportive environment. In this sense, competitive entrepreneurial ecosystems are seen as necessary complex “mechanisms” enabling firms with high growth potential to advance and expand. In this paper we focus on “support” as one domain of the ecosystem. Science parks, incubators, accelerators and other supporting organizations are recognized as important policy tools for supporting innovation and technology-oriented entrepreneurial growth by providing critical value-added inputs. In this paper we examine the role of support in an entrepreneurial ecosystem, systematizing different forms of institutional support, and classifying the services they provide; and further conduct a secondary research on support provided in Serbia, on a sample of eight organizations oriented towards technology entrepreneurship development and promotion in Serbia. This analysis could serve the needs of different actors in the technology entrepreneurship ecosystem in the following manner: (1) entrepreneurs – to better understand the help supporting organizations could offer, and recognize the possibility and necessity to interact, (2) policy makers – to identify the level of development of support to techno-entrepreneurship development as a domain of Serbian entrepreneurship ecosystem, (3) support organizations – to benchmark in the ecosystem, trying to further develop and grow, and (4) researchers – to identify future research directions in the rich field of support to technology entrepreneurship development. Keywords: technology entrepreneurship, technology start-up, ecosystem, support, forms of support.
1. INTRODUCTION
Entrepreneurship, especially technology (technological, hi-tech or techno-) entrepreneurship has significant importance in today’s business. Over the last two decades it attracts high interest of both academicians and policy makers due to its high impact on economic growth, innovation, job creation and well-being of countries, changing the overall living standards and work conditions (Kirchhoff, Linton & Walsh, 2013; Mosey, Guerrero, & Greenman, 2017; Ratinho, Harms, & Walsh, 2015). However, although technology entrepreneurship has been recognized as a driver of prosperity in individuals, firms, regions, and nations (Bailetti, 2012), a unified framework for understanding technology entrepreneurship and assessing its value does not exist (Sobel and Clark, 2017). The definition of Technology entrepreneurship has been emerging in time with the need to focus on technology and innovation as a necessary constituent of entrepreneurship, thus making a difference in comparison to the widespread understanding of entrepreneurship being any new business in the early stages of development. The discussions are still open on what the real entrepreneur does, but the “technology” in the new entrepreneurship concept emphasizes the difference to the entrepreneurship of a person who opened a candy shop last week and is considered as an entrepreneur. Technology entrepreneurs create new values and boost the economic growth of a country. Steve Blank, one of the most important entrepreneurs of today, defines technology start-up as “a temporary organization formed to search for a repeatable and scalable business model”. Paul Graham, founder of the Y-Combinator, the most famous accelerator in the world, defines a technology start-up with only one word “growth” (Vukanovic, Andric, & Nesic, 2016). Academicians offer different definitions. Beckman et al. (2012) define technology entrepreneurship as the interface of two well-established, but related fields – entrepreneurship and technological innovation. Bailetti (2012) defines it as “an investment in a project that assembles and deploys specialized individuals and heterogeneous assets that are intricately related to advances in scientific and technological knowledge for the purpose of creating and capturing value for a firm”. Byers, Dorf and Nelson (2011) highlight the task technology entrepreneurs have in bringing together the technical world and the business world in a profitable way. Eric Ries (2011), author of the bestseller “The Lean startup”, defines a start-up as “a human institution designed to deliver a new product or service under conditions of extreme uncertainty”. It is obvious that technology entrepreneurship lacks a unique definition. According to Bailetti (2012), unless a generally accepted definition is established, the debates on technology entrepreneurship lose their focus.

However, one thing is certain, technology entrepreneurship, whether academic or technical, requires a special supportive environment (Runge, 2014). It is the ecosystem that creates the fertile grounds for the firms with the high growth potential to develop and flourish. In the dynamic ecosystem there is more opportunity for firms to emerge, grow and create employment (Ben Letaifa, Gratacap, & Isckia, 2013). The concept of entrepreneurship ecosystem puts the firm in the heart of the ecosystem, “surrounding” it by various elements. Technology entrepreneurship ecosystem comprises of a dozen or so elements which interact in very complex ways. They are always present if entrepreneurship is self-sustaining. Hao, Van Ark and Ozyildirim (2017) identify external innovation ecosystem as one of six major signposts of innovation. Based on the Oslo Manual (OECD, 2005), they identify six elements of the ecosystem – The firm, Education and public research system, Innovation policies, Market demand, customers, and buyers, Other firms (suppliers, contractors, partners, and joint ventures), and Infrastructure and institutions. As defined by Isenberg (2011) technology entrepreneurship ecosystem includes six domains: a conducive policy, markets, capital, human skills, culture, and supports. In this paper we focus on “support” as a domain of technology entrepreneurship ecosystem. We concentrate on centers, organizations that provide support for technology entrepreneurship development. They are usually identified as providers of infrastructural support, but have developed and overcame that basic role over time. In this paper we identify the role they have in an entrepreneurial ecosystem and classify the services they provide to enable firms to develop and grow. A special emphasis is put on a comparative analysis of organizations working in Serbia. A secondary research is performed on a sample of eight organizations oriented towards technology entrepreneurship development and promotion is Serbia. For the purpose of identifying and classifying the services they offer, we adapt the model provided by Fomiene (2010) and analyze the observed institutions in accordance with the proposed adapted model. The paper is organized as follows. Section 2 briefly defines different forms of support centers for technology entrepreneurship development, and emphasizes the importance of the incubation and acceleration process in developing technology start-ups. Section 3 presents a comparative analysis of support centers in Serbia and discusses the results. Section 4 concludes and presents the limitations, as well as future work directions.
2. SUPPORT CENTERS FOR TECHNOLOGY ENTREPRENEURSHIP DEVELOPMENT – DEFINITION AND CLASSIFICATION
Entrepreneurs need support, especially in overcoming problems in the start-up phase (Karlan & Valdivia, 2011). They need an environment that offers different mechanisms of support aimed at boosting innovation activity of firms – from infrastructural support to financing and different intangible services like mentorship, training, education, networking etc. Various organizations offer different mechanisms of support by providing critical value-added inputs essential for the creation and development of innovative technology-based firms. Mian, Lamine, and Fayolle (2016) introduce Technology Business Incubation as a significant field of study and practice. A variety of incubation mechanisms have evolved (Bruneel et al., 2012) over the past decades. They were introduced by universities, policy makers, corporations, research institutes, private investors, etc., contributing to nurturing and boosting new venture creation. Barbero et al. (2012) highlight the importance of examining the impact these organizations have on incubated ventures, taking into account different models of incubation (Barbero et al., 2014). Still, determining what type of mechanisms are most helpful in achieving the desired results is very much mission-driven and context-specific (Mian, Lamine, & Fayolle, 2016). The most usual forms of support to techno-entrepreneurship development are business incubators, science and technology parks, technology transfer offices, business accelerators, angel investors, venture capital funds etc. This is not a closed list. Business incubators are generally defined as organizations that support and help the growth and survival of new companies. They are often seen as places where recently established companies are concentrated in a limited space (Aranha, 2003). There is no one classification of business incubators, but it depends on the criteria used for classification. Secondly, it depends on the definition of incubator an author follows. In Table 1 we systematize several existing approaches to business incubators classification. This is certainly not the final, nor the closed list. Observing this limited literature review presented in the table we capture an evident call for systematic classification of incubators with the aim to better understand their position and potential in the ecosystem, and also to better define and clarify their role in providing help for developing new entrepreneurial ventures based on new technologies. De Bem Machado, Catapan and Sousa (2018) stress that among wide literature on business incubators models, observed as transformation mechanisms, there is a lack of detailed explanation of the incubation process and best management practices for the continuous improvement of incubated business. Fomiene (2010) explains how business incubator services and support vary depending on a certain business incubator lifecycle (establishment phase, growing/business development phase, or final maturity phase).

Table 1: Classification of business incubators by authors
Source Classification criteria Business incubator forms
Allen and McCluskey (1991)
Source of value added For-profit property development, Not-for-profit development corporation, Academic, For- profit seed capital, Hybrid, Corporate.
Aranha (2003) Leading institution Incubators linked to the “leader sponsor”: university/academic, community, industrial, government, venture capital, consortiums, corporate, franchises, NGOs, cooperatives, unions.
Strategic aim Incentives to the enterprise culture, Support for minorities, Research and development, Economic development, The creation of jobs and the generation of employment, University – company relations, Opportunity for risk capital, Exports / internationalization, Development of non-profit making companies (third sector), The formation of productive clusters/arrangements, Induction by demand.
Localization Urban, Suburban, Rural, Industrial.
Operational model Bricks and Mortar (BAM), Virtual/portal/”without walls”, Hub/venture incubator, “Eggubator”.
Purpose of enterprise For-profit – Real Estate Development and Cooperatives, Non-profit – Academic Related or Technology Commercialization
Focus Traditional, Mixed, Cultural, Technological, Social, Agro industrial, Services/consultancy, Target.
Becker and Gassmann (2006)
Source and type of technology Fast-profit incubators, Market incubators, Leveraging incubators, In-sourcing incubators.
Clarysse et al. (2005)
Level and complexity of activities performed and heterogeneity of resources deployed
Low selective model, Supportive model, Incubator model.
European Commission and CSES (2002)
Technology level and management support
Industrial estate, Business park, Science park, Managed Workshop, Enterprise centre, Innovation centre, Multipurpose business incubator, Business and innovation centre, Technology centre.
Grimaldi and Grandi (2005)
Needs and requirements of new ventures
Business innovation centre, University business incubator, Corporate business incubator, Independent business incubator.
Von Zedtwitz (2003) Degrees of competitive focus (segment, industry, geography)
Independent commercial incubators, Regional business incubators, University incubators, Company-internal incubators, Virtual incubators.
Contemporary theory and practice identify business accelerators as a new-generation form of support for technology entrepreneurship development. Accelerators are organizations that provide specific incubation services, focussed on education and mentoring, during an intensive program of limited duration with the aim to accelerate successful venture creation (Cohen and Hochberg, 2014; Miller and Bound, 2011; cited in Pauwels, 2016), helping them to “define and build their initial products, identify promising customer segments, and secure resources, including capital and employees” (Cohen, 2013). “Business accelerator” cannot be used interchangeably with “business incubator”. As Fernando Sapulveda, managing director of Impulsa Business Accelerator notes “business incubators mentor companies through childhood while business accelerators guide them through adolescence into adulthood”. Miller and Bound (2011) stress that

accelerators have a greater impact on the success of entrepreneurial ventures in relation to incubators. Business accelerators usually offer three-months programmes of support. Programmes include initial funding, work space, networking, education and training by mentors. Corporate accelerators stand out as novel models of nurturing innovations from entrepreneurial ventures. However, large differences between corporations and start-ups make collaboration challenging, since these accelerators need to be designed in a two-fold way – to add value for the entrepreneurs, but also to make company benefit from this business model innovation (Kohler, 2016). Science and technology parks are observed as locations fostering local knowledge exchange and promoting innovation. In recent years they have attracted significant attention and public funds (Vásquez-Urriago et al., 2014). Díez-Vial and Fernández-Olmos (2015) evaluate the role of science and technology parks as locations fostering local knowledge exchange and promoting innovation, considering that knowledge transfer depends on firms’ internal capacity to understand and exploit others’ knowledge, which depends on their own knowledge base. Albahari et. al (2017) explore the role of University in both Technology Parks and Science Parks and report the differences. Another important form of support are business angels or angel investors – “individual investors, or groups of individual investors, who provide seed capital and varying amounts of advice to young firms” (Cohen, 2013). Those are individuals who provide capital for a start-up business, usually in exchange for convertible debt or ownership equity. Cohen (2013) provides a comparative analysis of business incubators, angel investors and accelerators based on: process duration, cohorts, business model, selection, venture stage, education, mentorship, and venture location, and highlights the difference among them. Teker and Teker (2016) explore the differences between business angels and venture capital funds regarding the way of doing business. Venture capital firms are seen to play a different and more proactive role in emerging markets as an “ecosystem engineer”, turning a weak innovation ecosystem into a productive and robust one (Sun et al., 2018). Venture capital funds are able to build companies from the simplest form to mature organizations. Further definition, classification, differentiation and in-depth analysis of various forms of support are omitted for the reason of space limitation per paper.
3. RESEARCH – COMPARATIVE ANALYSIS OF SERBIAN SUPPORT CENTRES
Serbia proves to be a fertile ground for technology entrepreneurship development (Rakicevic, Levi Jaksic, & Jovanovic, 2016). Strawberry energy, Nordeus, FishingBooker or ActiveColab are just some of the examples that confirm it is possible to start and develop a globally successful company, starting as a technology start-up in Sebia. Law on innovation activity of the Republic of Serbia ("Official Gazette of the RS", No. 110/2005, No.18/2010 and No. 55/2013) defines organizations for rendering infrastructural support to innovation activity in the following manner: 1) business and technology incubator; 2) science and technology park; 3) organization for stimulation of innovation activities in the priority field of science and technology; and 4) centre for transfer of technologies. In the Analysis of Business Support Infrastructure in the Republic of Serbia conducted by the National agency for regional development of Serbia (Mijacic, 2011) it is reported that since 2005, the number of business support infrastructure entities has been constantly growing and their capacities have become more significant. However, Mijacic (2011) compares incubators in Serbia to an owner of luxury car who cannot afford to buy fuel, since most incubators are placed in new or completely renovated premises, equipped with the latest technical equipment, modern office furniture, and fast internet connection, but are financially unsustainable. Funds they receive from services are not sufficient to cover even basic operational costs. Still, it is encouraging to note that Strategy for the support to development of SME, entrepreneurship and competitiveness 2015-2020 and the Action plan for the implementation defines “Optimisation and improvement in the level of utilization of current business infrastructure and the development of a new one” as a specific goal of the defined strategic goal “Enhancing sustainability and competitiveness of SMEs”, showing that the government recognizes the relevance of this issue to entrepreneurship development.
3.1. The sample and data collection
The research sample comprises of eight support organizations oriented towards technology entrepreneurship development and promotion in Serbia: SEE ICT – StartIT, ICT Hub, StartLabs, Serbian Venture Network – SeVeN, Business-Technology Incubator of Technical Faculties – BITF, Science-Technology Park Belgrade, Nova Iskra, and Impact Hub. All data used in the research are collected from the secondary sources – websites of the observed organizations over the period April – May 2018.

StartIT (https://startit.rs/) is a project of non-profit organization SEE ICT which is a pioneer in developing technology entrepreneurship scene in Serbia. Its main goal is to encourage Serbian technological progress, focusing primarily on domestic IT scene. It operates in several Serbian cities, developing strong network of tech-professionals throughout the whole country. It offers educative and informative programmes, space and mentorship, both external and internal. Major projects are the startit.rs portal, Startup academy, StartIt centre, “Potkrovlje Hub”, Social change hackathon and others. ICT Hub (http://startup.icthub.rs/) is one of the leading organizations in Serbia oriented towards techno-entrepreneurship development. It is located in Science and Technology Park Belgrade. Besides the co-working space, it offers various forms of support to ICT professionals and tech-entrepreneurs through programmes of education, mentorship, networking, and by connecting Serbian startup ecosystem with the leading ecosystems worldwide. ICT Hub ecosystem comprises of ICT Hub start-up, ICT Hub Playground, ICT Hub Corpo Lab, and ICT Hub Venture. Serbian Venture Network – SeVeN (https://www.seven.rs/) is an association committed to development of start-up and entrepreneurship ecosystem in Serbia and South-East Europe. It promotes equity-based investment models and support startups, innovative entrepreneurs and fast growing companies in acquiring investments for their development. Major project is Belgrade Venture Forum (BgVF) – largest investment forum in the region, dedicated to promotion of entrepreneurship and investments in innovative companies and ideas. StartLabs (http://startlabs.co/) is a US based fund investing in startups from South-East Europe. They provide funding, mentorship, office space, technical infrastructure, business services and networking channels to exceptional entrepreneurs and their teams helping them turn ideas into sustainable business. Business Technology Incubator of Technical Faculties - BITF (http://bitf.rs/) has been established as a partnership between the four technical faculties of the University of Belgrade (Civil Engineering, Mechanical, Electrical and Technological/Metallurgical), the Municipality of Palilula and the Democratic Transition Initiative. The establishment has also received support from the Organization for Security and Cooperation in Europe (OSCE). Main goal is to provide various forms of support to entrepreneurs in the early stage of business development in the form of subsidized overhead, administrative assistance, as well as business counseling. Science-technology park Belgrade (https://www.ntpark.rs/) is established by the RS Government (represented by the Ministry of Education, Science and Technological Development), the City of Belgrade and the University of Belgrade, “with the aim to create a favorable environment for developing links between industry and science and research organizations and universities, knowledge transfer, new technology development, innovation commercialization, networking and stimulating growth in the knowledge-based economy”. It is becoming a new technology core of the Belgrade city that brings together domestic and foreign high-tech development companies and promotes start-ups by creating a favorable environment to innovation, technology development and competitiveness. Impact Hub (https://belgrade.impacthub.net/) is a global network of individual hubs all over the world. It operates with a goal to develop a strong network of startups, and has its office space in Belgrade. It offers services of renting the space, co-working and launch pad program, consisting of mentorship and investment in startups. This hub’s primary focus is on startups that are dealing with social challenges in fields of agro-tech, clean energy, local production, health, culture and education, but it also welcomes startups that come from IT and tech industries. Nova Iskra (http://novaiskra.com/) is the first creative hub in the Balkans, which represents the community of freelancers, startups and creative entrepreneurs. It enables space, initiates collaboration and organizes education programs for innovators, entrepreneurs, students, professionals and organizations. Its goal is to provide network between creative industries, technology and people.
3.2. Comparative analysis – results and discussion
Fominienė (2010) synthesizes and differentiates three types of support services provided by incubators: tangible services, intangible services, and financial support. Tangible services refer to office rent (office space, common use premises, incubator postal address, and equipment) and office space (secretarial services, internet, fax, and copying services); Intangible to process services (consulting, training, and maintenance) and network services (internal and external); and financial support to internal and external funding. We expand this model by differentiating various extra services classified by the given categories (Table 2, column 3). Also, we add the fourth category named “additional support” which refers to services oriented towards creation of positive and attractive work environment in which entrepreneurs are supposed to be more motivated, inspired and satisfied. Thus, we adjust the model for systematization of services provided by different support organizations. Afterwards, we map the supporting organizations in Serbia to the mentioned categories. All with the aim to identify the development level and role these organizations have in boosting new tech-firms development and growth in Serbia. Table 2 presents the comparative analysis.

Tab
le 2
: Com
para
tive a
naly
sis
of e
ight o
rgan
izatio
ns th
at s
up
port te
chno
log
y e
ntre
pre
neurs
hip
de
ve
lopm
ent in
Serb
ia –
cla
ssific
ato
n o
f pro
vid
ed s
erv
ices
Se
rvic
es
pro
vid
ed
S
tartIT
IC
T
Hu
b
Se
Ve
N
Sta
rt L
ab
s
BIT
F
ST
P
Be
lgra
de
Imp
ac
t H
ub
N
ova
Is
kra
Ta
ng
ible
O
ffice
ren
t O
ffice
sp
ace
x
x
x
x
x
x
x
Com
mon
use
pre
mis
es
x
x
x
x
x
x
x
Incub
ato
r po
sta
l ad
dre
ss
x
x
x
x
x
x
x
Eq
uip
me
nt –
ha
rdw
are
an
d s
oftw
are
x
x
x
Offic
e e
qu
ipm
en
t x
x
x
x
x
x
Offic
e s
erv
ice
s
Lo
gis
tica
l an
d te
ch
nic
al s
up
port
x
x
x
x
x
Le
ga
l
x
x
x
x
x
Accou
ntin
g
x
x
x
x
x
Ma
rke
ting
, pro
motio
n
x
x
x
x
x
x
x
Pro
du
ct d
esig
n
x
x
x
x
Assis
tan
ce
with
bu
sin
ess, s
trate
gic
an
d m
ark
etin
g p
lan
x
x
x
x
x
x
x
Ea
sie
r access to
ma
rket
x
x
x
x
x
Inte
rnet
x
x
x
x
x
x
x
Te
lep
ho
ne
, Fa
x
x
x
x
x
x
x
x
Inta
ngib
le
Pro
cess s
erv
ice
s
Con
sultin
g
x
x
x
x
x
x
x
x
Tra
inin
g
x
x
x
x
x
x
x
Ed
uca
tion –
pro
gra
mm
e o
f lectu
res a
nd
wo
rksh
ops
x
x
x
x
x
x
Me
nto
ring
– “o
ne
on
one
” se
ssio
ns
x
x
x
x
x
x
x
x
Me
nto
ring
– m
en
tors
hip
pro
gra
mm
e
x
x
x
x
x
x
Inte
rnatio
na
l me
nto
ring
x
x
x
x
x
x
x
Ma
inte
na
nce
x
Certific
atio
n
x
Accele
ratio
n p
rog
ram
me
x
x
Netw
ork
se
rvic
es
Inte
rnal n
etw
ork
x
x
x
x
x
x
x
x
Exte
rna
l ne
two
rk
x
x
x
x
x
x
x
x
Fin
ancia
l su
ppo
rt B
usin
ess in
cub
ato
r fun
ds
x
x
x
Gra
nts
by o
uts
ide
inve
sto
rs
x
x
x
x
x
Ad
ditio
nal s
up
po
rt R
ela
xin
g, p
layg
rou
nd
are
a
x
x
x
x
Fre
e p
ark
ing
sp
ace
x
x
Refre
shm
ent fo
r free
x
x
x
x
Fre
e lib
rary
x
x
x
x
Pe
t frien
dly
x
x
x
x
24
/7
x
Sh
ow
er
x
Com
mun
ity b
ar o
r kitc
he
n
x
x
x
Ph
oto
eq
uip
men
t
x
Lo
cke
r
x
x
x
Yo
ga
an
d w
ork
ou
t
x
x
So
cia
lizin
g e
ve
nts
/pa
rties
x
x
x

The analysis shows the highest correspondence between the observed institutions regarding: (1) the first group of tangible services – office rent (only equipment reflected in hardware and software is present in three out of eight organizations); (2) office services: business counseling observed as legal support, accounting, marketing, promotion, product design, etc. is present in all organizations, in different forms. This is not the closed list of counseling services they provide, since it depends on the needs of each start-up. As stated on STP website, they offer “access to business counseling in a wide range of areas affecting successful business results, including: business development and planning, intellectual property protection, marketing, management and other areas depending on their needs”. Basic technology infrastructure (internet, telephone) shows to be usual form of support in all centres; and (3) network services – all of them offer networking both internal and external. The largest discrepancy is captured in the following process services: acceleration, certification, and maintenance. Only the STP offers support in the process of certifying products, processes and services in compliance with national and international standards. Observing the fourth dimension, there are organizations that do not provide this Additional support. It seems to be the trend of modern hubs opened from 2010 onwards. Regarding financial support, it is interesting to notice that a few of them have internal funding. ICT hub, for example, has its own VC fund, initially offering up to 50.000 Euros in exchange for 5 - 15% equity with a possibility for follow-on investment. Impact Hub has its group of angel investors who offer 20.000 Euros for 7% ownership. Observing the results in general, SeVeN mostly differs from other organizations. Still, we should highlight that we were not able to identify the business counseling services they offer since on the website it is stated that they offer “advocacy efforts, providing business advisory and consultancy services to companies seeking investment”. Results indicate that ICT Hub and Impact Hub offer the widest range of services, while STP offers some unique services. The range of services depends on the purpose and mission of each organization. Therefore, the future work should address the type of support organizations for better classification and analysis. Throughout the analysis, we identified another important business aspect which could be named “openness towards community” which refers to the programmes of support like young talent pool creation, open workshops and trainings, and different events which are not oriented directly towards development of a specific start-up, but towards promotion and rising awareness of technology entrepreneurship concept among population. They highly recognize the importance of future generations and their education in the process of strengthening the national economy and the domestic entrepreneurial ecosystem. Additionally, it is noticed that these organizations are being oriented towards achieving sustainable development goals, dealing with different social and environmental issues.
4. CONCLUSION AND FUTURE WORK
Technology entrepreneurship needs supportive environment to flourish and grow. In this paper we identify the role of different supporting organizations in an entrepreneurial ecosystem, and base our study on classification of support services provided by Fominienė (2010). We expand the proposed model firstly by differentiating various additional services, classified in the proposed categories: tangible services, intangible or “value-added” services, and financial support. Secondly, we add the fourth category “Additional services” which refer to positive and attractive work environment in which entrepreneurs are supposed to be more motivated, inspired, and satisfied. This includes e.g. relaxing, playground area, free parking space, refreshment for free, free library, pet friendly space, 24/7 working hours, shower, community bar and others. Using this expanded model, we perform a comparative analysis of eight support organizations for technology entrepreneurship development operating in Serbia. The results show that Serbian supporting organizations offer a wide range of support services – from infrastructure to financing, mentoring, providing acceleration programmes, education programmes, networking etc. The results are discussed in section 3. Additionally, they overcome their basic role in an entrepreneurial ecosystem where they are oriented at development of specific start-ups (tenants), operating as technology entrepreneurship “enlighteners” of the community. Common values and goals are increasingly becoming an added value that holds the connection between the support organizations and their startups. This research should be considered as a pilot research since it relies on the secondary data collected from the web sites of the observed organizations. To provide a more comprehensive insight and preciseness into the state of support organizations for technology entrepreneurship development in Serbia, a primary research should be conducted through the interviews with the organizations’ management. This way we could provide a fine tuned service classification and better understanding of the level of development of supporting organizations in Serbia. Authors recognize this issue as the future work direction.

ACKNOWLEDGEMENT
This paper is a result of Strategic Project founded by the Ministry of Education, Science and Technological Development of the Republic of Serbia: Exploring modern trends of strategic management by application of specialized management disciplines in the function of the competitiveness of Serbian economy, No 179081.
REFERENCES
Allen, D. N., & McCluskey, R. (1991). Structure, policy, services, and performance in the business incubator industry. Entrepreneurship Theory and Practice, 15(2), 61-77.
Aranha, J. A. S. (2003). Incubator Models. InfoDev Incubator Support Center. Retrieved 27 4 2018, from: https://auic.ajman.ac.ae/upload/library/global-incubation-models/Global_Incubator_Models_-_InfoDev.pdf
Bailetti, T. (2012). Technology entrepreneurship: overview, definition, and distinctive aspects. Technology Innovation Management Review, 2(2), 5-12. DOI: 10.1007/s10961-015-9462-3
Barbero, J. L., Casillas, J. C., Ramos, A., & Guitar, S. (2012). Revisiting incubation performance: How incubator typology affects results. Technological Forecasting and Social Change, 79(5), 888-902.
Barbero, J.L., Casillas, J.C., Wright, M., & Garcia, A.R. (2014). Do different types of incubators produce different types of innovations?. Journal of Technology Transfer, 39 (2), 151–168.
Becker, B., & Gassmann, O. (2006). Gaining leverage effects from knowledge modes within corporate incubators. R&D Management, 36 (1), 1–16.
Beckman, C. M., Eisenhardt, K., Kotha, S., Meyer, A., & Rajagopalan, N. (2012). The role of the entrepreneur in technology entrepreneurship. Strategic Entrepreneurship Journal, 6(3), 203–206. DOI: 10.1002/sej.1136
Ben Letaifa, S., Gratacap, A., & Isckia, T. (2013). Understanding Business Ecosystems: How Firms Succeed in the New World of Convergence? Belgium: De Boeck Supérieur.
Bruneel, J., Ratinho, T., Clarysse, B., Groen, A., (2012). The evolution of business incubators: comparing demand and supply of business incubation services across different incubator generations. Technovation 32 (2), 110–121.
Clarysse, B., Wright, M., Lockett, A., Van de Velde, E., & Vohora, A. (2005). Spinning out new ventures: a typology of incubation strategies from European research institutions. Journal of Business Venturing, 20(2), 183-216.
Cohen, S. (2013). What do accelerators do? Insights from incubators and angels. Innovations: Technology, Governance, Globalization, 8(3-4), 19-25.
De Bem Machado, A., Catapan, A. H., & Sousa, M. J. (2018). Incubators Management Models. In Handbook of Research on Strategic Innovation Management for Improved Competitive Advantage (pp. 85-95). IGI Global.
Díez-Vial, I., & Fernández-Olmos, M. (2015). Knowledge spillovers in science and technology parks: how can firms benefit most?. The Journal of Technology Transfer, 40(1), 70-84.
European Commission, & Centre for Strategy and Evaluation Services (CSES). (2002). Benchmarking of business incubators: Final Report.
Grimaldi, R., & Grandi, A. (2005). Business incubators and new venture creation: an assessment of incubating models. Technovation, 25(2), 111-121.
Hao, X. J., Van Ark, B., & Ozyildirim, A. (2017). Signposts of Innovation: A Review of Innovation Metrics. The Conference Board Economics Program Working Paper No. 17-01. Retrieved from:
Isenberg, D. (2011). The entrepreneurship ecosystem strategy as a new paradigm for economic policy: Principles for cultivating entrepreneurship. Presentation at the Institute of International and European Affairs.
Karlan, D., & Valdivia, M. (2011). Teaching entrepreneurship: Impact of business training on microfinance clients and institutions. The Review of Economics and Statistics, 93(2), 510–527.
Kirchhoff, B. A., Linton, J. D., & Walsh, S. T. (2013). Neo‐Marshellian Equilibrium versus Schumpeterian Creative Destruction: Its Impact on Business Research and Economic Policy. Journal of Small Business Management, 51(2), 159-166. DOI: 10.1111/jsbm.12018
Kohler, T. (2016). Corporate accelerators: Building bridges between corporations and startups. Business Horizons, 59(3), 347-357.
Mian, S., Lamine, W., & Fayolle, A. (2016). Technology Business Incubation: An overview of the state of knowledge. Technovation, 50, 1-12.
Mijacic, D. (2011). Analysis of Business Support Infrastructure in the Republic of Serbia. Belgrade: National Agency for Regional Development.
Miller, P., Bound, K. (2011). The Startup Factories: The Rise Of Accelerator Programmes To Support New Technology Ventures. London: NESTA.
Mosey, S., Guerrero, M., & Greenman, A. (2017). Technology entrepreneurship research opportunities: insights from across Europe. The Journal of Technology Transfer, 42(1), 1-9.
OECD. (2005). Oslo Manual (3rd
edition). Available at: https://www.oecd.org/sti/inno/2367580.pdf
Pauwels, C., Clarysse, B., Wright, M., & Van Hove, J. (2016). Understanding a new generation incubation model: The accelerator. Technovation, 50, 13-24.
Rakicevic, J., Levi Jaksic, M., & Jovanovic, M. (2016). Index of potential for technology entrepreneurship development: practice from Serbia. Proceedings of the XV International symposium SymOrg 2015: Reshaping the Future through Sustainable Business Development and Entrepreneurship, FON, Zlatibor, 10.-13.06.2016.
Ratinho, T., Harms, R., & Walsh, S. (2015). Structuring the technology entrepreneurship publication landscape: Making sense out of chaos. Technological forecasting and social change, 100, 168-175. DOI: 10.1016/j.techfore.2015.05.004
Ries, E. (2011). The Lean Startup: How Today's Entrepreneurs Use Continuous Innovation To Create Radically Successful Businesses. Crown Books.
Runge, W. (2014). Technology Entrepreneurship: A Treatise on Entrepreneurs and Entrepreneurship for and in Technology Ventures (Vol. 2). KIT Scientific Publishing.
Sobel, R. S., & Clark, J. R. (2017). The use of knowledge in technology entrepreneurship: A theoretical foundation. The Review of Austrian Economics, Online first article. DOI: 10.1007/s11138-017-0380-5
Sun, S. L., Chen, V. Z., Sunny, S. A., & Chen, J. (2018). Venture capital as an innovation ecosystem engineer in an emerging market. International Business Review. Article is press.
Teker, S., & Teker, D. (2016). Venture capital and business angels: Turkish case. Procedia-Social and Behavioral Sciences, 235, 630-637.
Vásquez-Urriago, Á. R., Barge-Gil, A., Rico, A. M., & Paraskevopoulou, E. (2014). The impact of science and technology parks on firms’ product innovation: empirical evidence from Spain. Journal of Evolutionary Economics, 24(4), 835-873.
Von Zedtwitz, M. (2003). Classification and management of incubators: aligning strategic objectives and competitive scope for new business facilitation. International Journal of Entrepreneurship and Innovation Management, 3(1-2), 176-196.
Vukanovic, D., Andric, K., & Nesic, S. (2016). How to start a technological start-up in Serbia - A manual for starting your own business in the field of technological entrepreneurship in the ICT sector. ICT-Hub, Science technology park, Belgrade. Retrieved from: http://www.novipocetak.rs/wp-content/uploads/2015/10/Kako-pokrenuti-tehnolo%C5%A1ki-start-up-u-Srbiji.pdf

CREATING ENTREPRENEURIAL ECOSYSTEM THROUGH UNIVERSITIES SPIN OFF AND STARTUP COMPANIES - EXAMPLE OF THE UNIVERSITY OF NOVI SAD
Aleksandar Vekić*1, Jelena Borocki
1, Angela Fajsi
1
1 University of Novi Sad, Faculty of Technical Sciences, Serbia
*Corresponding author, e-mail: [email protected]
Abstract: An entrepreneurial idea carries great challenges and opportunities with it, and as such is the research subject in many fields. Creation of innovative entrepreneurial ideas and development of a real business based on them is a mission of all modern societies. Universities play important role in this process, as well as facilitating connection between entrepreneurs, and connecting them with other relevant subjects. In this way, the development of entrepreneurial ecosystems is emerging, as unique leverage of development of contemporary society. Promotion of establishment and sustainability of startup and spin off companies is crucial to the success of this venture. University of Novi Sad can be shown as exceptional example in this field, since it recognized the importance of participating in entrepreneurial ecosystem development, both for own development and for the society as a whole. In this paper, we will show the most important effects of this approach and implications for basic economic indicators which reflect the state of functioning of the entrepreneurial ventures developed and supported by the University of Novi Sad. Keywords: entrepreneurial ecosystem, innovation, startup, spin off, development, University of Novi Sad
1. INTRODUCTION
Success of entrepreneurial ventures depends on the quality of entrepreneurial idea, and ability of entrepreneurs to realize it. Nowadays, entrepreneurs are challenged to continuously promote innovativeness and entrepreneurial behavior of employees. Universities, on the other hand, are facing the problems of commercialization of new knowledge, technologies and scientific and research results. Establishment and development of an effective environment, that will promote entrepreneurial behavior and provide knowledge and technologies transfer on the market, is a significant challenge for organizations that operate in dynamic business environments. This type of environment is recognized as an “entrepreneurial ecosystem”. The purpose of this paper is to show the most important effects of establishment and promotion of entrepreneurial ecosystem through universities spin off and startup companies. Implications of basic economic indicators which are connected with entrepreneurial environment of University of Novi Sad will be shown. Spin-offs can be defined as a “range of important functions, including a vehicle for technology transfer and technology commercialization, a way to produce direct income for universities, a source of employment, a way to strengthen the relationships with the local business community and a way to contribute to restructuring regional economies” (Pérez & Sánchez, 2003; van Geenhuizen & Soetanto, 2009). According to Reis startup is “a human institution designed to deliver a new product or service under conditions of extreme uncertainty” (Reis, 2014). Startup can be defined as a “temporary organization designed to search for a repeatable and scalable business model“ (Steve, 2013). This paper was organized in three chapters. In the second chapter, literature review on the topic of university role within entrepreneurial ecosystem is done. This chapter also covers university spin-offs and startups, their role and importance in the process of creation of entrepreneurial ecosystem. Following this, in the third chapter, example of University of Novi Sad was shown as very development in terms of founding and developing startup and spin off companies. Considering this, authors reviewed effects of entrepreneurial environment to economic development of one country and/or region and made implications for further research relevant to this topic.
2. LITERATURE REVIEW
2.1. Entrepreneurial ecosystem
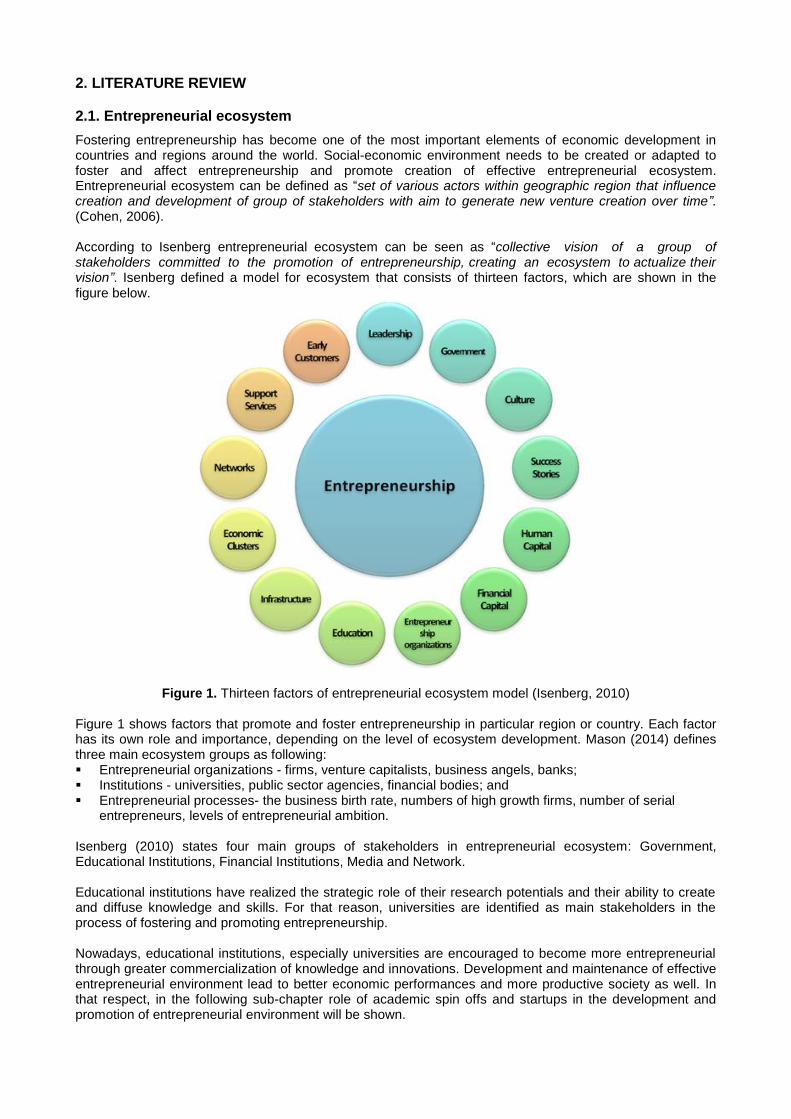
Fostering entrepreneurship has become one of the most important elements of economic development in countries and regions around the world. Social-economic environment needs to be created or adapted to foster and affect entrepreneurship and promote creation of effective entrepreneurial ecosystem. Entrepreneurial ecosystem can be defined as “set of various actors within geographic region that influence creation and development of group of stakeholders with aim to generate new venture creation over time”. (Cohen, 2006). According to Isenberg entrepreneurial ecosystem can be seen as “collective vision of a group of stakeholders committed to the promotion of entrepreneurship, creating an ecosystem to actualize their vision”. Isenberg defined a model for ecosystem that consists of thirteen factors, which are shown in the figure below.
Figure 1. Thirteen factors of entrepreneurial ecosystem model (Isenberg, 2010)
Figure 1 shows factors that promote and foster entrepreneurship in particular region or country. Each factor has its own role and importance, depending on the level of ecosystem development. Mason (2014) defines three main ecosystem groups as following: Entrepreneurial organizations - firms, venture capitalists, business angels, banks; Institutions - universities, public sector agencies, financial bodies; and Entrepreneurial processes- the business birth rate, numbers of high growth firms, number of serial
entrepreneurs, levels of entrepreneurial ambition. Isenberg (2010) states four main groups of stakeholders in entrepreneurial ecosystem: Government, Educational Institutions, Financial Institutions, Media and Network. Educational institutions have realized the strategic role of their research potentials and their ability to create and diffuse knowledge and skills. For that reason, universities are identified as main stakeholders in the process of fostering and promoting entrepreneurship. Nowadays, educational institutions, especially universities are encouraged to become more entrepreneurial through greater commercialization of knowledge and innovations. Development and maintenance of effective entrepreneurial environment lead to better economic performances and more productive society as well. In that respect, in the following sub-chapter role of academic spin offs and startups in the development and promotion of entrepreneurial environment will be shown.
2.2. Role of University in the entrepreneurial ecosystem: spin off and startup companies
Universities and public authorities would be advised to intensify their activities to foster and promote entrepreneurship, especially among young people. Such kind of activities leads directly to creation of culture of academic entrepreneurship (Lüthje & Franke, 2003). The most important entities of academic entrepreneurship are spin off and startup companies. University spin offs transfer technology from their parent organization in the first phase and later, they transfer technology to their clients. Developing an effective network of various stakeholders is a key challenge for successful functioning of spin offs (Todorovic et al., 2011). This network brings together not only academically-oriented stakeholders, but also ones who are primarily market-oriented. (Pérez & Sánchez, 2003). Creation of successful spin offs requires various types of resources such as knowledge, finances, organizational assets, social capital and intellectual property (Landry et al., 2006), (Steffensen et al., 2000) highlighted critical success factors for academic spin offs, such as risk taking, opportunity identification and risk mobilization. Technology transfer is based on network capability that enables companies and other participants to build strong relationships. On the participant’s side, relationships are important means of sharing resources, knowledge, expertise, software, equipment, etc. (Pérez & Sánchez, 2003). However, these relations are also important from the side of economic development of some region and/or country. Existence of spin offs with important and purposeful connections increase productivity of their actors (eg. research institutions, customers, legal authorities) (Walter et al., 2006). Spin offs continuously seek to contribute to region’s and country’s economic development (Mian, 1997), and for that reason, they are recognized as important business support mechanism. When it comes to startup companies, it can be said that they are unpredictable organizations that are primarily oriented towards research of business opportunities. In the early stage of startups development, educational and research institutions have an important role to strengths their capacities and foster their further development. Likewise, government and public authorities have a significant role in startup development through defining policies and strategies that foster their growth and enable their transformation from startups to SMEs (Laso, 2016). Increase in number of startups directly leads to the strengthening of economy in one country or particular region. Startups are designed to grow fast (Mata et al., 1995), thus they could have significant impact on economy development in short term. Spin offs and startups are related to economic growth and increasing number of employees. The promotion of the entrepreneurial vision via spin off and startup companies could motivate researchers and scientists for a higher level of commercialization of research knowledge.
3. RESEARCH RESULTS Entrepreneurial ecosystem is an unique entity, in which enterprises and their entrepreneurial activity play a crucial role. Understanding and interpreting entrepreneurial activity and the number of enterprises is of great importance for definition of the further development strategies. Entrepreneurial activity is the enterprising human action in pursuit of the generation of value, through the creation or expansion of economic activity, by identifying and exploiting new products, processes or markets. (Ahmad & Seymour, 2008). The definitions recognise that many business entities can attempt to instil an entrepreneurial spirit in their employees and encourage them to be creative and innovative. Governments around the world seek to encourage entrepreneurial activity as the main generator of society's development and influence the improvement of all economic indicators, in particular employment rates and GDP. The Government of the Republic of Serbia also established clear strategies for short-term and long-term development. In this context, establishment of entrepreneurial activities across the country is one of its most important priorities. In documents published by Government of the Republic of Serbia “Strategy for the support to development of small and medium-sized enterprises, entrepreneurship and competitiveness for the period from 2015 to 2020” and “Action plan for the implementation of the strategy for the support to development of small and medium-sized enterprises, entrepreneurship and competitiveness”, priorities about development of entrepreneurial activity are listed and defined. Within them, it is stated that the precondition for achieving sustainable socio-economic development and successful completion of the process of European integration of the Republic of Serbia is the development of economy, which builds its long-term competitiveness on a private entrepreneurial initiative, knowledge, application of new technologies and innovation (Government of the Republic of Serbia, 2015).

The table below shows the comparison of data on business subjects at the level of the Republic of Serbia, the region of Vojvodina, and the City of Novi Sad. Table 1: An overview of the number of companies and employees on the territory of the Republic of Serbia, the region of Vojvodina and the City of Novi Sad in 2014
Enterprises by size
Republic of Serbia
Vojvodina region
City of Novi Sad
Entrepreneurs
231.616
60.968
14.529
Micro, Small and Medium Enterprises
92.656
85.117
10.031
Large enterprises
494
130
-
Total number of business subjects
324.766
148.215
24.560
Total number of employees
1.174.947
213.151
127.078
Source: Statistical Office of the Republic of Serbia, 2018
Figure 2: Number of enterprises by size in Republic of Serbia, Vojvodina Region, and City of Novi Sad in 2014
This data shows that 99.84 % of total enterprises in the Republic of Serbia, are entrepreneurs and micro, small and medium enterprises. Such a picture and result does not deviate very much from the European average. If we look at the region of Vojvodina, that percentage is 99.9 % of the total number of business subjects. The used database did not find the exact number of large companies in the City of Novi Sad. Business entities from the City of Novi Sad make 7.56 % of the total number of business subject in Republic of Serbia, and 16.57 % of the total business subject in Vojvodina region.
231616
92656
494
60968
85117
130
14529 10031
0
50000
100000
150000
200000
250000
Entepreneuers Micro, Small and Medium Enterprises
Large Enterprises
Republic of Serbia
Vojvodina Region
City of Novi Sad

Figure 3: GDP growth in the Republic of Serbia in the period 1990 - 2016 in USD (Tradingeconomics.com; ivanstat.com, 2018)
The observed phenomenon can also be related to the movement of gross domestic product, as a basic indicator of economic activity in one country. With economic growth, there is also increased allocation of funds in all areas of the economy and society, as well as in the allocation of funds for launching and supporting new business entities, where the startup and spin off companies certainly play important role. The trend line in the GDP of the Republic of Serbia is on an upward path, which coincides with the growing number of companies that have been established as a startup and spin off company. All this leads to strong development of the entrepreneurial ecosystem, which should be the leverage of the development of the economy and all business entities. There is also a positive impact on other economic indicators such as employment growth, taxation, per capita income, etc. The unemployment rate has decreased by about 10 years since the last 5 years (Statista.com, 2018), and a significant contribution was made by a large number of new established companies. Also, entrepreneurial ecosystems could enable a faster pace of technological progress and the introduction of new technologies, development of human resources and their mobility. Development of entrepreneurial ecosystem is the mission of all modern universities. Establishing entrepreneurial ecosystems with the support of the university should create basis for the further development of the university, and its research activities. In this way, sustainability and development are established according to modern trends, and the University of Novi Sad follows this direction. Table 2: Basic indicators of University of Novi Sad
University of Novi Sad – Review
Number of faculties 14 Number of accredited study programs around 400 Number of students more than 50.000 Number of employees more than 5.000 Number of Scientific Institutes 3 Number of University Centers 17 Number of Scientific Laboratories 250 Number of projects (up to 2016) 126 Number of partner and coordinating international projects 127
Source: University of Novi Sad, 2018 Orientation of universities to support creation of entrepreneurial ventures and creation of entrepreneurial ecosystem is certainly significant character. This requires a high level of engagement of all available resources which one university has, as well as a longer period of time for the establishment of stable bases,

which should lead to the sustainability of enterpreneurial ecosystem. By strengthening its own capacities, but also by developing the economy as a whole, the University is able to create entrepreneurial environment, and leads to an intensive transfer of academic ideas into market-oriented ventures. In this case, a 25-year period was taken, in which there were very large changes in society, but also on the global level. The transition to the market economy, higher usage of the Internet in business, the strengthening of academic potentials and the development of a democratic society, and the orientation towards wider domestic, regional, European and world market has led to a change in the way of thinking in the entrepreneurial sense. The occurrence of startup and spin off companies is indispensable part of every developed society, if we take into account the macro level, but also every individual participant in the entrepreneurial ecosystem, if we observe the micro level. On the example of University of Novi Sad, we can notice that 123 startup and spin off companies were established in the observed period 1990-2015, faced with all market challenges and opportunities (University of Novi Sad, 2015). However, from these 123, about 78 companies are still active, which indicates that success rate of such ventures at the observed University is around 63%.
Figure 4: The number of founded startups and spin off companies in the period 1990-2014 at the University of Novi Sad (University of Novi Sad, 2015)
The largest number of startup and spin off companies at the observed University was founded in the last 10 years. This has certainly contributed to the current trends, the increasing openness of universities to launch such ventures, and supporting the building of unique entrepreneurial ecosystem. The largest number of these companies was established in 2012, more than 18, while smaller number of companies was established at the beginning of observed period. The causes for small number of founders should be sought in a very poor economic environment, the lack of market economy as well as the consequences of wars and period of sanctions. Possible explanation of this phenomenon may also be insufficient understanding the importance of establishing such types of business entity in the economy. A smaller activity in triggering this type of venture was observed in the period of major economic crisis from 2008. Need for rapid development can be one of the reasons for increase in the number of newly established companies, through raising awareness about the importance of starting one's own business and the opportunities that this kind of activity brings. There is also growing support from relevant stakeholders in the economy and entrepreneurial ecosystem, among which are certain universities. Possibilities for applying for new sources of financing, both in the country, or abroad, especially within European funds, have been increased.
0
2
4
6
8
10
12
14
16
18
20

Figure 5: Startup and spin off companies at the University of Novi Sad by industry division (University of Novi Sad, 2015)
The largest number of observed companies belongs to the field of information and communication technologies, on the second place are professional, scientific, innovative and technical activities, and on the third place are companies in the field of manufacturing industry. The total number of employees within these companies in 2015 was 2201, which represents 1.75 % of the total number of employees in the City of Novi Sad. Nowadays, some of startup and spin off companies are large enterprises, with more than 250 employees. It has a very beneficial effect as on the local, as much as on national, economy level. Significant development of entrepreneurial activity and number of different types of entities involving start up and spin off companies, based on the foundations established at the university, enabled the participation of other participants in the creation of entrepreneurial ecosystems. Their contribution to the development of this system is with great importance and by their active participation in system constructing, they influence its quality and strengthening. Among these institutions and companies, which are the part of entrepreneurial ecosystem, exist a high level of interdependence. Some of the most important institutions in the functioning of entrepreneurial ecosystems at the city and province level are: Business incubators (in Novi Sad, Subotica, Senta, Zrenjanin), Startit Centar Novi Sad, iDEA Lab, Vojvodina Chamber of Commerce, The Regional Development Agency Backa, different clusters, Provincial government and a large number of other provincial and city institutions. Science technology park Novi Sad is currently under construction and that will certainly contribute to the further development of the presented entrepreneurial ecosystem.
4. CONCLUSION
Development of entrepreneurial ecosystem has great importance at all levels: local, provincial and national. Entrepreneurial vision should be promoted and fostered on both market-oriented and academic-oriented environment. Observing the startup and spin off companies at the University of Novi Sad, and the basic indicators of their economic activity, we can notice the upward trend line in terms of the number of employees and total income. This points to the possibility of allocating a higher level of funds for new investment cycles and raising the innovation and competitiveness of these companies. Considering the constant growth of the number of employees, it can be said that the largest investments are also realized in human resources in order to attract, develop and retain them. Certainly, in this process, the university has a very important role, especially in the support it provides. Therefore, importance of university can be measured by its ability to stimulate and support entrepreneurial activity. It is necessary to create a stable environment and conditions that will lead to the development of entrepreneurial ecosystem in all its aspects. This requires a high level of readiness for engagement and cooperation among all participants at entrepreneurial ecosystem, in order to achieve set of goals. According to the previous results, University of Novi Sad is making tremendous efforts to permanently encourage the building of a strong and stable entrepreneurial ecosystem, which will play a major role in the economy of the whole country and beyond. This feature of the university leads to the strengthening of innovative potential and implementation of important projects from different fields. In the future, it’s expected that the results of entrepreneurial activity within the University of Novi Sad will be more accessible, more measurable, and in that way more suitable for research, which will be another indicator of the strength and development which this entrepreneurial ecosystem has.
1% 15%
1%
3 %
55 %
24 %
1% 0
Agriculture, Forestry and Fischeries
Manufacturing industry
Civil engineering
Trade
ICT
Professional, scientific, technical and innovation activities
Art, entertainment and recreation
ACKNOWLEDGEMENTS The authors acknowledge the financial support of the Ministry of Education and Science of the Republic of Serbia, within the Project No. 47005.
REFERENCES
Ahmad, N., & Seymour G. R. (2008). Statistics Directorate, OECD; Richard Seymour, The University of Sydney, Australia.
Blank, S. (2013) “Why the Lean Start-Up Changes Everything. Harvard Business Review. Cohen, B. (2006). Sustainable valley entrepreneurial ecosystems. Business Strategy and the Environment,
15(1), 1-14. Government of the Republic of Serbia (2015). Strategy for the support to development of small and medium-
sized enterprises, entrepreneurship and competitiveness for the period from 2015 to 2020 and action plan for the implementation of the strategy for the support to development of small and medium-sized enterprises, entrepreneurship and competitiveness. Retrived from: http://www.privreda.gov.rs/wp-content/uploads/2017/01/Strategija-I-Plan_eng_poslednje.pdf
Isenberg, D. (2010). The Big Idea: How to Start an Entrepreneurial Revolution. Harvard Business Review, Vol.88 (6), pp 41-50.
Ivanstat (2018). Serbia GDP. Retrived from: http://www.ivanstat.com/en/gdp/rs.html Landry, R., Amara, N., & Rherrad, I. (2006). Why are some university researchers more likely to create spin-
offs than others? Evidence from Canadian universities. Research Policy, 35(10), 1599-1615. Laso, I. (2016). New role in the governments in the era of ICT startups. Retrived from: http://news.itu.int/new-
role-governments-era-ict-startups/ Lüthje, C., & Franke, N. (2003). The ‘making’of an entrepreneur: testing a model of entrepreneurial intent
among engineering students at MIT. R&D Management, 33(2), 135-147. Mason, C., & Brown, R. (2014). Entrepreneurial ecosystems and growth oriented entrepreneurship. Final
Report to OECD, Paris, 30(1), 77-102. Mata, J., Portugal, P., & Guimaraes, P. (1995). The survival of new plants: Start-up conditions and post-entry
evolution. International Journal of Industrial Organization, 13(4), 459-481. Mian, S. A. (1997). Assessing and managing the university technology business incubator: an integrative
framework. Journal of business venturing, 12(4), 251-285. Perez, M. P., & Sánchez, A. M. (2003). The development of university spin-offs: early dynamics of
technology transfer and networking. Technovation, 23(10), 823-831. Ries, E. (2014), Lean startup, Mate, Belgrade, Serbia. Statista (2018). Serbia: Unemployment rate from 2007 to 2017. Retrived from:
https://www.statista.com/statistics/440532/unemployment-rate-in-serbia/ Steffensen, M., Rogers, E. M., & Speakman, K. (2000). Spin-offs from research centers at a research
university. Journal of business venturing, 15(1), 93-111. Suresh, J., & Ramraj, R. (2012). Entrepreneurial ecosystem: Case study on the influence of environmental
factors on entrepreneurial success. European Journal of Business and Management, 4(16), 95-101. Todorovic, Z., McNaughton, R., Guild, P.ENTRE-U: An entrepreneurial orientation scale for universities”.
Technovation, Vol.31, (2011), pp. 128-137. Trading Economics (2018). Serbia GDP. Retrived from: https://tradingeconomics.com/serbia/gdp University of Novi Sad (2018). Retrived from: www.uns.ac.rs Van Geenhuizen, M., & Soetanto, D. P. (2009). Academic spin-offs at different ages: A case study in search
of key obstacles to growth. Technovation, 29(10), 671-681. Walter, A., Auer, M., & Ritter, T. (2006). The impact of network capabilities and entrepreneurial orientation on
university spin-off performance. Journal of business venturing, 21(4), 541-567.

THE ROLE OF CULTURE IN ENTREPRENEURIAL ECOSYSTEM: WHAT MATTERS MOST?
Milica Jovanović*1, Miloš Jevtić
1, Jasna Petković
1
1University of Belgrade, Faculty of Organizational Sciences, Serbia
*Corresponding author, e-mail: [email protected]
Abstract: This paper examines the role of cultural characteristics in entrepreneurial ecosystem. We investigated whether and how much cultural differences affect entrepreneurial orientation and performance. Measuring culture is a challenging task, and through years there have been developed several methodologies to solve this issue. In this paper, we used Hofstede's model of cultural dimensions to compare the results with appropriate metrics of entrepreneurial ecosystem performance. On a set of OECD and EU countries, this paper examines the relationship between cultural aspects and entrepreneurial performance based on the Global Entrepreneurship Development Institute methodology. The conclusions are derived from the calculated correlations between Hofstede’s cultural dimensions and values of Global Entrepreneurship Index and its main components that represent the pillars of entrepreneurial ecosystem. The results indicate the significance and the direction of importance that cultural determinants have on the entrepreneurial environment of a country. Keywords: Culture, Entrepreneurship, Ecosystem, Hofstede, Performance indicators
1. INTRODUCTION
Entrepreneurial activities have been identified as the catalysts of economic development and prosperity (Ács, Autio, & Szerb, 2014). These activities have been intensified by the rapid technological growth, and the development of the technology entrepreneurship (Levi Jakšić, Jovanović, & Petković, 2015). Increasing entrepreneurial activities are not solely reserved for the technology, but also social, sustainable, strategic, and knowledge entrepreneurship. Even large, international, and global firms are recognizing entrepreneurship as a primary source of innovation and competitiveness, and thus engage in so-called corporate entrepreneurship (Levi Jakšić, Marinković, Petković, Rakićević, & Jovanović, 2018, p. 47-55). Although an individual initiates entrepreneurial activities, the success of an entrepreneurial venture highly depends on institutional factors and its environment - entrepreneurial ecosystem (Aparicio, Urbano, & Audretsch, 2016). Culture is one of the essential parts of entrepreneurial ecosystem (Isenberg, 2011). The values, norms, attitudes, risk tolerance of a society can be crucial determinants of entrepreneurial activity within a country. Some research discuss and highlight the importance of cultural determinants on entrepreneurial activities (Castaño, Méndez, & Galindo, 2015; Dubina & Ramos, 2016). Still, no research examines specific metrics and concrete measures of this impact. Thus, in this paper, we will discuss the relationship between the results of entrepreneurial performance measured by the Global Entrepreneurship Index (GEI), and cultural determinants values of Hofstede’s cultural dimension model. To evaluate the relationship between these components we calculated the correlation coefficients at the set of 38 OECD and EU countries. Next section discusses the central concepts examined in this paper: entrepreneurship, entrepreneurial ecosystem, culture, and relationship between entrepreneurship and culture. The third section presents the conducted research and has two parts: the first explains the data and methods, while the second presents the results of the research, discussion, and implications. Finally, the last section gives the research conclusions.
2. ENTREPRENEURSHIP AND CULTURE IN THEORY
Entrepreneurial activities are important determinants of economic growth (Noseleit, 2013). They are essential for creating the linkage between scientific activities and new values for customers, which improves the quality of life and contributes to the overall wealth of an economy and society (Levi Jakšić et al., 2018, p. 58). Entrepreneurship has global effect since it affects (GEDI, 2017): Individuals: by creating new solutions that improve lives, and by creating new employment opportunities; Governments: by creating new solutions that improve economic efficiency and by solving environmental
and socioeconomic problems; World: by presenting new ideas with new markets, and by introducing new ideas from abroad.

Having in mind the importance on entrepreneurial activity for a national economy and national differences driven by the cultural influence, we proposed two research questions:
Whether and to what extent is entrepreneurial ecosystem performance affected by the cultural characteristics of a society? Whether and how are entrepreneurial ecosystem pillars affected by the cultural characteristics of a society? Thus, in this research, we measure the relationship between entrepreneurial ecosystem (and its components) and the cultural dimensions of a nation. We based our conclusions on a set of 38 EU and OECD countries. As a measure of entrepreneurship, we observed The Global Entrepreneurship Index and compared with the scores with Hofstede’s cultural dimensions model.
2.1. Entrepreneurship ecosystem
Entrepreneurial activities are driven by the initiative of an individual: his motivation, ambition, ability, capacity. However, “no man is an island”, isolated and focused on its performance, especially in the case of entrepreneurial ventures that are demanding devotion, hard work, a lot of resources and patience to succeed. In these kind of projects, mutual effort of all environmental participants plays a vital role of (Ács, Autio, & Szerb, 2014). Sometimes, the supporting activities of the entrepreneurial actors are crucial for a success of venture. A well-organized community of entrepreneurial ecosystem is an important factor in the entrepreneurial equation of success. It represents a system of interconnected actors: entrepreneurs, other individuals, organizations, and institutions at a national level (Levi Jakšić et al., 2018, p. 70). The main role of this system is to support and foster entrepreneurial activities. Daniel Isenberg (2011) summarizes entrepreneurial domain on the following elements: politics, finance, culture, support, human capital, and market. While some actors are directly involved in entrepreneurial activities (market, humans, individuals), the others foster and enable further development of ventures. In this kind of ecosystem, culture has the supportive role with its norms, values, and events organized to raise the entrepreneurial spirit within the ecosystem. In this term, culture also encompasses risk tolerance, ambition, orientation to innovativeness, creativity, and experiments.
Figure 1: Entrepreneurship Ecosystem (adapted from Isenberg (2011))
Measuring entrepreneurship There are numerous indicators for measuring and comparison entrepreneurial performance of a nation. They aim to improve the entrepreneurial ecosystem and identify weak links in the chain of actors. Institutions such as World Bank, Eurostat, OECD, and others annually publish different indicators that measure the performance and success of national entrepreneurial activities. However, to use the holistic approach, and evaluate the overall performance of the ecosystem, it is necessary to use composite indices approach that is very suitable for measuring complex issues such as national performance (Zhou, Fan, & Zhou, 2010). There are several methodologies that measure not only the success of the ventures but also the health of the ecosystem and its parts. These methodologies follow the performance of the actors that foster and support entrepreneurial activities. Global Entrepreneurship Monitor (GEM) is the world’s leading study of entrepreneurship, which started publishing different entrepreneurial data in 1999 (GEM, 2018). Their approach observes two perspectives of an economy: The entrepreneurial behavior and attitudes of individuals, and The national framework and how that impacts entrepreneurship.

GEM annually publishes summarized global report of profiles of 62 countries, with various data related to different aspects of the ecosystem (GEM, 2018). However, this methodology does not provide an aggregated value of the overall entrepreneurial performance of the observed countries. Therefore, for this paper, we selected another methodology that measures the health and intensity of entrepreneurial activities – Global Entrepreneurship Index. Since 2009, the Global Entrepreneurship and Development Institute has annually published the Global Entrepreneurship Index. This composite indicator combines 28 indicators that compare entrepreneurial activities of 137 ecosystems (in 2017), and provides a deep understanding of the environment by measuring entrepreneurial attitudes, abilities and aspirations (GEDI, 2017). Figure 2 illustrates the structure of the index for better understanding of its scope. In this paper, we are not examining the methodological issues of the index, since some previous research identifies it (Jovanović, Rakićević, Levi Jakšić, Petković, & Marinković, 2017). Instead, we will focus on the comparison of the results with the cultural characteristics of the observed countries. This index consists of three subindices (Attitude, Ability, and Aspiration) that are derived from the values of 14 pillars. Each pillar is calculated from the value of 2 indicators, and represent a particular component of the ecosystem.
Global Entrepreneurship Index
Entrepreneurial Attitude Entrepreneurial Ability Entrepreneurial Aspiration
Pill
ar
1:
Op
po
rtu
nity
Pe
rce
ptio
n
Pill
ar
2:
Sta
rt-U
p S
kill
s
Pill
ar
3:
Ris
k
Acce
pta
nce
Pill
ar
4: N
etw
ork
ing
Pill
ar
5: C
ultu
ral
Su
pp
ort
Pill
ar
10: P
rod
uct
Inn
ova
tio
n
Pill
ar
11:
Pro
ce
ss
Inn
ova
tio
n
Pill
ar
12: H
igh
Gro
wth
Pill
ar
13:
Inte
rna
tio
na
liza
tion
Pill
ar
14:
Ris
k C
ap
ita
l
Pill
ar
6:
Op
po
rtu
nity
Sta
rt-U
p
Pill
ar
7: T
ech
no
log
y
Ab
sorp
tio
n
Pill
ar
8: H
um
an
Cap
ita
l
Pill
ar
9:
Com
pe
tition
Figure 2: The Global Entrepreneurship Index structure (adapted from GEDI (2017))
Table 1 explains the pillars in accordance with the official GEDI report (GEDI, 2017). We used the values of the pillars in the research to determine their relationship with the values of cultural dimensions. Table 1: 14 Pillars of Global Entrepreneurship Index (GEDI, 2017, p. 3-4)
Pillar What does it measure? Opportunity Perception
Can the population identify opportunities to start a business and does the institutional environment make it possible to act on those opportunities?
Start-up Skills Does the population have the skills necessary to start a business based on their own perceptions and the availability of tertiary education?
Risk Acceptance Are individuals willing to take the risk of starting a business? Is the environment relatively low risk or do unstable institutions add additional risk to starting a business?
Networking Do entrepreneurs know each other and how geographically concentrated are their networks?
Cultural Support How does the country view entrepreneurship? Is it easy to choose entrepreneurship or does corruption make entrepreneurship difficult relative to other career paths?
Opportunity Start-up
Are entrepreneurs motivated by opportunity rather than necessity and does governance make the choice to be an entrepreneur easy?
Technology Absorption
Is the technology sector large and can businesses rapidly absorb new technology?
Human Capital Are entrepreneurs highly educated, well trained in business and able to move freely in the labour market?
Competition Are entrepreneurs creating unique products and services and able to enter the market with them?
Product Innovation Is the country able to develop new products and integrate new technology?
Process Innovation Do businesses use new technology and are they able access high quality human capital in STEM fields?
High Growth Do businesses intend to grow and have the strategic capacity to achieve this growth?
Internationalization Do entrepreneurs want to enter global markets and is the economy complex enough to produce ideas that are valuable globally?
Risk Capital Is capital available from both individual and institutional investors?

2.2. Cultural dimensions
Isenberg (2011) identified culture as an important part of the entrepreneurship ecosystem (Figure 1). It determines the level of risk acceptance, willingness to use and recognize the opportunities, creativity, collectivistic orientation, etc. (Dubina, Ramos, & Ramos, 2016). Culture can enforce one type of activities or obstruct another. Professor Geert Hofstede defined national culture as a collective programming of human mind which differs one group or category from another. Culture is learned, not inherited, and it comes from social environment, not genes (Hofstede, Hofstede, & Minkov, 2010). In other words, culture represents the common characteristics of members of a group, the differences that distinguish them from another groups. These similarities are passed from generation to generation, particularly from parents to children. Hofstede’s research shows that cultural differences among nations are at the deepest level, level of values. These values determine which behaviour is appropriate and respectful. Those are tendencies to prefer a certain state of things in comparison to others. This behaviour which is considered as “appropriate”, shapes an individual’s actions, motivation, and orientation. For example, Japanese culture is highly intolerable towards risk. Thus, one can assume that the entrepreneurial activities with a high probability of failure are not representing a preferable type of business action in Japan. Cultural dimensions There are several tools developed for measuring the dimensions of national culture. In addition to the mostly used Hofstede’s cultural dimension model, there are other methodologies used for this purpose. Fons Trompenaars and Shalom Schwartz developed their own models of cultural dimensions (Trompenaars & Hampden-Turner, 2000; Schwartz, 2006), so the research could also be based on those methodologies. However, in this paper, we based our conclusions on the values of Hofstede’s model. Initial Hofstede’s analysis identified systematic differences in national cultures on four primary dimensions: power distance, individualism, uncertainty avoidance, and masculinity. Later research of Michael Minkov motivated Hofstede to add two new dimensions: long term orientation, and Indulgence vs. restraint. In this section, we will briefly describe each dimension based on the explanation provided on the official webpage of Hofstede Institute (Hofstede Insights, n.d.). We will interpret the characteristics of the dimension in terms of entrepreneurial orientation and activities. Power distance is the first dimension of national culture. It can be defined as the amount to which less powerful members of an institution of organization expect and accept unequally distributed power. In societies with high power distance, superiors and subordinates consider each other existentially unequal. Subordinates expect to be told what to do, and there is a high amount of supervision and reporting. It the context of entrepreneurial activities, high power distance societies are not expected to be entrepreneurially oriented, due to the high hierarchy which is not a feature of entrepreneurial ventures. Individualism vs. Collectivism are two opposites of the second dimension of national culture. Individualism is related to the societies where the relations between individuals are week. It is expected of them to take care solely of themselves and close family members. On the other side, in collectivistic societies people are integrated in strong, solid groups, to which they are endlessly loyal. Employees in individualistic culture are expected to behave in accordance with their interests. In such societies work should be organized in a way that individual interests of employee and employer are matching. Having that in mind, entrepreneurial orientation comes more naturally for individualistic societies. Masculinity vs. Femininity differs male and woman role in the society. Society is described as masculine when the emotional roles of the genders are strictly distinguished: males are expected to be confident and focused on material success, while women should be modest, gentle, and focused on quality of life. On the contrary, feminine societies are characterized with overlapping roles of men and women: both gender are modest and oriented on the higher quality of life. It is not clear in terms of entrepreneurial activities which scores are expected to be achieved on this dimension. Masculine societies are related to the entrepreneurial activities in terms of achievements and motivation, but the feminine societies nourish the importance of life quality, which is also characteristic of entrepreneurially oriented individuals. The empirical research will solve this dilemma in the following section. Uncertainty avoidance is the fourth dimension. It is defined as the degree to which the members of a culture are feeling threatened due to uncertain and unfamiliar situations. This dimension should not be replaced with risk avoidance. While risk is defined as the probability that a certain event will occur, uncertainty is a situation where the outcome is unknown. Entrepreneurship is characterized with high uncertainty, so the nations with low scores on this dimension are more likely to cope with entrepreneurial activities.

The fifth dimension of national culture, long-term orientation, measures how much a certain nation is oriented to the past and tradition. Lower values of this dimension (short-term orientation) imply that a culture worships the tradition and societal norms. On the other hand, long-term orientation considers changes, adaptation and pragmatic problem solving as a necessity. From the perspective of entrepreneurial orientation, it is expected that long-term orientation is a characteristic of nations with higher entrepreneurial performance. Indulgence vs. restraint is the last Hofstede’s cultural dimension. Indulgence is a tendency of fulfilling the basic and natural human desires related to hedonism and enjoying life. Its opposite, restraint, is related to the beliefs that those needs have to be limited and regulated by strict societal norms. Indulgent societies believe that they have control on their own life and emotions. They are more optimistic and oriented towards quality of life, while restrained ones are pessimistic and driven by the strong norms. It is expected that indulgent societies have more entrepreneurial orientation than the restraint ones. In this section, we interpreted the implications of cultural characteristics on entrepreneurial performance based on the theoretical suggestions. In the next section, we present the results of empirical research based on the values of two presented methodologies: Global Entrepreneurship Index, and Hofstede’s cultural dimensions model.
3. RESEARCH
To answer the research questions we compared the values of Global Entrepreneurship Index with the values of Hofstede’s cultural dimensions. For the first research question, we determined the correlation of GEI score with the cultural dimensions. To get more insight, and answer the second question, we calculated the correlations of cultural dimensions and values of GEI pillars to determine the cultural influence on the components of entrepreneurial ecosystem. In this section, we will explain sample structure, present and discuss the results, and provide the implications of the research.
3.1. Sample structure, data, and methods
The research was based on GEI data from 2014 to 2017. In the first iteration of the research, we examined the relationship on the set of the 28 EU countries. But, since the paper highlights the importance of cultural differences, it was necessary to include another set of countries to get a multicultural set of nations. For more relevant results, we expanded the 28 EU set with the OECD countries which are not part of the 28 EU: Australia, Canada, Chile, Iceland, Israel, Japan, Korea, Mexico, Norway, Switzerland, Turkey, and United States. The total number of countries was 38 (due to lack of data, we excluded Cyprus, Malta, and New Zealand). GEI data was collected from the official Global Entrepreneurship and Development Institute reports from 2015 to 2018. The values of the cultural dimensions were collected from the official website of The Hofstede Centre. Data sources are given in Table 2. Table 2: Data source for GEI 2014-2017 and Hofstede's Cultural dimensions
Measure Data source
GEI 2015 Retrieved March 28, 2018, from http://thegedi.org/2015-global-entrepreneurship-index/
GEI 2016 Retrieved March 28, 2018, from http://thegedi.org/2016-global-entrepreneurship-index/
GEI 2017 Retrieved March 28, 2018, from http://thegedi.org/2017-global-entrepreneurship-index-data/
GEI 2018 Retrieved March 28, 2018, from http://thegedi.org/2018-global-entrepreneurship-index/
Hofstede’s Cultural Dimensions
Retrieved March 29, 2018, from http://www.hofstede-insights.com/product/compare-countries/
Source: Authors For the calculation of correlation, we used StatSoft’s software Statistica (StatSoft, 2018). We measured the Pearson’s correlation coefficient to compare the Global Entrepreneurship Index and the cultural dimensions’ values since the data from both methodologies is interval (Kovačić, 1994). The values of correlations are presented in Tables 3 and 4.
3.2. Results, discussion, and implications
In the first part of the research, we compared the GEI score from 2014 to 2017 with the values of Hofstede’s cultural dimensions. This analysis was performed to determine if there is a significant difference among the annual correlation values. The results were stable, and there were negligible changes in the provided results.

Table 3: Correlation of Hofstede's cultural dimensions and Global Entrepreneurship Index (2014-2017)
Cultural dimension GEI 2014 GEI 2015 GEI 2016 GEI 2017
Power distance -0.6732* -0.6688* -0.6810* -0.6635*
Individualism 0.6331* 0.6449* 0.6253* 0.6356*
Masculinity -0.2392 -0.2200 -0.1458 -0.0961
Uncertainty avoidance -0.6656* -0.6820* -0.6764* -0.6606*
Long-term orientation -0.2189 -0.2357 -0.1996 -0.2256
Indulgence 0.5071* 0.4989* 0.5791* 0.5786* *significant at p< 0.05; Source: Authors Table 3 shows the values of correlation for the final GEI score. According to the Pearson’s correlation coefficient, power distance has strong negative impact on the entrepreneurial performance of the country. This signifies that the countries with less hierarchy are more entrepreneurially oriented. On the other hand, Individualism has strong positive correlation with the entrepreneurial performance, which is in accordance with the conclusion from the previous section that the individualistic societies have better entrepreneurial activities. Masculinity component does not detect any relationship with the GEI. The result may imply that the society’s gender orientation does not play a vital role for entrepreneurship. This can be explained by the fact that the entrepreneurship has a wide range of areas and is oriented on both economic wealth (i.e. technology, corporate entrepreneurship) and social responsibility (i.e. social entrepreneurship). As predicted, uncertainty avoidance has a strong negative relationship with the entrepreneurial orientation – societies that are not afraid of uncertainty are more likely to achieve a higher score on GEI. Yet, long-term orientation has a weak negative correlation with GEI score, which is not statistically significant. This comes as a surprise, since it was expected, by the interpretation of this cultural dimension, that long-term oriented societies score higher on the GEI, that is, that there exists strong positive correlation. Not only that the correlation is not strong, it even has negative value, which is the opposite of expected. In the end, indulgence has the moderate positive impact on the entrepreneurial activity, which is in accordance with the expectations, signifying that societies oriented towards quality of life score higher in terms of entrepreneurial performance.
To have the better insight of cultural impact on the elements of entrepreneurial ecosystem, we calculated the correlation coefficients of the cultural dimensions and scores of 14 GEI pillars for 2017 (Table 4). Table 4: Correlation of Hofstede's cultural dimensions and GEI pillars for 2017
GEI pillar Power
distance Individualism Masculinity
Uncertainty avoidance
Long term orientation
Indulgence
Opportunity perception -0.7149* 0.5367* -0.3585* -0.7205* -0.3367* 0.6113*
Start-up skills -0.2640 0.0687 -0.2806 -0.1364 -0.3490* 0.1474
Risk acceptance -0.3892* 0.2254 -0.1675 -0.4542* -0.1846 0.5279*
Networking -0.4483* 0.2124 -0.3585* -0.3975* -0.2631 0.5992*
Cultural support -0.6644* 0.5904* -0.3173 -0.6826* -0.3034 0.5086*
Opportunity start-up -0.7837* 0.5481* -0.2981 -0.7209* -0.2700 0.5442*
Technology absorption -0.6285* 0.5518* -0.0389 -0.5851* 0.0566 0.4516*
Human capital -0.4033* 0.4742* 0.0939 -0.4386* -0.0890 0.3320*
Competition -0.6471* 0.6063* -0.0186 -0.6044* -0.0603 0.5535*
Product innovation -0.1733 0.2120 0.1895 -0.2430 0.1233 0.2171
Process innovation -0.3875* 0.3525* 0.1378 -0.2820 0.2723 0.2531
High growth -0.3365* 0.4414* 0.1299 -0.4344* 0.0289 0.1800
Internationalization -0.2947 0.4559* 0.2691 -0.3017 0.0980 0.0989
Risk capital -0.4300* 0.4127* -0.0341 -0.3608* -0.1838 0.4318* *significant at p< 0.05. Source: Authors The ability of a population to perceive the opportunity is influenced by all cultural dimensions. The strongest impact have power distance, uncertainty avoidance and indulgence. Societies with less hierarchy, which are not afraid of uncertainty, and are aiming better quality of life are more likely to be entrepreneurially oriented. On the other hand, start-up skills are not significantly dependent on the culture. The only identified impact is long-term orientation, which is again surprising, having in mind that this element of ecosystem is related to the availability of the education. This means that start-up skills are better in societies that follow strict norms. Risk acceptance has a moderate relationship with power distance, uncertainty avoidance (negatively) and

indulgence (positively). Cultural support of a society and readiness to become the entrepreneur is significantly higher in less hierarchical societies that are open towards uncertainty. Regarding technology absorption, it is also strongly influenced by the hierarchy in society. The entrepreneurial competition is significantly stronger in societies that are more equal, individual, and are not afraid of uncertainty, but the product innovation is not related to any cultural determinant. We summarized the intensity and direction of the examined impacts in Table 5. Table 5: Summarized impact of cultural dimensions on entrepeneurial ecosystem
Ecosystem component
Cultural dimension
Impact Ecosystem component
Cultural dimension
Impact
Opportunity perception
Power distance Individualism Masculinity Uncertainty avoidance Long-term orientation Indulgence
Strong negative Moderate positive Moderate negative Strong negative Moderate negative Strong positive
Human capital
Power Distance Individualism Uncertainty avoidance Indulgence
Moderate negative Moderate positive Moderate negative Moderate positive
Start-up skills Long-term orientation Moderate negative Competition
Power Distance Individualism Uncertainty avoidance Indulgence
Strong negative Strong positive Strong negative Moderate positive
Risk acceptance
Power distance Uncertainty avoidance Indulgence
Moderate negative Moderate negative Moderate positive
Product innovation
Networking
Power distance Masculinity Uncertainty avoidance Indulgence
Moderate negative Moderate negative Moderate negative Moderate positive
Process innovation
Power distance Individualism
Moderate negative Moderate positive
Cultural support
Power distance Individualism Uncertainty avoidance Indulgence
Strong negative Moderate positive Strong negative Moderate positive
High growth Power distance Individualism Uncertainty avoidance
Moderate negative Moderate positive Moderate negative
Opportunity start-up
Power distance Individualism Uncertainty avoidance Indulgence
Strong negative Moderate positive Strong negative Moderate positive
Internationa- lization
Individualism Moderate positive
Technology absorption
Power distance Individualism Uncertainty avoidance Indulgence
Strong negative Moderate positive Moderate negative Moderate positive
Risk capital
Power distance Individualism Uncertainty avoidance Indulgence
Moderate negative Moderate positive Moderate negative Moderate positive
Source: Authors Table 5 could be a useful tool for policymakers to determine the strategies for creating more successful entrepreneurial ecosystem. The presented table summarizes the impact of cultural determinants on the entrepreneurial performance. Having in mind the characteristics of the specific culture, government or other interested parties could define more effective policies, measures, and strategies for achieving higher performance of the ecosystem. For example, in the societies with high power distance component, to foster entrepreneurial activities, policymakers must make the effort on motivating the citizens on ventures due to their lack of readiness to be the entrepreneurs (Opportunity Start-up component).
3.3. Limitations and future research directions
Although we have derived important implications, this research has certain limitations. Firstly, the set of countries is limited to 38 OECD and EU countries. This issue is important because cultural differences may be even stronger, and conclusions may significantly differ when the rest of the world countries are included (especially other Asian and African countries). The issue can be addressed in the future research of the authors by expanding the data sample with (at least) BRICS countries. In case of different results Table 5 should be updated. Another direction of the future research is to compare the results with the Global Entrepreneurship Monitor methodology. Even though there is no composite index calculated by this methodology, research could be conducted for the components that are related to the elements of entrepreneurial ecosystem. On the subject of tools for measuring cultural dimensions, the two above mentioned tools by Trompenaars and Schwartz could also be compared with the values of the entrepreneurial performance to examine the impact of cultural differences according to these two models.

4. CONCLUSION
Entrepreneurial activities have numerous positive impacts on all global aspects: individuals, governments, world (GEDI, 2017). These activities are highly dependent on a motivation of an individual. But, for a successful venture, it is necessary to have the support of all the relevant actors in the entrepreneurial process – entrepreneurial ecosystem. One of the major elements of the ecosystem is its culture: norms, values, supporting events, and other. To determine the role of culture in the ecosystem we proposed two research questions: Whether and to what extent is entrepreneurial ecosystem performance affected by the cultural characteristics of a society? and Whether and how are entrepreneurial ecosystem pillars affected by the cultural characteristics of a society? The research, based on the set of OECD and EU countries was conducted to answer the questions was based on the Hofstede’s cultural dimensions model and Global Entrepreneurship Institute composite index – Global Entrepreneurship Index. The results from Table 3 answer the first research question, and show that certain dimensions (Power distance, Individualism, and Uncertainty avoidance) have strong relationship with entrepreneurial performance of the countries. Societies with low hierarchy, which are individualistic, and not afraid of uncertainty are achieving higher scores on GEI methodology. The research results presented in Table 4 are answering the second research question, where we examined the impact of the culture on components of entrepreneurial ecosystem to answer the second research question. It also resulted with Table 5 that could be a tool for policymakers, used to create better strategies to foster and enhance entrepreneurial activities. It has been noted during the research that the scope could be improved with expanded set of countries. Also, conclusions could be compared with Global Entrepreneurship Monitor methodology and Trompenaars and Schwartz cultural tools for another insight and comparison of the results. However, this research confirms that the culture has an important role in the entrepreneurial performance of a country. The paper provides first concrete measures of the relationship between culture and entrepreneurship, and represents a good foundation for future research.
REFERENCES
Ács, Z. J., Autio, E., & Szerb, L. (2014). National Systems of Entrepreneurship: Measurement issues and policy implications. Research Policy, 43(3), 476-494. doi:10.1016/j.respol.2013.08.016
Aparicio, S., Urbano, D., & Audretsch, D. (2016). Institutional factors, opportunity entrepreneurship and economic growth: Panel data evidence. Technological Forecasting and Social Change, 102, 45-61. doi:10.1016/j.techfore.2015.04.006
Castaño, M.-S., Méndez, M.-T., & Galindo, M.-Á. (2015). The effect of social, cultural, and economic factors on entrepreneurship. Journal of Business Research, 68(7), 1496-1500. doi:10.1016/j.jbusres.2015.01.040
Dubina, I. N., & Ramos, S. J. (2016). Cultural Underpinnings in Entrepreneurship. In I. N. Dubina, & E. G. Carayannis, Creativity, Innovation, and Entrepreneurship Across Cultures: Theory and Practices (pp. 147-153). New York: Springer. doi:10.1007/978-1-4939-3261-0_12
Dubina, I. N., Ramos, S. J., & Ramos, H. (2016). Culture as a Driving Force of Individual and Organizational Behavior. In I. N. Dubina, & E. G. Carayannis, Creativity, Innovation, and Entrepreneurship Across Cultures: Theory and Practices (pp. 1-29). New York: Springer. doi:10.1007/978-1-4939-3261-0_1
GEDI. (2017). The Global Entrepreneurship Index 2018. Retrieved March 28, 2018, from https://thegedi.org/2018-global-entrepreneurship-index/
GEM. (2018). Global Entrepreneurship Monitor. Retrieved April 15, 2018, from https://www.gemconsortium.org/
Hofstede Insights. (n.d.). Hofstede Cultural Dimensions - Compare Countries. Retrieved January 29, 2018, from https://www.hofstede-insights.com/product/compare-countries/
Hofstede, G. H., Hofstede, G. J., & Minkov, M. (2010). Cultures and organizations: software of the mind. McGraw-Hill.
Isenberg, D. (2011). The entrepreneurship ecosystem strategy as a new paradigm for economic policy: Principles for cultivating entrepreneurship. Dublin, Ireland: Institute of International and European Affairs.
Jovanović, M., Rakićević, J., Levi Jakšić, M., Petković, J., & Marinković, S. (2017). Composite Indices in Technology Management - A Critical Approach. In V. Jeremić, Z. Radojičić, & M. Dobrota, Emerging Trends in the Development and Application of Composite Indicators (pp. 38-71). Hershey, PA: IGI Global. doi:10.4018/978-1-5225-0714-7.ch003
Kovačić, Z. J. (1994). Multivarijaciona analiza. Beograd: Univerzitet u Beogradu, Ekonomski fakultet. Levi Jakšić, M. ‚., Jovanović, M., & Petković, J. (2015). Technology Entreprenurship in the Changing
Business Environment – A Triple Helix Performance Model. Amfiteatru Economic, 17(38), 422-440.

Levi Jakšić, M., Marinković, S., Petković, J., Rakićević, J., & Jovanović, M. (2018). Tehnološko preduzetništvo. Beograd: Fakultet organizacionih nauka.
Noseleit, F. (2013). Entrepreneurship, structural change, and economic growth. Journal of Evolutionary Economics, 23(4), 735-766. doi:10.1007/s00191-012-0291-3
Schwartz, S. H. (2006). A theory of cultural value orientations: Explication and applications. Comparative Sociology, 5(2), pp. 137-182.
StatSoft. (2018). Statistica Features. Retrieved February 3, 2018, from StatSoft: http://www.statsoft.com/Products/STATISTICA-Features
Trompenaars, F., & Hampden-Turner, C. (2000). Riding the Waves of Culture: Understanding Cultural Diversity in Business. London: Nicholas Brealey Publishing.
Zhou, P., Fan, L. W., & Zhou, D. Q. (2010). Data aggregation in constructing composite indicators: A perspective of information loss. Expert Systems with Applications, 37(1), 360-365.

DIMENSIONING THE CONTEXT OF CORPORATE SOCIAL RESPONSIBILITY
Goran Kutnjak*1, Dejan Miljenović
1, Ana Obradović
1
1Faculty of Economics, University in Rijeka
*Corresponding author, e-mail: [email protected]
Abstract: Corporate Social Responsibility (CSR) has change the role of business in society by transforming companies dedicated exclusively to shareholder’s value to companies that embrace environmental and social commitments. CSR has become the subject of global scientific and institutional research regarding multiple aspects of finances, environment and society. CSR concept is applicable to companies of different sizes, although it is most discussed within large companies due to their significant impacts and market strengths. However, this doesn’t exclude CSR in small and medium companies. Global empowerment of CSR policies and strategies brings their dimensioning to a focus. Many national laws and policies within EU and countries of the Southeast Europe include principles of transparency, social and gender equality along with long-term environmental sustainability. Effective managing of sustainability issues related to community and stakeholders becomes important indicator of business performance. Aim of this paper is to extract implementation levels of CSR in business strategies with reflection on contemporary management. Keywords: company, sustainability, corporate social responsibility, management, stakeholders
1. INTRODUCTION
CSR has developed from pure selective philanthropy business engagement to nationally implemented laws that explicitly regulate sustainability management in organizational environment. There are three basic dimensions or pillars of CSR: financial, social issues and ecology. The main question is not only being the profit used sustainably but also was it generated sustainably. Next issue is focusing on general company contributions to social innovations and prosperity. It is a matter of strategic positioning of business within society to simultaneously encourage generation of social and business value added. Because of that companies giving more to society than to the shareholders are not a problem anymore, they become a tool for creating solutions for urgent social problems and challenges. According to Schmidpeter, (2013, p.171) this redirection (in the sense of sustainable entrepreneurship) is a real and fundamental contribution to business performance in the sustainable development of our society. It is an investment in the competitive ability of the company and in the future of new generations. There are differ opinions regarding the role of social responsibility in society. Classical approach claims that business has only the financial responsibility of achieving profit by respecting the law (pure profit - an economic view of social responsibility). This is advocated by monetarists and economists on the supply side. In the middle are people who simply want corporate governance to be more sensitive to the social impact of their decisions, especially in terms of potential harm to the stakeholders (social awareness or ethical social responsibility). These are economic liberals and neo-Keynesian interventionists. On the other end stand those who want to see businesses actively involved in programs that cure various social "illnesses"; such as providing employment opportunities for everyone, environmental protection and justice promotion around the world, even though it means cost to the shareholders (altruistic social responsibility or service to the community). Business ethics and corporate governance are combined to create conditions for achieving organizational excellence. Social responsibility is nothing more than a characteristic of organizational excellence and shows the wealth of corporate beliefs, values and cultures to the extent that they affect the larger civil society they are part of. Therefore, companies take into account social responsibility, and indirectly state that social responsibility is essentially voluntary, yet it can be used strategically to influence the corporate brand image (Mohanty, 2007). Over the last three decades’ numerous companies have adopted and implemented the concept of socially responsible business. However, a limited consensus has emerged about what socially responsible business really means. Agreeing around one definition would be very difficult, because each of them represents a different standpoint and somehow tries to explain the relationship between business and its environment. This is acceptable because each organization or company is specific in its operations, shareholders, stakeholders and environment. As a modern concept of management CSR enters the era of its dimensioning
in 21st century and adapting to a new role of sole sustainability business model. In this paper context for
dimensioning CSR will be elaborated regarding its historical content, organizational participants and business sustainability processes.
2. HISTORICAL CONTEXT OF THE CSR
Dimensions of social responsibility have changed the way business and society cooperate, ranging from companies with low social community interactions to companies highly involved in social activities. The notion of socially responsible business supports the idea that businesses cannot act as isolated economic entities that dissociate themselves from a wider society. In simple terms, socially responsible business can be understood from the three words that the phrase contains: "socially" refers to the local communities with which they interact, the "responsibility" on both sides of these relationships and "business" that encompasses a large spectrum of companies (Bhaduri, Selarka, 2016, p.13). It is a fact that CSR is not fully regulated by any official law. In practice company decides on models of CSR implementation and fulfillment. As such CSR has become an unconsciously legitimate practice. The evolution CSR concept had six phases, from 1950 to 2000 onwards. These phases are (Bhaduri, Selarka, 2016): 1) 1950s – 1960s - period of defining and introducing social responsibility into the academic field and
corporate philanthropy; 2) 1970s - period of rapid spreading of business concept of the social responsibility; 3) 1980s - period of stakeholder theory and business ethics; 4) 1990s - period of introduction of corporate social responsibility - CSR; 5) 2000s and beyond - period of empirical research intended to determine the CSR effects to business
strategy. Sixty years marked the period of significant growth in the formalization of corporate social responsibility (CSR) definition. However, philanthropy manifested itself as the most important determinant of social responsibility in THE 1960s. The next decade of 1970s was characterized by concepts of socially responsible business and corporate social performance. The development of new definitions of social responsibility dominates in the 1980s. Themes as public policy, business ethics, stakeholder theory and management became a part of social responsibility. During the late 1980s and early 1990s, the concept was further expanded by the introduction of the Triple Bottom Line (TBL) representing the balance between company financial, social an environmental business results. The concept of business ethics or corporate philanthropy has a longer development base from 1920 to 1980s. In the 1950s, the primary focus was on corporate responsibility toward society and for society. In key events of the 1960s of the last century, people and ideas were instrumental in marking the social changes that have emerged during that decade. Although managers tried to apply traditional management functions to the problems of social responsibility even before, it was not until 1980s that business and social interests became closer to each other and when companies became more sensitive to their stakeholders. During the 1990s, the idea of socially responsible business became virtually and universally approved and became an important strategic issue during the 2000s (Moura-Leite, Padgett, 2011). In the 21st century there is a shift from theory to empirical research on topics such as stakeholder theory, business ethics and sustainability. In current global economic conditions CSR relates to different types of market crisis. Financial crisis from 2007 indicated that there was no responsibility among financial institutions. However, 2007 crisis was not only financial one, because it also involved difficult environmental, social and energetic moments of the crisis. Crisis issues of energy supply demands and high consumption of natural resources brought sustainability of energetic sector to multiple question. Social sustainability is still aggravated by the social issues of high unemployment rates among young people, equality and working rights of women, child labor and corruption. Environmental issues nowadays form important part of financial risks due to ecological scandals of multinational corporations. To pursue environmental protection and sustainable development became mainstream CSR paradigm of management. All of the mentioned represent dimensions within which CSR develops today and according to them it will outline its future path that will always depend on society needs, which form contemporary market trends.
3. CSR RELATIONS IN A MODERN COMPANY
CSR is a part of a new management paradigm, strongly advocating sustainability issues being solved in cooperation with community and the stakeholders. Omazić and Baljkas (2005) state it as a concept of company management in order to realize profits but also to meet social and environmental protection criteria,

with the ultimate goal of sustainability and satisfaction for all involved stakeholders. The European Commission defines CSR as a "concept by which a company voluntarily integrates environmental issues in its business activities and relations with interest-influencing groups (owners, shareholders, employees, consumers, suppliers, government, the media and general public)". These groups are called stakeholders and they are divided on internal and external stakeholders. Some authors understood social initiatives as the most important activities that corporation undertakes to support the company value and make a commitment to socially responsible business. Socially responsible business represents the commitment of the company to improve community well-being through discretionary, voluntary business practices and contributions to the account of its own resources. The most important element of this definition is volunteerism. Kotler and Lee (2009, p.14-15) here do not include mandatory business activities demanded by law, nor activities that can be expected due to their ethical nature. According to them it is a matter of voluntary commitment of the company to go beyond the usual level of business practice when giving various socio-economic contributions. CSR is always preconditioned to give balance between profits, environmental protection and social equity. It is what is called ˝3P˝ - people, planet and profit. There are two basic dimensions of CSR: 1) The internal dimension - includes everything in the organization and relates to areas such as: a) human
capital management, b) health and safety at work, c) adaptation to changes, and d) management of environmental and natural resources impacts. Responsible practices in the field of environmental protection mainly concern the management of natural resources that are used in production.
2) The external dimension - refers to a) local community, b) various stakeholders (alongside employees and stockholders): business partners, suppliers and consumers, c) respect for human rights, d) global environmental care,
One area of CSR gains a special momentum in the given circumstances. – the area of CSR reporting. CSR reporting enables efficiency analysis of implemented CSR policies as it provides insight into the company Triple Bottom Line (TBL). TBL includes the aspects of business responsibility in the area of financial, environmental and social impacts of one organization (Miljenović, 2016, p.57-58). TBL concept in his basic form is used as a framework for measuring and reporting sustainability goals related to environment and social aspects who interact simultaneously. Measuring business performance in terms of sustainability includes three levels of measurement and evaluation of business operations (Bodiroga Vukobrat, Barić, 2008, p.20-21): 1) economic results that include measurements of financial and operational aspects; 2) the environmental aspect focusing on the emission of harmful substances, consumption of energy,
water, air and generating other various impurities and their impacts on nature; 3) a social aspect that attracts attention to health and education of employees, social justice and the
protection of employees.
The social dimension measures the benefits in terms of human capital, including the position of a company in a local community. This dimension increases with righteous and contributing work practices and by engaging business in the community. Environmental dimension control is about managing, monitoring and reporting on energy and material consumption, generating waste and emissions. Corporate sustainability measurement is always based on environmental impact, community relationships and company contributions to the stakeholders. During the 1990s business entities and their leaderships exclusively sought responsibility for financial success, while today there is an increasing demand on business organizations (from governments, consumer associations, and communities) to operate in a way that benefits society as a whole. The question of social responsibility usually emerged in those areas of business activity that were not legally regulated and where there was no certainty regarding ethically correct approach (Črnjar, Črnjar, 2009, 182 - 183). Business ethics also depends on the company culture. The decision to conduct an ethical activity is always a basic expression of moral behavior. Companies in this case have to determine their ethical values and promote them internally and, most of all, externally i.e. towards its stakeholders. To bring an ethically right decision management has to detect and engage stakeholder ethical values into decision making process. There are many positive impacts of ethical elements within the CSR like attracting customers and better employees (related to increased productivity) and avoiding possible environmental and social risks. There is also one more important part of business success based on ethical behavior. This part is about attracting investors who recognize organizational inputs in the CSR and the additional value it creates. Ethical behavior is one of the CSR basics and crucial to gain stakeholder or public confidence and cooperation. The American CSR model differs slightly from European one. For example, in the USA business responsibility program is "sold" through charitable foundations or philanthropy, while in Europe, focus is held on targeted social programs and sustainable business projects. Furthermore, in the USA workplace is based

on the principle of individualism, while in Europe the principle of collective solidarity prevails (Madrakhimova, 2013, p.511). CSR as a concept with many definitions and practices can be implemented and understood differently for each company and country. Moreover, CSR is a very broad concept that addresses many different topics such as human rights, corporate governance, health and safety, environmental impacts, working conditions and contributions to economic development. Regardless of the definition, the purpose of social responsibility is to encourage changes to sustainability, especially within conformed business community. Definitions of business sustainability can be presented by the pyramid of social responsibility. The pyramid is comprised of four types of responsibilities (Figure 1).
Figure 1: Pyramid of the social responsibility
Source: Carrol, A. B. (1991) The Pyramide of Social Responsibility: Toward the Moral Management of Organizational Stakeholders. Business Horizons, 34(4), 39-48.
This original pyramid emerges economic responsibility as the most basic one. However, this can be a theoretical or practical illusion. Economic responsibility doesn’t necessarily correlate to financial performance. Economizing relates also to management of natural and human resources. To manage this resource in a sustainable manner reflects company financial performance. Also, investors prefer investments of low environmental or social risk as adequate and with attractive returns. Legal responsibility implies compliance with all laws, in accordance with all regulations. These include environmental protection and consumer laws, safety at work regulations, meeting all contractual obligations, and guarantees. Ethical responsibility is a part of individual character, although defined as obligation to do what is right and fair and to avoid damage to stakeholders (employees, consumers, the environment and others). It is preferable to avoid questionable practices and operate beyond the required minimum of social or ecological standards. Managers need to do what is right, fair and just and establish ethical leadership. However, this again, depends, exclusively on their behavior, cultural and educational development. Philanthropic responsibility i.e. to contribute to the financial and human resources of the community and to improve the quality of life has an aim to provide programs that support communities - education, health / human services, culture and art. It is also necessary to promote and participate in volunteering. All of these responsibilities make company a ˝good citizen˝. Objective is to go far more than basic moral principles, the conviction that this is the "right thing" and concern for the benefit of current and future generations and to encourage the company to consider its responsibility.
PHILANTROPIC RESPONSIBILITIES
ETHICAL RESPONSIBILITIES
LEGAL RESPONSIBILITIES
ECONOMIC RESPONSIBILITES
BE A GOOD CORPORATE CITIZEN
BE ETHICAL
OBEY THE LAW
BE PROFITABLE
Contribute resources to the
community; improve quality
of life
Obligation to do what is right, just
and fair
Law is society’s´ codification of
right and wrong
The foundation upon which all
others rest

The motive for socially responsible business is often the pressure of the public (e.g. clients, consumer protection associations, non-governmental organizations involved in environmental protection, human rights organizations, etc.). CSR is a crucial generator of company reputation and brand value. In addition, it is clear that company reputation affects stock price, shareholder value and customer loyalty, which is a very valuable motive that should not be forgotten (Krkač, 2007, p.380). The company can grow with or without social responsibility, but doing good to others allows the company to benefit in different forms of capital than only financial one. CSR enables company to develop stakeholder capital (i.e. stakeholder relations), better human capital and conserve different forms of natural capital/resources in terms of ecological efficiency.
4. DIMENSIONS OF THE CSR IN THE EUROPEAN UNION AND CROATIA
In the world of multinational investments and global supply chains, CSR must also be taken beyond national limits. Rapid globalization has prompted debate on the role and development of global governance. Social responsibility is an important business sector policy for the EU in terms of promoting sustainable development, innovation and competitiveness in the EU's market economy. In this context, the European Commission strongly promotes the sustainability and accountability of European companies, regardless the seize. Moreover, socially responsible business is used to enhance the development basis and opportunities for market growth and innovation. This requires careful monitoring of social changes and expectations from the stakeholders to the companies. Important part of the EU CSR policy is the adoption of new sustainable business models. These models aim to improve consumer confidence and give sustainable quality at a high level of assurance. European Commission in its Green Paper of 2001 strongly promotes the importance of socially responsible business, as a path to sustainable development embedded in relevant European policies and activities. The Commission states that "socially responsible business can contribute to sustainable development, boosting Europe's innovative potential and competitiveness, thereby contributing to employment and job creation through the development of sustainable technologies" (Yildiz, Ozerim, 2014). The European Program for Supporting Corporate Social Responsibility includes (European Commission, retrieved from: http://ec.europa.eu/growth/industry/corporate-social-responsibility_hr): - spreading good practice; - improving and monitoring the level of trust in business; - increasing market benefits for socially responsible business; - improving the release of general information and especially environmental information; - a more comprehensive integration of CSR into education, training and research; - better alignment of the European and national CSR approaches. The Commission expects European companies and businesses to show their constant commitment to socially responsible business through responsible, transparent and sustainable business behavior.
4.1. Public CSR policies in the EU
In response to the urgent needs to tackle unemployment, climate and demographic change in Europe, the "Enterprise 2020 Manifesto for Action" (CSR Europe, 2015) should emerge by 2020 social responsibility associations across Europe, involving over 40 national partner organizations and over 10,000 companies across in European Business Network for Corporate Social Responsibility. Parts of this network are also Responsible Business Forum Serbia and Croatian Business Council for Sustainable Development (HR PSOR). "Enterprise 2020 Manifesto for Action" invites companies and governments to work together through three strategic priorities over five years, from 2015 to 2019 including: 1) enabling employment and community engagement, value chain management, 2) engage as committed partners with communities, cities and regions to develop and implement new
sustainable methods of production, consumption and life, 3) promote transparency and respect for human rights as the focus of business behavior. These actions frame the social responsibility movement set by the European Commission in its "Europe 2020" strategy, which requires smart, sustainable and inclusive growth. The European Commission sets out socially responsible activities for business in the EU countries that can be summarized in following (Mullerat, 2013): a) adopting CSR action plans and strategies; b) responsible supply chain management; c) CSR reporting; d) addressing climate changes;
e) small and medium-sized enterprises; f) socially responsible investment; g) education and socially responsible business; h) public procurement relied on social responsibility. All of the noted are important, however, some points can be especially emphasized. For instance, according to Mullerat (2013, p.17-18) the number of companies reporting on CSR has increased considerably over the last few years. At a global level, annual global reporting increased from almost zero in 1992 to a total of 4,000 reports in 2010. Despite the crisis, the growth rate of reporting declined slightly in 2009. Although this trend is growing, companies reporting on CSR make up only a small share of global business, with some 82,000 multinational companies and more than 23 million of small and medium-sized businesses. EU is intensively addressing climate changes in sectors such as electricity, industry and manufacturing, transport, retail, investment in clean technology, products, services, production processes related to energy efficiency, renewable energy or sustainable mobility. New technologies represent a way to appropriately channel these changes. This is where small and medium-sized enterprises play a significant role, bringing startups even to small local communities. Socially responsible investments are essentials to meet financial, social and environmental needs representing a bridge between organizations and its stakeholders. Green and technologically sustainable investments are in focus, especially in small and medium companies that provide more than 80 million jobs with a tendency to spread. United in its diversity EU contains different national policies regarding the CSR and different rate of sustainability awareness. In each country of the European Union, the development of socially responsible business initiatives depends on a set of cultural, economic, institutional and political factors that can help to provide insight into CSR priority settings. The national approach is influenced by a number of interrelated factors: economic and sectoral structure (e.g. overcoming small and medium-sized enterprises or micro-companies, prevalence of the above-mentioned enterprises in the ownership, exposure to international trade, etc.), economic development/impact of the crisis, level of institutionalization of stakeholder engagement, awareness of social responsibility, definition of social responsibility, existing policy and regulatory framework and structure of policy making (central, regional and local responsibility).
4.2. CSR in the Republic of Croatia
The importance of developing CSR practices in the Republic of Croatia is promoted by the foundation of the Croatian Business Council for Sustainable Development (hereinafter referred to as HR PSOR), based on the signed Memorandum of Understanding with the World Business Council for Sustainable Development (WBCSD), which was established in 1997. The organization was founded by 18 Croatian companies that have committed themselves to promoting sustainable business practices in order to protect the environment and contribute to all aspects of the sustainable development. With the launch of the European integration process in 2001 and the signing of the Stabilization and Association Agreement, when Croatia gained its candidate status in June 2004, it also began to strengthen its practices such as the European political and market - economic model. At the end of 2004, the 1
st National Conference on Social Responsibility, "Agenda
2005", was held. The conference has gathered more than 120 researchers and entrepreneurs and has enabled the formulation of common priorities for developing socially responsibility of national business sector. The first intention of CSR in Croatia is largely based on environmental practice (primarily among industry manufacturers). In the second phase, the interest of the companies expanded to human resources, cooperation and care for the local community. An important export incentive was to apply new, green technologies advocated by the CSR. The best example is the Croatian electric automobile manufacturer Mate Rimac. Another important stakeholder in the development of Croatian socially responsible business is surely the Community for CSR that operates within the Croatian Chamber of Commerce since 2006. Community objectives are to raise awareness for CSR in all sectors of society, to promote business ethics codes within business entities, and to organize systematic education and counseling with the aim of improving and exchanging good practices from the Republic of Croatia, the rest of the EU and the world. Important initiative in Croatia and other EU countries concerns the matter of the CSR reporting. By European legislative member countries have a commitment to represent CSR reporting as a part of a broad CSR incentives, even by law. For instance, law regulating accountancy contents in Croatia describes the need to publish environmental and social data on a regular basis (along with financial data). Another important step in CSR implementation is measuring the CSR Index of Croatian firms. This index is a methodology for assessing responsible practices in business of Croatian companies'. Index was modeled according to similar world methodologies, primarily based on the Business in the Community CR Index, which follows a systematic approach to managing, measuring and reporting on CSR business-related practices.
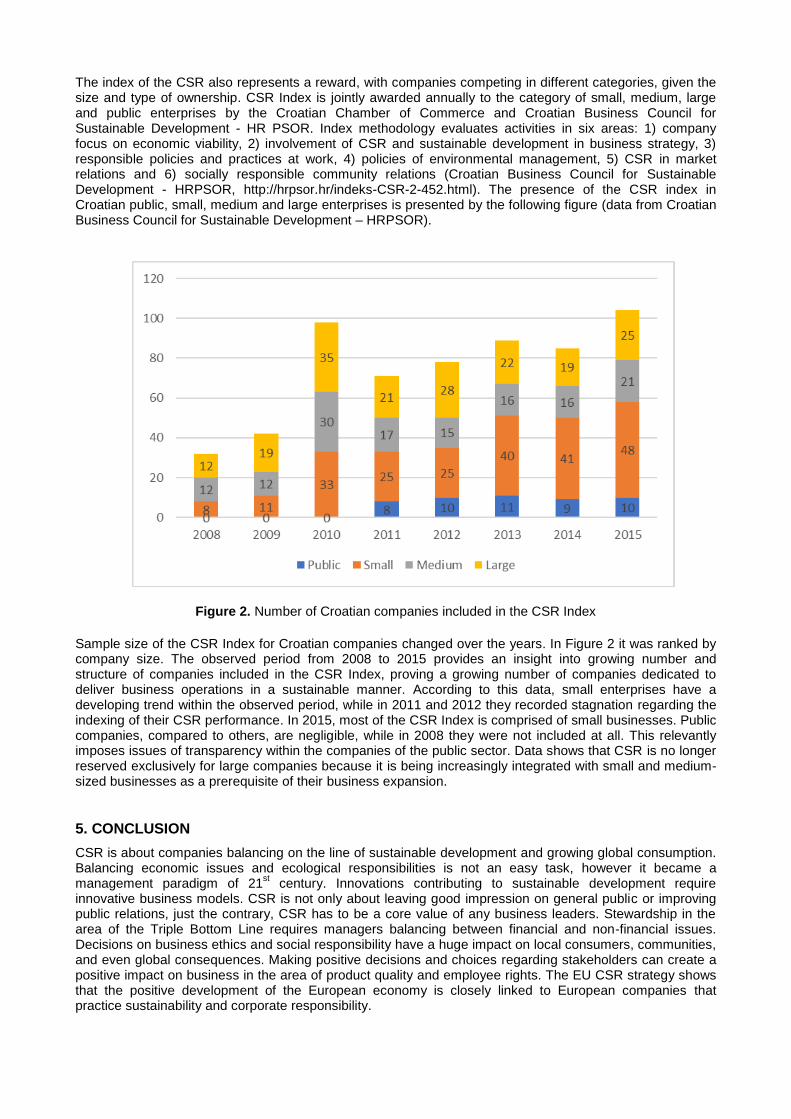
The index of the CSR also represents a reward, with companies competing in different categories, given the size and type of ownership. CSR Index is jointly awarded annually to the category of small, medium, large and public enterprises by the Croatian Chamber of Commerce and Croatian Business Council for Sustainable Development - HR PSOR. Index methodology evaluates activities in six areas: 1) company focus on economic viability, 2) involvement of CSR and sustainable development in business strategy, 3) responsible policies and practices at work, 4) policies of environmental management, 5) CSR in market relations and 6) socially responsible community relations (Croatian Business Council for Sustainable Development - HRPSOR, http://hrpsor.hr/indeks-CSR-2-452.html). The presence of the CSR index in Croatian public, small, medium and large enterprises is presented by the following figure (data from Croatian Business Council for Sustainable Development – HRPSOR).
Figure 2. Number of Croatian companies included in the CSR Index
Sample size of the CSR Index for Croatian companies changed over the years. In Figure 2 it was ranked by company size. The observed period from 2008 to 2015 provides an insight into growing number and structure of companies included in the CSR Index, proving a growing number of companies dedicated to deliver business operations in a sustainable manner. According to this data, small enterprises have a developing trend within the observed period, while in 2011 and 2012 they recorded stagnation regarding the indexing of their CSR performance. In 2015, most of the CSR Index is comprised of small businesses. Public companies, compared to others, are negligible, while in 2008 they were not included at all. This relevantly imposes issues of transparency within the companies of the public sector. Data shows that CSR is no longer reserved exclusively for large companies because it is being increasingly integrated with small and medium-sized businesses as a prerequisite of their business expansion.
5. CONCLUSION
CSR is about companies balancing on the line of sustainable development and growing global consumption. Balancing economic issues and ecological responsibilities is not an easy task, however it became a management paradigm of 21
st century. Innovations contributing to sustainable development require
innovative business models. CSR is not only about leaving good impression on general public or improving public relations, just the contrary, CSR has to be a core value of any business leaders. Stewardship in the area of the Triple Bottom Line requires managers balancing between financial and non-financial issues. Decisions on business ethics and social responsibility have a huge impact on local consumers, communities, and even global consequences. Making positive decisions and choices regarding stakeholders can create a positive impact on business in the area of product quality and employee rights. The EU CSR strategy shows that the positive development of the European economy is closely linked to European companies that practice sustainability and corporate responsibility.

In order to facilitate the CSR implementation, the European Union creates a common political framework and promotes a debate on socially responsible business. CSR strategies of the European Union seeks to introduce sustainable development at the heart of its corporate responsibility policy and member’s business strategies. The key motivation of a socially responsible business strategy in the European Union is the belief that social responsibility is good for businesses. But social responsibility is also a tool for the European economy and society as it represents more stability, sustainability and innovation.
REFERENCES
Bhaduri, S., Selarka, E. (2016) Corporate Social Responsibility Around the World-An Overview of Theoretical Framework, and Evolution, Corporate Governance and Corporate Social Responsibility of Indian Companies. Singapore: Springer.
Bodiroga Vukobrat, N., Barić, S. (2008) Socijalno odgovorno gospodarenje., Pravni fakultet Sveučilišta u Rijeci, Zagreb: TIM press.
Carrol, A. B. (1991) The Pyramide of Social Responsibility: Toward the Moral Management of Organizational Stakeholders. Business Horizons, 34(4), 39-48.
Črnjar, M., Črnjar, K. (2009) Menadžment održivog razvoja. Rijeka: Glosa. Croatian Business Council for Sustainable Development - HRPSOR, retrieved from http://hrpsor.hr/indeks-
CSR-2-452.html (2.3.2018). CSR Europe (2015) Enterprise 2020 Manifesto. European Business Network for Corporate Social
Responsibility: Milan. European Commission, retrieved from: http://ec.europa.eu/growth/industry/corporate-social-responsibility_hr
(18.1.2018). Kotler, P., Lee, N. (2009) DOP – društveno odgovorno poslovanje. Zagreb: M.E.P. CONSULT. Krkač, K. (2007) Uvod u poslovnu etiku i korporacijsku društvenu odgovornost. Zagreb: Zagrebačka škola
ekonomije i menadžmenta. Madrakhimova, F. (2013) History of Development of Corporate Social Responsibility. Journal of Business
and Economics, 4(6), 509-520. Miljenović, D. (2016) Razvoj modela standardnog izvještavanja o društvenoj odgovornosti poduzeća.
Doktorska disertacija, Sveučilište u Rijeci, Rijeka: Ekonomski fakultet. Mohanty, R. P. (2007) Shifting Paradigms of Corporate Responsibility. LBS Journal of Management & Research, 5(1and2), 3-20. Moura-Leite, R. C., Padgett, R. C. (2011) Historical backround of corporate social responsibility. Social
Responsibility Journal, 7(4), 528-539, doi: https://doi.org/10.1108/1747111111117511 Mullerat, R. (2013) Corporate Social Responsibility: A European Perspective. Miami – Florida European
Union Center of Excellenca, 13(6), 3-22. Omazić, M. A., Baljkas, S. (2005) Projektni menadžment. Zagreb: Sinergija. Schmidpeter, R. (2013) Corporate Social responsibility: A New Management Paradigm?. Salzburg, Austria:
Centre for Human Market Economy. Yildiz, A., Ozerim, G. (2014) Corporate Social Responsibility in European Context In Türker, D., Toker, H.
Altuntaş Vural, C. Contemporary Issues in Corporate Social Responsibility, pp. 43-55. USA: Lexington Books.

APPLICATION OF BIOMETRIC TECHNOLOGY IN ELECTRONIC PAYMENT AUTHENTICATION
Nikola Mehandzic1, Sanja Marinkovic*
2
1Customer Delivery Manager, Mastercard Europe
2University of Belgrade, Faculty of Organizational Sciences, Serbia
*Corresponding author, e-mail: [email protected]
Abstract: The banking industry has been experiencing pressures to increase its profitability and growth rate as a consequence of the 2008 economic crisis. One of the responses was the introduction of new technological solutions in order to attract and retain new and existing customers. Biometrics, which involves using measurable physical or behavioral characteristics, as a way of establishing or verifying identity, is among those technological solutions. This paper reviews the topic of biometrics as payment authentication method. Delphi method was implemented in order to forecast application of biometric technology where the questionnaire was sent out to experts in electronic payment and biometrics. Delphi was chosen as preferred method as usage of biometric technology in electronic payments industry is still in pioneer phase and experts had to intuitively answer the questionnaire covering three main topics: convenience of use versus security, implementation on the global level, implementation in Serbia (each of the topics is represented with a cluster of five statements). 5-degree Likert scale was used to assess to what extent experts agree or disagree with the statements offered in the questionnaire. Data obtained from the questionnaire was analyzed using SPSS. Two rounds of Delphi research were conducted. Paper presents the interpretation of results obtained through primary research and conclusions and recommendations were drawn based on both literature review and research results. Keywords: technology, biometrics, electronic payment, Delphi method
1. INTRODUCTION
Contemporary banking industry is generally characterized by low growth and excessive regulatory changes (Ernst & Young, 2016). The industry has been experiencing pressures to increase its profitability and growth rate as a consequence of the 2008 economic crisis. One of the responses was the introduction of new technological solutions in order to attract and retain new and existing customers. Main activities in banking industry are recognized as following: risk management, streaming, process/automation/technology investments, capital, liquidity and the leverage ratio, compliance with capital market regulations, reputational risk, cyber security/data security, investing in customer-facing technology, minimizing all non-essential expenditure/cutting costs (Ernst & Young, 2016). According to the report, there is a strong focus on technology-related activities, which account for 3 out of 8 essential tasks for banks, as 53% banks included in their survey answered placed customer-facing technology as a priority investment A very strong technological disruptor for the banking industry is the ever-growing popularity of smart phones as they inherently changed the way people complete many different activities, as now almost everything can be completed on the run, while doing something else. This change in the end-consumer lifestyle did not create just a need for new services and products, but it changed the core model banking industry used. One may witness a transition from multi-channel banking to omni-channel banking, which is the latest trend (IBM, 2014). While in multi-channel banking financial institutions were primarily focused on execution and transactions, the core activity of omni-channel banking is interacting with consumer. Some of the main characteristics of omni-channel banking are its client-centric approach to business, focus on interaction with customers using different channels, its baseline is system of engagements, and it heavily relies on big data (IBM, 2014).
2. BIOMETRIC TECHNOLOGY
For quite some time, various forms of passwords and security codes were thought to be the best way to protect computers, phones, and any type of relevant and important pieces of information (O'Gorman, 2003). However, as the technology developed over the time, a number of new possibilities emerged. One of them is biometrics as a method of user authentication. Biometrics includes several different indicators that can be used separately or combined in order to identify the user. The most popular indicators include a signature, a fingerprint, voice recognition, or face recognition (either through scanning the whole face or just the iris)

(Everis Digital, 2016). Other modalities include keystroke dynamics, gait, palm print, finger veins, ear recognition, etc. (Rosenberger, 2016). The importance of biometrics has been increasing mostly because consumer preferences have been changing over the time and the popularity of computers decreased in comparison with mobile phones. One of the strongest drivers of change in the financial sector is the constant increase in the number of smart phone users (Tsys.com, 2016). Hence, it does not come as a surprise that companies which customers predominantly use mobile phones for payment services have already implemented a number of new options, including biometrics as a payment authentication method. Some of the pioneers in this area are Apple, Samsung, and PayPal. Access to mobile platforms of the previously listed companies is granted or denied based on touch ID or fingerprint scans. It has been recognized that biometrics is a quick and easy solution and in most cases it contributes to a more positive customer experience (Garg & Garg, 2015). While it is undeniable that using biometric indicators has significant advantages, it also carries some significant security risks, which is the main reason why the financial sector hasn’t been so quick to adopt this option. According to a survey conducted in the first half of 2015, 22% of financial institutions included in the survey offered biometric authentication for mobile services (Mobey Forum, 2015a). The most commonly found areas of application of biometrics in the financial sector are authenticating user, payment or transaction confirmation, digital signing of documents, on-boarding of new customer, additional verification of high-risk transaction, and account management. When the rest of the participants was asked to predict when that option would be offered by companies they work for, majority of them responded that they expect that to happen in more than 12 months (Mobey Forum, 2015a). In general, biometrics “involves using measurable physical or behavioral characteristics as a way of establishing or verifying identity” and it has been recognized for the past two decades as a potentially dominant payment authentication mode in the future (Mobey Forum, 2015). Although biometric payment authentication is usually associated with fingerprints, it can also utilize palm-prints, facial and voice recognition, eye scans, and heart-rate (Edgar, Dunn & Company, 2016). Development of biometric payment authentication and its adoption have been relatively slow, but the expectations are that due to enormous popularity of smartphones, many of which already support biometrics, it will be possible to push this technology.
2.1. Research question
Previously presented information clearly shows that there is a strong focus on biometrics and its potential applications in the financial sector. One of the crucial issues is the exact point in time when this technology will be fully employed. This issue will be explored in this study, but instead of adopting global stance, the focus will be placed on Serbia as the main financial market of the interest. For now, there are no serious studies conducted in our region which would explore use of biometrics as a payment authentication method. As the research gap was identified, following research questions were formulated: 1. What are the advantages and disadvantages of the biometric payment authentication method? 2. Are there any challenges related to this method? 3. When will this method be globally applied on a large scale? 4. When will this method be available in Serbia?
3. RESEARCH DESIGN
Delphi method is used for collecting opinions from experts on a very specific topic. The method is often implemented when the subject of discussion is relatively poorly researched or developed and barely no other sources of relevant information are currently available (Okoli&Pawlowski, 2004). Experts relevant for this study were high-positioned individuals working in the financial sectors across Europe. As they are geographically dispersed, online questionnaire was chosen as the most acceptable research tool.
3.1. Delphi method design
The questionnaire consisted of three clusters of questions: convenience of use versus security, implementation on the global level, and implementation in Serbia. Each of these clusters was represented with 5 statements followed by a 5-degree Likert scale. Likert scale values varied from strongly disagree to strongly agree. Each question was formulated based on the information found in the existing literature and reports on similar surveys were consulted in order to cover all the relevant elements. The online platform Qualtricswas used to create the questionnaire and experts received an email with a link to the survey. All questions both in Questionnaire 1 and Questionnaire 2 were in a forced-choice format, meaning that a participant cannot move to the next question until the current one is answered. Overall procedure of the
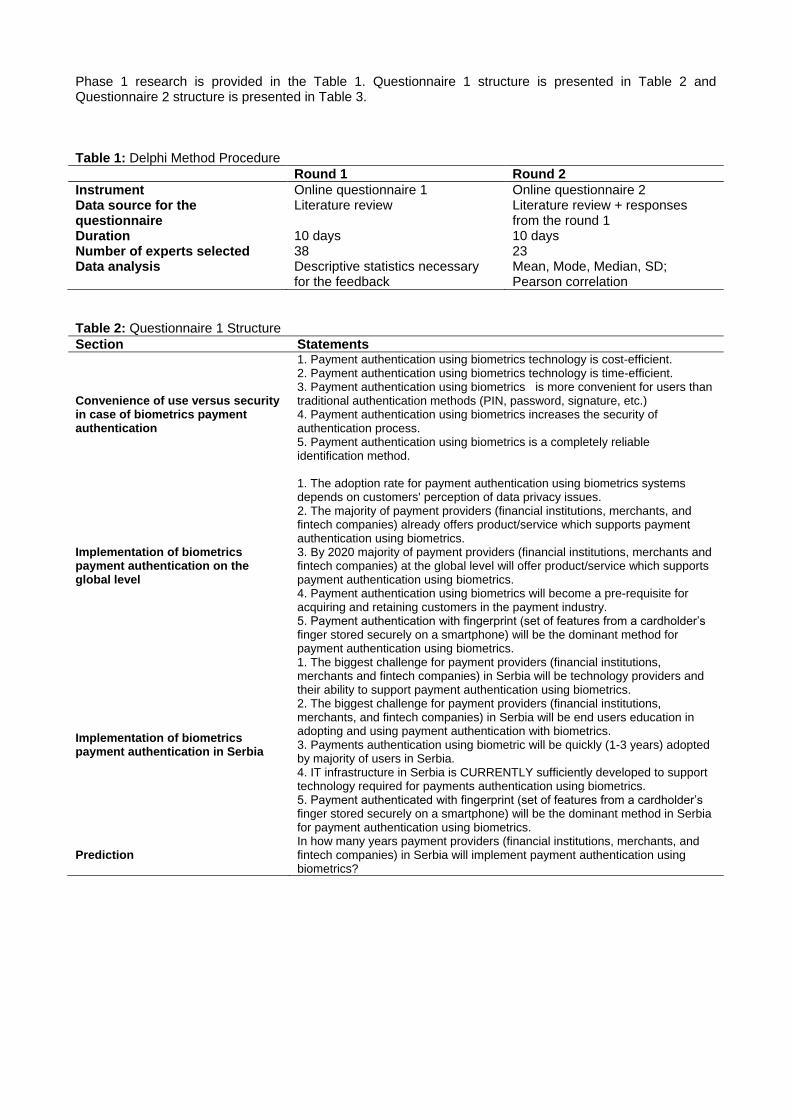
Phase 1 research is provided in the Table 1. Questionnaire 1 structure is presented in Table 2 and Questionnaire 2 structure is presented in Table 3. Table 1: Delphi Method Procedure
Round 1 Round 2
Instrument Online questionnaire 1 Online questionnaire 2 Data source for the questionnaire
Literature review Literature review + responses from the round 1
Duration 10 days 10 days Number of experts selected 38 23 Data analysis Descriptive statistics necessary
for the feedback Mean, Mode, Median, SD; Pearson correlation
Table 2: Questionnaire 1 Structure
Section Statements
Convenience of use versus security in case of biometrics payment authentication
1. Payment authentication using biometrics technology is cost-efficient. 2. Payment authentication using biometrics technology is time-efficient. 3. Payment authentication using biometrics is more convenient for users than traditional authentication methods (PIN, password, signature, etc.) 4. Payment authentication using biometrics increases the security of authentication process. 5. Payment authentication using biometrics is a completely reliable identification method.
Implementation of biometrics payment authentication on the global level
1. The adoption rate for payment authentication using biometrics systems depends on customers' perception of data privacy issues. 2. The majority of payment providers (financial institutions, merchants, and fintech companies) already offers product/service which supports payment authentication using biometrics. 3. By 2020 majority of payment providers (financial institutions, merchants and fintech companies) at the global level will offer product/service which supports payment authentication using biometrics. 4. Payment authentication using biometrics will become a pre-requisite for acquiring and retaining customers in the payment industry. 5. Payment authentication with fingerprint (set of features from a cardholder’s finger stored securely on a smartphone) will be the dominant method for payment authentication using biometrics.
Implementation of biometrics payment authentication in Serbia
1. The biggest challenge for payment providers (financial institutions, merchants and fintech companies) in Serbia will be technology providers and their ability to support payment authentication using biometrics. 2. The biggest challenge for payment providers (financial institutions, merchants, and fintech companies) in Serbia will be end users education in adopting and using payment authentication with biometrics. 3. Payments authentication using biometric will be quickly (1-3 years) adopted by majority of users in Serbia. 4. IT infrastructure in Serbia is CURRENTLY sufficiently developed to support technology required for payments authentication using biometrics. 5. Payment authenticated with fingerprint (set of features from a cardholder’s finger stored securely on a smartphone) will be the dominant method in Serbia for payment authentication using biometrics.
Prediction In how many years payment providers (financial institutions, merchants, and fintech companies) in Serbia will implement payment authentication using biometrics?

Table 3: Questionnaire 2 Structure
Question Options
Payment authentication using biometrics technology is cost-efficient for the end consumer.
5-degree Likert scale
Payment authentication using biometrics technology is cost-efficient for the payment provider (financial institutions, merchants, and fintech companies).
5-degree Likert scale
One of the most significant challenges for payment providers (financial institutions, merchants and fintech companies) in high-growing and emerging markets will be technology providers and their ability to support payment authentication using biometrics.
5-degree Likert scale
Among the following options, which one is, in your opinion, the biggest challenge for payment providers (financial institutions, merchants, and fintech companies) in high-growing and emerging markets?
technological readiness for payment authentication using biometrics,
users education in adopting and using payment authentication using biometrics,
regulation regarding payment authentication using biometrics
Which of the following two represents a greater obstacle for adopting payment authentication using biometrics (from the perspective of end users)?
data privacy risk (personal information, stored biometric data)
sensitive payment data theft (account number, expiry date, CVC2, etc.)
In your opinion, what is the expected adoption rate of payment authentication using biometrics once this service is widely available in high-growing and emerging markets?
fast (1 - 2 years) moderate (3-4 years) slow (5+ years)
Under assumption that payment authentication using biometrics becomes widely available in high-growing and emerging markets which of the following modalities will be predominantly used
Fingerprint Face recognition Iris recognition Voice recognition
4. RESULTS
Statistical analysis was conducted using SPSS. Due to choice of the research method and type of the instrument, the choice of statistical analyses was restricted. Descriptive statistics was performed (arithmetic mean M, standard deviation SD, mode, median) as well as Pearson correlation for researching the potential relationship between three sections of questions from Questionnaire 1. ICC Two-way random coefficient was calculated to estimate reliability of the constructed scales.
4.1. Phase One
Thirty eight experts were contacted with a request to complete the questionnaire in Phase 1, but only 23 of them completed the questionnaire, meaning that the response rate for Phase 1 was 61%. Response rate for each question in the questionnaire was 100%. The Likert scale used in the survey followed a usually pattern of assigning values to numbers: 1 – strongly disagree, 2 – somewhat disagree, 3- nether agree nor disagree, 4 – somewhat agree, 5 – strongly agree.
4.1.1. Convenience of use versus security in case of biometrics payment authentication
In this section of the questionnaire, the statement which was most approved by the experts was regarding superior convenience of biometrics over traditional authentication methods such as PIN, password, signature, etc. additionally, none of the experts disagreed with this statement, which wasn’t the case with others. Statement about payment authentication biometrics being cost efficient received most disagreements. Although the number of negative responses was relatively low (3 in total), the interest in this statement was also sparked because of relatively high number of participants who chose the neutral option (N = 8). Results also show that there is a general consensus that payment authentication using biometrics increases the security of authentication (16 positive answers) and that it is time-efficient (18 positive answers). Finally,

the statement about biometrics as a completely reliable identification method also received relatively high number of neutral answers (N = 7) paired with high number of positive answers (N = 14). The reason for this detected once the feedback for Questionnaire 1 was received and some of the respondents draw attention to the fact that the construction “completely reliable” was either unclear or unacceptable to them since no technological solution is completely reliable, but reliability is a continuum and, in their opinion, none of the existing solutions reached its highest value. For that reason, the conclusion was that, despite high number of neutral answers, experts believe that payment authentication using biometrics is a reliable method. In order to make results in section 1 more comparable, descriptive statistics was done for each of the statements including arithmetic mean (M), standard deviation (SD), mode, and median. ICC coefficient was calculated in order to determine reliability of the scale used. Based on these values, decision was made which of these statements remained unclear and need to be repeated in the second phase of the research.
Table 4: Questionnaire 1 Section 1 Descriptive Statistics
Statement M SD Mode Median ICC
Statement 1 3.39 .891 4 4 Cronbach’s
Alpha = .766 p = .000
Statement 2 4.17 .887 4 5 Statement 3 4.43 .662 5 5 Statement 4 4 1 5 4 Statement 5 3.65 .935 4 4
Descriptive statistics showed that dispersion of answers for each of the statements (based on the value of SD) was acceptable as SD values were in a range considered to be acceptable (they do not distort Mean value). ICC coefficient showed that the scale consisting of five items had good internal reliability, meaning that all the statements used are relevant for assessment of convenience of biometrics payment authentication. In order to determine which questions should be further clarified, information from both tables was combined. Only statement 1 was chosen to be further explored as it is the only one with relatively high SD (in comparison with other values observed) and dispersion of answers was present across the whole continuum of the Likert scale, which was not the case with other variables. Data distribution is in accordance with previous conclusions made about generally positive attitude of experts towards the convenience of biometrics payment authentication. In order to see whether this positive attitude towards biometrics payment authentication influences the prediction regarding the moment when it will be implemented in Serbia by financial institutions, merchants, and fintech companies, Pearson correlation was calculated between total score on the Section 1 Scale and number of years experts estimated as the period in which this method will be available. However, the results showed that correlation was not statistically significant (p = .406). This can be probably explained by the fact that other factors may be equally or even more relevant in determining when this authentication method will become widely available in Serbia.
4.1.2. Implementation of biometrics payment authentication on the global level
Majority of answers grouped around higher values, except for the statement regarding the current offer of biometrics payment authentication where almost 70% respondents did not support the statement. Although currently biometrics is not widely adopted, in experts’ opinion, majority of payment providers will include biometrics in their offer by 2020 (69% respondents agrees with this statement to a different degree). A slightly greater dispersion of answers was noted for the statement about biometrics being the cornerstone of retaining and acquiring new customers. Based on the answers, 21% respondents somewhat disagree with this claim and 26% of them were neither disagreeing nor agreeing. Although more than half of the sample (52%) agreed with the statement, this was in a slight disproportion with reports on biometrics and the expected significance of this payment authentication. It was also contrary to expectations to observe that 26% respondents choose neutral position regarding the dominant use of fingerprint recognition, although 70% of the sample agreed that this will be the dominant modality. Table 5: Questionnaire 1 Section 2 Descriptive Statistics
Statement M SD Mode Median ICC
Statement 1 3.91 .97 4 4 Cronbach’s
Alpha = .589 p = .002
Statement 2 2.26 1.14 2 2 Statement 3 3.57 .99 4 4 Statement 4 3.30 .82 4 4 Statement 5 3.83 .94 4 4

Descriptive statistics also confirmed that the statement with the lowest score was statement number 2, which also had the highest variation in answers (higher SD in comparison to other questions due to higher number of negative answers as well). Information about mode and median values shows that majority of respondents chose moderate agreement with statements as their answer (apart from the Statement 2). Value of Cronbach’s Alpha suggests that this scale has lower internal consistency in comparison with Section 1, which was expected as this scale covered several different aspects of biometrics implementation on a global level (security, prevalence, adoption rate, modality).
4.1.3. Implementation of biometrics payment authentication in Serbia
The most notable characteristic of answers in the third section of the Questionnaire 1 is a general increase in the number of neutral answers. This is a consequence of the fact that experts included in the research are coming from different countries across Europe and some of them were not familiar enough with the Serbian market so they did not feel competent enough to discuss specific questions relating to Serbian market. For that reason, in the Questionnaire 2 a phrase high-growing and emerging markets was used as a broader term, but one that is directly applicable to the domestic market. Majority of respondents (56%) agreed that technology providers and their capabilities will be the main challenge for payment providers, while slightly higher portion of respondents agreed that the same role will be reserved for end users education regarding biometrics payment authentication. However, there is a significant difference between these two statements, as in the case of Statement 1 only two respondents disagreed, while five respondents disagreed with Statement 2, showing more unified confirmation for that challenges for payment providers will emerge from technological readiness of the market. Furthermore, experts did not agree on the adoption rate of biometrics payment authentication in Serbia (30% did not agree that it will happen over the course of next three years, while 34% agreed). The highest number of neutral responses was recorded for the Statement 4 regarding IT infrastructure in Serbia with more than half respondents choosing the option of neither disagreeing or agreeing, which was taken as an indicator that experts have very little knowledge about this specific topic. Relatively high number of neutral responses was recorded for Statement 5 as well (43%), although it was noted that 43% respondents agreed that fingerprint recognition will be dominant in Serbian market, compared with only 13% of respondents who disagreed with this statement. Descriptive statistics confirmed previous observations that neutral answer was the most commonly chosen one (based on mode and median values). It should be also noted that while average values are lower compared to previous scales, values of SD remain similar, meaning that participants in general agreed less with the statement. Additionally, ICC coefficient is not significant for this scale (p = .513) and Cronbach’s Alpha has a negative value (-.035), meaning that this scale does not measure consistently implementation of biometrics payment in Serbia. Since this is an exploratory study, this kind of issue does not impose any restrictions on later data conclusions. However, it implies that in any potential further research special attention should be paid to scales that assess more specific characteristics of the researched topic.
Table 6: Descriptive Statistics for Questionnaire 1 Section 3
Statement M SD Mode Median ICC
Statement 1 3.70 .93 3 4 Cronbach’s
Alpha = -.035 p = .513
Statement 2 3.57 1.17 4 4 Statement 3 2.96 .98 3 3 Statement 4 2.91 .79 3 3 Statement 5 3.35 .935 3 3
The distribution of cumulative scores for Section 3 follows the normal distribution (skewness = -.478, kurtosis = -.422). Theoretical range starts at 0 as the lowest value and ends at 25 as the highest value. The observed range starts at 12 and ends at 20.
4.1.4. Prediction
In the final stage of the Questionnaire 1 respondents were asked about the amount of time needed for biometrics payment authentication to be implemented in Serbia. Based on the average value, this can be expected to happen in 4.42 years. The most commonly stated answer (Mode) was period of 4 years. It should be taken into account that standard deviation for this question is higher in comparison with all of the statements from previous sections (SD = 1.78). This is due to the fact that distribution of answers included a

range of 8 years, with 2 years period being the shortest period quoted and 10 years being the longest period quoted by experts.
4.2. Phase Two
Statements regarding biometrics payment authentication and its cost-efficiency were only slightly differently perceived from the perspective of end-consumer and providers of financial payments. Experts showed a bit positive attitude towards biometrics payment authentication cost efficiency from the perspective of payment providers (56.5%) in comparison with 52% for end consumers. Furthermore, number of experts who provided a neutral answer was higher for the statement regarding cost efficiency for end consumers (21.74% compared to 13.04%). In general, it can be said that experts believe that biometrics payment authentication is cost efficient both for end consumers and payment providers. In the context of high-growing and emerging markets, capabilities of technology providers is by majority of experts seen as one of the most significant challenges (61%), although 26% of respondents does not share that opinion. Descriptive statistics confirmed that majority of experts agreed with the statements provided in the Questionnaire 2. It is observable that standard deviations are slightly higher in comparison with those obtained in the Questionnaire 1, implicating that there was a higher variability among answers. No ICC coefficient was computed as questions were grouped based on type and not topic.
Table 7: Questionnaire 2 Descriptive Statistics
Statement M SD Mode Median
Statement 1 3.43 1.20 4 4 Statement 2 3.26 1.05 4 4 Statement 3 3.43 1.24 4 4
The following question about challenges payment providers are facing showed that opinions on experts are divided when it comes to choosing the biggest challenge: 39.13% chose technological readiness for payment authentication using biometrics, 34.78% selected regulation regarding payment authentication using biometrics, while 26.09% chose users education in adopting and using payment authentication using biometrics. Apparently, there is no consensus about the biggest challenge in biometrics payment authentication. The level of agreement among experts was higher regarding the obstacles for adopting payment authentication using biometrics. Among the two options, vast majority (78%) chose data privacy risk (personal information, stored biometric data), while significantly smaller portion (22%) selected sensitive payment data theft (account number, expiry date, CVC2, etc.). Relatively high level of agreement among experts was also observed for the question regarding the speed of adoption rate of biometrics payment authentication in high-growing and emerging markets. Majority of respondents (56.5%) predicted moderate adoption rate (3 to 4 years), while 26.09% predicted fast adoption rate (1 to 2 years) and 17% chose slow adoption rate as an option (5+ years). It should be taken into account that these values were in the context when biometrics becomes widely available, meaning that majority of payment providers offers this type of service and the penetration of mobile devices supporting all biometric authentication exceeds 50%). While in the Questionnaire 1 obtained results were not always in accordance with existing literature, Questionnaire 2 is compatible with existing reports about popularity of different biometrics modalities. Results of the research showed that 91% of respondents believe that fingerprint recognition will be the dominant biometrics modality, while face recognition and iris recognition both received one vote each. Voice recognition was not selected by any of the participants.
5. CONCLUSION AND RECOMMENDATIONS
Based on information found in various reports, articles, researches and results from the primary research, a definite conclusion is that biometrics payment authentication will be widely used in the future. Studies on consumer preferences quoted in this paper show that the extent to which people are ready to accept this technological solution varies. While some authors claim that the there is low readiness in the market for such innovation due to security concerns, some reports offer contradictory results showing that consumers are more than willing to give a chance to biometrics payment authentication. What all sources confirm is that attitude towards biometrics in general heavily depends on the modality it is associated with. There is still a strong preference for fingerprint authentication over other modalities, especially face recognition and DNA matching. A very important factor that actually influences the adoption rates is the biometric modality. Results of the primary research show that experts see fingerprint recognition as future dominant biometric modality in Serbia as well. However, before implementing such technological solution, it is highly
recommended to conduct a consumer research in order to determine which biometric modality is preferred in the Serbian market. There is a great probability that results from previous studies will be confirmed, however, it is necessary to discover which other modalities are acceptable to Serbian users. Both regulations and security issues influence the decision to implement multimodal biometric payment authentication. The biggest problem for financial institutions, banks, and fintech companies in Serbia lies in the fact that Serbian market still hasn’t achieved the necessary pre-requirements for popularization of biometrics technology - high presence of smartphones and biometric payment authentication as part of companies’ service portfolio. This means that any marketing efforts and additional investments probably would not lead to the desired results. One of the approaches that can be taken is further popularization of mobile banking, which is already booming across the world. This may be a transitional phase for users in the Serbian market as it is a step further from traditional banking services and it would make it easier for them to accept biometric payment authentication as another way of further improving customer experience. Reports coming from developed markets showed that users appreciate simplifications of different processes related to mobile banking, especially when it comes to log-in process that was in the past quite redundant (log-in was required before completing any command) (Javelin, 2016). It is reasonable to assume that Serbian consumers will follow the similar path as well, where after remote control over card activation, PIN change, ordering a replacement card, turning card payment on or off, etc. biometric payment authentication represents a natural progression.
REFERENCES
Edgar, Dunn & Company. (2016). 10th Advanced Payments Report (pp. 1-44). Ernst & Young. (2016). Seeking stability in an uncertain world. EY. Retrieved from
http://www.ey.com/Publication/vwLUAssets/ey-european-banking-barometer-2016/$FILE/ey-european-banking-barometer-2016.pdf
Everis Digital. (2016). 5 Biometric Payment Challenges solved by Startups (1st ed., pp. 1-3). Everis Digital. Retrieved from https://everisnext.com/wp-content/uploads/2015/11/5-biometric-payment-startups-by-everisdigital.pdf
Garg, R., & Garg, N. (2015). Developing a Secured Biometric Payments Model Using Tokenization. R Systems.
IBM. (2014). Omnichannel Banking: From transaction processing to optimized customer experience (pp. 1-8). IBM. Retrieved from https://www-935.ibm.com/services/multimedia/Omnichannel_banking.pdf
Javelin Advisory Services. (2016). The Future of Cardholder Verification Methods: Beyond Chip and Signature (pp. 1-35).
Mobey Forum. (2015). Biometrics in Payments: Touching Convenience (pp. 1-30). Mobey Forum. (2015a). Mobey Forum’s Biometrics Survey Results (pp. 1-17). Mobile app developers prefer biometrics as security option. (2016). Thepaypers.com. Retrieved 29
November 2016, from http://www.thepaypers.com/default/mobile-app-developers-prefer-biometrics-as-security-option/765940-0?utm_source=feedburner&utm_medium=feed&utm_campaign=Feed%3A+thepaypers%2FcfKW+%28The+Paypers+Headlines%29
O'Gorman, L. (2003). Comparing passwords, tokens, and biometrics for user authentication. Proceedings Of The IEEE, 91(12), 2021-2040. http://dx.doi.org/10.1109/jproc.2003.819611
Okoli, C., & Pawlowski, S. (2004). The Delphi method as a research tool: an example, design considerations and applications. Information & Management, 42(1), 15-29. http://dx.doi.org/10.1016/j.im.2003.11.002
Rosenberger, P. (2016). User authentication with biometrics (pp. 2-25). ENSICAEN. Tsys.com. (2016). How Smartphones are Speeding Up Biometric Authentication Adoption. Tsys.com.
Retrieved 23 November 2016, from http://tsys.com/solutions-services/acquiring-services/resource-center/how-smartphones-are-speeding-up-biometric-authentication-adoption