technology infrastructure modernization
TRANSCRIPT

Contract overview and supporting detail for selection of Nokia Networks
Nokia Networks Contract 430-10427Technology Infrastructure ModernizationGrant County PUD Common Backbone Network (GCB)
08/11/2021

Overview: Problem Statement
Our existing fiber network was developed organically over 15+ years without a wholistic design or focus on long-term operations and needs.
Equipment was not standardized and much of it has reached end-of-life requiring replacement.
The existing network is functional but a redesign is needed to meet long-term needs for performance, scalability and cost-effective life-cycle management.
Overview: Resolution Approach
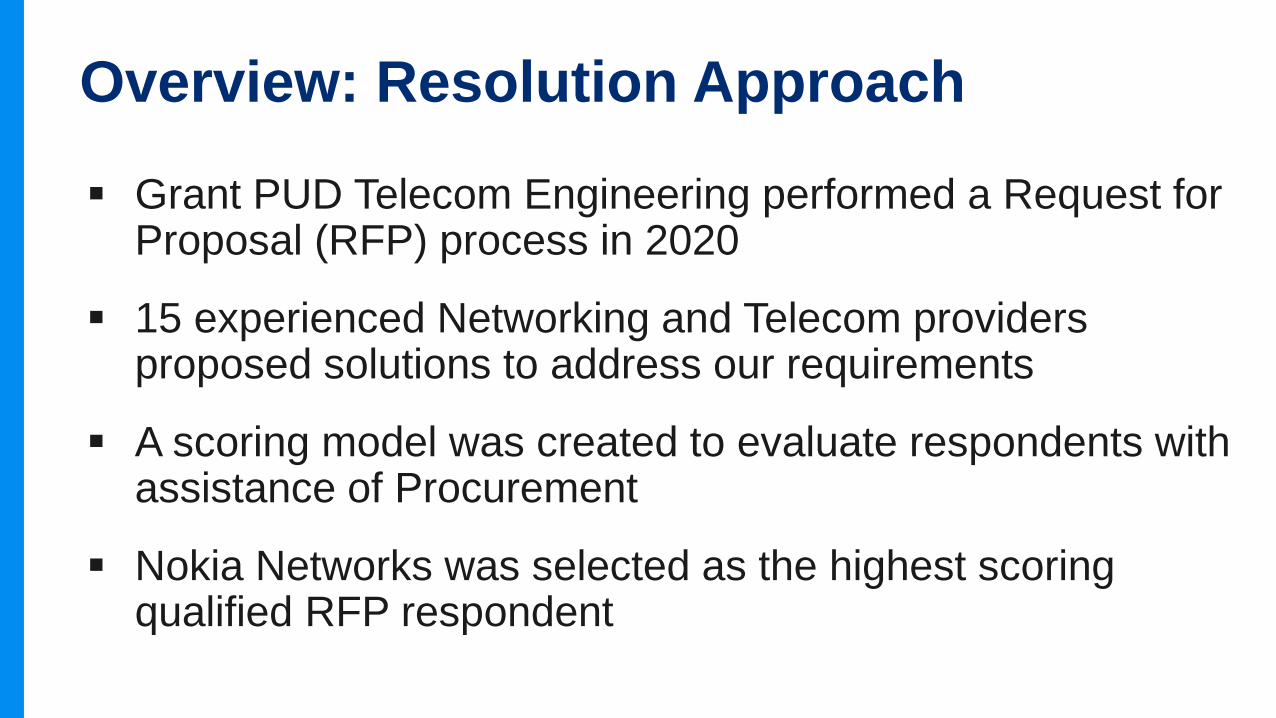
Grant PUD Telecom Engineering performed a Request for Proposal (RFP) process in 2020
15 experienced Networking and Telecom providers proposed solutions to address our requirements
A scoring model was created to evaluate respondents with assistance of Procurement
Nokia Networks was selected as the highest scoring qualified RFP respondent

Selection and Contracting Timeline
RFP Development
Start6/1/2020
RFP Response
Period
Release/Posted6/29/2020
Contract Negotiation
End of Responses7/31/2020
Nokia NetworksSelected1/19/2021
Contract NegotiationCompleted7/26/2021Response Evaluation Period
The RFP development and response period was relatively short, following by an extensive evaluation period to fully understand the response details and implications. The contract negotiations that followed selection of Nokia Networks were equally challenging as risks and legal concerns by both parties were addressed.
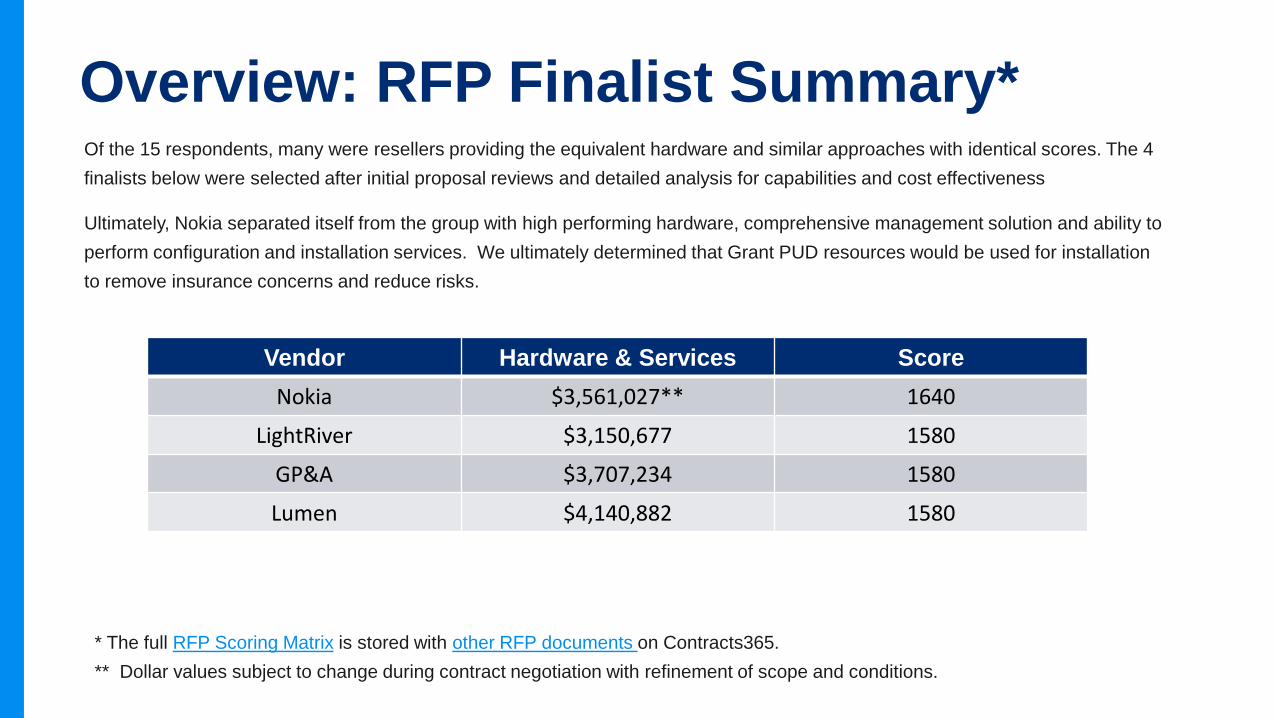
Overview: RFP Finalist Summary*Of the 15 respondents, many were resellers providing the equivalent hardware and similar approaches with identical scores. The 4finalists below were selected after initial proposal reviews and detailed analysis for capabilities and cost effectiveness
Ultimately, Nokia separated itself from the group with high performing hardware, comprehensive management solution and ability to perform configuration and installation services. We ultimately determined that Grant PUD resources would be used for installation to remove insurance concerns and reduce risks.
Vendor Hardware & Services ScoreNokia $3,561,027** 1640
LightRiver $3,150,677 1580
GP&A $3,707,234 1580
Lumen $4,140,882 1580
* The full RFP Scoring Matrix is stored with other RFP documents on Contracts365.** Dollar values subject to change during contract negotiation with refinement of scope and conditions.
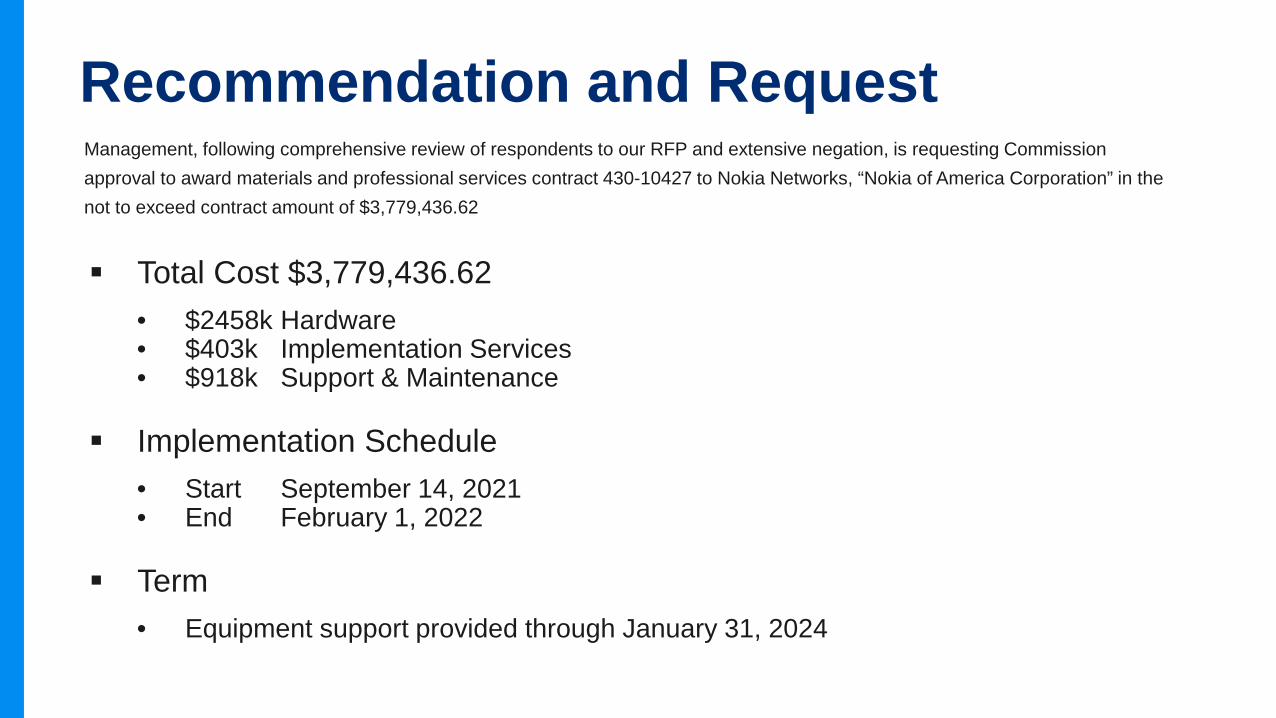
Recommendation and RequestManagement, following comprehensive review of respondents to our RFP and extensive negation, is requesting Commission approval to award materials and professional services contract 430-10427 to Nokia Networks, “Nokia of America Corporation” in the not to exceed contract amount of $3,779,436.62
Total Cost $3,779,436.62• $2458k Hardware• $403k Implementation Services• $918k Support & Maintenance
Implementation Schedule• Start September 14, 2021• End February 1, 2022
Term• Equipment support provided through January 31, 2024

7 © Nokia 2016This document contains preliminary options which are subject to appropriate information and/or consultation of the relevant employee representative body/ies where applicable and subject to necessary legal procedures and approvals. Confidential
7
EST
NQS
WAS
RCS
SND
MLK
TTN
PRD
FRH
BUK
QUS
EPH
SOACOUGRC
MLDCOL
KEY
Router
10 GE Link
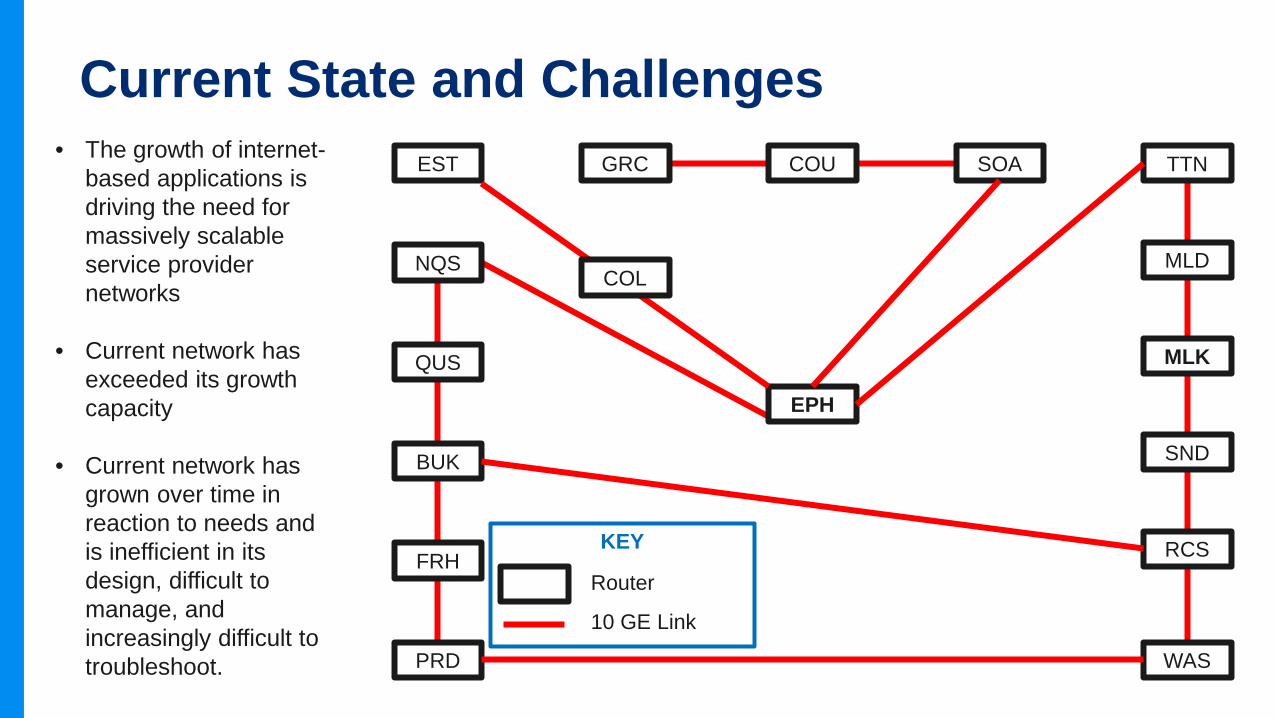
• The growth of internet-based applications is driving the need for massively scalable service provider networks
• Current network has exceeded its growth capacity
• Current network has grown over time in reaction to needs and is inefficient in its design, difficult to manage, and increasingly difficult to troubleshoot.
Current State and Challenges
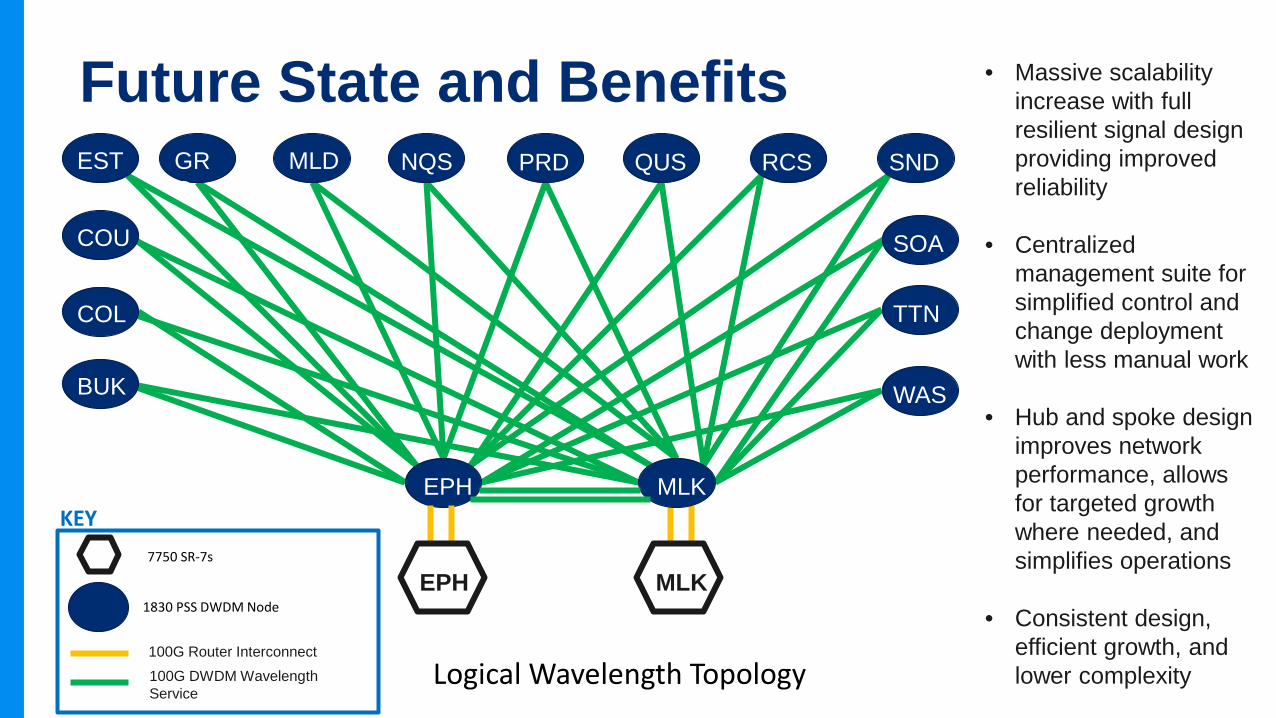
Logical Wavelength Topology
KEY
1830 PSS DWDM Node
100G DWDM Wavelength Service
7750 SR-7s
100G Router Interconnect
BUK
COL
COU
EST GRC
MLD NQS
MLK
COL 2
PRD QUS RCS SND
SOA
TTN
WAS
EPH
EPH MLK
• Massive scalability increase with full resilient signal design providing improved reliability
• Centralized management suite for simplified control and change deployment with less manual work
• Hub and spoke design improves network performance, allows for targeted growth where needed, and simplifies operations
• Consistent design, efficient growth, and lower complexity
Future State and Benefits
How will we achieve this network transformation?• Nokia to create the configurations and preconfigure the optical equipment for
GCPUD to install
• Nokia to create the configurations of the routers for GCPUD to install
• Nokia to remotely configure the Network Management systems
• Nokia to create and help execute a migration strategy to move GrantFiber hubs from the old network to the new network.
• Nokia to perform remote final testing to confirm successful migration and functionality of the network.
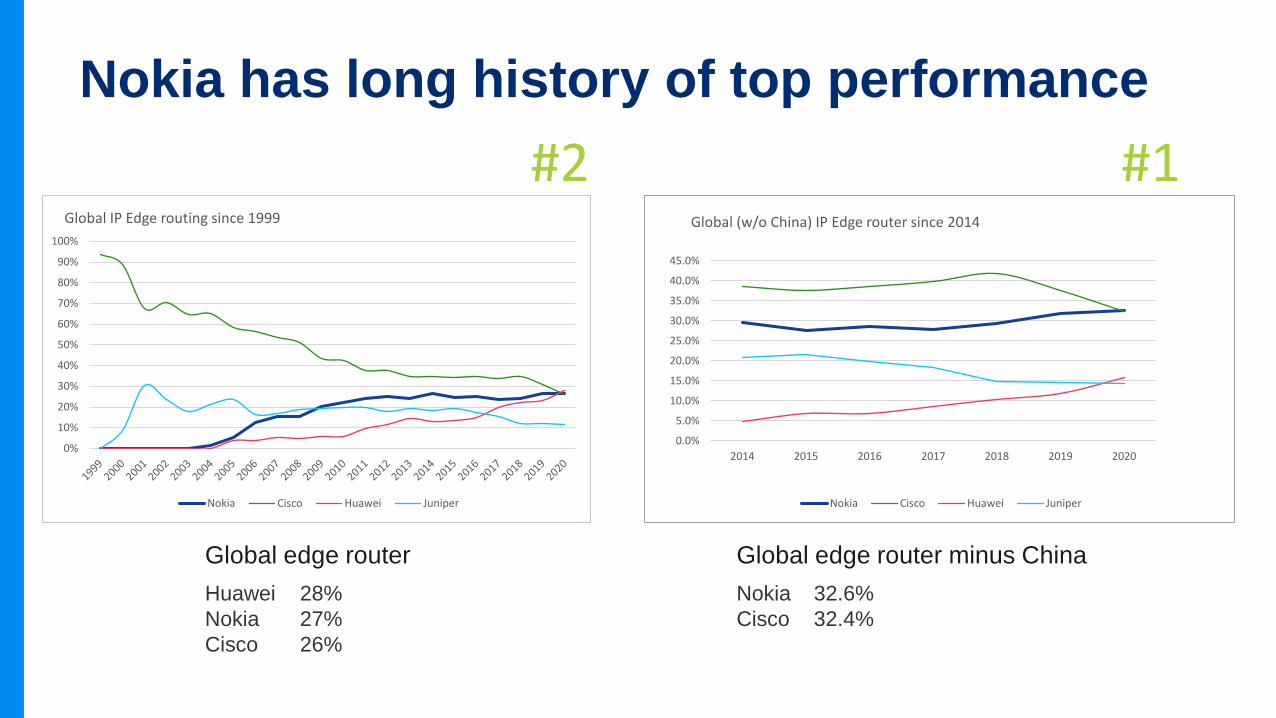
Nokia has long history of top performance
0%
10%
20%
30%
40%
50%
60%
70%
80%
90%
100%
Global IP Edge routing since 1999
Nokia Cisco Huawei Juniper
0.0%
5.0%
10.0%
15.0%
20.0%
25.0%
30.0%
35.0%
40.0%
45.0%
2014 2015 2016 2017 2018 2019 2020
Global (w/o China) IP Edge router since 2014
Nokia Cisco Huawei Juniper
#2 #1
Global edge router Huawei 28%Nokia 27%Cisco 26%
Global edge router minus China Nokia 32.6% Cisco 32.4%
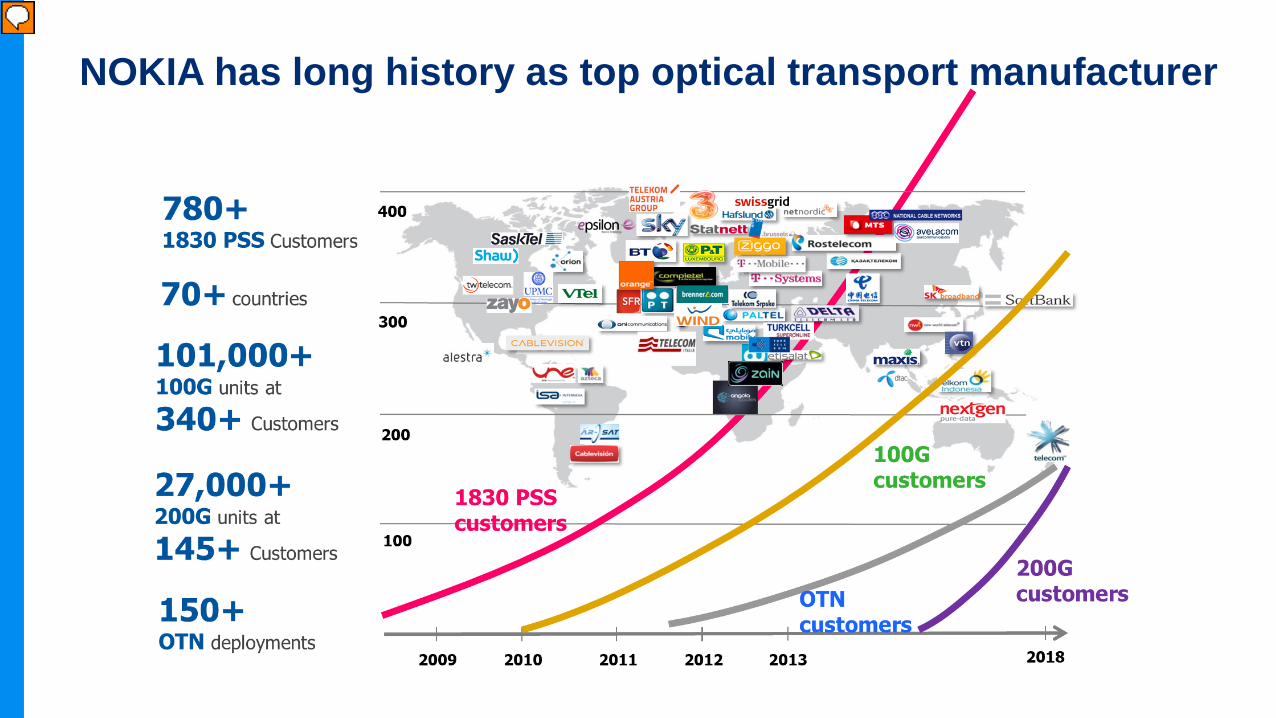
NOKIA has long history as top optical transport manufacturer
Variance: Contract Price vs ProposalThe original vendor responses to the RFP all provided viable solutions for the near-term growth in network traffic. The Nokia proposal provided 3 alternatives, including the selected option for an architecture that was much simpler to manage and operate with a lower level of required engineering overhead.
After initial review, Telecom Engineering identified opportunities to enable future growth without a second round of equipment replacement by utilizing a larger chassis (essentially buying a larger cabinet that could be expanded over time). The largest factor in the change in price was duplication of the controller cards for added resiliency and future capacity handling. Essentially, we went from one (1) controller in each of 2 smaller boxes to dual controllers in each of 2 larger expandable boxes.
The controllers are the brains/engines of the network and the most expensive components.
Net of all changes to configuration and services, we ultimately added ~$218k to the final contract value.
Note: The initial RFP responses were priced on proposed solutions, not the ultimate final configuration.

Safety ReportAugust 2021

Injuries Reported
Date Injury Description Cause(s) Prevention
7/15/21 EyeWhile performing maintenance on electric carts a coworker notice a bloodspot on an employee's left eye. Unknown Cannot determine
7/29th-30th COVID-19
On July 29th & 30th seven ERT employees conducting boat rescue training with an outside training provider, later the instructor reported he had tested positive for COVID-19. Additionally, two of the ERT members also tested positive following our antigen program. OSHA recordability for this incident is under review.
Exposure to COVID-19
Adhere to established COVID-19 prevention protocols.

Monthly and Year to Date
2020 Month YTD
Total Incidents Reported 1 14
Recordable Case(s) 0 3
Restricted Duty Case(s) 0 2
Lost Workday Case(s) 0 1
Level O - Other – Close Call
Level 1 – Serious Close Call
Level 2 – First Aid Case(s)
Level 3 – Recordable Injury Case(s)
Level 4 –Restricted Duty Case(s)
Level 5 – Lost Work Day Case(s)
Level 6 – Fatality or Hospitalization
19
0
2
0
0
0
0
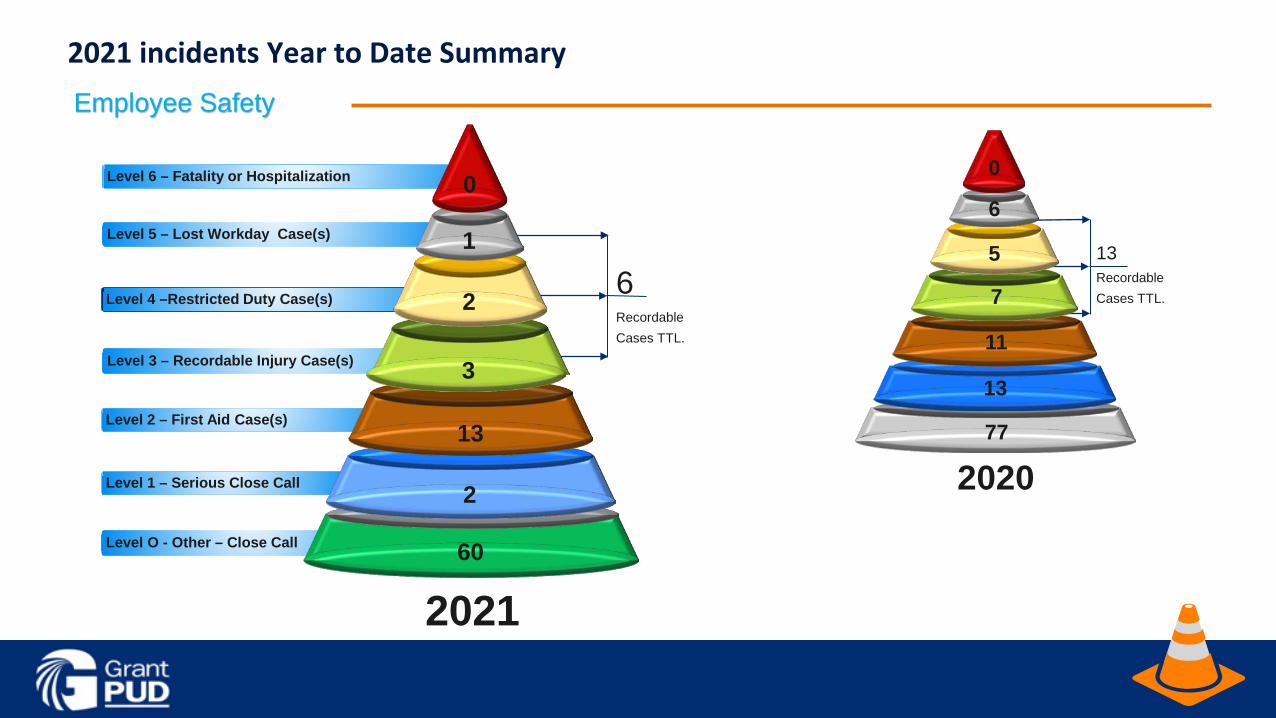
Employee Safety
2021 incidents Year to Date Summary
2021
6Recordable Cases TTL.
202077
13
11
0
7
5
6
13 Recordable Cases TTL.
Level O - Other – Close Call
Level 1 – Serious Close Call
Level 2 – First Aid Case(s)
Level 3 – Recordable Injury Case(s)
Level 4 –Restricted Duty Case(s)
Level 5 – Lost Workday Case(s)
Level 6 – Fatality or Hospitalization
60
2
13
3
2
1
0

Vehicle Incidents
Date Vehicle Driver’s Account: Prevention
7/14/2021 #473
While loosening the nut on the insulator pin on the bottom side of the arm with the gun, the insulator on the top of the arm spun off, fell, and struck the hood of the service truck. The truck had to be underneath the work in order to reach it. The lock nut was rusted to the pin causing both the nut and bolt to spin. The insulator did not move causing it to loosen from the pin without being able to see it. The bucket was placed underneath the work in case any of the hardware on the bottom side were to fall it would land in the bucket, but the insulator missed the bucket. Now there is a dent in the hood.
???
7/29/2021 #579
An employee was stopped at a stop sign waiting to turn right on to Basin Street heading north. A small car rolled into the back the back-end hitch of a Boom truck. They both pulled over, everybody was fine. to see if we were ok and both parties were fine. There were no injuries, however, she had a small indention. She opted to leave.
???
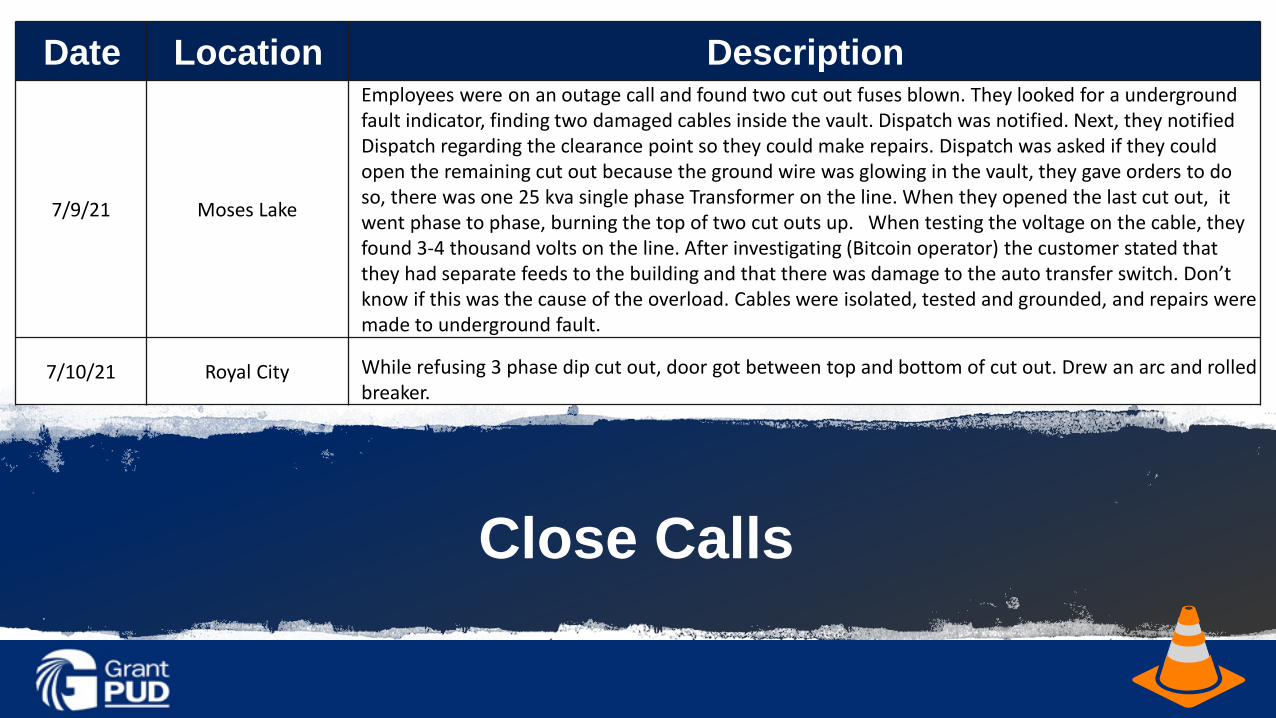
Close Calls
Date Location Description
7/9/21 Moses Lake
Employees were on an outage call and found two cut out fuses blown. They looked for a underground fault indicator, finding two damaged cables inside the vault. Dispatch was notified. Next, they notified Dispatch regarding the clearance point so they could make repairs. Dispatch was asked if they could open the remaining cut out because the ground wire was glowing in the vault, they gave orders to do so, there was one 25 kva single phase Transformer on the line. When they opened the last cut out, it went phase to phase, burning the top of two cut outs up. When testing the voltage on the cable, they found 3-4 thousand volts on the line. After investigating (Bitcoin operator) the customer stated that they had separate feeds to the building and that there was damage to the auto transfer switch. Don’t know if this was the cause of the overload. Cables were isolated, tested and grounded, and repairs were made to underground fault.
7/10/21 Royal City While refusing 3 phase dip cut out, door got between top and bottom of cut out. Drew an arc and rolled breaker.

Close Calls
Date Location Description
7/10/21 Quincy Plains
When working with a large industrial electrical contractor to energize a circuit as scheduled, the customer was called and informed that District personnel would be installing braided straps and electrically connecting to their customer equipment. The contractor for the customer confirmed he was ready and would be working on the load side of customer owned switch. A clearance was installed for District personnel to install braided straps. The straps were connected, and the clearance was released. When the clearance was being picked up, a lineman reported he saw contractors working on the utility side of the customer switch. The contractor was contacted to confirm he was working on equipment without utility isolation. He was told to stop work until they were issued a POS tag. The contractor complied and waited to resume work after he was issued a POS. (This is outstanding work by the Lineman!)
7/15/21 MLSC Parked to close to keypad, when gate fully opened and drove into yard, the back end of truck hit bottom of the keypad.
7/20/21 Moses Lake In the process of covering underground conduit with bedding sand, contractor damaged conduit. Switching in of feeder was stopped, wire was inspected, no damage found, and conduit repaired.

Close Calls
Date Location Description
7/20/21 Wilson CreekCrew was sent to change a broken cross arm. Crew began to secure the wire, the arm started to break causing phases to begin to fall. Crew worked quickly and secured the phases before any damage or accident could occur.
7/27/21 WMCSmall pipe positioner failure. The pivot shaft for rotating material worked its way out causing a piece of pipe to fall, and nearly striking the employee's foot. No one was injured, it is a design flaw, that allows the gears to move off center and becoming disengaged.
7/27/21 Wanapum Village A snake located by HVAC piping going under house. Sprague does not deal with snakes, but we have contacted game and fish in the meantime.
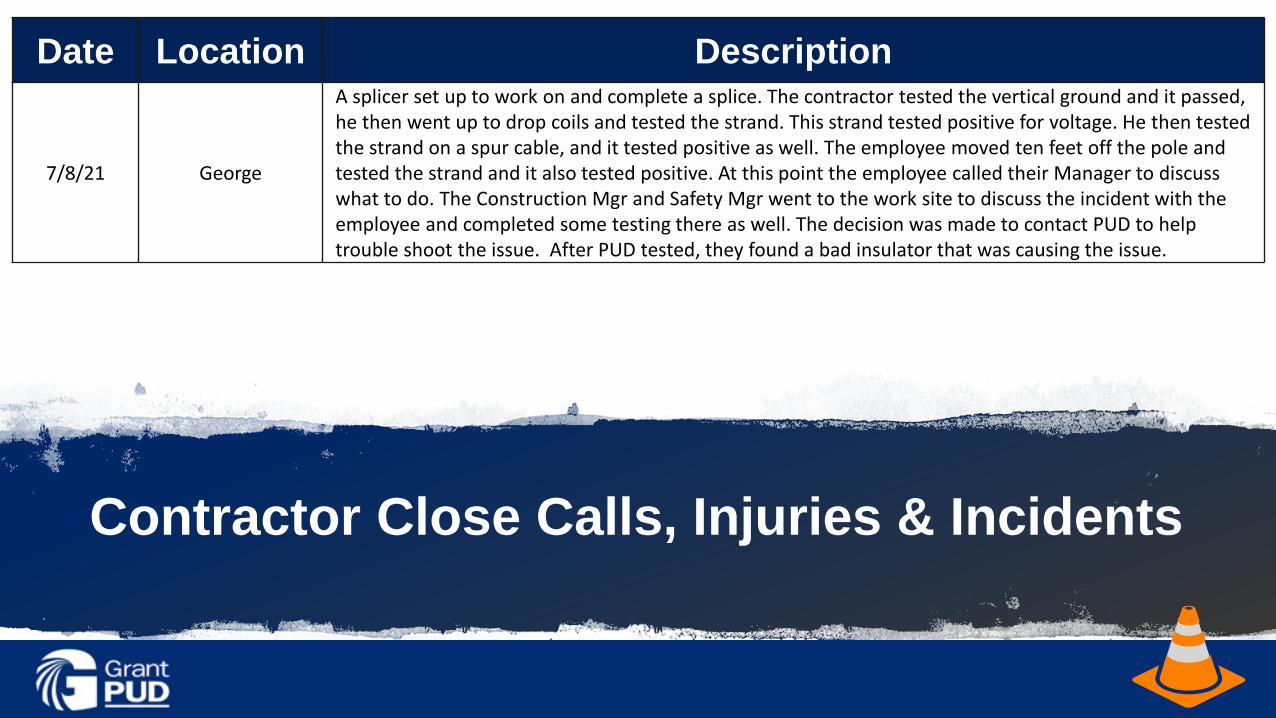
Contractor Close Calls, Injuries & Incidents
Date Location Description
7/8/21 George
A splicer set up to work on and complete a splice. The contractor tested the vertical ground and it passed, he then went up to drop coils and tested the strand. This strand tested positive for voltage. He then tested the strand on a spur cable, and it tested positive as well. The employee moved ten feet off the pole and tested the strand and it also tested positive. At this point the employee called their Manager to discuss what to do. The Construction Mgr and Safety Mgr went to the work site to discuss the incident with the employee and completed some testing there as well. The decision was made to contact PUD to help trouble shoot the issue. After PUD tested, they found a bad insulator that was causing the issue.

Leading & Lagging Indicators
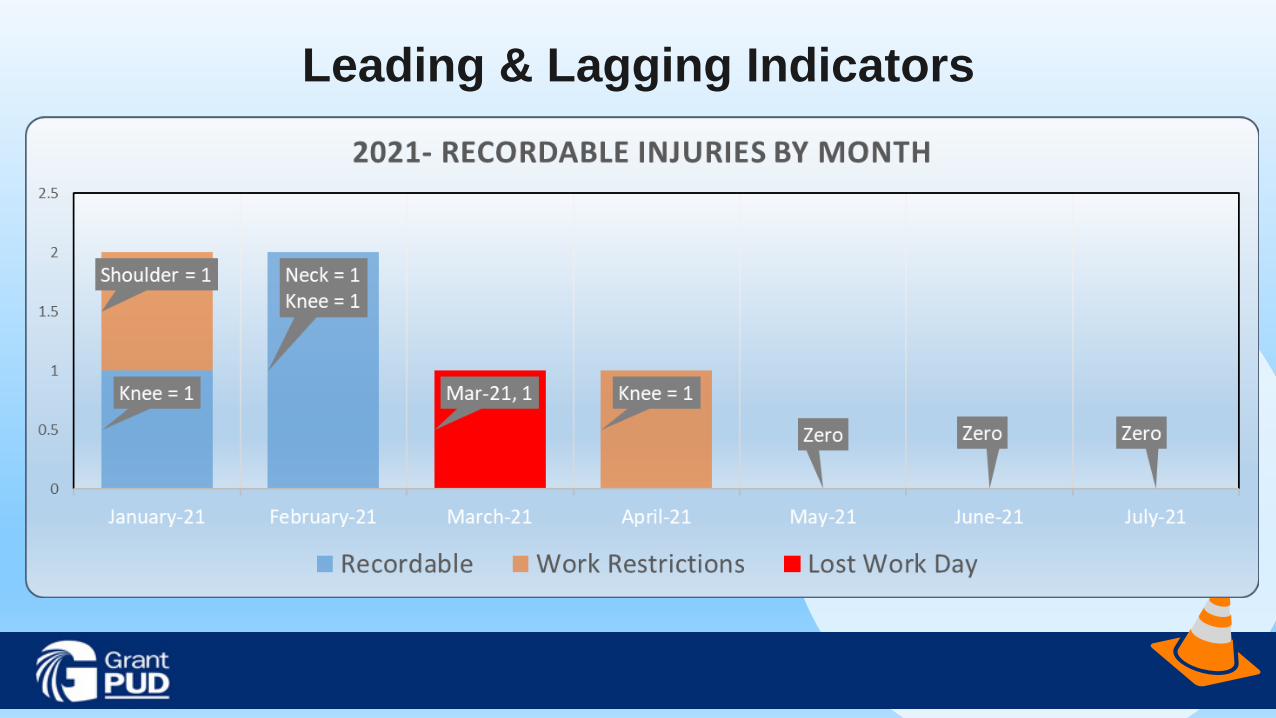
Leading & Lagging Indicators

Air Quality - Emergency RuleOn July 16, L&I adopted an emergency rule to protect workers
who are exposed to wildfire smoke on the job. This rule is effective from July 16, 2021, through November 13, 2021

Air Quality -Emergency Rule
When AQI is 300 or greater:• Work limited to emergency or critical, without respiratory
protection
• Workers should include prevention of heat stress during the job brief
• N95 respirators are available for voluntary use in outdoor areas
• Limit work to 45-minute periods with corresponding 45-minute rest period, if N95 respirator is not used
• No time restrictions on work, if N95 respirators are used.

Safety Action Item Critical Success FactorsIncident Reporting
(Date of Entry into System vs Date of Distribution Systemwide) • Number of Close Calls in July = 10• Number of Close Calls sent Next day after being entered into the system = 6
Number of Open Action Items over 60 days oldAs of June 2021 As of July 2021Year 2017 = 8 Year 2017 = 7Year 2018 = 11 Year 2018 = 9Year 2019 = 21 Year 2019 = 17Year 2020 = 10 Year 2020 = 6Year 2021 = 12 Year 2021 = 10Month Total = 59 Month Total = 49
Net - July 2021: -10
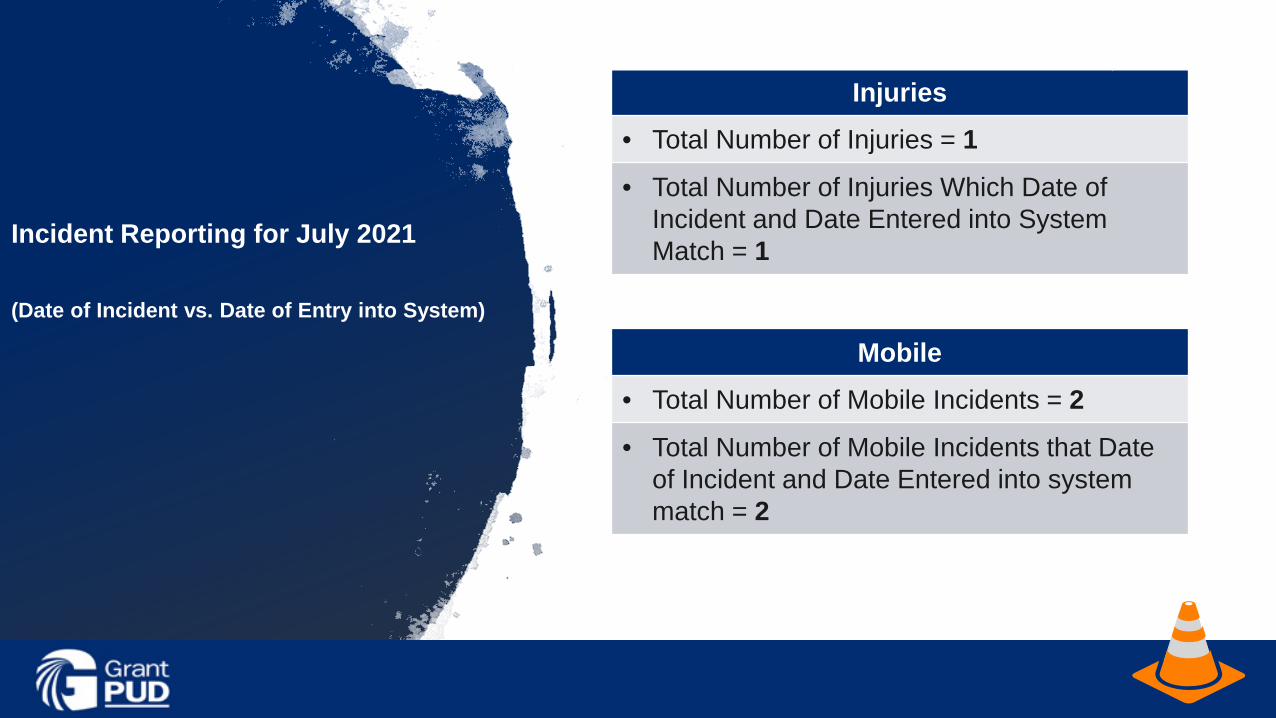
Incident Reporting for July 2021
(Date of Incident vs. Date of Entry into System)
Injuries• Total Number of Injuries = 1• Total Number of Injuries Which Date of
Incident and Date Entered into System Match = 1
Mobile• Total Number of Mobile Incidents = 2• Total Number of Mobile Incidents that Date
of Incident and Date Entered into system match = 2

Powering our way of life.
Thank You!
August 24, 2021
Sara Matzen
Salary Plan Increase
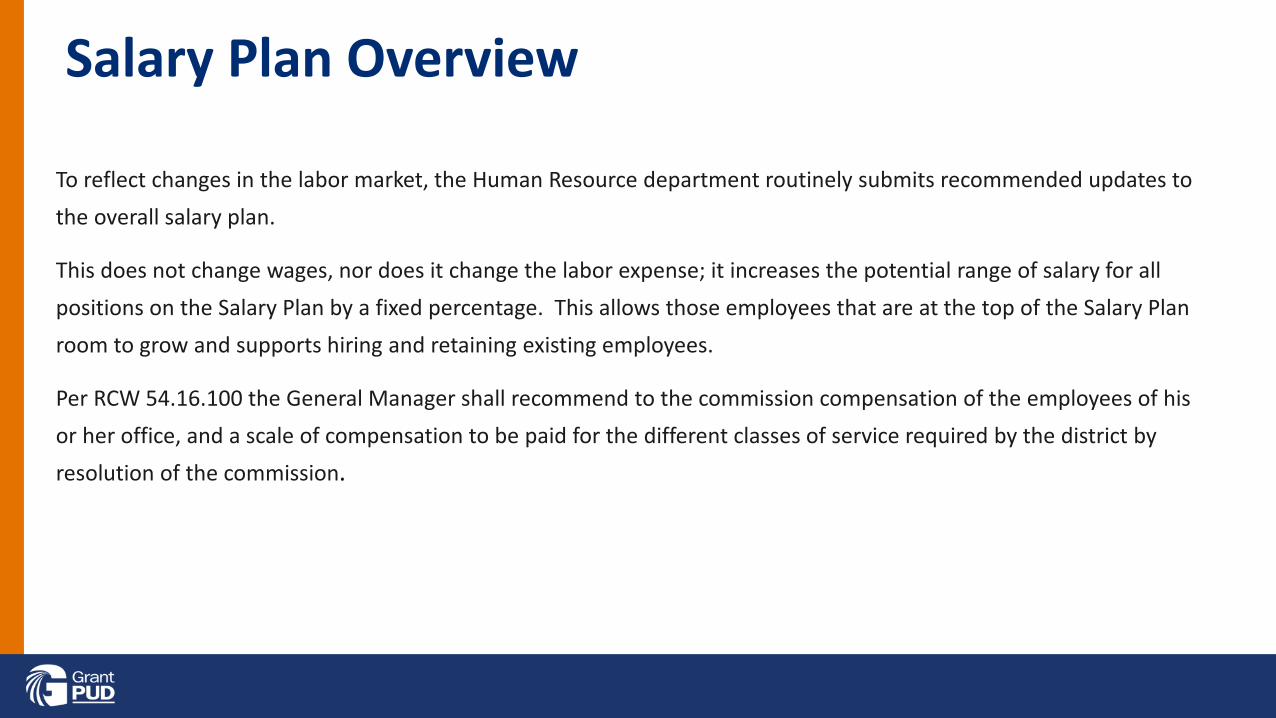
Salary Plan Overview
To reflect changes in the labor market, the Human Resource department routinely submits recommended updates to the overall salary plan.
This does not change wages, nor does it change the labor expense; it increases the potential range of salary for all positions on the Salary Plan by a fixed percentage. This allows those employees that are at the top of the Salary Plan room to grow and supports hiring and retaining existing employees.
Per RCW 54.16.100 the General Manager shall recommend to the commission compensation of the employees of his or her office, and a scale of compensation to be paid for the different classes of service required by the district by resolution of the commission.
Research conducted on Salary Plan
To develop a recommended increase, Human Resources conducted extensive research on external market data and considered the following factors:
• Grant PUD has not made any increases to the Non-Bargaining Unit Salary Plan since November 2018.
• The 2021 Strategic Plan objective is to design and sustain an engaging and fulfilling Grant PUD Culture. To meet the objective Grant PUD will recruit, develop, and retain a best-in-class workforce.

Recommended Updates to the Non-Bargaining Unit Compensation policy• Changed the title of the policy from Non-Union to Non-Bargaining Unit Employee as it is a more
accurate representation of who they are.
• Removal of references to Non-Union employees as the scope of the policy already indicates it is for that subset of employees.
• Added additional language to the scope to provide greater clarity.
• Removed reference to pay increase constraints to those hired after October 1st as it was decided that it was an unnecessary constraint to the annual budget.
• Overall grammar clean up.
• Removed career paths as the utility no longer uses them
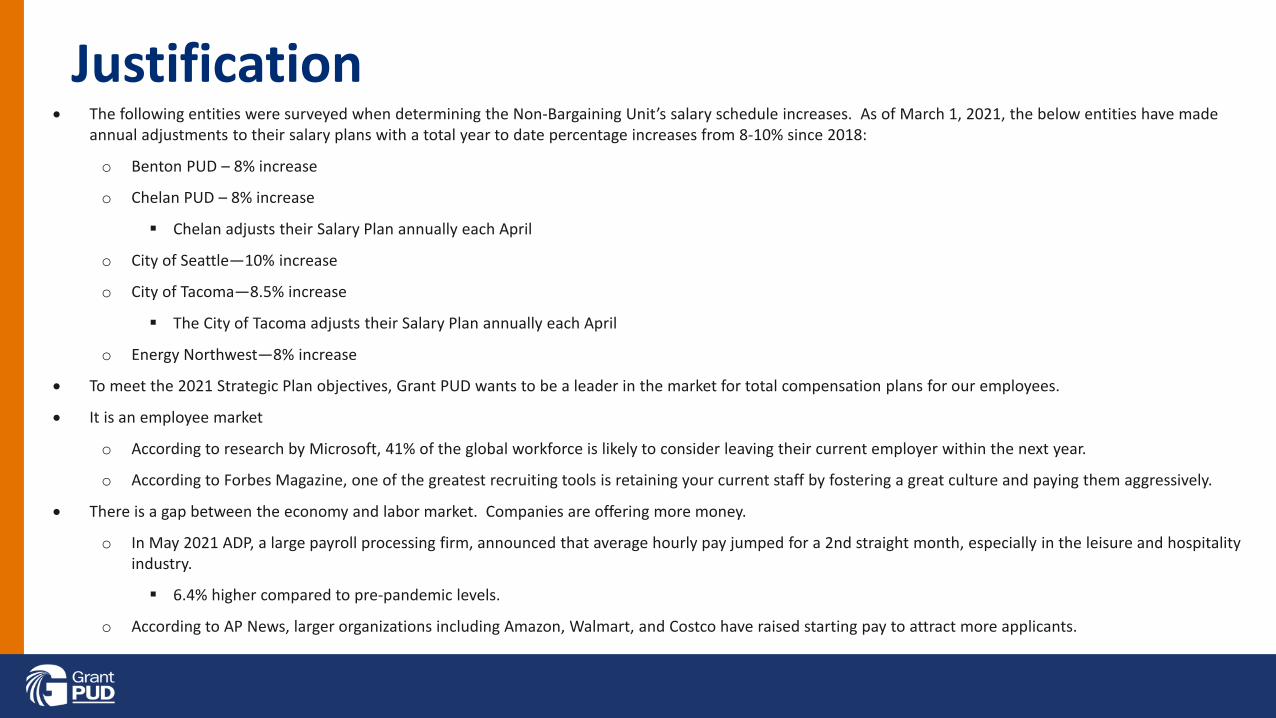
Justification• The following entities were surveyed when determining the Non-Bargaining Unit’s salary schedule increases. As of March 1, 2021, the below entities have made
annual adjustments to their salary plans with a total year to date percentage increases from 8-10% since 2018:
o Benton PUD – 8% increase
o Chelan PUD – 8% increase
Chelan adjusts their Salary Plan annually each April
o City of Seattle—10% increase
o City of Tacoma—8.5% increase
The City of Tacoma adjusts their Salary Plan annually each April
o Energy Northwest—8% increase
• To meet the 2021 Strategic Plan objectives, Grant PUD wants to be a leader in the market for total compensation plans for our employees.
• It is an employee market
o According to research by Microsoft, 41% of the global workforce is likely to consider leaving their current employer within the next year.
o According to Forbes Magazine, one of the greatest recruiting tools is retaining your current staff by fostering a great culture and paying them aggressively.
• There is a gap between the economy and labor market. Companies are offering more money.
o In May 2021 ADP, a large payroll processing firm, announced that average hourly pay jumped for a 2nd straight month, especially in the leisure and hospitality industry.
6.4% higher compared to pre-pandemic levels.
o According to AP News, larger organizations including Amazon, Walmart, and Costco have raised starting pay to attract more applicants.
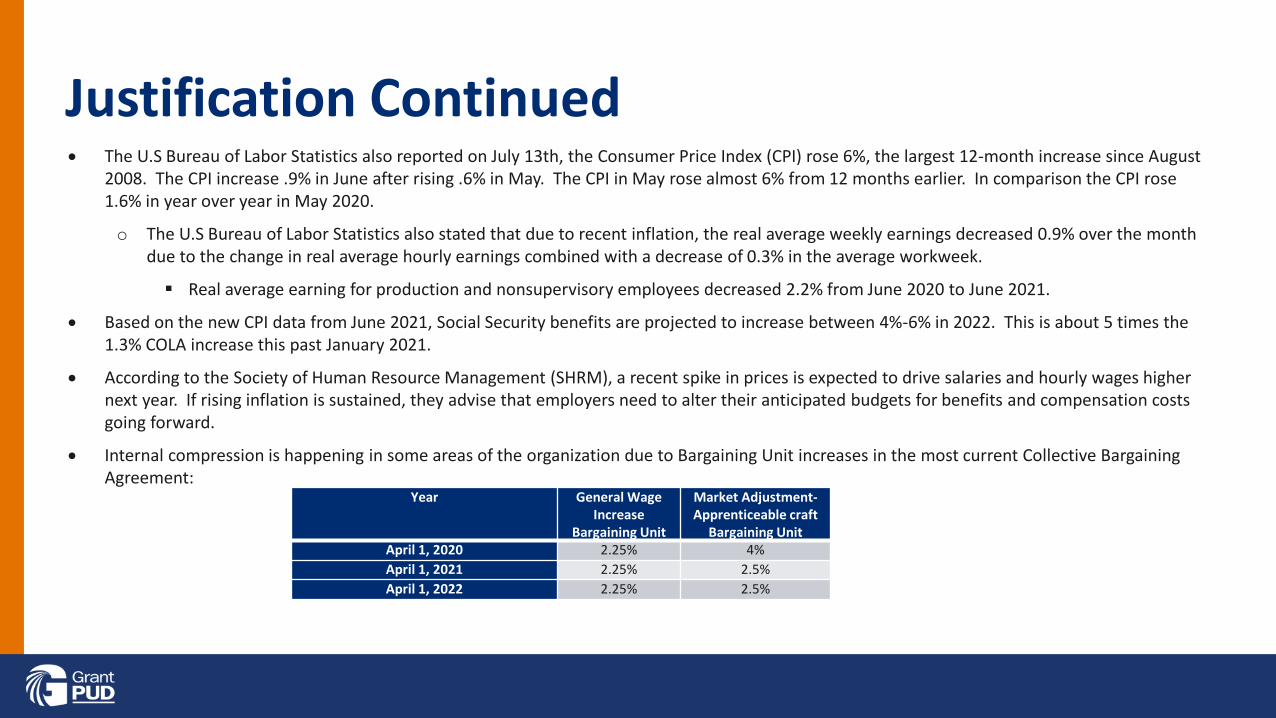
Justification Continued• The U.S Bureau of Labor Statistics also reported on July 13th, the Consumer Price Index (CPI) rose 6%, the largest 12-month increase since August
2008. The CPI increase .9% in June after rising .6% in May. The CPI in May rose almost 6% from 12 months earlier. In comparison the CPI rose 1.6% in year over year in May 2020.
o The U.S Bureau of Labor Statistics also stated that due to recent inflation, the real average weekly earnings decreased 0.9% over the month due to the change in real average hourly earnings combined with a decrease of 0.3% in the average workweek.
Real average earning for production and nonsupervisory employees decreased 2.2% from June 2020 to June 2021.
• Based on the new CPI data from June 2021, Social Security benefits are projected to increase between 4%-6% in 2022. This is about 5 times the 1.3% COLA increase this past January 2021.
• According to the Society of Human Resource Management (SHRM), a recent spike in prices is expected to drive salaries and hourly wages higher next year. If rising inflation is sustained, they advise that employers need to alter their anticipated budgets for benefits and compensation costs going forward.
• Internal compression is happening in some areas of the organization due to Bargaining Unit increases in the most current Collective Bargaining Agreement:
Year General Wage Increase
Bargaining Unit
Market Adjustment-Apprenticeable craft
Bargaining UnitApril 1, 2020 2.25% 4%April 1, 2021 2.25% 2.5%April 1, 2022 2.25% 2.5%

Financial Considerations• This will not increase wages; it is simply a proposal to move the salary
range for each grade by 10%. Labor spending including annual dollars budgeted for merit increases are budgeted and approved by the Commission annually.
Recommendation
• Commission approval to increase the Non-Bargaining Unit Salary Plan by 10%
Thank You
Quarterly Commission Update – August 2021
Powering our way of life.
Enterprise Project Management OfficeAndOrganizational Change Management

Today’s Topics
Department Objectives and Culture
Department Personnel Summary
Safety Update
Budget Update
Accomplishments
Department Work

Department Objectives
EXECUTE PROJECTS Cultivate a business driven EPMO that decreases project delivery risk to produce safe and quality outcomes enables consistent, reliable data and outcomes
HELP MANAGE THE PEOPLE SIDE OF CHANGE Employ change management principles to allow greater adoption, utilization and proficiency – implementation vs installation
BUDGETING, FINANCIAL REPORTING AND ANALYSIS Collect and analyze data for data driven financial decisions within Operations – at the department, project or portfolio level
The success of the EPMO and OCM is creating greater business value for our customers
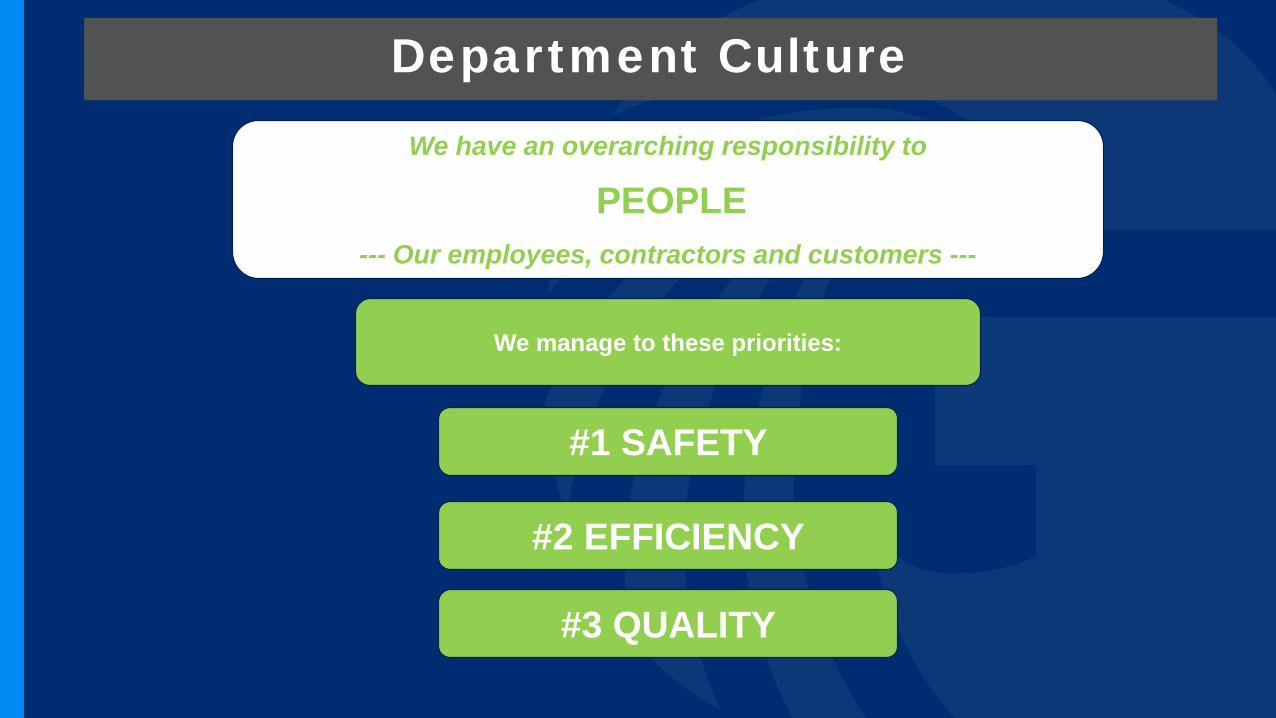
Department Culture
#1 SAFETY
#2 EFFICIENCY
#3 QUALITY
We have an overarching responsibility to
PEOPLE--- Our employees, contractors and customers ---
We manage to these priorities:

Department Personnel Summary
Department FTR New Personnel Contractor
EPMO/OCM (ED0000) 6 None 2
Power Production (ED1000) 7 None 3
Power Delivery (ED2000) 7 None 2
Enterprise Technology (ED3000) 6 None 4
Facilities/Project Services (ED4000) 6 None 2
TOTAL 32 13
• For more personnel breakdown detail by department go to the presentation appendix.
• Contractors continue to be a highly relied upon resource pool to complete work.
• VOLT - Change Order for Commission decision submitted
• See the presentation appendix for more information on contracted resources.
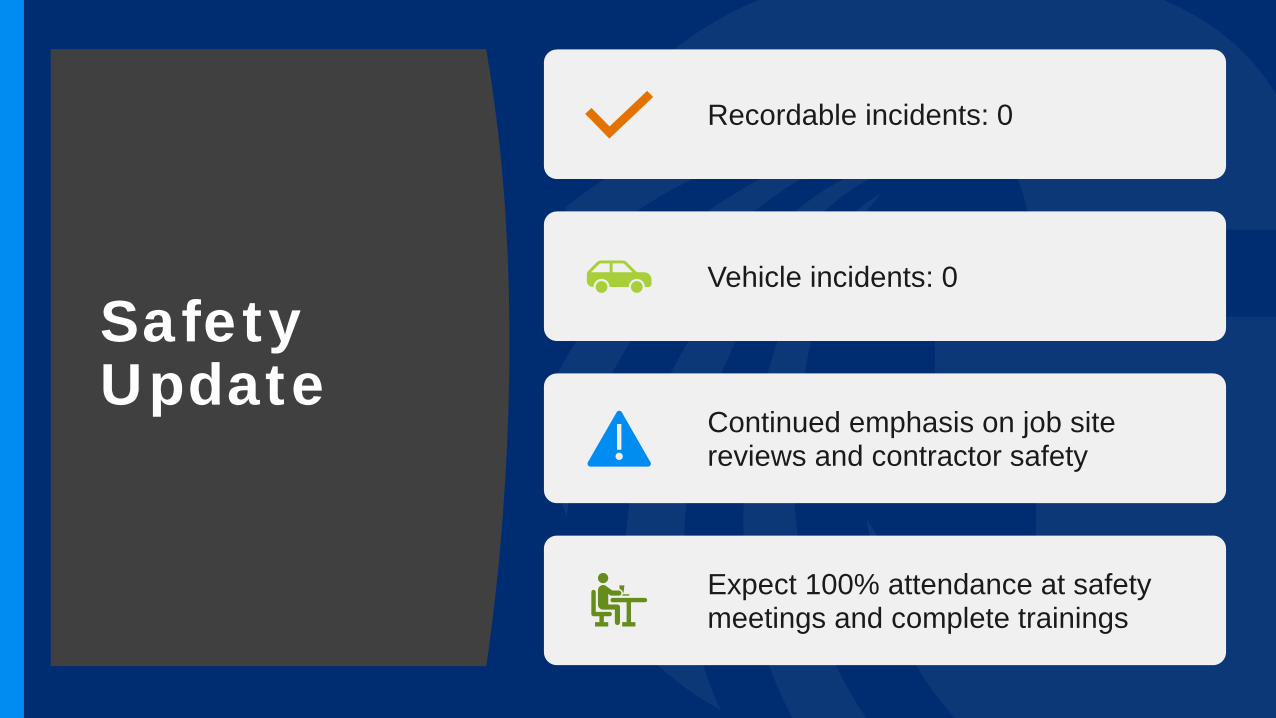
Safety Update
Recordable incidents: 0
Vehicle incidents: 0
Continued emphasis on job site reviews and contractor safety
Expect 100% attendance at safety meetings and complete trainings
Budget Update
Budget Versus Actuals
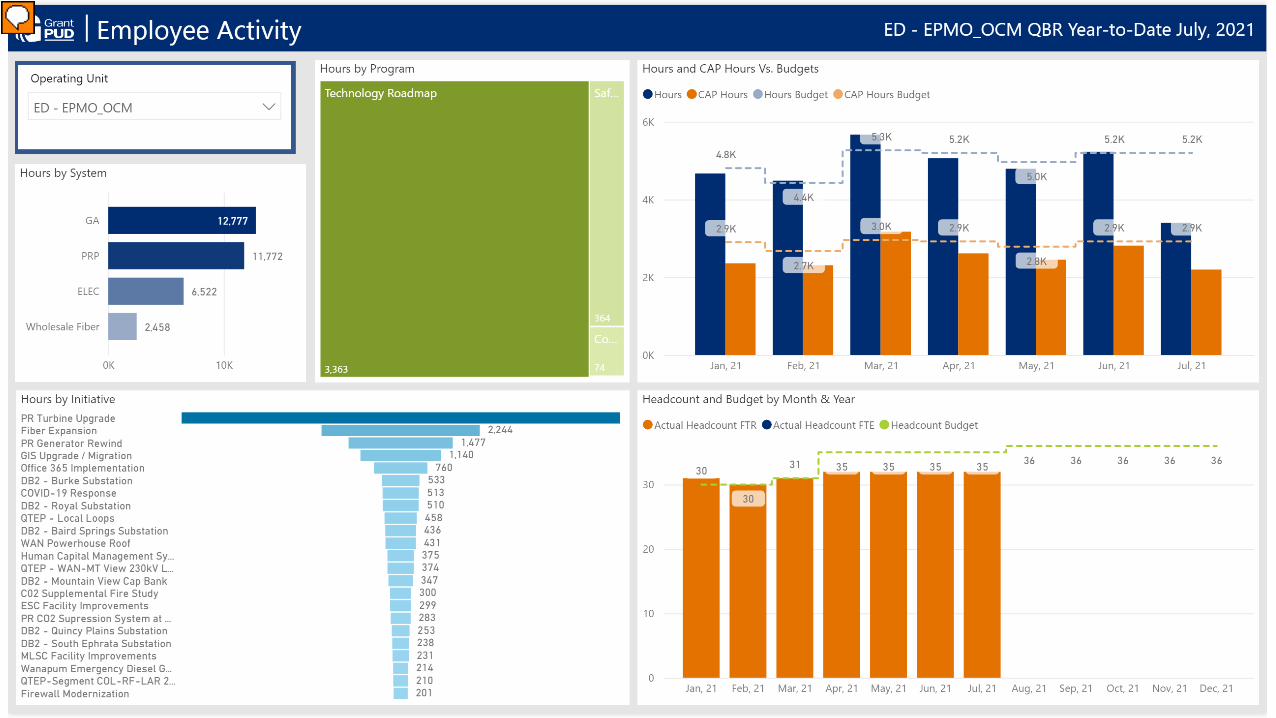
Employee Activity
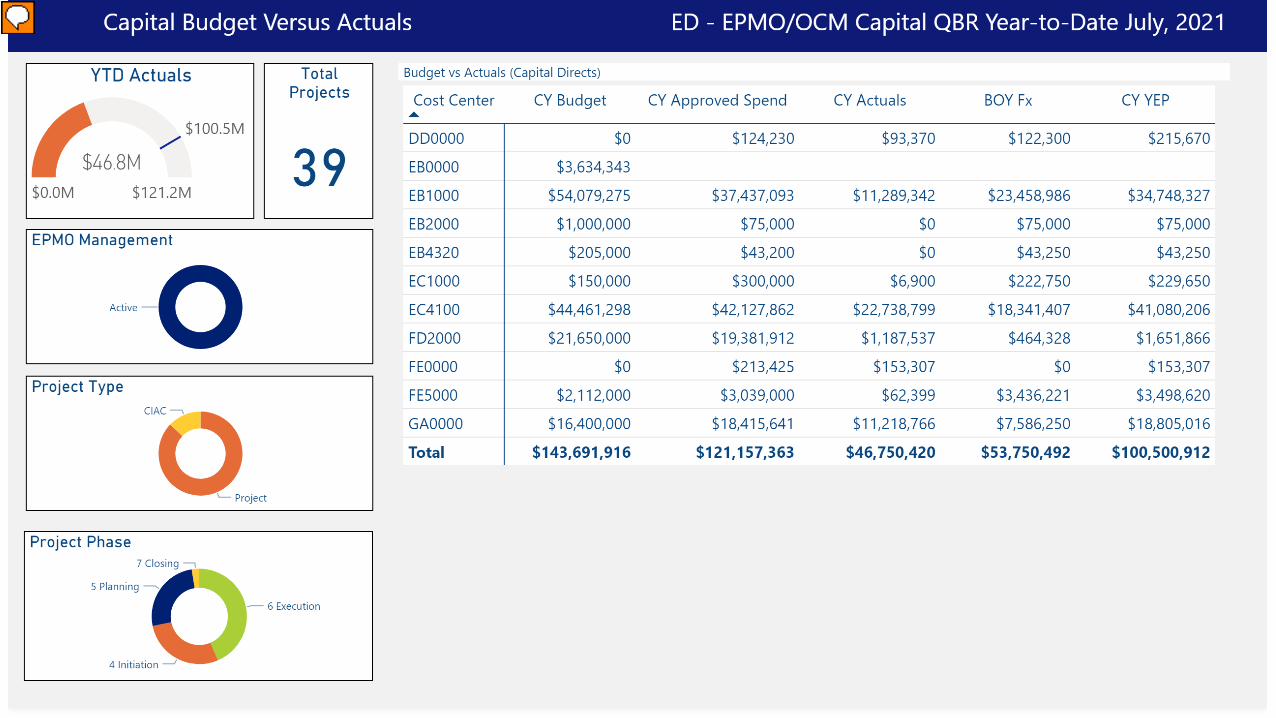
Capital
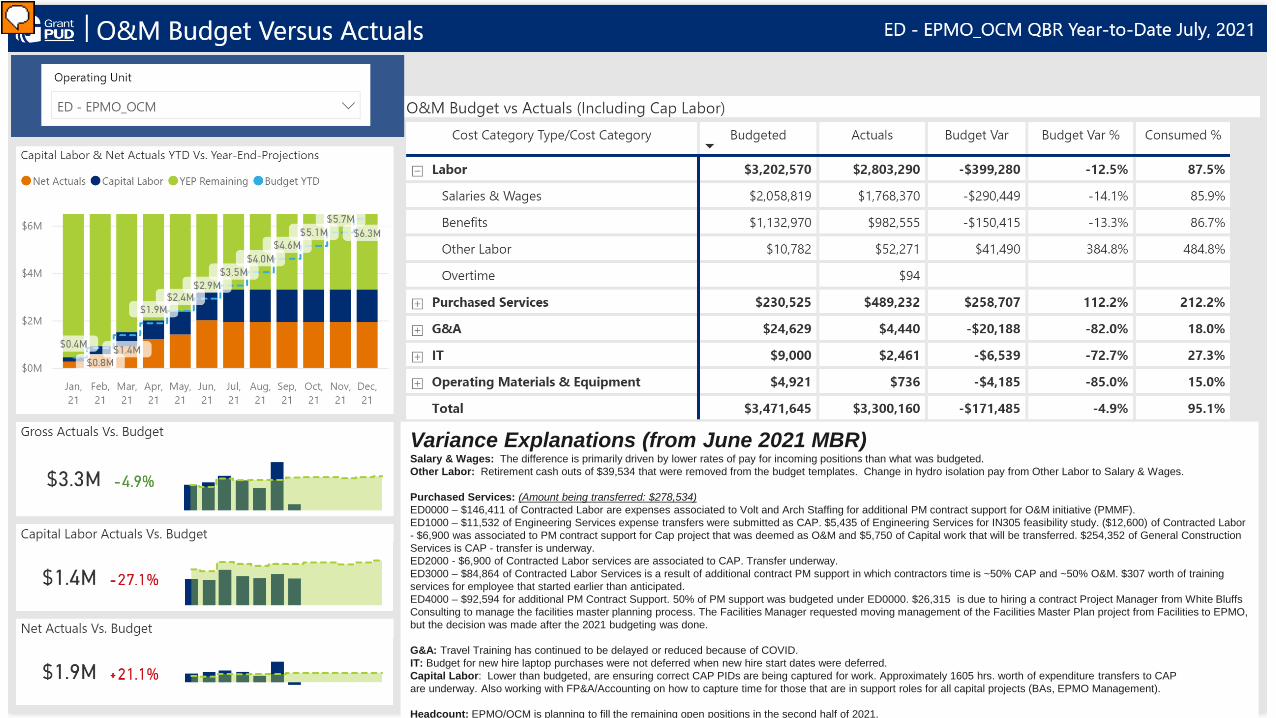
Variance Explanations (from June 2021 MBR)Salary & Wages: The difference is primarily driven by lower rates of pay for incoming positions than what was budgeted.Other Labor: Retirement cash outs of $39,534 that were removed from the budget templates. Change in hydro isolation pay from Other Labor to Salary & Wages.
Purchased Services: (Amount being transferred: $278,534)ED0000 – $146,411 of Contracted Labor are expenses associated to Volt and Arch Staffing for additional PM contract support for O&M initiative (PMMF).ED1000 – $11,532 of Engineering Services expense transfers were submitted as CAP. $5,435 of Engineering Services for IN305 feasibility study. ($12,600) of Contracted Labor - $6,900 was associated to PM contract support for Cap project that was deemed as O&M and $5,750 of Capital work that will be transferred. $254,352 of General Construction Services is CAP - transfer is underway.ED2000 - $6,900 of Contracted Labor services are associated to CAP. Transfer underway.ED3000 – $84,864 of Contracted Labor Services is a result of additional contract PM support in which contractors time is ~50% CAP and ~50% O&M. $307 worth of training services for employee that started earlier than anticipated.ED4000 – $92,594 for additional PM Contract Support. 50% of PM support was budgeted under ED0000. $26,315 is due to hiring a contract Project Manager from White Bluffs Consulting to manage the facilities master planning process. The Facilities Manager requested moving management of the Facilities Master Plan project from Facilities to EPMO, but the decision was made after the 2021 budgeting was done.
G&A: Travel Training has continued to be delayed or reduced because of COVID.IT: Budget for new hire laptop purchases were not deferred when new hire start dates were deferred.Capital Labor: Lower than budgeted, are ensuring correct CAP PIDs are being captured for work. Approximately 1605 hrs. worth of expenditure transfers to CAP are underway. Also working with FP&A/Accounting on how to capture time for those that are in support roles for all capital projects (BAs, EPMO Management).
Headcount: EPMO/OCM is planning to fill the remaining open positions in the second half of 2021.

Project Status Dashboard
• Recently created by Operations Budget/Financial Analysis Team
• High-level view of project status indicators and other data points

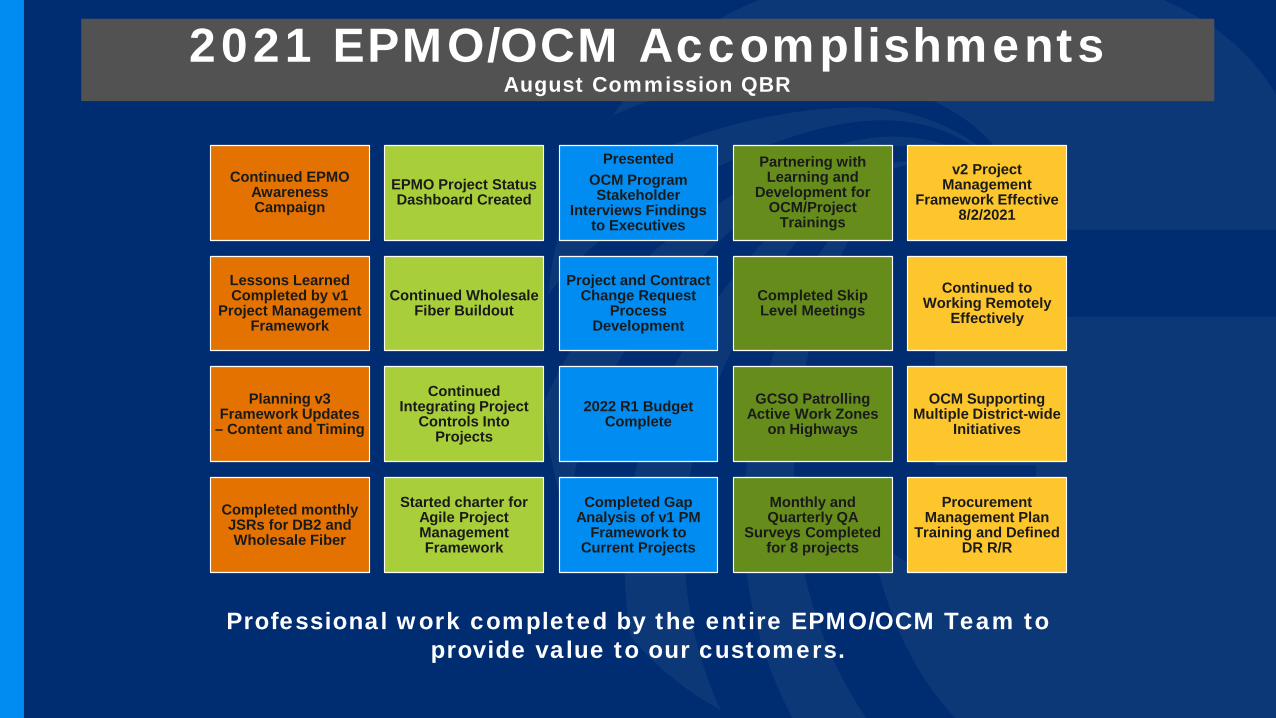
2021 EPMO/OCM AccomplishmentsAugust Commission QBR
Continued EPMO Awareness Campaign
EPMO Project Status Dashboard Created
PresentedOCM Program Stakeholder
Interviews Findings to Executives
Partnering with Learning and
Development for OCM/Project
Trainings
v2 Project Management
Framework Effective 8/2/2021
Lessons Learned Completed by v1
Project Management Framework
Continued Wholesale Fiber Buildout
Project and Contract Change Request
Process Development
Completed Skip Level Meetings
Continued to Working Remotely
Effectively
Planning v3 Framework Updates
– Content and Timing
Continued Integrating Project
Controls Into Projects
2022 R1 Budget Complete
GCSO Patrolling Active Work Zones
on Highways
OCM Supporting Multiple District-wide
Initiatives
Completed monthly JSRs for DB2 and Wholesale Fiber
Started charter for Agile Project Management Framework
Completed Gap Analysis of v1 PM
Framework to Current Projects
Monthly and Quarterly QA
Surveys Completed for 8 projects
Procurement Management Plan
Training and Defined DR R/R
Professional work completed by the entire EPMO/OCM Team to provide value to our customers.

2021 EPMO/OCM Goals
Continue to increase maturity of project management office and project management capabilities
Continue to increase maturity of change management organization/office and change management capabilities
Deliver projects

Departmental WorkTask Q4 2020 Q1 2021 Q2 2021 Q3 2021
Employee SupportComplete onboarding new Power Delivery EPMO Manager X X Complete ----
Onboard new employees (FTR and contractor) X X X X
Project Management Framework
Complete v1 and effective Planned1/1/2021
Actual3/15/2021 ----
v2 release Planned7/1/2021
Actual8/2/2021
EPMO SummitsSummit #1 – scheduled for March 2021 3/18/2021
Summit #2 – scheduled for September 2021 9/30/2021
EPMO Awareness CampaignWorking@Grant newsletter 04/19/2021 ----
GM Forum 05/04/2021 ----
Reinforcement activities – email updates, training sessions X
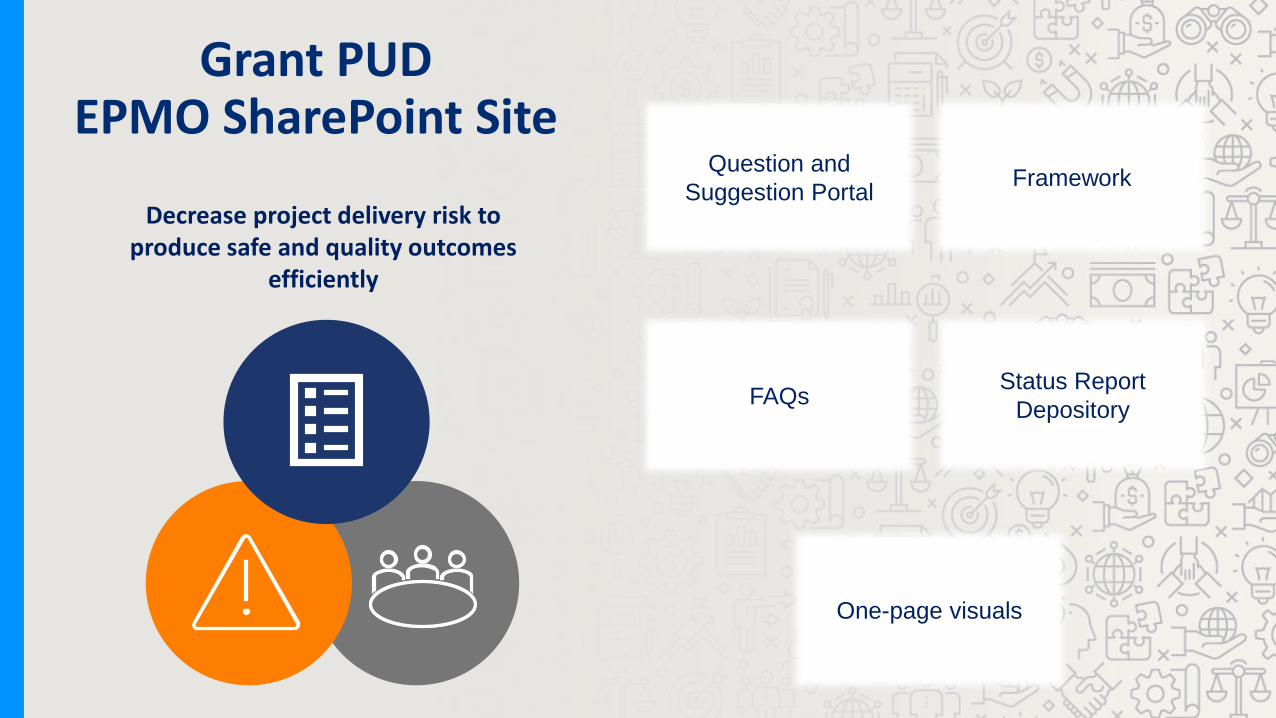
Grant PUDEPMO SharePoint Site
Question and Suggestion Portal Framework
FAQs Status Report Depository
One-page visuals
Decrease project delivery risk to produce safe and quality outcomes
efficiently
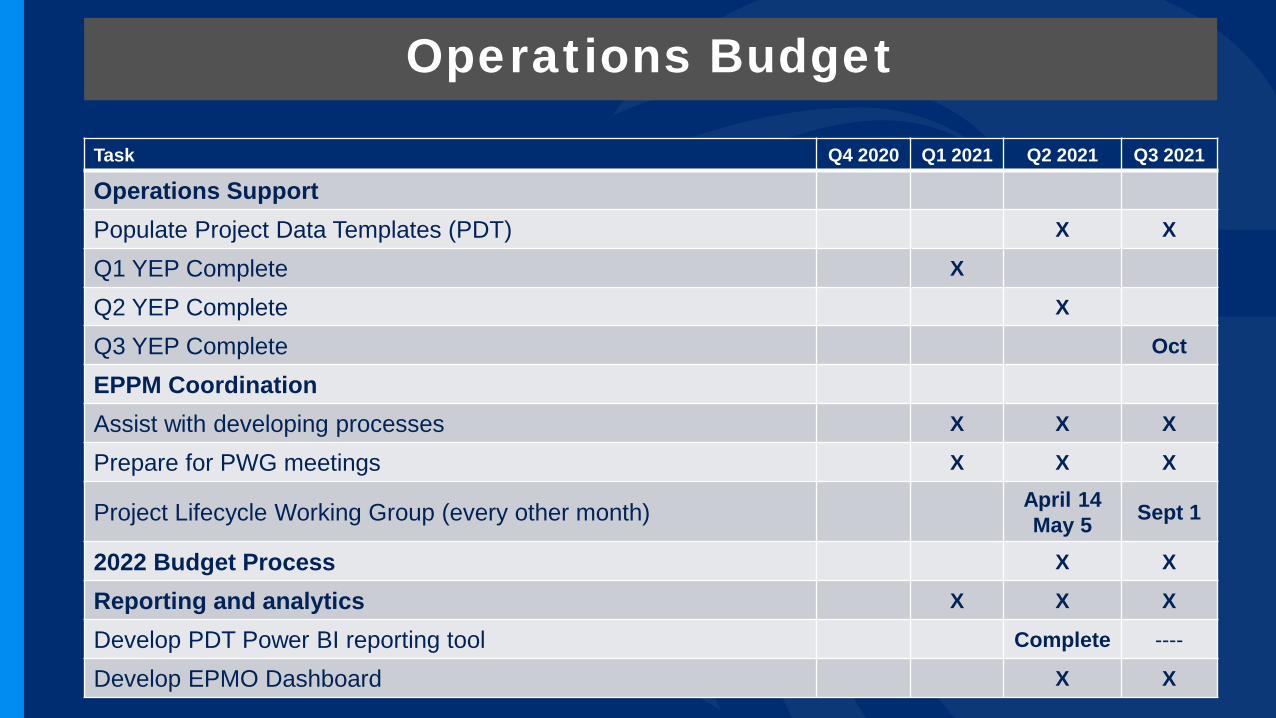
Operations Budget
Task Q4 2020 Q1 2021 Q2 2021 Q3 2021
Operations SupportPopulate Project Data Templates (PDT) X X
Q1 YEP Complete X
Q2 YEP Complete X
Q3 YEP Complete Oct
EPPM CoordinationAssist with developing processes X X X
Prepare for PWG meetings X X X
Project Lifecycle Working Group (every other month) April 14May 5 Sept 1
2022 Budget Process X X
Reporting and analytics X X X
Develop PDT Power BI reporting tool Complete ----
Develop EPMO Dashboard X X
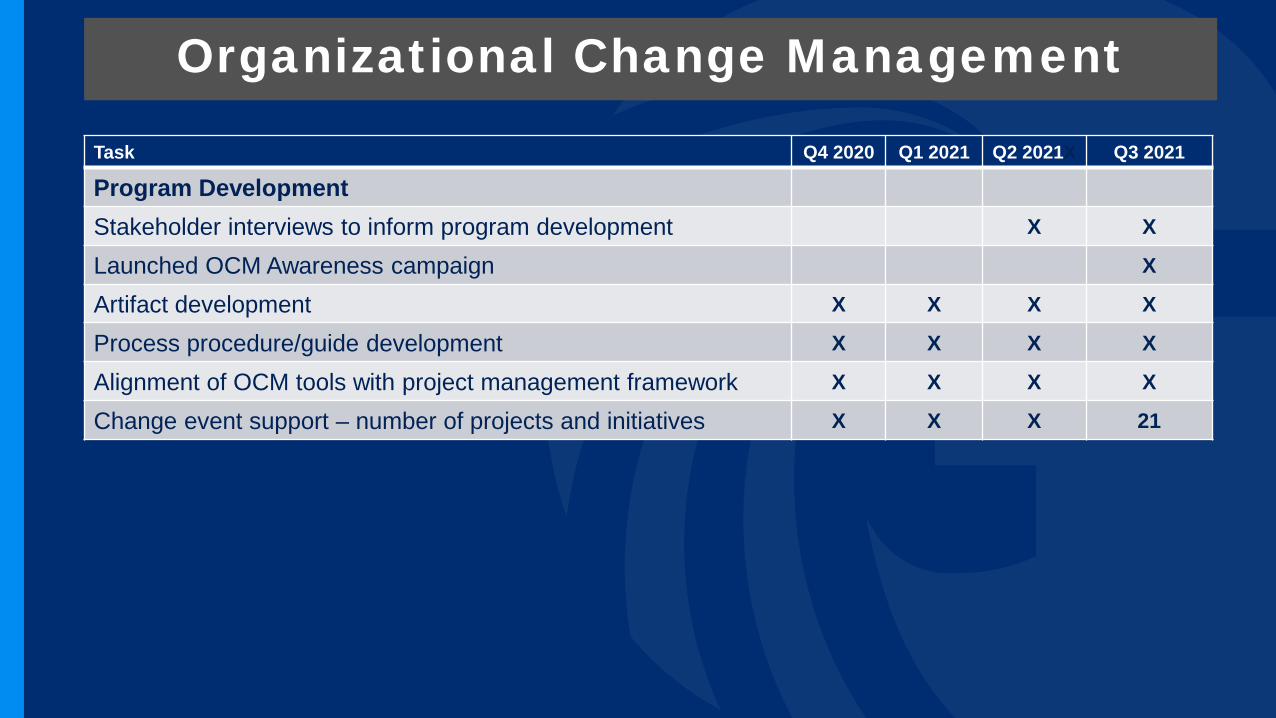
Organizational Change Management
Task Q4 2020 Q1 2021 Q2 2021X Q3 2021
Program DevelopmentStakeholder interviews to inform program development X X
Launched OCM Awareness campaign X
Artifact development X X X X
Process procedure/guide development X X X X
Alignment of OCM tools with project management framework X X X X
Change event support – number of projects and initiatives X X X 21
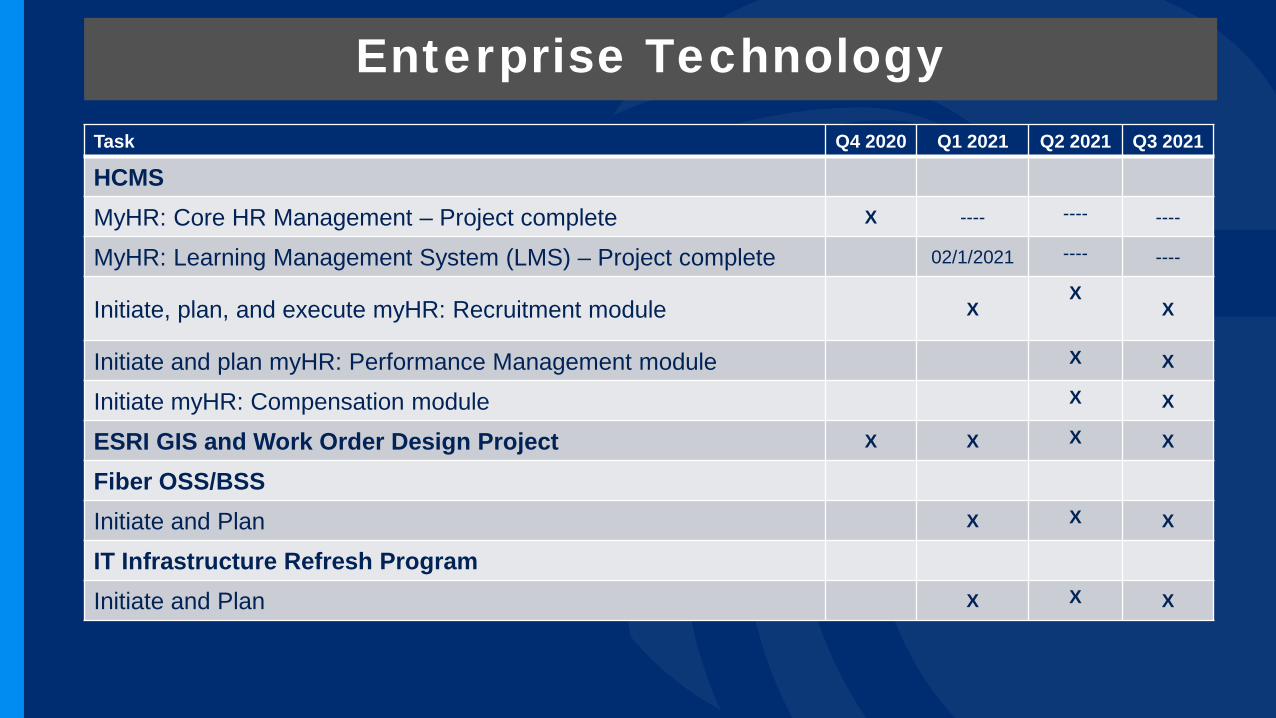
Enterprise TechnologyTask Q4 2020 Q1 2021 Q2 2021 Q3 2021
HCMSMyHR: Core HR Management – Project complete X ---- ---- ----
MyHR: Learning Management System (LMS) – Project complete 02/1/2021 ---- ----
Initiate, plan, and execute myHR: Recruitment module XX
X
Initiate and plan myHR: Performance Management module X X
Initiate myHR: Compensation module X X
ESRI GIS and Work Order Design Project X X X X
Fiber OSS/BSSInitiate and Plan X X X
IT Infrastructure Refresh ProgramInitiate and Plan X X X
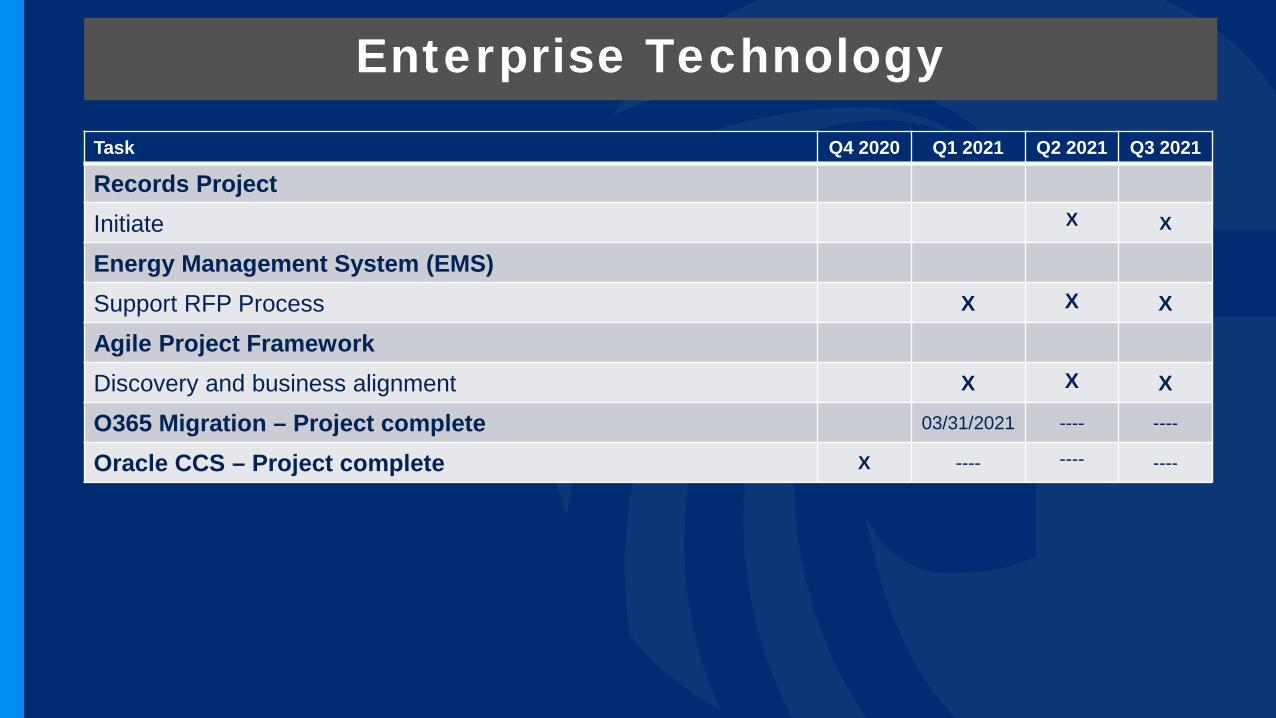
Enterprise TechnologyTask Q4 2020 Q1 2021 Q2 2021 Q3 2021
Records ProjectInitiate X X
Energy Management System (EMS)Support RFP Process X X X
Agile Project FrameworkDiscovery and business alignment X X X
O365 Migration – Project complete 03/31/2021 ---- ----
Oracle CCS – Project complete X ---- ---- ----
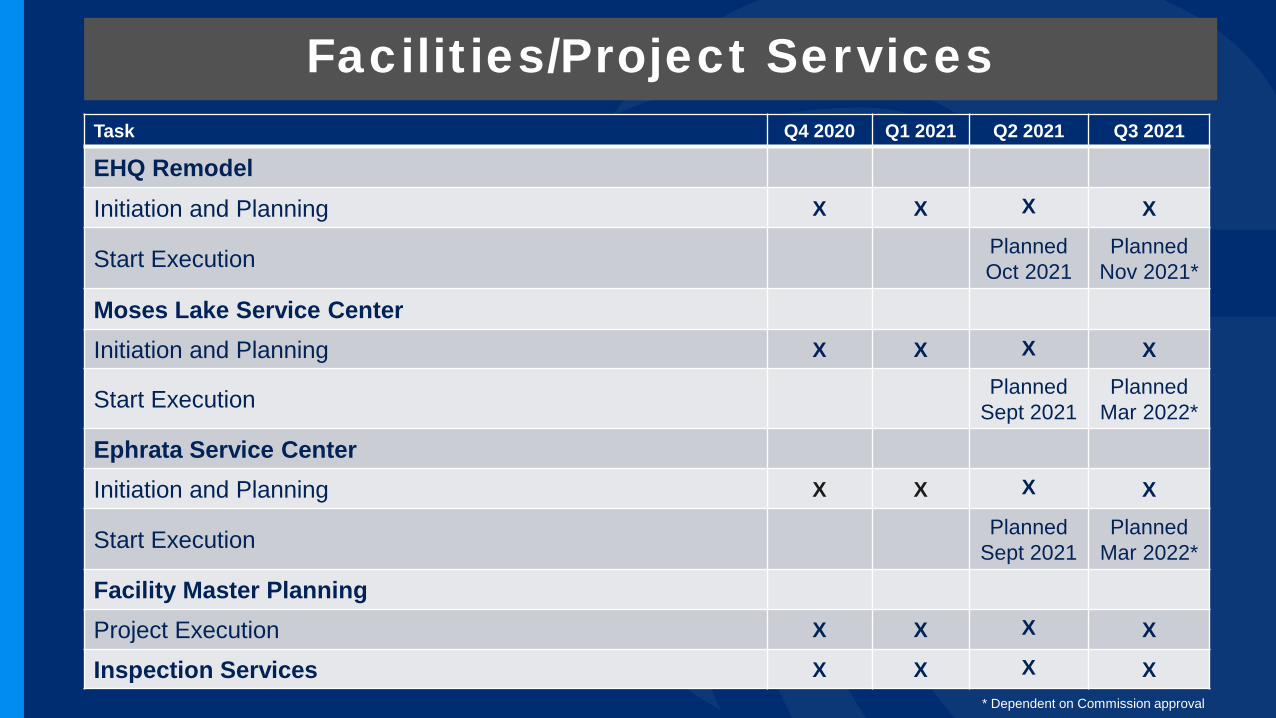
Facilities/Project ServicesTask Q4 2020 Q1 2021 Q2 2021 Q3 2021
EHQ RemodelInitiation and Planning X X X X
Start Execution PlannedOct 2021
PlannedNov 2021*
Moses Lake Service CenterInitiation and Planning X X X X
Start Execution PlannedSept 2021
PlannedMar 2022*
Ephrata Service CenterInitiation and Planning X X X X
Start Execution PlannedSept 2021
PlannedMar 2022*
Facility Master PlanningProject Execution X X X X
Inspection Services X X X X* Dependent on Commission approval

Power DeliveryTask Q4 2020 Q1 2021 Q2 2021 Q3 2021
Wholesale Fiber ProjectProject Execution X X X X
Design Build 2Construction started – Burke, Mountain View, Quincy Plains, Baird Springs, Royal Substation X X X X
Quincy Transmission Expansion Project (QTEP)Project Planning X X X X
Invenergy Interconnect ProjectProject Initiation, Project Planning X X X
Corner Grounded Delta ProjectProject Initiation X X
ECBIDProject Initiation X X

Power DeliveryTask Q4 2020 Q1 2021 Q2 2021 Q3 2021
SabeyProject Initiation X
VantageProject Initiation X
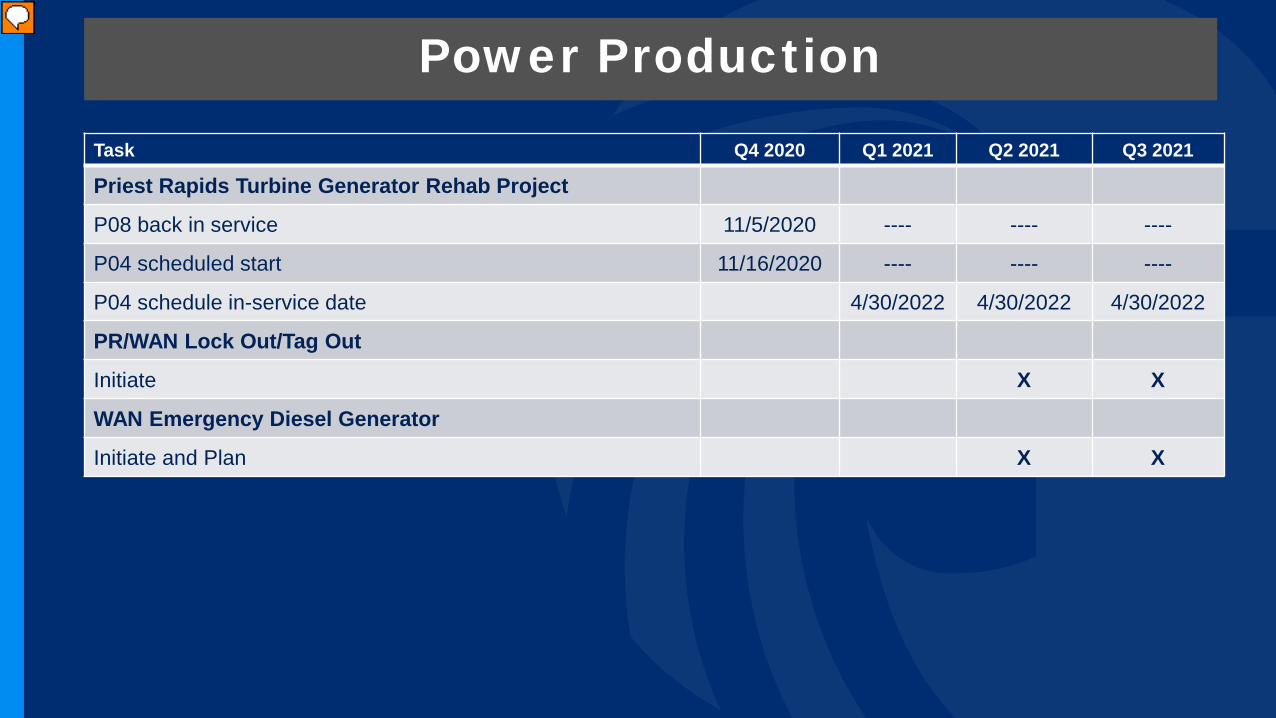
Power Production
Task Q4 2020 Q1 2021 Q2 2021 Q3 2021
Priest Rapids Turbine Generator Rehab Project
P08 back in service 11/5/2020 ---- ---- ----
P04 scheduled start 11/16/2020 ---- ---- ----
P04 schedule in-service date 4/30/2022 4/30/2022 4/30/2022
PR/WAN Lock Out/Tag Out
Initiate X X
WAN Emergency Diesel Generator
Initiate and Plan X X

Power ProductionTask Q4 2020 Q1 2021 Q2 2021 Q3 2021
PR/WAN CO2 Oil Room Fire Suppression Upgrade
Initiate and Plan X X
Vantage Riverstone Marina
Initiate and Plan X X
WAN/PR Station Service
Started Planning X X X
Execution Phase Starts PlannedMarch 2021
PlannedMarch 2021
PlannedOct 2021
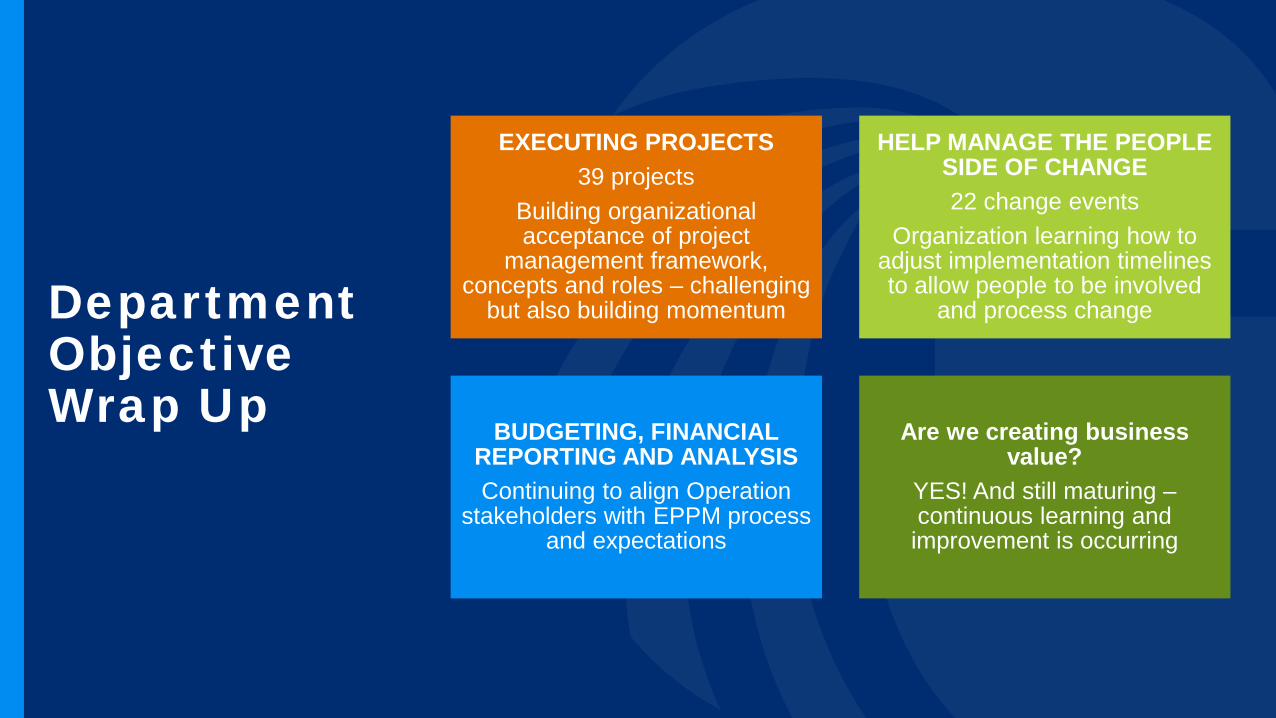
Department ObjectiveWrap Up
EXECUTING PROJECTS 39 projects
Building organizational acceptance of project
management framework, concepts and roles – challenging
but also building momentum
HELP MANAGE THE PEOPLE SIDE OF CHANGE 22 change events
Organization learning how to adjust implementation timelines to allow people to be involved
and process change
BUDGETING, FINANCIAL REPORTING AND ANALYSIS Continuing to align Operation
stakeholders with EPPM process and expectations
Are we creating business value?
YES! And still maturing –continuous learning and improvement is occurring

APPENDIXFor reference only - not intended to be reviewed in the Commission meeting
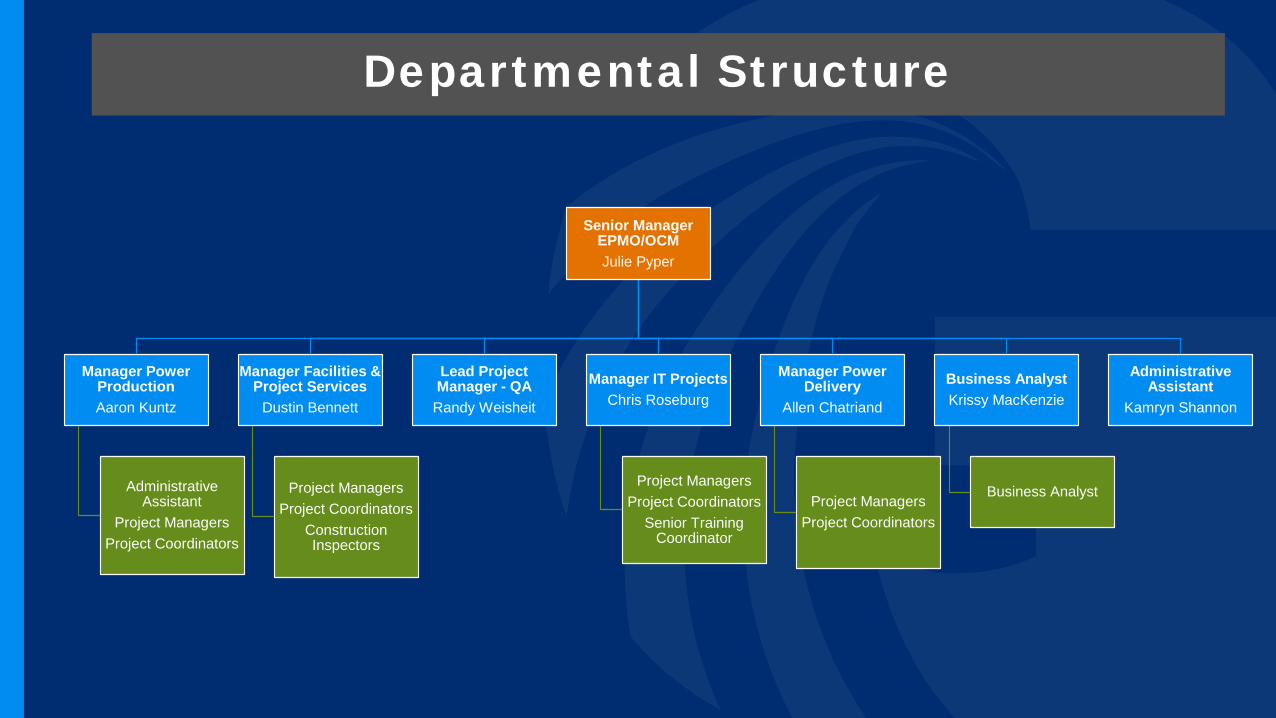
Senior Manager EPMO/OCMJulie Pyper
Manager Power ProductionAaron Kuntz
Administrative Assistant
Project ManagersProject Coordinators
Manager Facilities & Project Services
Dustin Bennett
Project ManagersProject Coordinators
Construction Inspectors
Lead Project Manager - QA
Randy Weisheit
Manager IT ProjectsChris Roseburg
Project ManagersProject Coordinators
Senior Training Coordinator
Manager Power Delivery
Allen Chatriand
Project ManagersProject Coordinators
Business AnalystKrissy MacKenzie
Business Analyst
Administrative Assistant
Kamryn Shannon
Departmental Structure
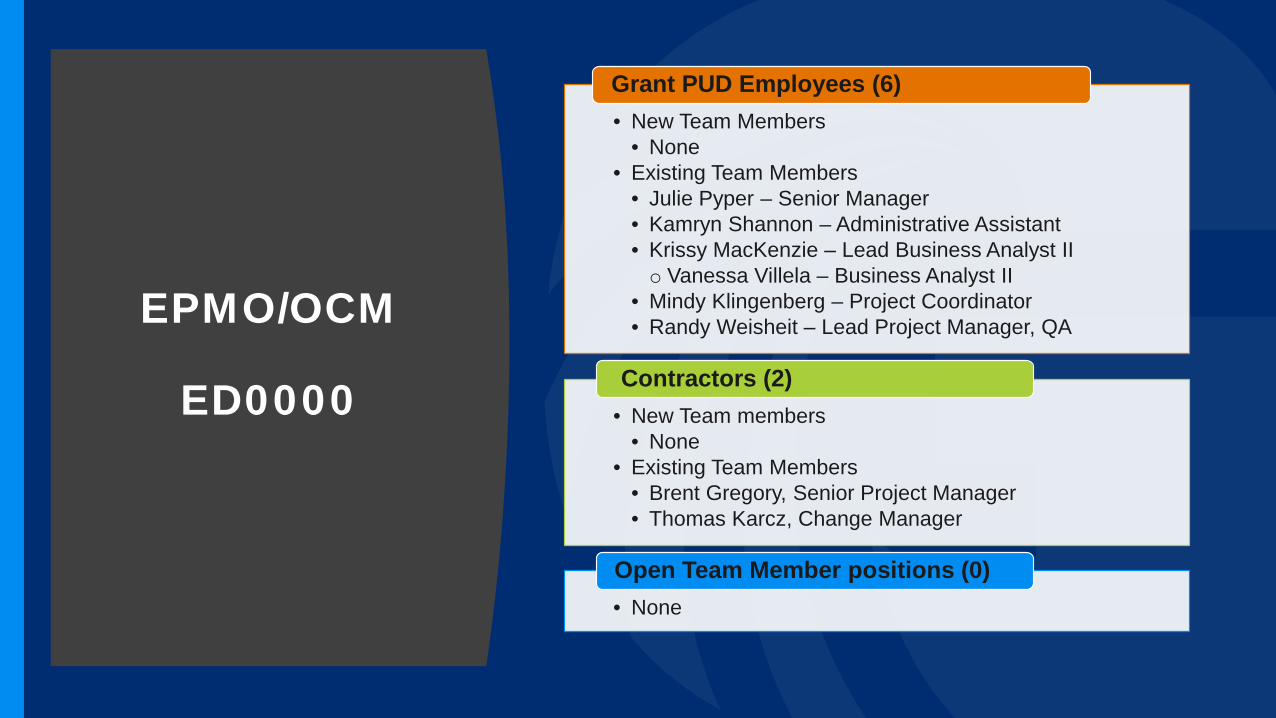
EPMO/OCM
ED0000
• New Team Members• None
• Existing Team Members• Julie Pyper – Senior Manager• Kamryn Shannon – Administrative Assistant• Krissy MacKenzie – Lead Business Analyst IIo Vanessa Villela – Business Analyst II
• Mindy Klingenberg – Project Coordinator• Randy Weisheit – Lead Project Manager, QA
Grant PUD Employees (6)
• New Team members• None
• Existing Team Members• Brent Gregory, Senior Project Manager• Thomas Karcz, Change Manager
Contractors (2)
• None
Open Team Member positions (0)
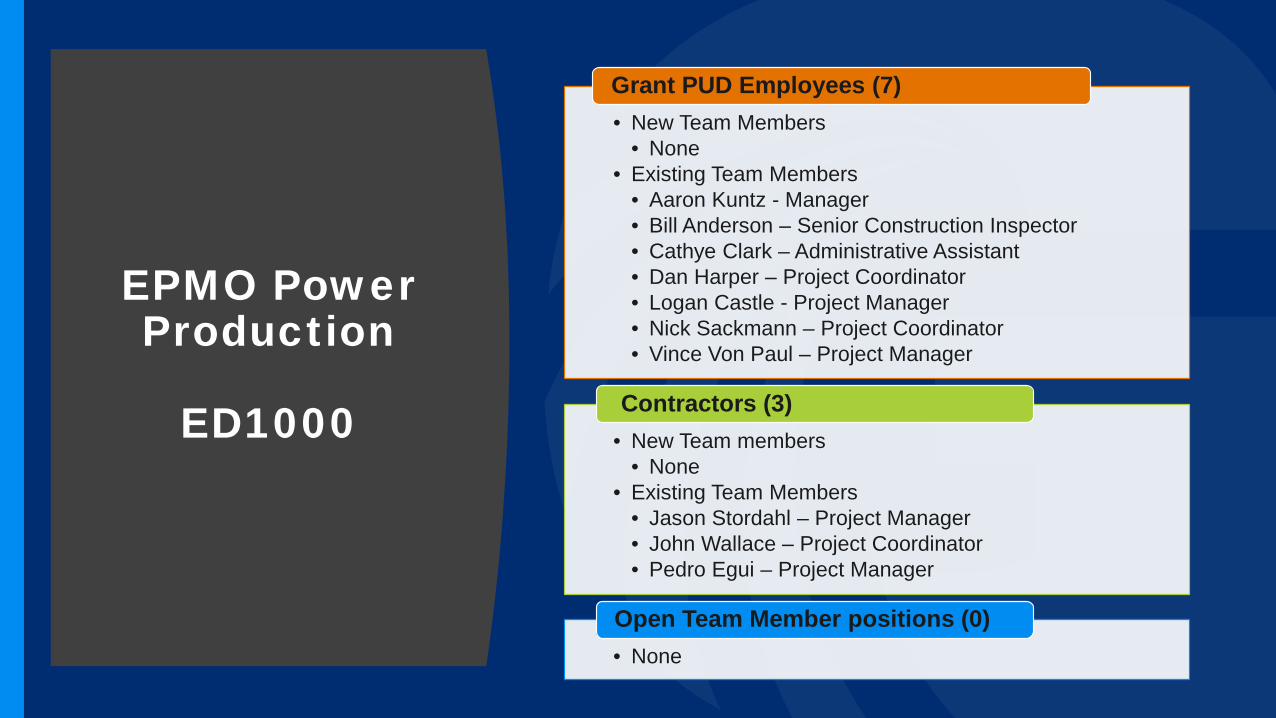
EPMO Power Production
ED1000
• New Team Members• None
• Existing Team Members• Aaron Kuntz - Manager• Bill Anderson – Senior Construction Inspector• Cathye Clark – Administrative Assistant• Dan Harper – Project Coordinator• Logan Castle - Project Manager• Nick Sackmann – Project Coordinator• Vince Von Paul – Project Manager
Grant PUD Employees (7)
• New Team members• None
• Existing Team Members• Jason Stordahl – Project Manager• John Wallace – Project Coordinator• Pedro Egui – Project Manager
Contractors (3)
• None
Open Team Member positions (0)
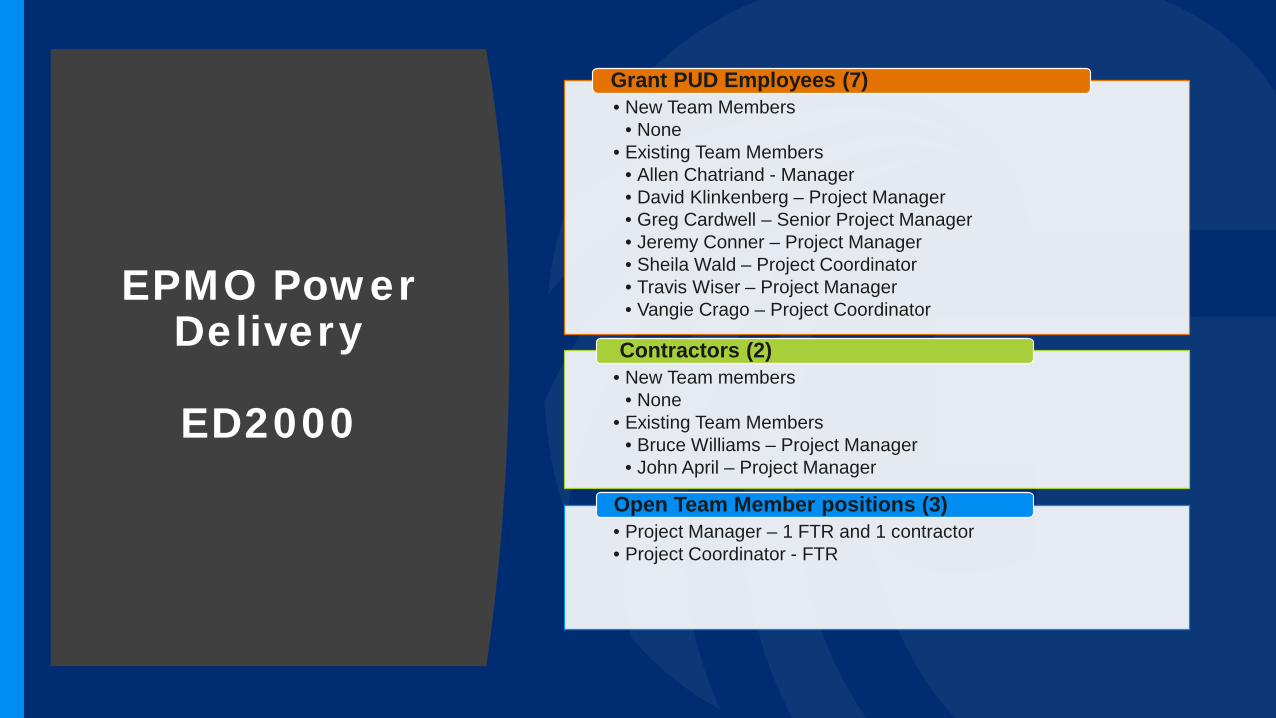
EPMO Power Delivery
ED2000
• New Team Members• None
• Existing Team Members• Allen Chatriand - Manager• David Klinkenberg – Project Manager• Greg Cardwell – Senior Project Manager• Jeremy Conner – Project Manager• Sheila Wald – Project Coordinator• Travis Wiser – Project Manager• Vangie Crago – Project Coordinator
Grant PUD Employees (7)
• New Team members• None
• Existing Team Members• Bruce Williams – Project Manager• John April – Project Manager
Contractors (2)
• Project Manager – 1 FTR and 1 contractor• Project Coordinator - FTR
Open Team Member positions (3)
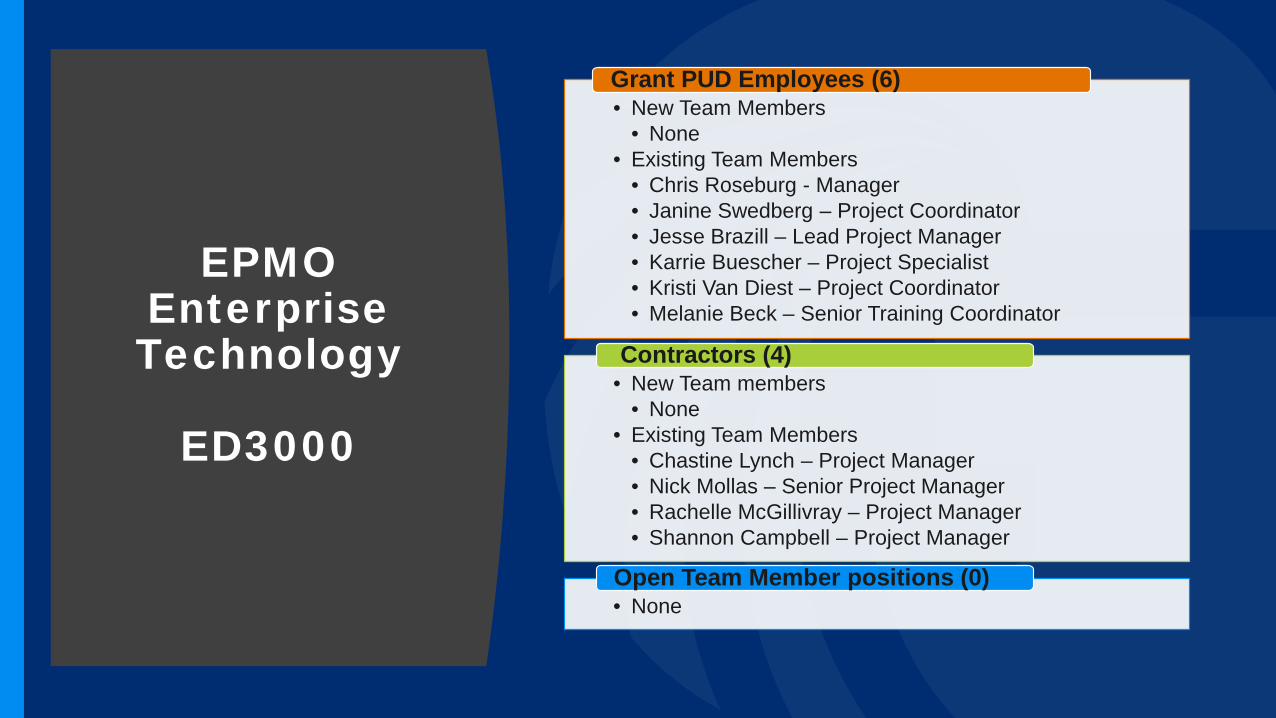
EPMO Enterprise Technology
ED3000
• New Team Members• None
• Existing Team Members• Chris Roseburg - Manager• Janine Swedberg – Project Coordinator• Jesse Brazill – Lead Project Manager• Karrie Buescher – Project Specialist• Kristi Van Diest – Project Coordinator• Melanie Beck – Senior Training Coordinator
Grant PUD Employees (6)
• New Team members• None
• Existing Team Members• Chastine Lynch – Project Manager• Nick Mollas – Senior Project Manager• Rachelle McGillivray – Project Manager• Shannon Campbell – Project Manager
Contractors (4)
• NoneOpen Team Member positions (0)

EPMO Facilities and
Project Services
ED4000
• New Team Members• None
• Existing Team Members• Dustin Bennett - Manager• Joe Larkin – Lead Construction Inspector• Ken Thoms – Construction Inspector• Mike Fleurkens – Lead Construction Inspector• Ron Deycous – Construction Inspector• Rhiannon Fronsman – Project Coordinator
Grant PUD Employees (6)
• New Team members• None
• Existing Team Members• Ben Floyd – Project Manager• Cliff Woods – Project Manager
Contractors (2)
• None
Open Team Member positions (0)

Contracted Resources
Arch Staffing and Consulting• Contract Expiration Date: December 2022• Contract Not To Exceed: $6,000,000• Unallocated Dollars: $3,595,153 • Contract To Date Actuals (of as 06/20/2021): $1,752,270
Current Resources
Name Position/Project Start Date Estimated End
Brent Gregory Senior Project Manager; Project Management Framework and project support 01/27/2020 12/31/2021 (+)
Cliff Woods Project Manager; Ephrata and Moses Lake Service Centers; EHQ Remodel 07/20/2020 12/31/2021
(until EoP)
Thomas Karcz Change Manager; OCM Program Development 08/27/2020 12/31/2021 (+)
Bruce Williams Project Manager, Invenergy Interconnect Project 3/3/2020 2/15/2024 (EoP)
EoP = End of Project
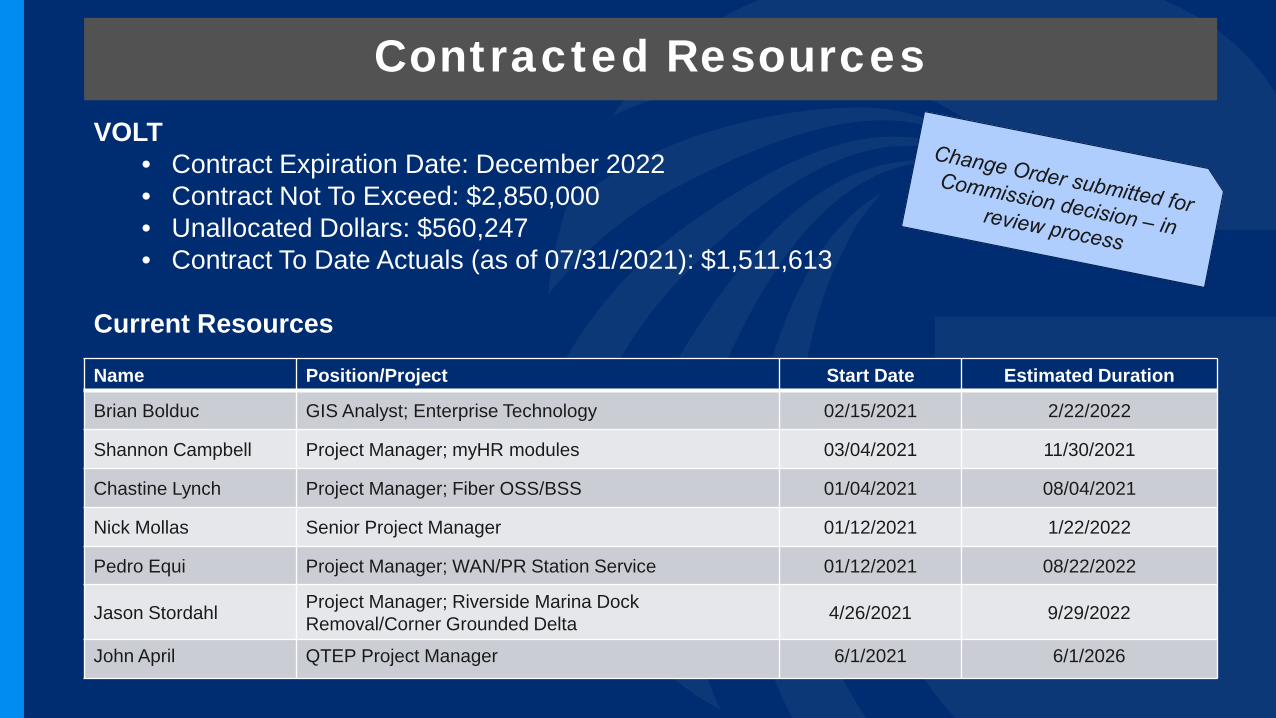
Contracted ResourcesVOLT
• Contract Expiration Date: December 2022• Contract Not To Exceed: $2,850,000• Unallocated Dollars: $560,247• Contract To Date Actuals (as of 07/31/2021): $1,511,613
Current Resources
Name Position/Project Start Date Estimated Duration
Brian Bolduc GIS Analyst; Enterprise Technology 02/15/2021 2/22/2022
Shannon Campbell Project Manager; myHR modules 03/04/2021 11/30/2021
Chastine Lynch Project Manager; Fiber OSS/BSS 01/04/2021 08/04/2021
Nick Mollas Senior Project Manager 01/12/2021 1/22/2022
Pedro Equi Project Manager; WAN/PR Station Service 01/12/2021 08/22/2022
Jason Stordahl Project Manager; Riverside Marina Dock Removal/Corner Grounded Delta 4/26/2021 9/29/2022
John April QTEP Project Manager 6/1/2021 6/1/2026
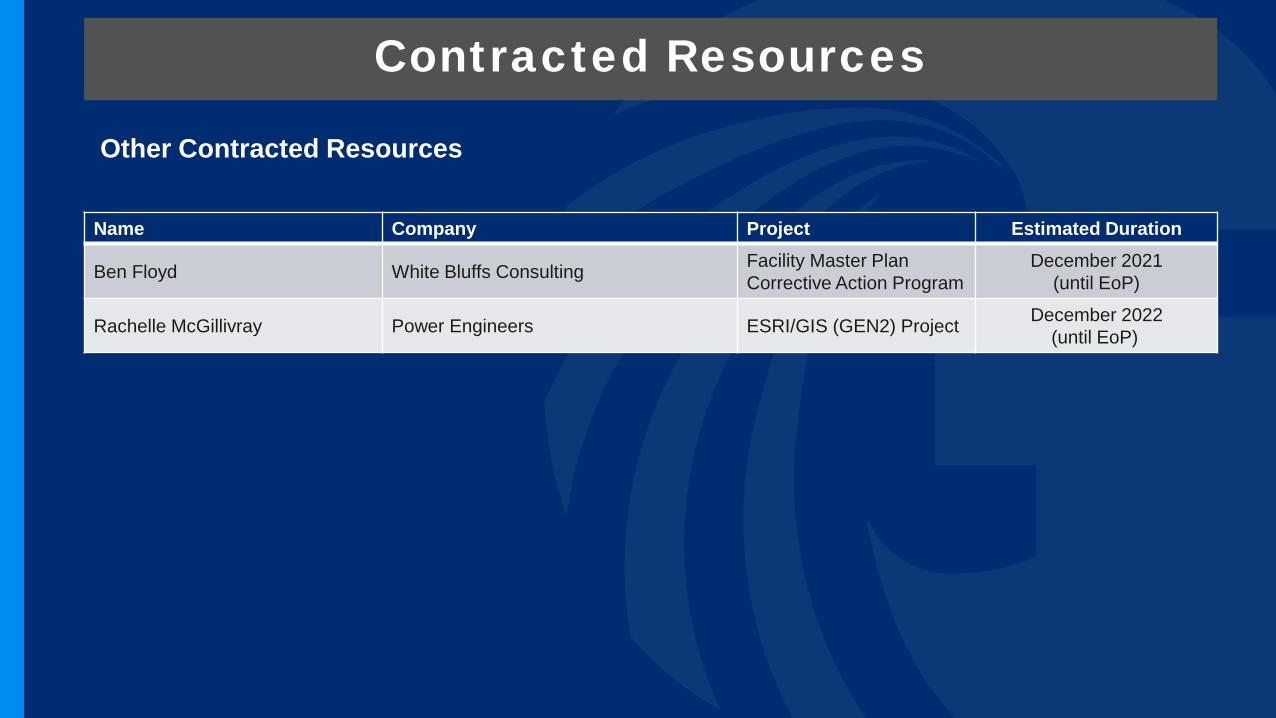
Contracted Resources
Other Contracted Resources
Name Company Project Estimated Duration
Ben Floyd White Bluffs Consulting Facility Master PlanCorrective Action Program
December 2021(until EoP)
Rachelle McGillivray Power Engineers ESRI/GIS (GEN2) Project December 2022 (until EoP)
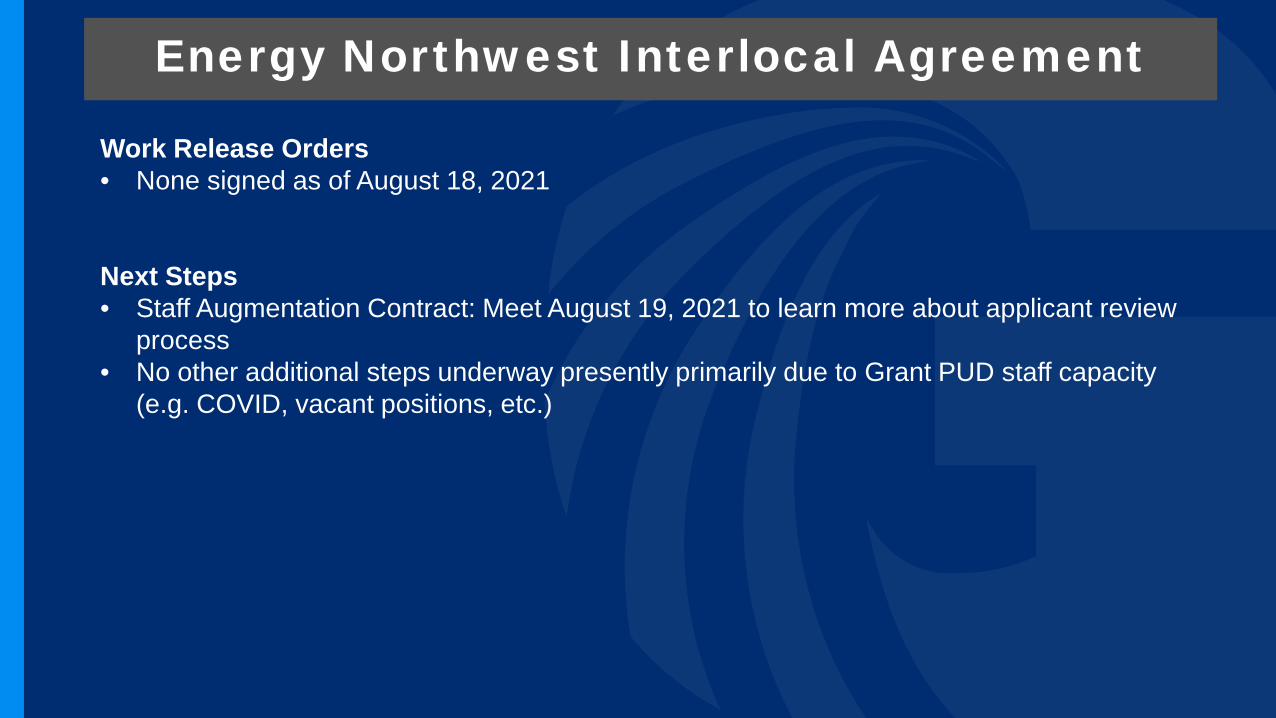
Energy Northwest Interlocal Agreement
Work Release Orders• None signed as of August 18, 2021
Next Steps• Staff Augmentation Contract: Meet August 19, 2021 to learn more about applicant review
process• No other additional steps underway presently primarily due to Grant PUD staff capacity
(e.g. COVID, vacant positions, etc.)
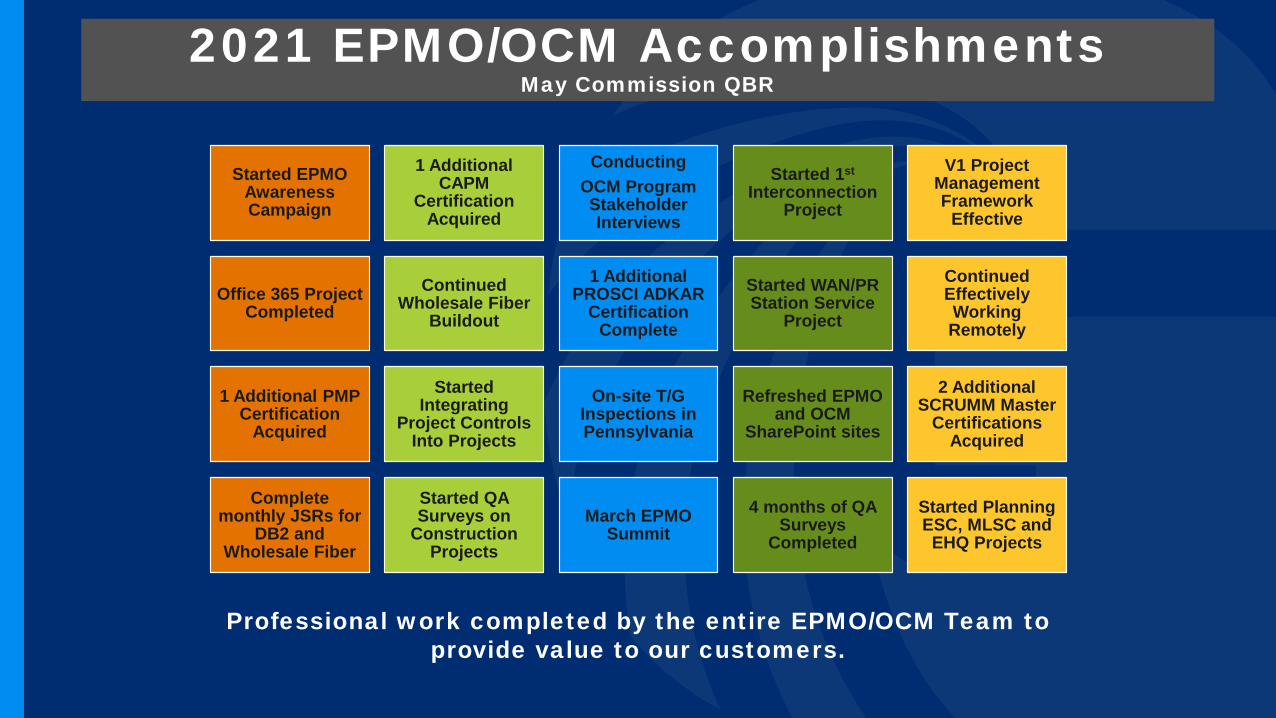
2021 EPMO/OCM AccomplishmentsMay Commission QBR
Started EPMO Awareness Campaign
1 Additional CAPM
Certification Acquired
ConductingOCM Program Stakeholder Interviews
Started 1st
Interconnection Project
V1 Project Management Framework
Effective
Office 365 Project Completed
Continued Wholesale Fiber
Buildout
1 Additional PROSCI ADKAR
Certification Complete
Started WAN/PR Station Service
Project
Continued Effectively Working Remotely
1 Additional PMP Certification
Acquired
Started Integrating
Project Controls Into Projects
On-site T/G Inspections in Pennsylvania
Refreshed EPMO and OCM
SharePoint sites
2 Additional SCRUMM Master
Certifications Acquired
Complete monthly JSRs for
DB2 and Wholesale Fiber
Started QA Surveys on
Construction Projects
March EPMO Summit
4 months of QA Surveys
Completed
Started Planning ESC, MLSC and EHQ Projects
Professional work completed by the entire EPMO/OCM Team to provide value to our customers.

Powering our way of life.
Grant PUD Commission MeetingAugust 10, 2021
Rod Noteboom
Amanpreet Singh
Dave Churchman
Rates and Pricing Update

Current Rates & Pricing Priorities• Long term specified source for PUD customers• Ancillary Services Rate Schedule• Point to Point Transmission Service Rate Schedule• Update to Rate Schedule 31 – Wholesale Transmission Delivery –
Small Load Customers Rate 31• Rate Schedule 3 – Conversion from stated Horsepower (HP) to KW
Demand

Long Term Customer Specified Source
• Solution to provide customer with a long-term specific resource very similar to the current Rate Schedule 13SS
• Existing Rate Schedule 13SS provides for annual specified sources
• Initial interest for long-term specified source is local solar generation
• Customers could still enter into a wholesale only transaction for their own benefit which would require transmission and other services
• Expect to see more information later this year

Future Rate Schedule 33 – Ancillary Services• Ancillary Services: those services necessary to support the
transmission of electric power from resources to loads given the obligations of balancing authorities and transmitting utilities within those balancing authorities to maintain reliable operations of the interconnected transmission system.

Ancillary Services on Rate Schedule 331. Scheduling, System Control and Dispatch Service2. Reactive Supply and Voltage Control from Generation and Other
Sources Service3. Regulation and Frequency Response for Service to Loads4. Energy Imbalance Service for Loads5. Operating Reserves Service6. Generator Imbalance Service7. Real Power Losses8. Solar Integration/Regulation Service

Future Rate Schedule 32 – Point-to-Point Transmission Rate• The reservation and use of transmission capacity on a firm basis to allow a customer to move power and energy from the Point(s) of Receipt to the Point(s) of Delivery
• The first customers will likely be solar generation plants. Other customers may follow if Grant develops on OATT.
• Applicable Ancillary Services for each customer will be addressed in customer service agreements

Differences in Rate Sch 30 and Rate Sch 32• Rate Schedule 30 – Wholesale Transmission Delivery Large Load Rate:
Applies to loads and the billing for delivery is based on the monthly peak of the load
• Rate Schedule 32 – PTP Transmission: Will be used for generators interconnected to the Grant System and for general transmission over the Grant system. The billing for monthly delivery is based on a long term reservation of system capacity

Update to Rate Schedule 31 - Wholesale Transmission Delivery Small Load Rate • Rate Schedule 31 is for wholesale delivery to the following types of
loads• 31A: Residential• 31B: General Service• 31C: Pumping Loads

Issue to address in Rate Sch 31• The current rates are based solely on delivery of energy• This is not a good way to charge for wheeling, the actual costs of
which are not tied to the amount of energy delivery.• Costs of wheeling are better represented by fixed monthly charges
and demand charges• The current rates were first implemented in a contract on July 1, 2017
and were meant to be in place for a much shorter period of time.
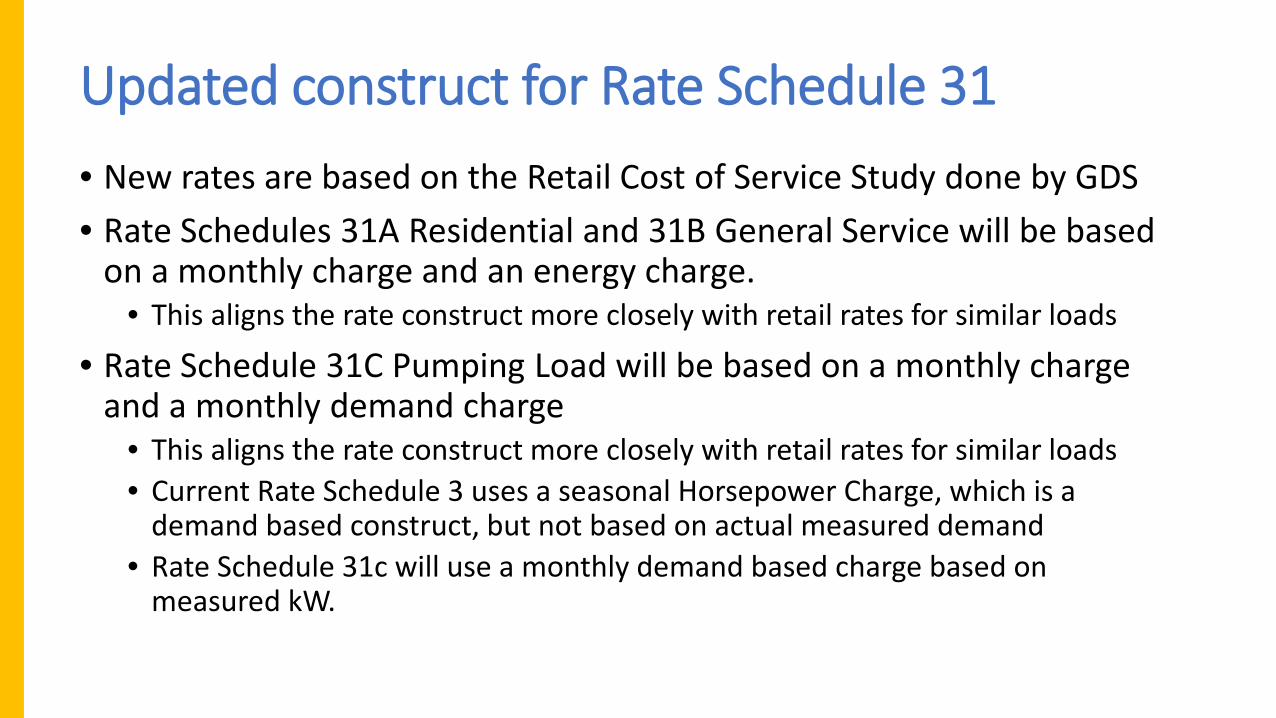
Updated construct for Rate Schedule 31• New rates are based on the Retail Cost of Service Study done by GDS• Rate Schedules 31A Residential and 31B General Service will be based
on a monthly charge and an energy charge.• This aligns the rate construct more closely with retail rates for similar loads
• Rate Schedule 31C Pumping Load will be based on a monthly charge and a monthly demand charge
• This aligns the rate construct more closely with retail rates for similar loads• Current Rate Schedule 3 uses a seasonal Horsepower Charge, which is a
demand based construct, but not based on actual measured demand• Rate Schedule 31c will use a monthly demand based charge based on
measured kW.
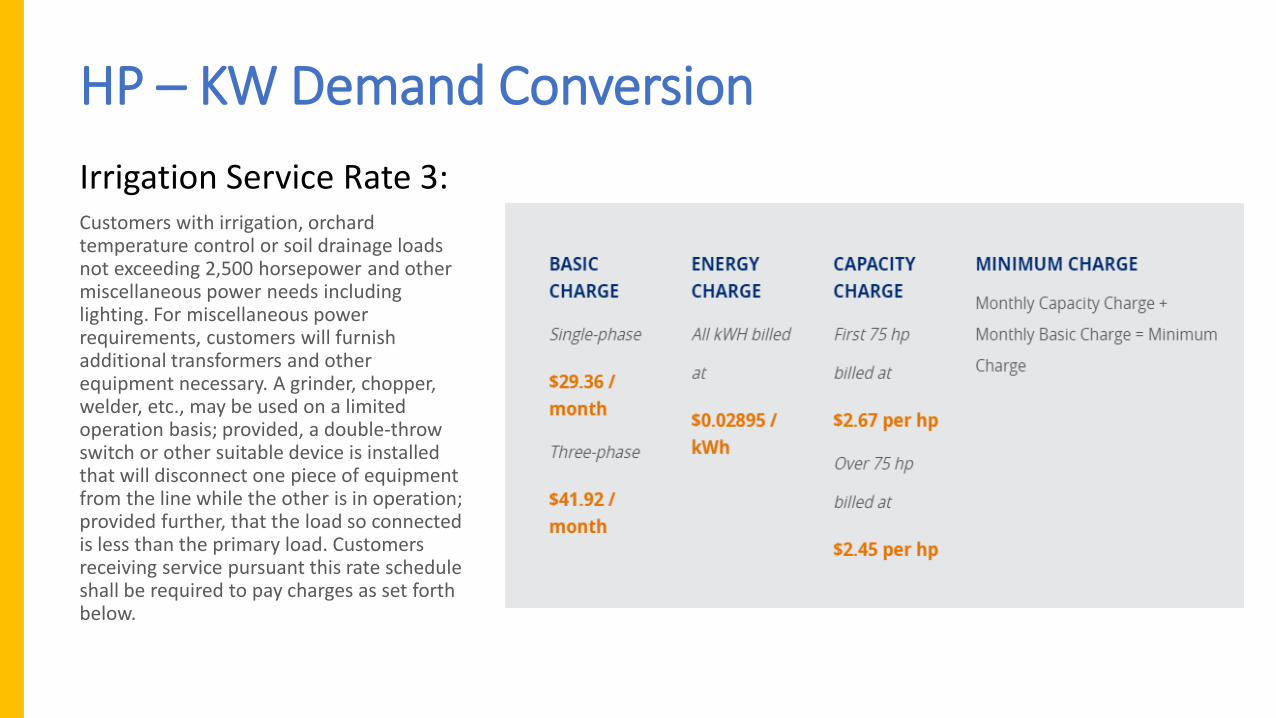
HP – KW Demand ConversionIrrigation Service Rate 3:Customers with irrigation, orchard temperature control or soil drainage loads not exceeding 2,500 horsepower and other miscellaneous power needs including lighting. For miscellaneous power requirements, customers will furnish additional transformers and other equipment necessary. A grinder, chopper, welder, etc., may be used on a limited operation basis; provided, a double-throw switch or other suitable device is installed that will disconnect one piece of equipment from the line while the other is in operation; provided further, that the load so connected is less than the primary load. Customers receiving service pursuant this rate schedule shall be required to pay charges as set forth below.

HP – KW Demand ConversionWhat is proposed:
• Change the Capacity Charge from being billed based on HP to being billed based on actual demand.
Why are we proposing a change?• Billing accuracy
• During the CT meter audit, the electricians found that irrigation equipment had been changed out and the HP name plate was not updated in the billing system.
• Customer convenience• Don’t need to report HP changes to Customer Solutions.

HP – KW Demand ConversionRate Design Process
• Estimated overall revenues held constant while converting from stated HP charge to actual kW Demand Charge
• Evaluate different rate designs with the objective of minimizing rate impact to individual customers (assuming reported HP is accurate)
• Customers will be impacted differently – some will see increases and others will see decreases.

HP – KW Demand ConversionProposed Timeline
• Fall 2021 - Analyze bills and develop recommended rate design
• November 2021 - Commission Presentation with recommended rate schedule revisions
• Winter 2021 -2022• Communications plan for Ag customers
• Presentation at Ag Workshop• Article in PUD Ag Newsletter• News Release• Training for CSR’s
• January 2022• Create, test, and implement rate into billing systems
• February 2022• Rate goes into effect for 2022 growing season

Input from Commission
Open Question:• Does the Board want staff to develop a separate Ag retail rate class
for your consideration?