technology integration and system … referenced to a 737-800 with cfm56-7b engines, ... and metrics...
TRANSCRIPT

1
Abstract
The ability to meet simultaneously aspirational environmental and performance objectives set for future aircraft systems requires the integration of advanced technologies and vehicle concepts. An assessment methodology was developed in collaboration with the NASA Environmentally Responsible Aviation (ERA) program that enables quantitative performance evaluations at the technology, vehicle, and fleet levels. The basis of the resulting process is a combination of both physics and empirically based modeling environment, the Environmental Design Space, which enables the calculations of community noise, fuel burn, and NOx emissions. This paper provides a description of the framework created, an enumeration of the different analysis techniques utilized in the methodology, an overview of how the modeling environment is utilized to conduct probabilistic performance assessments, and fleet level performance results.
1. Introduction Environmental goals have been laid forth
by NASA’s Aeronautics Research Mission Directorate to reduce simultaneously, fuel burn, certification noise, and LTO NOx emissions, as shown in Table 1. Identifying technology and vehicle solutions that simultaneously meet these three metrics requires the use of system-level analysis with the appropriate level of fidelity to quantify feasibility, benefits and degradations, and associated risk. For the N+2 goals, NASA took the lead and launched the Environmentally Responsible Aviation (ERA) program.
The desire to quantitatively represent technology impacts at the system level motivated the creation of a model-based analysis framework. The framework utilizes both physics and empirically based models to represent the technologies, analyze advanced performance characteristics of advanced vehicle concepts, conduct probabilistic performance assessments, and propagate all of the results to the fleet level.1,2 Overall it enables risk-informed decision making regarding important technology development decisions, including the right portfolio of technologies that should be pursued.
Table 1: NASA Subsonic Transport System Level Metrics for all Technology Generations
Technology Benefits* N+1 (2015)
N+2 (2020**)
N+3 (2025)
Noise (cum margin rel. to Stage
4) -32 dB -42 dB -52 dB
LTO NOx Emissions (rel. to CAEP 6) -60% -75% -80%
Cruise NOx Emissions (rel. to 2005 best in class) -55% -70% -80%
Fuel Burn*** (rel. to 2005 best in class) -33% -50% -60%
* Projected benefits once technologies are matured and implemented by industry. Benefits vary by vehicle size and mission. N+1 and N+3 values are referenced to a 737-800 with CFM56-7B engines, N+2 values are referenced to a 777-200 with GE90 engines **ERA’s time-phased approach includes advancing “long-pole” technologies to TRL 6 by 2015 *** CO2 emission benefits dependent on life-cycle CO2e per MJ for fuel and/or energy source used
In order to perform the system level
analysis, the Environmental Design Space (EDS)3,4 environment was selected to model both conventional and unconventional configurations as well as to assess technologies from the ERA and N+2 timeframe portfolios. A well-
TECHNOLOGY INTEGRATION AND SYSTEM
ASSESSMENTS WITH UNCERTAINTY MODELLING Dimitri N. Mavris*, Katherine G. Schwartz*, Jimmy Tai*
*Georgia Institute of Technology, School of Aerospace Engineering
Keywords: technology assessments, probabilistic analysis,

MAVRIS, SCHWARTZ, TAI
2
established system design approach was employed to perform aircraft conceptual design studies, including technology trade studies to identify technology portfolios capable of accomplishing the ERA project goal and to obtain tradeoffs between performance, noise, and emissions.
This paper provides a description of the framework created, an enumeration of the different analysis techniques utilized in the methodology, an overview of how the modeling environment is utilized to conduct probabilistic performance assessments, and fleet level performance results. Section 2 of this paper provides the technical approach overview, and a description of the EDS environment is provided in Section 3. Section 4 provides a detailed explanation of the vehicle modeling process while Section 5 explains the technology groupings used in the study. The results of the vehicle level performance assessments are provided in Section 6, and Section 7 provides a brief overview of the fleet level assessments. Finally, an application of an uncertainty assessment process is discussed in Section 8.
2. Technical Approach A technical approach that utilizes a
physics and empirically based vehicle modeling environment and a quantitative representation of technologies was created and executed for these studies. Figure 1 depicts the technical approach leading to the system level assessment. The entire process for technology integration and system assessment with uncertainty modeling contains the following elements:
• Parametric aircraft modeling • Metrics calculations • Technology impact and compatibility • Surrogate model generation • System level assessment • Fleet level assessment • Uncertainty assessment
Each of these elements in the methodology is discussed in more detail. The environment used to model conventional and advanced configurations (left block of Figure 1) is described in more detail in Section 3.
The result of the vehicle modeling element is the synthesized and sized vehicle (i.e. its mass converged), the three main ERA metrics, fuel burn, certification noise, and LTO NOx, are computed. The evaluation module also includes a set of calculations to characterize the vehicle performance which are subsequently linked to the fleet level modeling (discussed in Section 7).
These computed metrics are the basis by which the potential ERA technologies are evaluated to determine the best combinations that can achieve the ERA project goal. The upper-right block of Figure 1 shows a structured process to model and assess technologies, which begins with a list of candidate technologies from the ERA portfolio. First, the physical compatibility rules for this list of technologies must be established via a technology compatibility matrix (TCM). As its name suggests, the purpose of the TCM is to define compatibility between the various technologies and configurations; furthermore, the TCM also identifies enablers and direct interactions between technologies.
Figure 1: Technical Approach Process Chart
Next, the impacts of the technologies that are modeled through a quantitative exploratory forecasting technique. This technique, referred to as the k-factor technique, represents technologies, or potential impacts of technologies, as defined deltas (in these cases represented as metric multipliers) with respect to a current system baseline.5,6 These deltas are referred to as “k-factor effects” and they directly
Aero Prediction
Component Weight Sizing
Propulsion Sizing & Performance
Mission Analysis
No
Parametric Geometry
Technology Space Exploration & Optimization
Probabilistic Analysis
Multivariate Regression
Surrogate Models
Fuel Burn
LTO & Cruise NOx Emissions
Noise
Performance Analysis
Emissions Prediction
Noise Prediction
Technology Portfolio
Recommendation
Technology Infused Vehicles
Technology k-factor
Parametric Ranges
Design of Experiments
Technology Portfolio
TechnologyImpact Matrix
(TIM)
Technology Compatibility Matrix (TCM)
Technology Modeling & Assessment
Advanced Vehicle Modeling
Coefficient Generation for Fleet Analysis
Fuel Balance?
Yes
Metrics Calculations
EDS
3
TECHNOLOGY INTEGRATION AND SYSTEM ASSESSMENTS WITH UNCERTAINTY MODELLING
modify lower level metrics during the analysis process, which in turn simulate technology benefits and penalties. The technology k-factors provide a way to simulate the discontinuity of technology benefits or penalties in a generic way. Examples of computed metrics that k-factors alter are specific fuel consumption or cruise drag, both of which can be outputs of one assessment tool and inputs to another. The k-factors for each technology are organized via a technology impact matrix (TIM). The combination of the TCM and TIM produces the parametric ranges for the desired technology k-factors. Based on the number of k-factors and their established ranges, a design of experiment (DOE) is chosen. The DOE then dictates the specific input settings for each execution of advanced vehicle modeling and metrics calculation blocks of Figure 1.
The computed metrics are collected for each DOE simulation and utilized in a multivariate regression to generate surrogate models. These surrogate models represent the technology space to be explored and optimized to maximize their impact. These surrogate models are then used in the system assessment (Section 6) to identify technology portfolios that best contribute to the ERA goal. The system level results are then propagated up to a fleet level
analysis to capture the impact of technology
portfolios at the fleet operational level, in terms of billions of gallons of fuel and community noise contours.
The results of the system assessment were also used to help ERA project team to down select technologies for the integrated technology demonstrators (ITDs). This paper also outlines an uncertainty assessment process conducted with the NASA ERA ITDs.
3. Experimental Apparatus - EDS The ability to conduct the type of
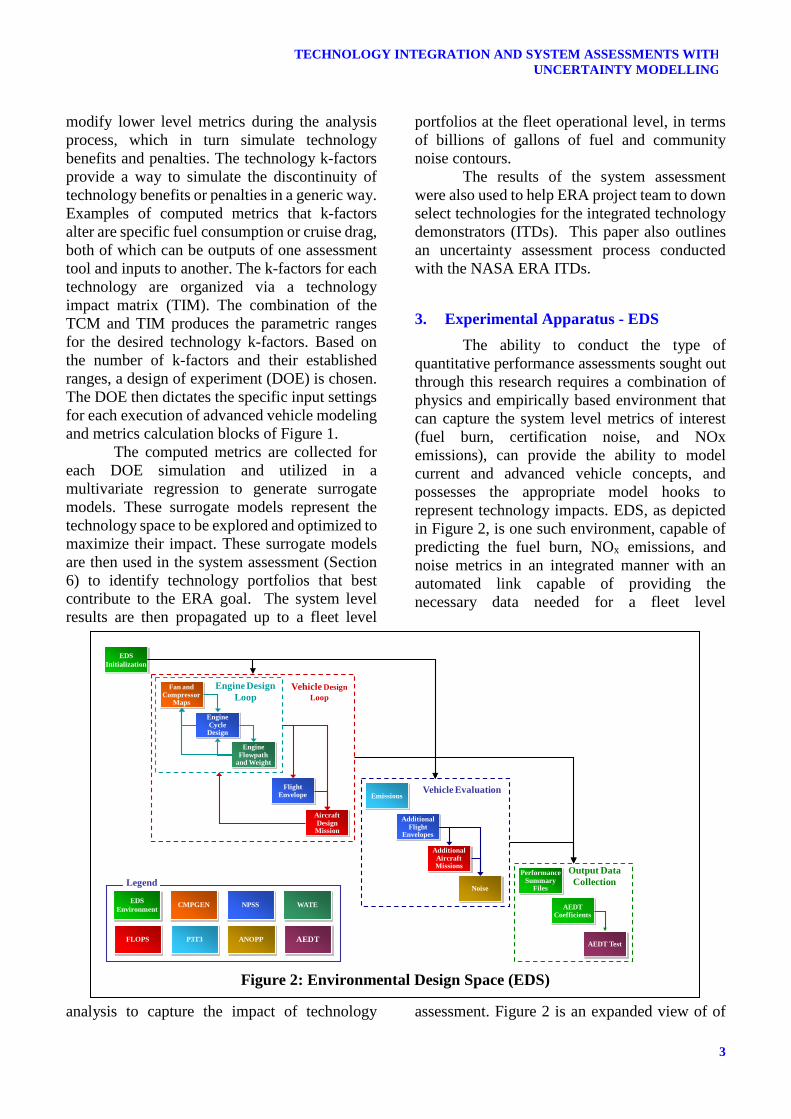
quantitative performance assessments sought out through this research requires a combination of physics and empirically based environment that can capture the system level metrics of interest (fuel burn, certification noise, and NOx emissions), can provide the ability to model current and advanced vehicle concepts, and possesses the appropriate model hooks to represent technology impacts. EDS, as depicted in Figure 2, is one such environment, capable of predicting the fuel burn, NOx emissions, and noise metrics in an integrated manner with an automated link capable of providing the necessary data needed for a fleet level
assessment. Figure 2 is an expanded view of of
Figure 2: Environmental Design Space (EDS)
Vehicle EvaluationEmissions
Fan and Compressor
Maps
Engine Cycle
Design
Engine Flowpath
and Weight
Flight Envelope
Aircraft Design
Mission
EDS Initialization
Additional Flight
Envelopes
Additional Aircraft Missions
Noise
Performance Summary
Files
AEDT Test
AEDT Coefficients
Engine Design Loop
Vehicle Design Loop
Output Data Collection
CMPGEN NPSS WATE
FLOPS
EDS Environment
ANOPP AEDTP3T3
Legend

MAVRIS, SCHWARTZ, TAI
4
the block labelled as “EDS” in Figure 1. EDS was suitable for this investigation due to familiarity to NASA. The majority of EDS analysis components are NASA developed programs which have been integrated using the object oriented software, Numerical Propulsion Simulation System (NPSS).7,8 Furthermore, the resulting engine and aircraft models from EDS are directly transferrable back to NASA since they are natively NASA software models. From a capability point of viewpoint EDS is capable of modeling the thermodynamic performance (NPSS) of any engine cycle coupled with a parametric component map generation tool (CMPGEN) and with a 1-D aeromechanical design/analysis for flowpath and weight estimation purposes (WATE++).
This propulsion system simulation is well suited to assess the ERA engine technology portfolio and is unique in its ability to match the engine to a sized airframe using a simultaneous, multi-design point sizing algorithm.1 The propulsion simulation module is coupled with the mission analysis module (FLOPS) in an iterative fashion to ensure that all coupling variables are internally consistent and have converged. EDS ensures this convergence and consistency in order to provide more accurate mission fuel burn results and more accurate data to the noise prediction module (ANOPP) to assess acoustic impacts, including the generation of engine state tables from NPSS and the resulting aircraft noise flight trajectories for the sized vehicle. This data is used within ANOPP to generate the three certification noise values for sideline, cutback and approach as well as characteristic noise power distance (NPD) curves.4
In addition, EDS possesses an NOx prediction algorithm based on a low fidelity flow model, implemented in NPSS and integrated with the engine cycle model, and a separate Chemical Reactor Network (CRN) implemented in Chemkin. The low fidelity flow model provides engine cycle and combustor geometry information to the CRN, and the CRN performs the non-equilibrium chemical kinetics calculations to predict the emissions. The model has been validated against data from the ICAO engine emissions databank, as well as some
advanced low-emissions designs such as the Lean-Direct-Inject (LDI) combustor.
Finally, EDS is capable of direct linkage to a fleet level analysis since it generates the vehicle/engine/noise information necessary to provide replacement aircraft. EDS coupled with a well-structured technology assessment approach utilizing deterministic and probabilistic methods enables accurate tradeoffs between performance, noise, and emissions.
4. Vehicle Modeling
4.1 Baseline Vehicle Modeling The baseline, tube and wing (T&W),
vehicle classes used as the starting points for this research are summarized in Table 2. Configurations serve as the calibration points for vehicles in each passenger class.
Table 2: EDS Baseline Vehicles Passenger Class Airframe Engine
Regional Jet (RJ) CRJ900 CF34-8C5
Small Single Aisle (SSA) 737-200 CFM56-7B27
Large Single Aisle (LSA) 737-800 CFM56-7B27
Small Twin Aisle (STA) 767-300ER CF6-80C2
Large Twin Aisle (LTA) 777-200ER GE90-94B
Very Large Aircraft (VLA) 747-400 PW4056
The calibration process followed for each
passenger class is depicted in Figure 3. The process goes as follows:
• Data is collected from public domain sources for the propulsion system, aircraft, mission, etc. The data includes FAA’s type certification datasheets, airport planning documents, engine cross section data, three-view drawings, etc.
• Developed the engine model using NPSS and calibrated for both on-design and off-design conditions. The calibrated engine results are engine performance data tables, propulsion system weight, maximum diameter and length.

5
TECHNOLOGY INTEGRATION AND SYSTEM ASSESSMENTS WITH UNCERTAINTY MODELLING
• Develop the aircraft model, including the mission analysis. The aircraft calibration is performed with
calibrated engine performance data. The procedure of calibrating the engine first and then calibrating the aircraft model is crucial to establish a well-grounded model. The mission segments assumed for the design mission profile are taxi-out, take-off, climb, cruise, descent, land, and taxi-in with a reserve mission. Sub-optimization is performed within FLOPS for the climb segment to minimize fuel burn, and step cruise is enabled in the mission analysis.
Figure 3: EDS Baseline Calibration Process
4.2 Advanced Concept Vehicle Modeling In addition to the T&W configurations,
unconventional configurations were also modeled. The unconventional airframes include hybrid wing body (HWB), over-wing-nacelle (OWN), and mid-fuselage-nacelle (MFN), and boxed wing (BXW) configurations. Another combinatorial factor is the engine architectures considered, which are advanced direct drive (ADD), geared fan (GF), and open rotor (OR) architectures.
Vehicle Sketch Pad (VSP) is a parametric airplane geometry modeling tool originally developed by NASA, but now open source. It enables airplanes to be modeled rapidly and efficiently for conceptual and preliminary design levels of analysis, without requiring a fully featured CAD program and a large time investment. All of the EDS models developed for ERA had a VSP model created for that geometry.
The VSP models requires vehicle definition information not provided by EDS. Every configuration, except the HWB, had a baseline aircraft from which the fuselage and engine geometry could be approximated. The HWB geometry was a smoothed version of the EDS wing geometry, with additional sections added to the relatively coarse definition from FLOPS. The airfoils for all these models were simple NACA 4-series that matched the thickness to chord ratios of the EDS models, since they were intended primarily for visualization purposes and not used in any detailed analysis.
The HWB is a configuration where the fuselage is smoothly integrated into the wing to provide additional lift, and the tail is eliminated. The aerodynamic performance of this configuration is superior to the T&W because of the increased lift, from the centerbody, and decreased drag, due to the lack of interference between the wing-fuselage and the lack of a tail. Another critical advantage of the HWB is the noise shielding provided by placing the engines on top of the aft end of the centerbody. Modifications to the EDS environment were necessary to model the HWB vehicles. The modifications were in the aerodynamic modeling, and in the way the vehicles were automatically resized to maintain a fixed wing loading.9
The OWN configuration is a modification of the conventional tube and wing with the turbofans mounted above the wing near the leading edge. This engine integration provides some noise shielding of the jet exhaust. An additional modification from the T&W is that the tail is a T-tail configuration; the tail change is driven by the need to keep the horizontal tail out of the jet wash of the engine.
Gather Public Domain Information
Engine
Mission
Develop EngineModel
Calibrate EngineModel
Develop AircraftModel
Calibrate AircraftModel
EDS 1995 BaselineVehicles
etc.
Aircraft
MAVRIS, SCHWARTZ, TAI
6
The MFN aircraft refers to an unconventional aircraft configuration for which the engines are installed on the fuselage and above the wing near its trailing edge. This engine-wing configuration is proposed with the expectation to have moderate shielding of engine noise especially fan inlet and outlet noise. Otherwise the design process for the MFN is generally the same as for the conventional T&W configuration.
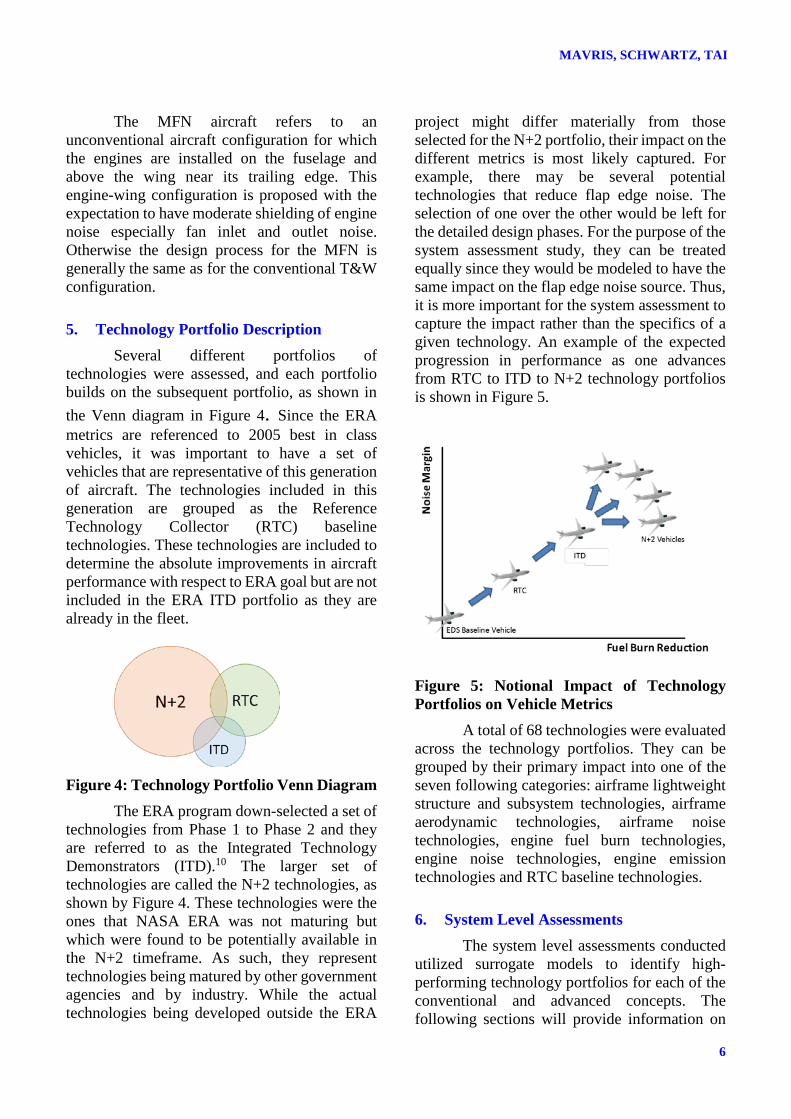
5. Technology Portfolio Description Several different portfolios of
technologies were assessed, and each portfolio builds on the subsequent portfolio, as shown in the Venn diagram in Figure 4. Since the ERA metrics are referenced to 2005 best in class vehicles, it was important to have a set of vehicles that are representative of this generation of aircraft. The technologies included in this generation are grouped as the Reference Technology Collector (RTC) baseline technologies. These technologies are included to determine the absolute improvements in aircraft performance with respect to ERA goal but are not included in the ERA ITD portfolio as they are already in the fleet.
Figure 4: Technology Portfolio Venn Diagram
The ERA program down-selected a set of technologies from Phase 1 to Phase 2 and they are referred to as the Integrated Technology Demonstrators (ITD).10 The larger set of technologies are called the N+2 technologies, as shown by Figure 4. These technologies were the ones that NASA ERA was not maturing but which were found to be potentially available in the N+2 timeframe. As such, they represent technologies being matured by other government agencies and by industry. While the actual technologies being developed outside the ERA
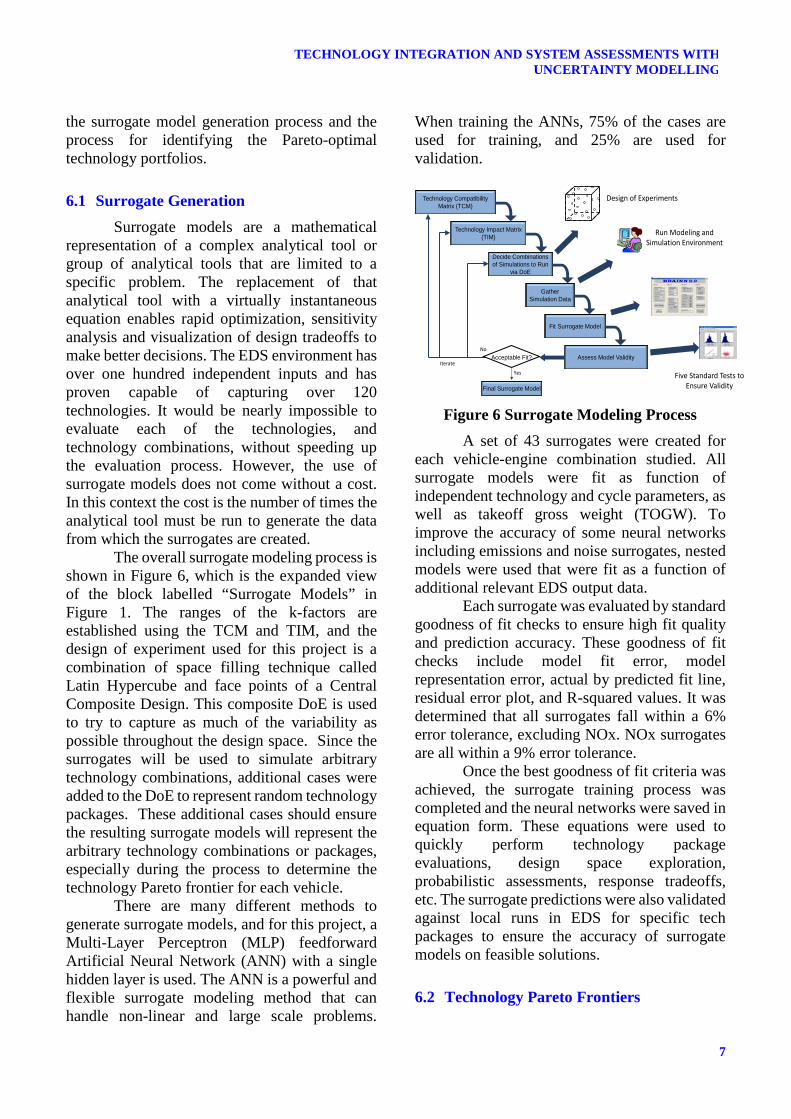
project might differ materially from those selected for the N+2 portfolio, their impact on the different metrics is most likely captured. For example, there may be several potential technologies that reduce flap edge noise. The selection of one over the other would be left for the detailed design phases. For the purpose of the system assessment study, they can be treated equally since they would be modeled to have the same impact on the flap edge noise source. Thus, it is more important for the system assessment to capture the impact rather than the specifics of a given technology. An example of the expected progression in performance as one advances from RTC to ITD to N+2 technology portfolios is shown in Figure 5.
Figure 5: Notional Impact of Technology Portfolios on Vehicle Metrics
A total of 68 technologies were evaluated across the technology portfolios. They can be grouped by their primary impact into one of the seven following categories: airframe lightweight structure and subsystem technologies, airframe aerodynamic technologies, airframe noise technologies, engine fuel burn technologies, engine noise technologies, engine emission technologies and RTC baseline technologies.
6. System Level Assessments The system level assessments conducted utilized surrogate models to identify high-performing technology portfolios for each of the conventional and advanced concepts. The following sections will provide information on
7
TECHNOLOGY INTEGRATION AND SYSTEM ASSESSMENTS WITH UNCERTAINTY MODELLING
the surrogate model generation process and the process for identifying the Pareto-optimal technology portfolios.
6.1 Surrogate Generation Surrogate models are a mathematical
representation of a complex analytical tool or group of analytical tools that are limited to a specific problem. The replacement of that analytical tool with a virtually instantaneous equation enables rapid optimization, sensitivity analysis and visualization of design tradeoffs to make better decisions. The EDS environment has over one hundred independent inputs and has proven capable of capturing over 120 technologies. It would be nearly impossible to evaluate each of the technologies, and technology combinations, without speeding up the evaluation process. However, the use of surrogate models does not come without a cost. In this context the cost is the number of times the analytical tool must be run to generate the data from which the surrogates are created.
The overall surrogate modeling process is shown in Figure 6, which is the expanded view of the block labelled “Surrogate Models” in Figure 1. The ranges of the k-factors are established using the TCM and TIM, and the design of experiment used for this project is a combination of space filling technique called Latin Hypercube and face points of a Central Composite Design. This composite DoE is used to try to capture as much of the variability as possible throughout the design space. Since the surrogates will be used to simulate arbitrary technology combinations, additional cases were added to the DoE to represent random technology packages. These additional cases should ensure the resulting surrogate models will represent the arbitrary technology combinations or packages, especially during the process to determine the technology Pareto frontier for each vehicle.
There are many different methods to generate surrogate models, and for this project, a Multi-Layer Perceptron (MLP) feedforward Artificial Neural Network (ANN) with a single hidden layer is used. The ANN is a powerful and flexible surrogate modeling method that can handle non-linear and large scale problems.
When training the ANNs, 75% of the cases are used for training, and 25% are used for validation.
Figure 6 Surrogate Modeling Process
A set of 43 surrogates were created for each vehicle-engine combination studied. All surrogate models were fit as function of independent technology and cycle parameters, as well as takeoff gross weight (TOGW). To improve the accuracy of some neural networks including emissions and noise surrogates, nested models were used that were fit as a function of additional relevant EDS output data.
Each surrogate was evaluated by standard goodness of fit checks to ensure high fit quality and prediction accuracy. These goodness of fit checks include model fit error, model representation error, actual by predicted fit line, residual error plot, and R-squared values. It was determined that all surrogates fall within a 6% error tolerance, excluding NOx. NOx surrogates are all within a 9% error tolerance.
Once the best goodness of fit criteria was achieved, the surrogate training process was completed and the neural networks were saved in equation form. These equations were used to quickly perform technology package evaluations, design space exploration, probabilistic assessments, response tradeoffs, etc. The surrogate predictions were also validated against local runs in EDS for specific tech packages to ensure the accuracy of surrogate models on feasible solutions.
6.2 Technology Pareto Frontiers
Technology CompatibilityMatrix (TCM)
Technology Impact Matrix (TIM)
Decide Combinationsof Simulations to Run
via DoE
Gather Simulation Data
Fit Surrogate Model
Assess Model ValidityAcceptable Fit?
Final Surrogate Model
No
Yes
Iterate
Design of Experiments
Run Modeling and Simulation Environment
Five Standard Tests to Ensure Validity
MAVRIS, SCHWARTZ, TAI
8
It was desired to analyze the different vehicle and technology combinations to identify high performing technology portfolios. Resource limitations required an informed down-selection of an airframe and propulsion technology portfolio to meet environmental goals. This problem is not unique to aviation environmental impact or to aeronautics in general and features some common traits. A research and development portfolio is typically associated with a set of aggressive performance requirements pursuant of overarching policy that frame and motivate the development of enabling technologies. Albeit methodological diversity, most approaches to the composition of such a portfolio incorporate basic steps for the identification of a pool of candidate technologies, the comparative assessment of technology combinations (each embodying a unique candidate portfolio), and ultimately the down-selection of the portfolio. In this context, questions that typically emerge include:
• What are the most favorable combinations of technologies relative to the goals in question?
• To what extent does the technology portfolio satisfy the goals? What is the best that can be achieved?
• What technologies (or combinations thereof) are critical in reaching prescribed goals?
There are also a number of noteworthy challenges and practical considerations. The size of the problem, and thus the magnitude of the effort, generally scales with the number of candidate technologies to be evaluated as well as with the number and nature of measures of performance with which they ought to be evaluated. Another consideration is the plurality of goals. The comparative assessment of a pool of candidate solutions on the basis of a single measure of performance is, for the most part, trivial. However, a multiplicity of (conflicting) goals implies the need to address tradeoffs inherent across unique technology combinations.
It was determined that technology portfolio composition may be abstracted and generalized as a multi-objective optimization sub-problem followed by a multi-attribute decision making sub-problem. This is consistent
with work by Deb, which led to the selection of a multi-objective genetic algorithm (MOGA) approach to address many of the traits and considerations specific to aircraft technology portfolio composition. This MOGA approach has been well documented and specific details can be found in literature.11,12
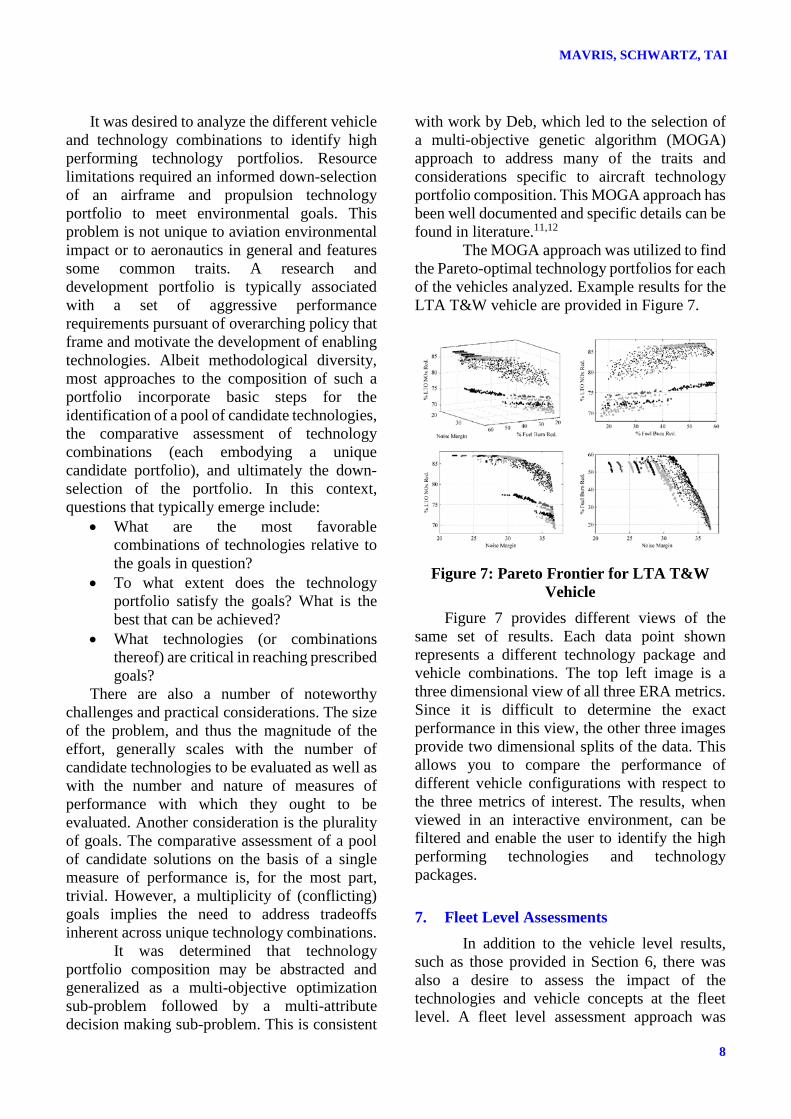
The MOGA approach was utilized to find the Pareto-optimal technology portfolios for each of the vehicles analyzed. Example results for the LTA T&W vehicle are provided in Figure 7.
Figure 7: Pareto Frontier for LTA T&W
Vehicle Figure 7 provides different views of the
same set of results. Each data point shown represents a different technology package and vehicle combinations. The top left image is a three dimensional view of all three ERA metrics. Since it is difficult to determine the exact performance in this view, the other three images provide two dimensional splits of the data. This allows you to compare the performance of different vehicle configurations with respect to the three metrics of interest. The results, when viewed in an interactive environment, can be filtered and enable the user to identify the high performing technologies and technology packages.
7. Fleet Level Assessments In addition to the vehicle level results, such as those provided in Section 6, there was also a desire to assess the impact of the technologies and vehicle concepts at the fleet level. A fleet level assessment approach was

9
TECHNOLOGY INTEGRATION AND SYSTEM ASSESSMENTS WITH UNCERTAINTY MODELLING
developed and a suite of tools that enabled this type of assessment was acquired, developed, and integrated. Figure 9 provides an overview of the fleet analysis process that was followed.13,14 In addition to the performance characteristics, the future operations must also be defined. The operations information includes the demand forecast, the retirement schedule for the aircraft currently in service, and the replacement schedule for the EDS generic vehicles. This information defines the future scenarios that will be analyzed to provide the fleet-level assessments. After the operational information and vehicle performance characteristics have been prepared, the fleet replacement vehicles are run through another toolset to determine fleet vehicle performance. This information is used to generate noise grids for each of the vehicles, which are combined with the current fleet vehicle operations in the airport noise grid integration module to generate airport noise contours. The outputs are used as inputs into another model that provides the fuel burn and NOx statistics for the entire fleet. An example output that enabled by this process is the amount of fuel saved through the infusion of advanced technologies and concepts compared to business as usual scenarios where no technologies are being infused.
The first step of the process is to define the different advanced vehicle scenarios that will
be assessed. The technologies and vehicle concepts are set and analyzed through the EDS environment. The vehicle performance outputs of the EDS environment define the different vehicles that will be considered as replacement vehicles in the future forecasts.
Figure 9: Fleet Analysis Process
Example results from the fleet assessments are provided in Figure 10 and Figure 10. Figure 10 provides a depiction of fleet-level fuel burn reduction results. This chart provides a projection of different technology scenarios, including a business as usual scenario (BAU) where no new technologies or system concepts
are introduced. Note that scenarios that have a ‘UC’ in their naming scheme are those that have included unconventional concepts in their vehicle replacement schedule. It is clear from this chart that the inclusion of advanced concepts and emerging technologies will provide a large impact in fleet fuel burn reduction. Similar
Figure 8: Notional Fleet Noise Contours

MAVRIS, SCHWARTZ, TAI
10
results are depicted in Figure 10 for community noise. The noise contours again represent different technology portfolios. The results are representative of a 2050-ERA fleet. It is important to note that the results depicted in both Figure 10 and Figure 10 are only representative to one fleet assessment with one set of assumptions. Over the course of this research, the authors and their colleagues have conducted several different fleet-level assessments with many different modeling assumptions with regards to the demand curves, technology impacts, retirement schedules, introduction schedules, etc. The results depicted in this paper are not the ‘final’ results due to proprietary information agreements.
Figure 10: Notional Fleet Fuel Burn Results
8. ITD Uncertainty Analysis The both the system and fleet level results aided the ERA project in its decision process to down select the set of technologies to further develop in the integrated technology demonstrators. An in-depth probabilistic performance assessment was conducted for these ITD technologies. The ITDs range from airframe aerodynamic technologies to noise reduction concepts. Table 3 provides a list of the ITDs.
The experimental plans for the eight ITDs were developed by industry partners and SMEs. The ERA program desired the ability to utilize the experimental data to track its technical performance progression to aid in justifying the pursuance of the technology and quantify risk reduction. The technical progress of each ITD is tracked through metrics called key performance parameters (KPPs). A methodology that captures
the KPPs identified for each of the ITD technologies in a quantitative, probabilistic manner was developed to enable the characterization of the performance uncertainty and its reduction progression over time. The approach utilizes three main components: uncertainty quantification, system decomposition, and physics-based modeling.
Table 3: Integrated Technology Demonstrations
ITD Name Active Flow Control (AFC) Enhanced Vertical
Tail and Advanced Wing Technology Flight Experiments
Damage Arresting Composites Adaptive Compliant Trailing Edge
Highly Loaded Front Block Compressor Second Generation Ultra-High Bypass (UHB)
Integration Low NOx Fuel Flexible Combustor Integration Flap Edge and Landing Gear Noise Reduction
UHB Integration for HWB With respect to this research, system decomposition refers to the process followed to determine the parameters and capabilities required for calculating the ITD KPPs. This involved working with the ITD SME’s to produce a list of experimental measurements, conducting literature surveys to understand the defining physics of the technologies, and then synthesizing this information to establish the necessary quantitative relationships. This information helped inform the technology modeling plans that were tailored to each ITD. The amount of data, the quality of the data, and the anticipated experimental measurements from future experiments determined the type of uncertainty quantification approach taken for each ITD. The overall goal was to determine the appropriate way to calculate the set of technology factors (k-factors) within the EDS environment each ITD was previously mapped to. This could be done by using existing data directly or through other modeling efforts that were validated using the existing experimental data.
Next, the distributions for each of the ITD k-factors were established based on available sets of data for each ITD. Different points in the development process were represented by

11
TECHNOLOGY INTEGRATION AND SYSTEM ASSESSMENTS WITH UNCERTAINTY MODELLING
different k-factor distributions. The uncertainty in the k-factors was propagated to the ITD KPPs to characterize their output distributions. The data could then be synthesized to show the progression of the uncertainty reduction over time. Furthermore, the probabilistic data and the surrogate models provided the ability to conduct a sensitivity analysis for each ITD. The results of the sensitivity analyses enabled the identification of key uncertainty sources that were driving the uncertainty in each of the KPP values.
Figure 11 provides a notional depiction of one of the ITD uncertainty assessments. Exact results have not been included to protect the proprietary nature of the experimental data provided by NASA and industry partners. In Figure 11, the y-axis is a KPP for one of the ITDs. The green boxes represent the calculated statistical mean of the metric for that point in time and the colored bars represent the results of the uncertainty analysis.
Figure 11: Example ITD Uncertainty
Assessment Three different points in time are shown in
Figure 11, with the left most being the first assessment and the right most occurring after two different tests have been performed. Therefore, moving from left to right, the overall uncertainty surrounding the KPP reduces and the mean shifts. Furthermore, as the sensitivity analysis is re-conducted over time, the contribution levels of each uncertainty source changes. This reflects direct reduction of specific uncertainty sources due to the experiments performed.
9. Conclusions The research presented in this paper is the culmination of many years of work in partnership with the NASA ERA program. A vehicle and technology performance analysis framework was
developed that utilizes a physics and empirically based environment to enable quantitative performance assessments. The framework provided enable key technology development decisions to be made. However, it is important to note that the authors of this paper did not directly make any decisions regarding the ERA project, but aided the program in creating a set of models and processes that enable these decisions to be made in a risk-informed manner. Advanced vehicle concepts and several advanced technology portfolios were analyzed to determine the impact they may have in the future at both the vehicle level and the fleet level. The results of these assessments provided the means for key decision makers to perform routine, quantitative technology tradeoff assessments at the technology level, vehicle level, and fleet level.
10. Acknowledgements This work was funded by the NASA
through under contract NNL12AA12C and NNL09AA00A. The ERA project manager is Dr. Fay Collier, with day to day project oversight of the ASDL team by Dr. Frank Gern, Mr. Craig Nickol, and Ms. Gaudy Bezos-O’Connor. The authors would like to graciously thank all members of the ASDL ERA systems analysis team who have worked tirelessly over the life of the projects to complete all of the assessments.
11. References 1 Schutte, J. S., Jimenez, H., and Mavris, D. N.,
“Technology Assessment of NASA Environmentally Responsible Aviation Advanced Vehicle Concepts,” 49th AIAA Aerospace Sciences Meeting, Orlando, FL: 2011.
2 Schutte, J. S., Jimenez, H., and Mavris, D. N., “Technology Assessment of NASA Environmentally Responsible Aviation Advanced Vehicle Concepts,” 49th AIAA Aerospace Sciences Meeting, Orlando, FL: 2011.
3 Kirby, M. R., and Mavris, D. N., “The Environmental Design Space,” 26th International Congress of the Aeronautical Sciences, 2008.
4 Schutte, J. S., Kestner, B., Tai, J., and Mavris,
MAVRIS, SCHWARTZ, TAI
12
D. N., “Updates and Modeling Enhancements to the Assessment of NASA Environmentally Responsible Aviation Technologies and Vehicle Concepts,” 50th AIAA Aerospace Sciences Meeting, Nashville, TN: 2012.
5 Mavris, D. N., and Delaurentis, D. A., “A Stochastic Design Approach for Aircraft Affordability,” ICAS, 1998.
6 Kirby, M. R., and Mavris, D. N., “Forecasting the Impact of Technology Infusion on Subsonic Transport Affordability,” World Aviation Conference, Anaheim, CA: 1998.
7 Lytle, J. K., Follen, G., Naiman, C., Evans, A., Veres, J., Owen, K., and Lopez, I., Numerical Propulsion System Simulation: 1999 Industry Review, Cleveland, Ohio: 1999.
8 Lytle, J. K., Follen, G., Naiman, C., Veres, J., Owen, K., and Lopez, I., Numerical Propulsion System Simulation Review, Cleveland, Ohio: 2000.
9 Velicki, A., and Jegley, D., “PRSEUS Development for the Hybrid Wing Body Aircraft,” AIAA Centennial of Naval Aviation Forum “100 Years of Achievement and Progress,” Reston, Virigina: American Institute of Aeronautics and Astronautics, 2011.
10 Washburn, A., “An Overview of NASAʼs Environmentally Responsible Aviation Project Plan:2013-2015,” 51st AIAA Aerospace Sciences Meeting, Grapevine, TX: 2013.
11 Jimenez, H., Acuff, C., and Mavris, D. N., “Study of Resource Constraints and Environmental Performance Objectives in Pareto-Optimal Aircraft Technology Portfolios,” 2013 Aviation Technology, Integration, and Operations Conference, Reston, Virginia: American Institute of Aeronautics and Astronautics, 2013.
12 Jimenez, H., Acuff, C., and Mavris, D., “Study of Pareto-Optimal Aircraft Technologies for Next-Decade Environmental Goals,” 51st AIAA Aerospace Sciences Meeting including the New Horizons Forum and Aerospace Exposition, Reston, Virigina: American Institute of Aeronautics and Astronautics, 2013.
13 Pfaender, H., Jimenez, H., and Mavris, D. N., “Fleet Assessment of Fuel Burn and NOx Emissions for NASA Environmentally Responsible Aviation ( ERA ) Technologies and Concepts,” 12th AIAA Aviation Technology, Integration, and Operations
(ATIO) Conference, Indianapolis, IN: 2012. 14 Jimenez, H., Pfaender, H., and Mavris, D. N.,
“System-wide Fleet Assessment of NASA Environmentally Responsible Aviation (ERA) Technologies and Concepts for Fuel Burn and CO2,” 11th AIAA Aviation Technology, Integration, and Operations (ATIO) Conference, Virginia Beach, VA: 2011.
8. Contact Author Email Address mailto:[email protected]
Copyright Statement The authors confirm that they, and/or their company or organization, hold copyright on all of the original material included in this paper. The authors also confirm that they have obtained permission, from the copyright holder of any third party material included in this paper, to publish it as part of their paper. The authors confirm that they give permission, or have obtained permission from the copyright holder of this paper, for the publication and distribution of this paper as part of the ICAS proceedings or as individual off-prints from the proceedings.