technology options - cstep
TRANSCRIPT


Technology Options
for the Sanitation Value Chain
Team Members
Shubhra Singh Sujaya Rathi Sonali Patro
Shramana Dey Riya Rachel Mohan
Center for Study of Science, Technology and Policy (CSTEP)
July, 2016
Center for Study of Science, Technology and Policy (CSTEP) is a private, not-for-profit (Section 25) Research
Corporation registered in 2005.
Designing and Editing by CSTEP
Disclaimer
While every effort has been made for the correctness of data/information used in this report, neither the
authors nor CSTEP accept any legal liability for the accuracy or inferences for the material contained in this
report and for any consequences arising from the use of this material.
© 2016 Center for Study of Science, Technology and Policy (CSTEP)
No part of this report may be disseminated or reproduced in any form (electronic or mechanical) without
permission from CSTEP.
This report should be cited as: CSTEP (2016). Technology Options for the Sanitation Value Chain, Version 1.0,
(CSTEP-Report-2016-07).
July, 2016
Center for Study of Science, Technology and Policy
# 18, 10th Cross, Mayura Street,
Papanna Layout, Nagashettyhalli, RMV II Stage,
Bangalore-560094 Karnataka, INDIA
Tel.: +91 (80) 6690-2500
Fax: +91 (80) 2351-4269
Email: [email protected]
Website: www.cstep.in

Acknowledgements
CSTEP would like to thank the Bill and Melinda Gates Foundation for their continued support and
encouragement. The authors are grateful to Mr. Dorai Narayana, Dr. Koottatep Thammarat, Mr.
Rajesh Pai, Dr. Dayanand Phanse, Mr. Dhawal Patil, Mr. Rahul Sachdeva, Mr. Avinash Kumar Yadhav,
Dr. Manoj Pandey, Dr. Petter D. Jenssen, and Dr. Ligy Philip for valuable insights and suggestions. In
particular, the authors would like to acknowledge the inputs provided by Abhijit Chakraborty
(Editor), and Communication & Policy Engagement team and other colleagues at CSTEP for their
generous inputs and support to make this a complete piece of work. Last but not the least, these
work could not have been possible without the invaluable support and encouragement from Dr. V.
S. Arunachalam, Chairman, CSTEP, and Dr. Anshu Bharadwaj, Executive Director, CSTEP.


About the Compendium
The purpose of the compendium is to provide information on sanitation technologies from across
the sanitation value chain. The compendium details the characteristics, advantages and
disadvantages of the different technology options, and also describes the different types of systems
formed as a combination of the technologies, addressing all stages of the value chain. These
technologies have been included in the Technology Decision support Tool for Sanitation
(SANITECH), developed by the Center for Study of Science, Technology and Policy (CSTEP). The
document was compiled based on literature review and expert validation. The compendium is
intended to be a live document, updated as and when new technologies and relevant data become
available.

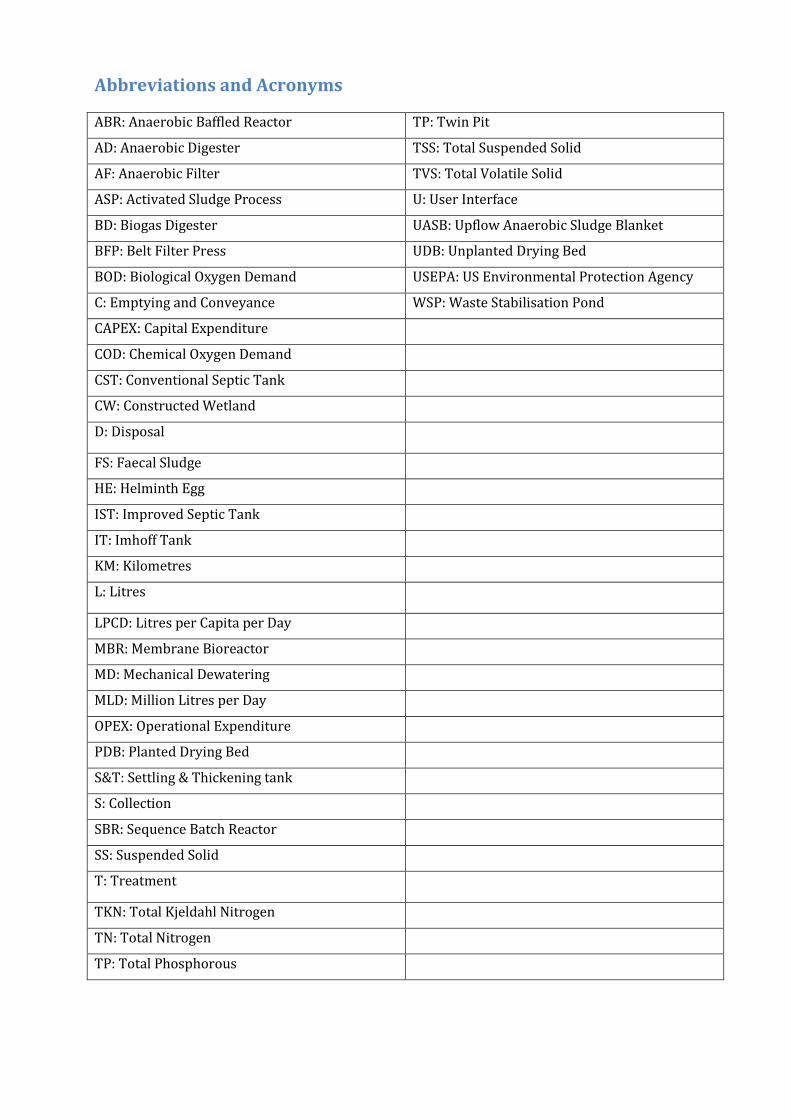
Abbreviations and Acronyms
ABR: Anaerobic Baffled Reactor TP: Twin Pit
AD: Anaerobic Digester TSS: Total Suspended Solid
AF: Anaerobic Filter TVS: Total Volatile Solid
ASP: Activated Sludge Process U: User Interface
BD: Biogas Digester UASB: Upflow Anaerobic Sludge Blanket
BFP: Belt Filter Press UDB: Unplanted Drying Bed
BOD: Biological Oxygen Demand USEPA: US Environmental Protection Agency
C: Emptying and Conveyance WSP: Waste Stabilisation Pond
CAPEX: Capital Expenditure
COD: Chemical Oxygen Demand
CST: Conventional Septic Tank
CW: Constructed Wetland
D: Disposal
FS: Faecal Sludge
HE: Helminth Egg
IST: Improved Septic Tank
IT: Imhoff Tank
KM: Kilometres
L: Litres
LPCD: Litres per Capita per Day
MBR: Membrane Bioreactor
MD: Mechanical Dewatering
MLD: Million Litres per Day
OPEX: Operational Expenditure
PDB: Planted Drying Bed
S&T: Settling & Thickening tank
S: Collection
SBR: Sequence Batch Reactor
SS: Suspended Solid
T: Treatment
TKN: Total Kjeldahl Nitrogen
TN: Total Nitrogen
TP: Total Phosphorous

Table of Contents
Part A: Introduction ................................................................................................................................................................ 1
Part B: Introduction to the Sanitation Value Chain .................................................................................................... 2
Part C: Brief Introduction of the Functional Groups of a Sanitation System ................................................... 7
Part D: Designed System for Faecal Sludge Management .................................................................................... 34
Part E: Benefits of Treated Sludge .................................................................................................................................. 60
Part F: Compatibility Matrix ............................................................................................................................................. 60
Part G: Sanitech Tool ............................................................................................................................................................ 61
ANNEXURE-I............................................................................................................................................................................ 67
References ................................................................................................................................................................................ 71
List of Figures
Figure 1: Overview of Sanitation in Developing Countries..................................................................................... 1
Figure 2: Five Groups of the Sanitation Value Chain ................................................................................................. 3
Figure 3: Overview of a Pour Flush Toilet ..................................................................................................................... 8
Figure 4: Overview of a Cistern Flush Toilet ................................................................................................................ 8
Figure 5: Overview of a UDDT ............................................................................................................................................ 9
Figure 6: Schematic View of a Composting Toilet ...................................................................................................... 9
Figure 7: A Pour Flush Toilet Linked to a Twin-Pit System ................................................................................. 11
Figure 8: Overview Scheme of a Septic Tank ............................................................................................................. 11
Figure 9: Overview Scheme of an IST (Two Compartments) with a Soak Pit .............................................. 11
Figure 10: Overview of a Basic Biogas Digester ....................................................................................................... 12
Figure 11: Schematic of a Human-Powered FSM Transport Technology ...................................................... 16
Figure 12: Automated FS-Receiving Station at Manila, Philippines ................................................................. 16
Figure 13: Schematic View of Unplanted Sludge Drying Bed ............................................................................. 20
Figure 14: Schematic View of Planted Sludge Drying Bed ................................................................................... 20
Figure 15: Schematic View of Anaerobic Digester .................................................................................................. 20
Figure 16: Schematic View of Centrifugation ............................................................................................................ 21
Figure 17: Schematic View of Settling and Thickening Tank .............................................................................. 21
Figure 18: Schematic View of Imhoff Tank ................................................................................................................. 21
Figure 19: Schematic View of Anaerobic Baffled Reactor .................................................................................... 22
Figure 20: Schematic View of Geobags in Malaysia ................................................................................................ 22
Figure 21: Schematic View of Waste Stabilisation Pond ...................................................................................... 26
Figure 22: Schematic View of Activated Sludge Process ...................................................................................... 26
Figure 23: Schematic View of Constructed Wetland .............................................................................................. 26
Figure 24: Schematic View of Sequence Batch Reactor ........................................................................................ 27
Figure 25: Schematic View of Membrane Bioreactor............................................................................................. 27
Figure 26: Schematic View of Anaerobic filter .......................................................................................................... 27
Figure 27: Schematic View of Composting and Vermicomposting ................................................................... 30
Figure 28: Schematic View of Sludge Drying Bed .................................................................................................... 30
Figure 29: Schematic View of Planted Burying Pits or Trenches ...................................................................... 31
Figure 30: Schematic View of Solar Sludge Oven ..................................................................................................... 31
Figure 31: Twin-Pit System for FSM ............................................................................................................................. 35
Figure 32: Decentralised System for FSM (Septic tank + UDB + WSP + Co-composting) ....................... 36
Figure 33: Decentralised System for FSM (AD + Co-composting + Chlorination)...................................... 38
Figure 34: Decentralised System for FSM (Centrifugation + ASP + Vermicomposting + Ozonation) 39
Figure 35: Decentralised System for FSM (Centrifugation + SBR + Co-composting + Chlorination) . 40
Figure 36: Decentralised System for FSM (Centrifugation + MBR + Co-composting + Ozonation) .... 42
Figure 37: Decentralised System for FSM (MD+ AF + CW + Co-composting) .............................................. 43
Figure 38: Decentralised System for FSM (MD + WSP + Co-composting) ..................................................... 44
Figure 39: Networked System for FSM (ASP + Reed Bed + Sludge Drying Bed + Co-composting) ..... 45
Figure 40: Decentralised System for FSM (IT + CW + Sludge Drying Bed + Co-composting) ............... 46
Figure 41: Networked System for FSM (ABR+ Sludge-Drying Bed + Co-composting) ............................. 48
Figure 42: Networked System for FSM (AF+ Sludge Drying Bed + Co-composting) ................................ 48
Figure 43: Decentralised System for FSM (Belt Filter Press + CW + Lime Stabilisation) ....................... 50
Figure 44: Networked System for FSM (UASB+ Sludge Drying Bed + Co-composting) ........................... 51
Figure 45: Decentralised System for FSM (MD + WSP + Solar Drying) .......................................................... 52
Figure 46: Decentralised system for FSM (PDB + CW + Shallow Trenches + Chlorination) .................. 53

Figure 47: Decentralised System for FSM (Geobags + WSP+ Co-composting) ............................................ 54
Figure 48: Decentralised System for FSM (ABR + CW + Sludge Drying Bed + Co-composting) ........... 56
Figure 49: Decision Flow of the Tool............................................................................................................................. 64
List of Tables
Table 1: Reported Faecal Production Rates in Low Income and High Income Countries .......................... 4
Table 2: City-wise Urine Production Rates .................................................................................................................... 4
Table 3: Reported Characteristics of FS from Onsite Sanitation Facilities and Wastewater Sludge ..... 5
Table 4: General Descriptions of User Interface .......................................................................................................... 7
Table 5: General Descriptions of Storage Options for Excreta ........................................................................... 10
Table 6: Decision-Making Matrix for On-Site Collection/Storage/Treatment ............................................. 12
Table 7: Comparison of Manually Operated and Mechanical Sludge-Emptying Equipment ................ 13
Table 8: Summary of Cost for Transport of FS .......................................................................................................... 15
Table 9: Decision Matrix for Emptying and Conveyance ...................................................................................... 16
Table 10: General Descriptions of Primary Treatments ....................................................................................... 18
Table 11: Decision-Making Matrix for Primary Treatment of Sludge ............................................................. 23
Table 12: General Descriptions of Effluent Treatments ........................................................................................ 24
Table 13: Decision-Making Matrix for Effluent Treatment .................................................................................. 28
Table 14: General Descriptions of Post-Effluent Treatments ............................................................................. 29
Table 15: General Descriptions of Sludge Treatment Technologies ................................................................ 32
Table 16: Decision-Making Matrix for Sludge Treatment .................................................................................... 34
Table 17: Comparison of 12 Systems w.r.t. Land, Energy, Performance & Cost ......................................... 57
Table 18: Components of the Sanitation Value Chain ............................................................................................ 60
Table 19: City/Ward/Any Spatial Unit – Population and Sanitation Data .................................................... 63
Table 20: Constraints Data for City/Ward/Any Spatial Unit .............................................................................. 63

Technology Options for the Sanitation Value Chain
© CSTEP www.cstep.in 1
Part A: Introduction
Sanitation
Sanitation refers to the maintenance of hygienic conditions by proper treatment and disposal of
human urine and faecal sludge (FS). Inadequate sanitation is a major cause of diseases worldwide,
and improved sanitation is known to have a significant positive impact on health both in
households and across communities. At present, there is a lack of access to affordable sanitation in
India. About 53.1% of the households do not have a toilet and 38% of urban households in India use
septic tanks as onsite sanitation facilities. “In Africa, more than 60% of the population does not
have access to improved sanitation, with 40% of the rural population practising open defecation”
[1]. Figure 1 shows the overview of sanitation in developing countries. Building a mechanism for
the safe disposal of septage1 from these onsite sanitation systems often remains a neglected
component. Poorly and unscientifically designed onsite disposal facilities affect the sources of
groundwater and surface water with substantial environmental and health hazards.
Figure 1: Overview of Sanitation in Developing Countries
Source: Hydroconseil
Health Effect of Poor Sanitation
Malnutrition is thought to have a role in about 50% of all deaths among children worldwide [2]. In
less developed countries like India, bad nutritional status and poverty promote mortality and
morbidity associated with excreta-related diseases. Excreta and wastewater disposal accounted for
the “second biggest percentage of DALYs after malnutrition”[2]. It is estimated that there are
approximately 4 billion cases of diarrhoea per year (resulting in 2.2 million deaths) worldwide; 200
million people suffer from schistosomiasis and 400 million people are affected with intestinal
1 Septage means the partially treated sludge stored in a septic tank or pit latrine. It is a type of faecal sludge and a by-product of the pretreatment of household wastewater in a septic tank where it accumulates over time.

Technology Options for the Sanitation Value Chain
www.cstep.in © CSTEP 2
worms[3] [4] [5] [6]. All of these diseases are caused mainly by excreta disposal. In children, below
age 5, most deaths are attributed to diarrhoea [6]. A higher risk of mortality has been observed in
children with low weight (for their age) [7]. The health impacts of water and sanitation are mainly
due to the specific pathogen Shigella spp. [8] [9]. Thus, exposure to excreta and wastewater is an
environmental and health hazard, and so minimising this exposure in each and every part of the
sanitation value chain becomes paramount.
This document is an attempt to compile details of existing technologies that may be relevant for
adoption in developing countries to minimise the exposure to FS and wastewater. Part B introduces
some concepts, details the sanitation value chain and explains the two different categories of
sanitation technologies. Part C details the characteristics, advantages and disadvantages of the
different technology options for each part of the value chain. Part D details the different types of
systems formed as a combination of the technologies described in Part C, addressing all parts of the
value chain. Part E highlights the benefits of treated excreta and wastewater.
Part B: Introduction to the Sanitation Value Chain
This part outlines some of the basic definitions and concepts used to determine technologies for
sanitation.
Sanitation Value Chain
The five things that are covered under the sanitation value chain are user interface, collection,
emptying and conveyance, treatment and disposal (Figure 2). Each aspect has a set of different
technologies, which is explained in Part C. The technologies of the five groups can be chosen to
build a system (Part D).
User Interface
User interface explains the type of toilet construction—pedestal, pan or urinal—with which a user
comes in contact; it is the way in which the user accesses the sanitation system. In most of the
cases, the choice of the user interface depends on the availability of land and water and, also
sociocultural factors. Only excreta and black/yellow water and wash water originate at the user
interface, and not grey water (grey water is generated from domestic sources).
Collection/Storage/Treatment
Collection/Storage/Treatment explains the collection, storage and, sometimes, partial treatment of
products that are generated from the user interface. The treatment that is provided by these
technologies is often a function of storage and is usually passive (e.g., no energy inputs). Thus,
products that are “treated” by these technologies often require subsequent treatment before use
and/or disposal. The collection/storage/treatment component has limited capacity beyond which it
cannot function effectively, and needs to be emptied.
Emptying and Conveyance
Emptying and conveyance describes the removal and transportation of FS from one place to
another (e.g., septic tank to treatment plant). This becomes necessary when the
collection/storage/treatment component has reached its capacity. In developing counties, trucks
and small bores are mainly used for the transportation of sludge.

Technology Options for the Sanitation Value Chain
© CSTEP www.cstep.in 3
Treatment
The treatment part describes the treatment technologies that are generally appropriate for the
ward level and city level. The CAPEX, OPEX, land and energy requirements of the technologies of
the treatment group are generally higher than those of the storage group. The treatment group is
divided into four categories: (1) primary treatment (separation of solid–liquid), (2) treatment of
effluent, (3) treatment of sludge and (4) treatment of post-effluent.
Use and/or Disposal
Disposal describes the safe disposal or use of the treated product for some benefits.
Figure 2: Five Groups of the Sanitation Value Chain
Some Concepts
Faecal Sludge
FS is a slurry or semisolid that is raw or partially digested, and comes from the collection, storage
or treatment of a mixture of excreta and black water, with the presence or absence of grey water.
Examples of sources of FS generation are onsite technologies,2 which include dry toilets, pit
latrines, septic tanks, unsewered public ablution blocks and aqua privies. FS contains organic and
inorganic matter, microorganisms and other contaminants that can have serious impacts on human
health and the environment. It is, thus, necessary to manage FS in a manner that mitigates and
minimises these adverse impacts.
Faecal sludge management (FSM) mainly includes five stages, namely, storage, collection, transport,
treatment, and safe end use or disposal of FS. Safe treatment and disposal of excreta act as the
primary safeguards to protect the community from pathogens and for pollution from entering the
environment. Once pollution/ contaminants/ pathogens enter the environment, they can be
transferred via the mouth (e.g., through eating contaminated vegetables/food or drinking
contaminated water) or the skin (as in the case of the schistosomes and hookworms), although in
many cases adequate personal and domestic hygiene can reduce such transmission. FS and
wastewater contain a high amount of excreted pathogens. For maximum protection of health, it is
very important to understand the treatment of human excreta.
Method to Estimate Faecal Sludge Generation
An estimation and projection of the generation of FS is an important aspect for the proper scheming
of infrastructure required for the development of collection and transportation networks, discharge
sites, treatment plants, and end-use or disposal options [10]. Two theoretical methods that have
2 Onsite technology means the treatment of waste at the point of generation either fully or partially, i.e., within the household premises. Poorly maintained on-site systems can increase the potential for health hazards.

Technology Options for the Sanitation Value Chain
www.cstep.in © CSTEP 4
been developed for the quantification of FS are the sludge production method and the sludge
collection method [10]. The methods depend, respectively, on whether the goal is to determine the
total sludge production or the expected sludge loading at a treatment plant. In the sludge
production method, survey starts at the household level with an estimate of excreta production (i.e.,
faeces and urine), the volume of water used for flushing and cleansing and in the kitchen, and
accumulation rates based on the type of onsite containment technology. In the sludge collection
method, the survey focuses FS collection and transport companies (both legal and informal), and
uses the current demand for services to make an estimate of the volume of FS. Due to lack of
available information and data, many assumptions have to be made in both methods. It is important
to make a note of the changes that could take place in the service area, which would affect the FS
volume. These include population growth, increased coverage of sanitation, changes in on-site
collection/storage methods, changes in emptying methods/frequency, water use, weather, climate,
among others.
Sludge Production Method
The quantity of faeces produced daily can vary significantly based on dietary habits. Quantity also
depends upon the type of food. Generally, high-fibre-content food produces a high quantity of
faeces than food with low fibre content [10]. The faeces production rates in low- and high-income
countries are presented in Table 1.
Table 1: Reported Faecal Production Rates in Low Income and High Income Countries
Location Wet Weight (g/person/day)
High-income countries [11] [12] [13] [14] 100–200
Low-income countries, rural[12] 350
Low-income countries , urban[12] 250
China[15] 315
Kenya [16] 520
Thailand [17] 120–400
Daily urine production can also vary significantly based on factors such as water consumption, diet,
climate and physical activity [11] [12]. The general values for adults and city-wise urine
productions are presented in Table 2.
Table 2: City-wise Urine Production Rates
Location Volume (g/person/day)
General value for adults [12] 1,000–1,300
Sweden [14] 1,500
Thailand [17] 600–1,200
Switzerland (home, weekdays) [18] 637
Switzerland (home, weekends) [18] 922
Sweden [19] 610–1,090
The FS accumulation rate also depends on dietary habits, patterns of societal cohesiveness and
frequency of toilet use. The following data are required to obtain an accurate estimation of FS
production, i.e., number of users, types and number of various onsite systems, location, FS
accumulation rates, and population of socio-economic levels. An accurate estimation of FS

Technology Options for the Sanitation Value Chain
© CSTEP www.cstep.in 5
production requires intensive data collection at the level of household questionnaires. In some
cases, detailed demographic information is available, whereas in others it does not exist.
Sludge Collection Method
The quantity of FS collected from onsite systems depends on the FSM infrastructure, which is based
on factors such as acceptance and promotion of FSM, demand (or regulation) for emptying and
collection services, and availability of legal discharge or treatment sites. The volume of FS collection
can be estimated through interviews, site visits, and a review of the internal records of FS collection
and transport companies. Estimation will be based on the number of collections made each day, the
volume of FS per collection, the average emptying frequency at the household level, and the
estimated proportion of the population that employs the services of collection and transport
companies [20]. Informal or illegal collection activity should also be taken into account, as the
volumes collected can be quite significant. This method for the estimation of the generation of FS is
complicated by many factors such as the presence of a legal discharge location or treatment plant,
whether the discharge fee is affordable, and whether there are enforcement measures to control
illegal dumping. If all of these factors are in place, then it is possible that the majority of FS collected
will be transported and delivered to a treatment site.
Characterisation of Faecal Sludge
To obtain the FS characteristics, the chemical oxygen demand (COD), total solid (TS), biochemical
oxygen demand (BOD), nutrients, pathogens and metals should be considered. These parameters
are almost the same as parameters that are considered for domestic wastewater analysis, although
it needs to be emphasised that the domestic wastewater and FS characteristics are very different.
Table 3 presents the characteristics of FS and also provides information about comparison with
sludge from a wastewater treatment plant. The total solid, organic matter, ammonia and helminth
egg (HE) concentrations in FS are ten or hundred times higher than that in wastewater sludge [21].
Currently, there is a lack of detailed information on the characteristics of FS due to low research
conducted in this field.
Table 3: Reported Characteristics of FS from Onsite Sanitation Facilities and Wastewater Sludge
Parameters FS Sources WWTP Sludge
Public Toilet Septic Tank
pH 1.5–12.6[22] – –
6.55–9.34 [23]
TS 52,500 12,000–35,000 [24] –
30,000 22,000 [25] –
– 34,106[22] –
≥3.5% <3% [26] <1%
TVS 68 50–73 [24] –
65 45[25] –
COD 49,000 1,200–7,800 [24] –
30,000 10,000[25] 7–608
20,000–50,000 <10,000[26] 500–2,500
BOD 7,600 840–2,600[24] –
– 20–229[25]
TN – 190–300[24] –
– – 32–250 [25]
TP 450 150 9–63[25]
TKN 3,400 1,000[27] –

Technology Options for the Sanitation Value Chain
www.cstep.in © CSTEP 6
Parameters FS Sources WWTP Sludge
Nitrates – 0.2–21[28] –
Ammonia 3,300 150–1,200[24] –
2,000 400[25] 2–168
2,000–5,000 <1,000[26] 30–70
Faecal coliform 1x10⁵ 1x10⁵ 6.3x10⁴–
6.6x10⁵[25]
HE 2,500 4,000–5,700[29]
20,000–60,000 4,000 300–2,000[26]
– 600–6,000[30] –
– 16,000 [31] –
Wet and Dry Sanitation
Sanitation technology can be described as either “wet” or “dry”. The wet technology means it
requires water to flush the excreta. Most urban sanitation in India is wet (flush toilet connected to a
septic tank, leach pit or sewer). The dry technology does not need water for flushing the excreta.
Dry technologies include a range of different types of traditional pit latrines, ventilated improved
pits, as well as contemporary designs that promote the safe reuse of excreta. Ecosan is a form of dry
sanitation that separates the urine and faeces at the point of generation of excreta, which is reused
after co-composting. Ecosan has some advantages like a reduced water demand for flushing and
also reduced wastewater management problems (because of no black-water generation). However,
the water availability in most of the Indian cities, and the cultural preference to anal cleaning
methods, makes the flush toilet the preferred option for most households.
Basically, there are three types of sanitation systems in India: (1) onsite sanitation system (holding
waste in the vicinity of the toilet in a pit, tank or vault), (2) offsite sanitation system (waste is
removed from the vicinity of the toilet for disposal elsewhere) and (3) hybrid sanitation system
(retaining solids close to the lavatory, but removing liquid for off-site disposal elsewhere). On-site
sanitation technologies are dependent on the periodic removal of FS from vaults, pits and tanks.
The most common practice, adopted by households, is to pay sweepers to empty out the pits
manually. This imposes vulnerabilities to health risks and is banned by the Constitution of India. In
order to achieve complete sanitation in a city/town, consideration must be for minimising exposure
at all parts of the value chain. It is very important to understand that only collection of FS is not
enough; it needs to be treated before disposal. Hybrid and off-site systems need to connect with
systems of sewer for transporting wastewater from the toilet to the treatment facility. Sewers
consist of a network of buried pipes that carry wastewater from a house to the point of disposal. If
the sewage is connected to piped sewerage, there must be sufficient water to make the sewage flow
along the pipe. In hybrid systems, the toilets are connected via interceptor tanks. Blackwater and
sullage3 are normally combined on-plot and discharged to the sewer through a single household
connection. Normally in all cases, the treatment of sewage is a prerequisite before its discharge to
the open environment or use for irrigation or aquaculture.
Anaerobic and Aerobic Sanitation Systems
Anaerobic sanitation systems like single-pit latrines, septic tanks, biogas settlers, small- and large-
scale anaerobic digesters, and wastewater stabilisation pond systems produce less sludge than
aerobic sanitation systems (e.g., trickling filters, activated sludge, etc.). Anaerobic sanitation is the
treatment of wastewater and waste by a process called anaerobic digestion. During anaerobic
3 Sullage/grey water is the wastewater generated in households or office buildings from streams without faecal contamination.

Technology Options for the Sanitation Value Chain
© CSTEP www.cstep.in 7
digestion, the organic matter in the waste and wastewaters is converted to biogas, a mix of methane
(CH4) and carbon dioxide (CO2), and a nutrient-rich sludge. The sludge generated from an anaerobic
sanitation system is stabilised and is much better with respect to odour than an aerobic sanitation
system. Biogas can be used for power generation and has therefore great potential as a renewable
energy source.
The choice of sanitation systems for a city should particularly depend on the local conditions and
the priorities of the town with regard to sanitation, such as coverage, environmental and health
benefits, elimination of open defecation, etc. Variation in population density, water usage and
availability, soil type, level of water table, availability of capital, ability to pay and uncertainty about
growth patterns will strongly influence the decision-making for the sanitation system.
Part C: Brief Introduction of the Functional Groups of a Sanitation
System
(A) User Interface
Four kinds of user interfaces are described below i.e. pour flush toilet, cistern flush toilet, urine-
diverting dry toilet and composting toilet (Table 4).
Table 4: General Descriptions of User Interface
Options for User Interface
Advantages
Disadvantages
Pour Flush Toilet4 1. Water is sealed in a pour flush toilet, effectively preventing odours.
2. Robust and rarely requires repair 3. Suitable for all type of users like
squatters, washers and wipers. 4. Low CAPEX and OPEX; suitable
where there is insufficient or inconsistent piped water supply.
5. Approximately 2–3 l water is usually sufficient for flushing out the faeces. Pour flush toilets are appropriate for almost all climates.
1. It requires provision of water.
2. Dry cleansing materials may block the water seal and cause clogging.
Cistern Flush Toilet5 1. No serious problems with odours if used correctly.
2. Suitable for all type of users like squatters, washers and wipers.
3. Easy to use and clean.
1. The high capital and operating costs (depends on the price of water).
2. Requires a constant source of piped water.
3. May be difficult to build and/or repair locally with available materials.
4. Generates a large volume of sewage to be discharged.
Urine-Diverting Dry Toilet6
1. It does not require a constant source of water.
2. It is suitable for all types of users
1. Difficult to use for small children.
2. User requires cultural
4 In a pour flush toilet (Figure 3), water is poured by the user. When water supply is not continuous, a cistern flush can become a pour flush toilet [32]. 5 A cistern flush toilet use large amounts of water and also provides a high level of convenience”[33]. Latest toilet models use 6–9 l of water per flush, whereas older models use a high amount of water of up to 20 l for a flush (Figure 4). 6 A urine-diverting dry toilet (UDDT) is a simple, low-cost technology, but it is difficult to clean as compared with other toilets due to lack of water and the need to separate the solid faeces and liquid urine (Figure 5) [36].

Technology Options for the Sanitation Value Chain
www.cstep.in © CSTEP 8
Options for User Interface
Advantages
Disadvantages
like squatters, washers and wiper. 3. Urine can be used directly as
fertiliser. 4. It is suitable for high ground water
levels, hard rock soil areas and areas prone to flooding.
5. When used correctly, no serious problems with odours and vectors (flies) occur.
6. It can be built with locally available materials.
7. Low CAPEX and OPEX.
awareness/ adaptation / acceptance through education and training to use correctly.
3. Excreta pile is visible. 4. Further treatment of excreta
is required before disposal.
Composting Toilet7 1. It can be built with locally available materials.
2. Low CAPEX and OPEX. 3. Urine can be used directly as
fertiliser. It does not require water.
4. No problems with vectors and odours.
1. A model of this type of toilet is not available everywhere.
2. User requires cultural awareness/ adaptation / acceptance through education and training to use correctly.
Figure 3: Overview of a Pour Flush Toilet
Source: Tilley et al. (2014)
Figure 4: Overview of a Cistern Flush Toilet
Source: Tilley et al. (2014)
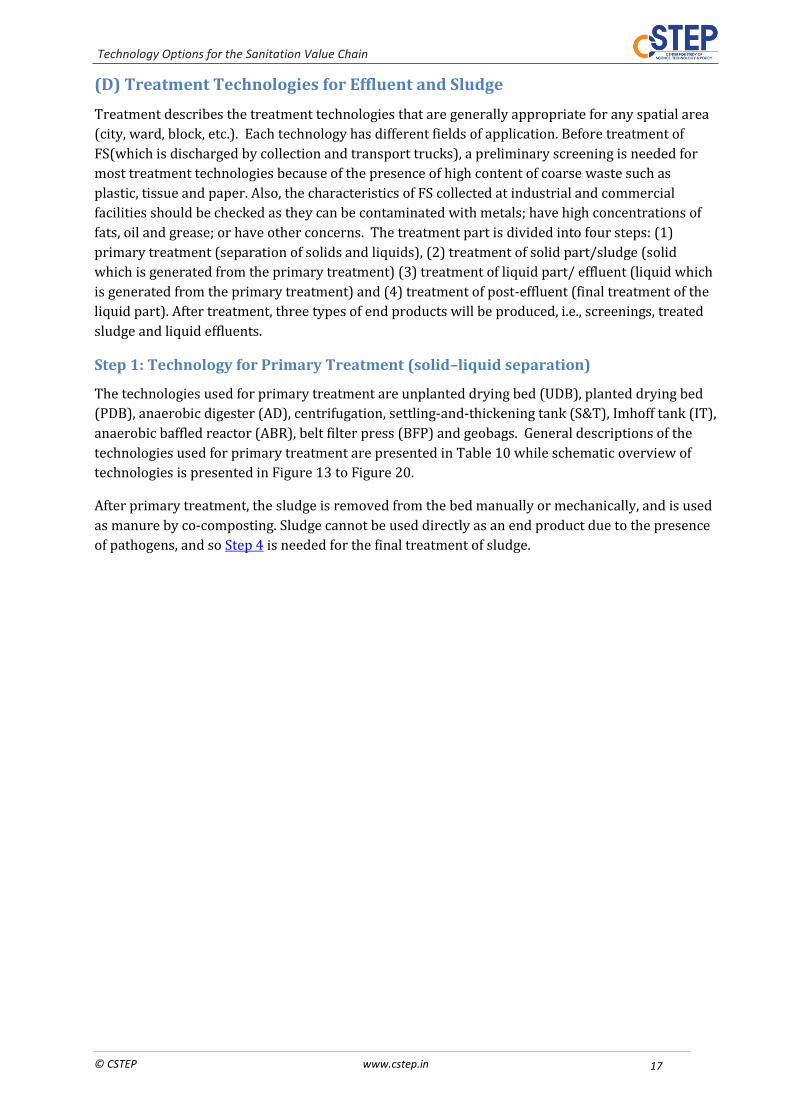
7 It is a dry toilet and does not need water for a flush. Composting toilets produce compost by aerobic decomposition (Figure 6) that can be used for agricultural soil. Composting toilet is suitable for areas where water is not available.
Technology Options for the Sanitation Value Chain
© CSTEP www.cstep.in 9
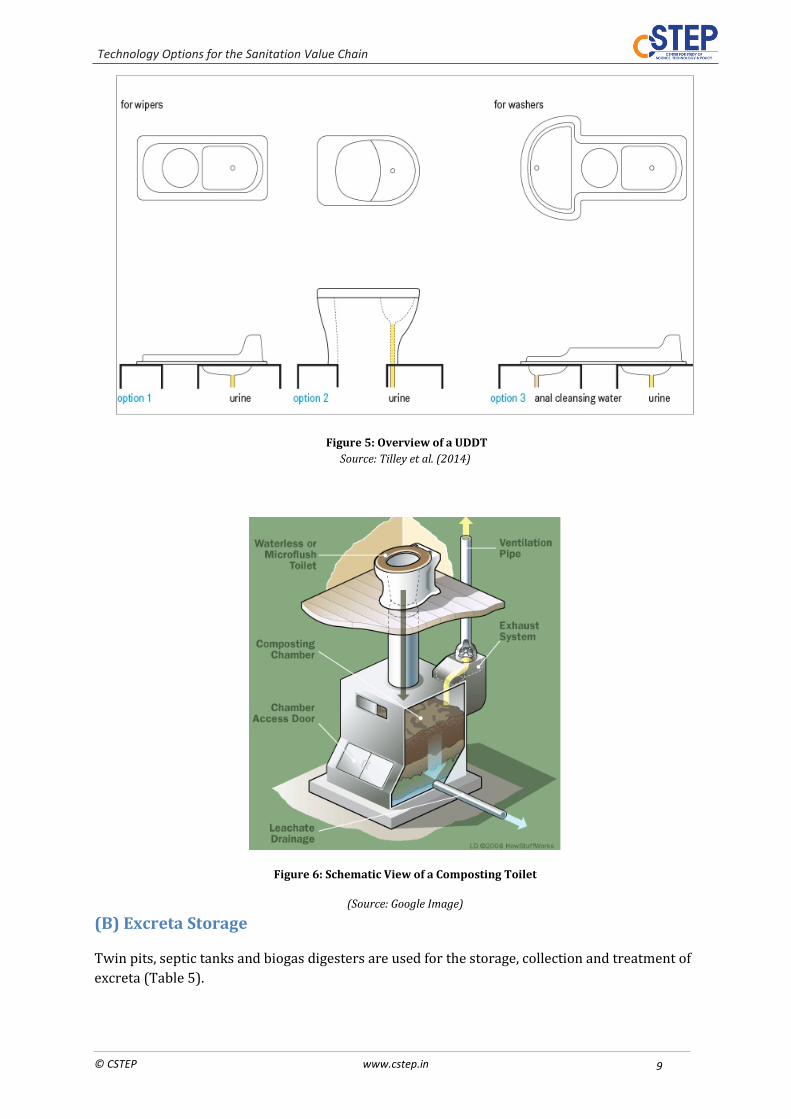
Figure 5: Overview of a UDDT
Source: Tilley et al. (2014)
Figure 6: Schematic View of a Composting Toilet
(Source: Google Image)
(B) Excreta Storage
Twin pits, septic tanks and biogas digesters are used for the storage, collection and treatment of
excreta (Table 5).

Technology Options for the Sanitation Value Chain
www.cstep.in © CSTEP 10
Table 5: General Descriptions of Storage Options for Excreta
Treatment option
Advantages Disadvantages
Twin Pit8 1. Locally available materials can be used for building and repairing.
2. Easy to maintain and de-sludge. 3. Sludge from twin pits can be
reused. 4. Low CAPEX and OPEX. 5. Reduction of pathogens in case of
full digestion.
1. Needs greater space for construction in comparison with a single-pit system.
2. If water supply for flushing is low, the toilet/pipe can get clogged.
3. If the sludge is not digested fully, further action is required.
4. Groundwater contamination risk. 5. No black water treatment.
Conventional Septic Tank9
1. It can be built and repaired with locally available materials.
2. If used properly, flies or odours are not an issue.
3. Simple and robust technology. 4. Energy is not required. 5. Low operating cost. 6. Small land is used for
construction. 7. The septic tank lifetime is 50
years.
1. Low reduction of organic matter. 2. Regular de-sludging must be ensured. 3. Not conducive for areas with a high
water table and flood-prone areas. 4. Manual emptying of septic tank is
hazardous and an inhumane task, whereas mechanical emptying (vacuum trucks) requires sophisticated instruments.
5. Further treatment and/or appropriate discharge of effluent is required.
Improved Septic Tank10
1. Energy is not required 2. Long service life 3. Higher reduction of organic
matter as compared with a CST 4. Moderate capital and low
maintenance costs ensure high acceptance among users.
1. Sludge and effluent require further treatment before discharge.
2. Low reduction of pathogens. 3. High space required compared with a
CST.
Biogas Digester11
1. It can be built with locally available materials.
2. Energy is not required. 3. Renewable energy and fertiliser
production. 4. It can be used for the treatment
of human waste, animal waste and solid waste.
5. Moderate capital cost, and low operating and maintenance costs.
6. Long service life. 7. Reduces the use of wood burning
for cooking fuel.
1. Expert design required along with skilled labour for construction.
2. Slurry and sludge require further treatment.
3. Long start-up time.
8 A twin pit is basically two pits that store the excreta (faecal matter) (Figure 7). It provides a long period for the digestion of faecal matter. The cost estimated for the construction/installation of a twin-pit system is US$50– US$75 for a single household with five persons. 9 A septic tank (a settling and decomposition chamber) is made of concrete, fibreglass, polyvinyl chloride (PVC) or plastic. It is a water-tight chamber (Figure 8) [38] [39]. The removal efficiencies of a septic tank are as follows: BOD, 30–50%; TSS, 40–%; Escherichia coli , 1 log unit [39]. 10 The basic difference between an improved septic tank (IST) and a CST is that removal efficiency is higher in an IST. This is the disadvantage of a CST (Figure 9). The cost of an IST with a soak pit ranges from US$750 to US$1,250 for a household size of five persons. 11 Biogas technology is basically used for the digestion of organic matter in the presence of anaerobic bacteria (Figure 10). The removal efficiency of BOD is 40–60%, whereas removal of suspended solids is 50–70% [39]. The cost of a biogas digester ranges from US$500 to US$1,000 for a household size of five persons [39].

Technology Options for the Sanitation Value Chain
© CSTEP www.cstep.in 11
Figure 7: A Pour Flush Toilet Linked to a Twin-Pit System
Source: Eveleigh (2002)
Figure 8: Overview Scheme of a Septic Tank
Source: Tilley et al. (2014)
Figure 9: Overview Scheme of an IST (Two Compartments) with a Soak Pit
(Source: Google Image)

Technology Options for the Sanitation Value Chain
www.cstep.in © CSTEP 12
Figure 10: Overview of a Basic Biogas Digester
Source: Kangmin and Ho (2006)
Decision matrix for Storage/Collection/Treatment
Based on the technological options, a decision matrix was prepared with respect to land
availability, energy requirement, skill requirement, CAPEX, OPEX, groundwater depth and
discharge standard (Table 6). The matrix ascertains the favourability of a technology in comparison
with those of other identified technologies. The green symbol denotes low favourability, yellow
shows moderate favourability and red shows high favourability with respect to the constraints.
(For example, if the user chooses the biogas digester option for storage, then the land requirement
would be higher than those of the twin pit and conventional septic tank.)
Table 6: Decision-Making Matrix for On-Site Collection/Storage/Treatment
Constraint Legend TP IST ST BD
Land Requirement
Low
Medium
High
Ground Water Level Shallow
Deep
Require Specific Soil Type Yes
No TP, Twin Pit; IST, Improved Septic Tank; ST, Septic Tank; BD, Biogas Digester.
(C) Options for Removal and Transport of Faecal Sludge and Septage
Manual and mechanised techniques like hand tools, vacuum trucks, pumping systems or
mechanical augers can be applied for the removal of FS. Before collection and transportation of FS,

Technology Options for the Sanitation Value Chain
© CSTEP www.cstep.in 13
it is necessary to understand its properties. These properties are primarily influenced by water
content, sludge age, presence of non-biodegradable material and organic material.
Generally in developing countries, the service providers use the manual collection method. Four
most common types of manually operated mechanical pumping equipment, i.e., the sludge gulper,
the diaphragm pump, the nibbler and the manual pit emptying technology, have been developed
and trialled. Fully mechanised technologies such as motorised diaphragm pumps, trash pumps and
some types of vehicle-mounted vacuum equipment are powered by electricity, fuel or pneumatic
systems.
Table 7 summarises the main aspects of the manually operated mechanical equipment and
mechanical sludge-emptying equipment
Table 7: Comparison of Manually Operated and Mechanical Sludge-Emptying Equipment
Equipment
Type Performance
CAPEX
(INR/Piece)
OPEX*(INR/
Month) Challenges
Gulper
Emptying rate: 25–30 l/min
Operation depth: 1–3 m
Maximum pumping head is dependent on design
15,000–20,000 200–300
Difficulty in accessing toilets with a small superstructure; clogging at high non-biodegradable material content; PVC riser pipe prone to cracking; splashing of sludge between the spout of the pump and the receiving container
Manual diaphragm
pump
Maximum flow rate, 100 l/min
Maximum pumping head, 3.5 m–4.5 m
Flow range from 0 LPH up to 1,150 LPH for different models
Pressure: maximum 4 kg/sq.cm
15,000 200
Clogging at high non-biodegradable content; difficult to seal fittings at the pump inlet, resulting in entrainment of air; pumps and spare parts currently not locally available
Nibbler May be suitable for pumping higher-viscosity sludge
- -
May be unsuitable for dry sludge with high non-biodegradable material content
MAPET
Emptying rate: o 20 l/min o 100
l/min Operation
depth: >3 m
For varying emptying rate 20,000 2,00,000
200
Requires strong institutional support for MAPET service providers; reliance on the importation of a key spare part; MAPET service providers unable to recover maintenance and transport costs from emptying fees
Motorised diaphragm
Max flow rate: 270 lpm
18,000–30,000 500–1,000 Blockade due to non-biodegradable waste in the

Technology Options for the Sanitation Value Chain
www.cstep.in © CSTEP 14
Equipment
Type Performance
CAPEX
(INR/Piece)
OPEX*(INR/
Month) Challenges
pump (72 gpm) Inlet: 38.10
(1½ " BSP) Discharge:
38.10 (1½ " BSP)
Suction lift: Dry: 4.57 mm
(15'), wet: 7.62 mm (25')
sludge; spare parts not available locally
Trash pump
Operating depth = 5–7 meters
Weight = 12 kg Size = L, 170 mm; W, 220 mm; H, 400 mm
Discharge = 14,000 litres/hour
Type of energy = fuel/electricity
10,000–20,000 500
Difficult to find spare parts; Requires a containment system; Potential for clogging
Pit screw auger
Emptying rate: o <20
l/min; o 25–50
l/min; o 50–125
l/min
For varying emptying rate:
o 20,000
o 45,000
o 1,20,000
500
Fixed length of auger and riser pipe; Unsuitable for use with dry sludge and large quantities of non-biodegradable waste; Difficult to clean after use; Difficult to manoeuver due to weight and size
Gobbler
Blocks easily due to sludge build-up in the working parts
Pumping head of at least 3 m
Difficulty emptying from variable depths
Operation depth: 2–3 m
40,000 500 Weight of the pump; Length not adjustable
Note: Gulper can be only used for de-sludging pits and not for septic tanks, and if the volume increases, it becomes a tedious task. Also, it can be used only in places where FS is watery in nature and not for dry FS. *OPEX only includes the general cost for oiling, applying grease and fixing of screws.
Transport of Faecal Sludge
Low-cost transport equipment is used for the transportation of FS from the generation point to the
treatment point. This equipment can be categorised into two main forms: (1) manually propelled
by human or animal power, and (2) motor-propelled using a fuel-powered engine.

Technology Options for the Sanitation Value Chain
© CSTEP www.cstep.in 15
(a) Manual Transport
Manual transport equipment is low-cost and generally has a small load capacity, a limited and low
travel range, and low speed. Standard carts and customised carts are designed specifically for the
transport of FS in many low-income countries, an example of which is shown in Figure 11. Although
designs vary widely, standardised carts typically consist of a load-bed mounted on a single axle
with one or more wheels. Containers of sludge with capacities of up to 200 L can be carried on or in
a manually pulled or pushed cart [43] [44] [45]. Generally in developing countries, a small truck or
a big truck is used for the transport of FS, and a small bore is used for the transport of waste water.
A cost comparison for conveyance is summarised in Table 8.
Table 8: Summary of Cost for Transport of FS
Conveyance CAPEX (INR) OPEX
Small truck 10,00,000–12,00,000
5,38,000 Big truck 15,00,000–20,00,000
Small bore Not available Not available
*OPEX: 5,38,000 is a sum of the following:
Fuel Cost (@ INR 1,50,000 per vehicle); Driver (@ INR 15,000 per month); Operator (@ INR 9,000 per
month); Helper (@INR 5,000 per month) and Maintenance of Vacutug (every three months or after every
10,000 km, whichever is earlier) (@ INR 10,000 per servicing per vehicle)
*Assumptions made:
Maximum distance travelled by a de-sludging vehicle per trip is 20 km.
Mileage of the vehicle is 7 km per litre.
Fuel price is INR 68 per litre.
Vehicle makes three trips per day.
Vehicle works for 250 days a year.
Constraints:
A combination of all vehicles should be used for a city-specific scenario, as the lanes in a city are of three types:
Low accessibility: lanes with width less than 2 meters
Medium accessibility: lanes with width between 2 and 3 meters
High accessibility: lanes with width more than 3 meters
(b) Motorised Transport
Motorised transport equipment generally has a high load capacity, high speed and longer distance.
Motorised transport equipment lead to reduced travel times and a greater range as compared with
manual transport. The operation and maintenance of motorised transport is generally more
complex than that of manual transport; however, many variations are widely used in low-income
countries. Before selecting the type of transport system, it is important to verify that the knowledge
and skills to carry out repairs are locally available. Motorised tricycles are the smallest type of low-
cost motorised transport used to move FS. They vary in size and power, and are able to access
narrower streets than larger motorised vehicles. Some models are capable of carrying loads of up to
1,000 kg. Sludge can be transported either in drums on the load bed of a tricycle [41] or in a tank
fitted to the back (Figure 12). More expensive motorised transport equipment has also been used
for the collection of FS. Examples include pickup trucks with load capacities ranging from 2,000 to
5,000 kg, but these are not always affordable for small-scale service providers [46] [47]; trucks can
sometimes be fitted with additional options such as cranes with hook lifts [41]

Technology Options for the Sanitation Value Chain
www.cstep.in © CSTEP 16
Figure 11: Schematic of a Human-Powered FSM Transport Technology
Sources: Strande et al. (2014)
Figure 12: Automated FS-Receiving Station at Manila, Philippines Sources: Strande et al. (2014)
Decision Matrix for Emptying and Conveyance
A decision matrix was prepared with respect to CAPEX and vehicular accessibility (Table 9).
Table 9: Decision Matrix for Emptying and Conveyance
Constraint Legend G + T MAP+T
MAPET +
T MDP+T TP+T MPSA+T Gr+T SB LP
CAPEX
Low
Medium
High
Vehicular
accessibility
Yes
No
G+T, Gulper + Trucks; MDP+T, Manual Diaphragm Pump +Trucks; MAPET+T, Manual Pit Emptying Technology + Trucks;
MDP+T, Motorised Diaphragm Pump + Trucks; TP+T, Trash Pump + Trucks; MPSA+T, Motorised Pit Screw Auger +
Trucks; Gr +T, Gobbler + Trucks; SB, Small Bore; LP, Large Pipes.
Technology Options for the Sanitation Value Chain
© CSTEP www.cstep.in 17
(D) Treatment Technologies for Effluent and Sludge
Treatment describes the treatment technologies that are generally appropriate for any spatial area
(city, ward, block, etc.). Each technology has different fields of application. Before treatment of
FS(which is discharged by collection and transport trucks), a preliminary screening is needed for
most treatment technologies because of the presence of high content of coarse waste such as
plastic, tissue and paper. Also, the characteristics of FS collected at industrial and commercial
facilities should be checked as they can be contaminated with metals; have high concentrations of
fats, oil and grease; or have other concerns. The treatment part is divided into four steps: (1)
primary treatment (separation of solids and liquids), (2) treatment of solid part/sludge (solid
which is generated from the primary treatment) (3) treatment of liquid part/ effluent (liquid which
is generated from the primary treatment) and (4) treatment of post-effluent (final treatment of the
liquid part). After treatment, three types of end products will be produced, i.e., screenings, treated
sludge and liquid effluents.
Step 1: Technology for Primary Treatment (solid–liquid separation)
The technologies used for primary treatment are unplanted drying bed (UDB), planted drying bed
(PDB), anaerobic digester (AD), centrifugation, settling-and-thickening tank (S&T), Imhoff tank (IT),
anaerobic baffled reactor (ABR), belt filter press (BFP) and geobags. General descriptions of the
technologies used for primary treatment are presented in Table 10 while schematic overview of
technologies is presented in Figure 13 to Figure 20.
After primary treatment, the sludge is removed from the bed manually or mechanically, and is used
as manure by co-composting. Sludge cannot be used directly as an end product due to the presence
of pathogens, and so Step 4 is needed for the final treatment of sludge.

Technology Options for the Sanitation Value Chain
18 www.cstep.in © CSTEP
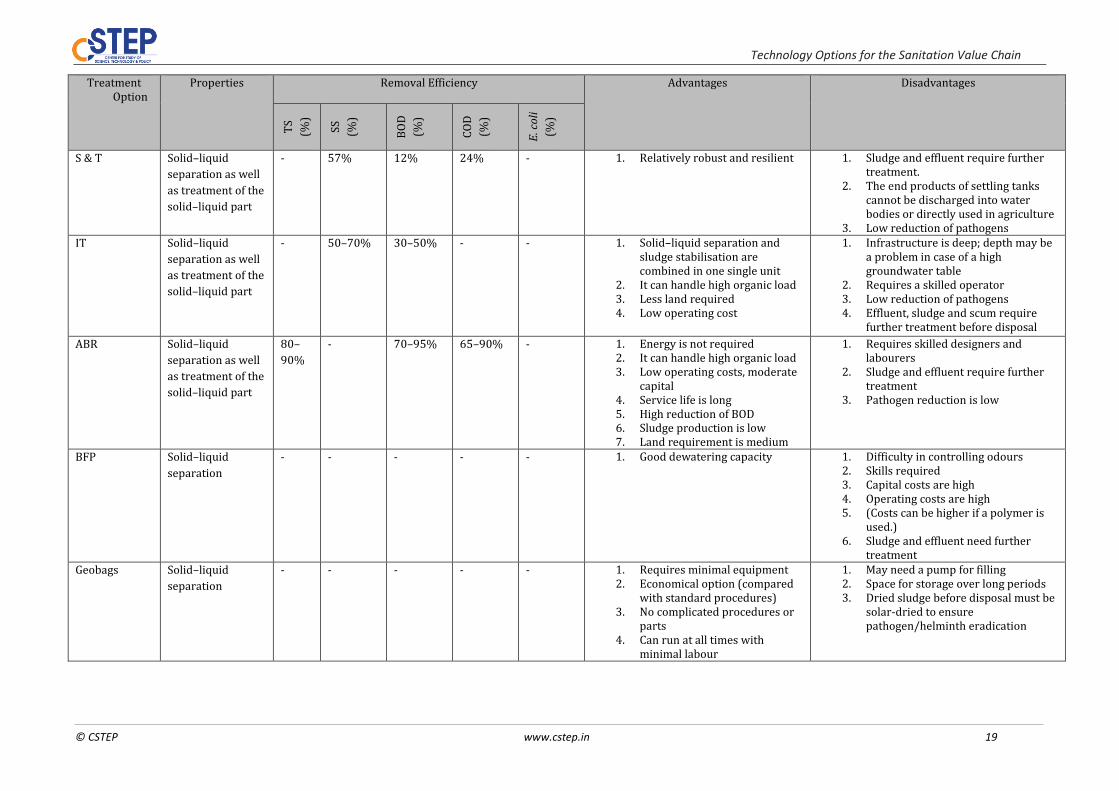
Table 10: General Descriptions of Primary Treatments
Treatment Option
Properties Removal Efficiency Advantages Disadvantages
TS
(%)
SS
(%)
BO
D
(%)
CO
D
(%)
E.
coli
(%)
UDB Solid–liquid
separation as well
as treatment of the
solid–liquid part
- - - - - 1. Ease of operation and low cost 2. Good dewatering efficiency,
especially in dry and hot climates
3. Skill and Energy is not required.
1. High land requirement 2. Odours and flies are normally
noticeable 3. Limited reduction of pathogens 4. Liquid part requires further
treatment.
PDB Solid–liquid
separation as well
as treatment of the
solid–liquid part
70–
80%
96–99% - 95–98 % - 1. It can handle high loading 2. Sludge treatment is better than
that in unplanted drying beds 3. Easy to operate 4. Low CAPEX and OPEX 5. Energy is not required 6. Plants and fruits can be grown
in PDBs.
1. High land requirement 2. Odours and flies may be noticeable 3. Liquid part requires further
treatment 4. Only applicable during dry seasons,
or needs a roof and contour bund.
AD/UASB
reactor
Solid–liquid
separation as well
as treatment of the
solid–liquid part
60–
85%
- 60–90% 60–80%; - 1. High reduction of BOD 2. It can handle high organic and
hydraulic loading rates 3. Low sludge production 4. Biogas can be used for energy
4. Requires skilled personnel; difficult to maintain
5. Needs consistent quantity and quality of input sludge for good performance
6. Usually UASB is used in the co-treatment of waste water and sludge
7. Start-up time is long 8. A constant source of electricity is
required to operate the UASB reactor 9. High O&M cost and complexity 10. All components of a UASB reactor are
not easily available 11. Sludge removed from a UASB reactor
may need thickening before disposal Centrifugation Solid–liquid
separation
- - - - - 1. It is an enclosed system 2. It controls odour and moisture 3. Land availability is not a
constraint
1. It requires high electricity for operation
2. The centrifugation machine is expensive and internal parts are subject to abrasive wear
Technology Options for the Sanitation Value Chain
© CSTEP www.cstep.in 19
Treatment Option
Properties Removal Efficiency Advantages Disadvantages
TS
(%)
SS
(%)
BO
D
(%)
CO
D
(%)
E. c
oli
(%)
S & T Solid–liquid
separation as well
as treatment of the
solid–liquid part
- 57% 12% 24% - 1. Relatively robust and resilient
1. Sludge and effluent require further treatment.
2. The end products of settling tanks cannot be discharged into water bodies or directly used in agriculture
3. Low reduction of pathogens IT Solid–liquid
separation as well
as treatment of the
solid–liquid part
- 50–70% 30–50% - - 1. Solid–liquid separation and sludge stabilisation are combined in one single unit
2. It can handle high organic load 3. Less land required 4. Low operating cost
1. Infrastructure is deep; depth may be a problem in case of a high groundwater table
2. Requires a skilled operator 3. Low reduction of pathogens 4. Effluent, sludge and scum require
further treatment before disposal
ABR Solid–liquid
separation as well
as treatment of the
solid–liquid part
80–
90%
- 70–95% 65–90% - 1. Energy is not required 2. It can handle high organic load 3. Low operating costs, moderate
capital 4. Service life is long 5. High reduction of BOD 6. Sludge production is low 7. Land requirement is medium
1. Requires skilled designers and labourers
2. Sludge and effluent require further treatment
3. Pathogen reduction is low
BFP Solid–liquid
separation
- - - - - 1. Good dewatering capacity
1. Difficulty in controlling odours 2. Skills required 3. Capital costs are high 4. Operating costs are high 5. (Costs can be higher if a polymer is
used.) 6. Sludge and effluent need further
treatment Geobags Solid–liquid
separation
- - - - - 1. Requires minimal equipment 2. Economical option (compared
with standard procedures) 3. No complicated procedures or
parts 4. Can run at all times with
minimal labour
1. May need a pump for filling 2. Space for storage over long periods 3. Dried sludge before disposal must be
solar-dried to ensure pathogen/helminth eradication

Technology Options for the Sanitation Value Chain
www.cstep.in © CSTEP 20
Figure 13: Schematic View of Unplanted Sludge Drying Bed
(Source: Tilley et al. 2014)
Figure 14: Schematic View of Planted Sludge Drying Bed
(Source: Tilley et al. 2014)
Figure 15: Schematic View of Anaerobic Digester
(Source: HTI Tanks, LLC)
Technology Options for the Sanitation Value Chain
© CSTEP www.cstep.in 21 21
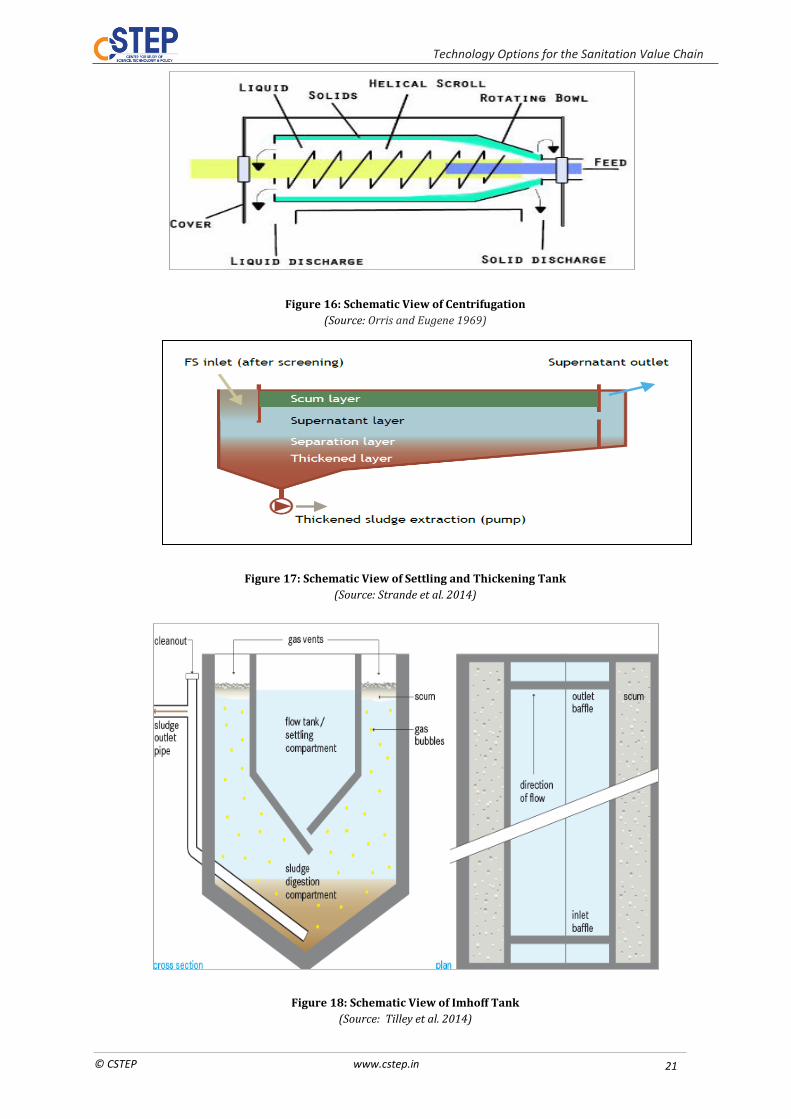
Figure 16: Schematic View of Centrifugation
(Source: Orris and Eugene 1969)
Figure 17: Schematic View of Settling and Thickening Tank
(Source: Strande et al. 2014)
Figure 18: Schematic View of Imhoff Tank
(Source: Tilley et al. 2014)

Technology Options for the Sanitation Value Chain
www.cstep.in © CSTEP 22
Figure 19: Schematic View of Anaerobic Baffled Reactor
(Source: Tilley et al. 2014)
Figure 20: Schematic View of Geobags in Malaysia
Decision Matrix for Primary Treatment
Table 11 summarises the favourability of the different primary treatment technologies, with
respect to different resource requirements and discharge standards.

Technology Options for the Sanitation Value Chain
© CSTEP www.cstep.in 23 23
Table 11: Decision-Making Matrix for Primary Treatment of Sludge
Step 2: Technology for Effluent Treatment (liquid part treatment)
A liquid part would be produced after primary treatment. This is a partially treated liquid, which
needs further treatment before disposal. The technologies used for effluent (liquid) treatment are
waste stabilisation ponds (WSPs), activated sludge process (ASP), sequence batch reactor (SBR),
membrane bioreactors (MBRs), anaerobic filter (AF), anaerobic baffled rector (ABR) and
constructed wetland (CW). This liquid part is filtered from the first step of solid–liquid separation.
General descriptions of the technologies used for effluent treatment are presented in Table 12
while schematic overview of technologies is presented in Figure 21 to Figure 26.
Constraint Legend UDB PDB AD Centrifugation S&T IT ABR BFP Geobag
Land Requirement
low
medium
high
Energy Requirement
low
medium
high
Ground Water Level (Shallow/Deep)
shallow
deep
CAPEX
low
medium
high
OPEX
low
medium
high
Skill
low
medium
high
Discharge standard
low
medium
high UDB, Unplanted Drying Bed; PDB/RB, Planted Drying Bed/Reed Bed; AD, Anaerobic Digester; S&T, Settling &
Thickening tank, IT, Imhoff Tank; ABR, Anaerobic Baffled Reactor; BFP, Belt Filter Press.

Technology Options for the Sanitation Value Chain
24 www.cstep.in © CSTEP
Table 12: General Descriptions of Effluent Treatments
Treatment Option
Properties Removal Efficiency Advantages Disadvantages
TS
(%)
SS
(%)
BO
D
(%)
CO
D
(%)
E.
coli
(%)
WSP A WSP can be applied at the community level/cluster level/ward and city levels
75–80%
- 75–85% 74–78% 60–99.9%
1. High reduction of BOD, suspended solids and pathogens
2. High removal of nutrients when it is combined with aquaculture
3. Energy is not required except for pumping
4. No real problems with odours and flies if designed and maintained correctly
5. Low OPEX (drying bed would need manual removal of dried sludge cake. Once in 10 years, the pond would have to be de-sludged and the sludge disposed. This could mean a significant cost)
1. Requires a large land area 2. High capital costs
depending on the price of land
3. Requires skilled personnel
ASP The ASP can be applied at the community level/cluster level/ward and city levels
- 75–80%
85–92% 93–94% 60–90% 1. Efficient removal of BOD and pathogens (more than 90%)
2. High nutrient removal possible 3. High quality of effluent
produced 4. Less land is required compared
with an extensive natural system (e.g., waste stabilisation ponds, constructed wetland, unplanted/planted drying bed, etc.)
5. This machine can be modified to meet specific discharge limits
1. High CAPEX and OPEX 2. Constant energy supply is
required; high energy consumption
3. Prone to complicated chemical and microbiological problems
4. Requires skilled personnel
SBR An SBR can be applied at the community level/cluster level/ward and city levels
- 95%.
95% 90% - 1. Requirement of land is low 2. Effluent quality is high 3. It can handle high organic load 4. SBR can be modified to meet
specific discharge limits
1. High CAPEX and OPEX 2. Constant energy supply is
required; high energy consumption
Technology Options for the Sanitation Value Chain
© CSTEP www.cstep.in 25
Treatment Option
Properties Removal Efficiency Advantages Disadvantages
TS
(%)
SS
(%)
BO
D
(%)
CO
D
(%)
E.
coli
(%)
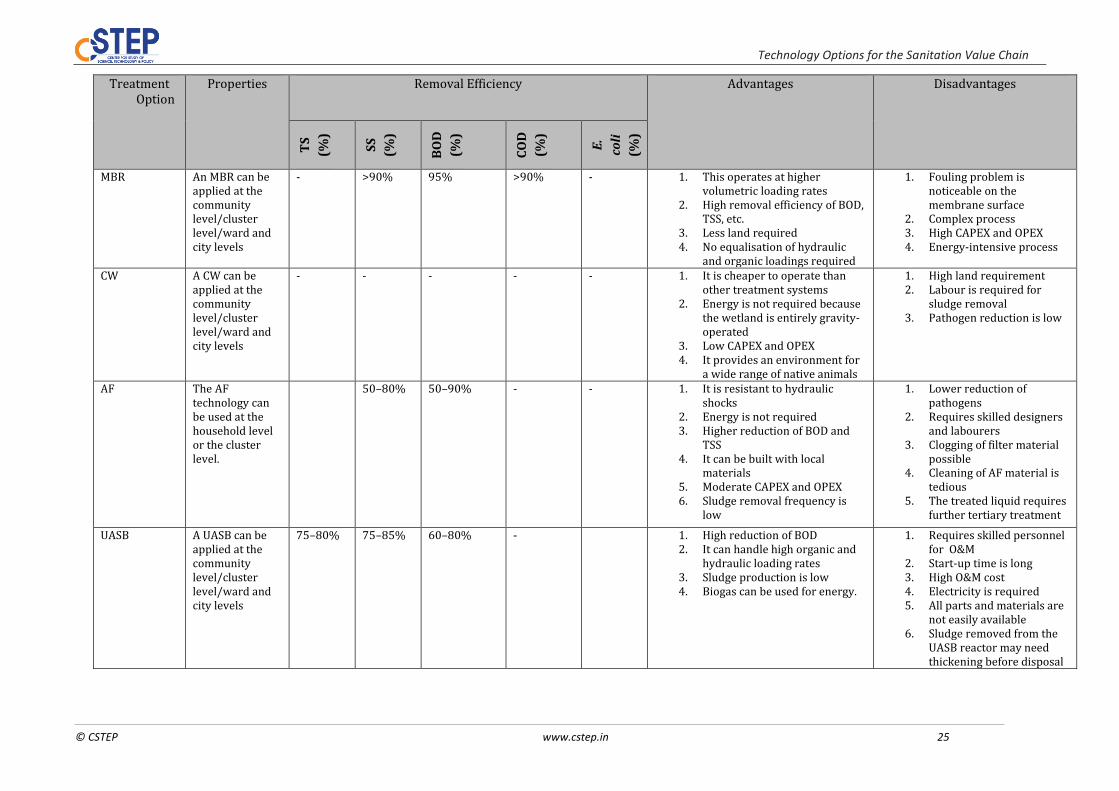
MBR An MBR can be applied at the community level/cluster level/ward and city levels
- >90% 95% >90% - 1. This operates at higher volumetric loading rates
2. High removal efficiency of BOD, TSS, etc.
3. Less land required 4. No equalisation of hydraulic
and organic loadings required
1. Fouling problem is noticeable on the membrane surface
2. Complex process 3. High CAPEX and OPEX 4. Energy-intensive process
CW A CW can be
applied at the community level/cluster level/ward and city levels
- - - - - 1. It is cheaper to operate than other treatment systems
2. Energy is not required because the wetland is entirely gravity-operated
3. Low CAPEX and OPEX 4. It provides an environment for
a wide range of native animals
1. High land requirement 2. Labour is required for
sludge removal 3. Pathogen reduction is low
AF The AF technology can be used at the household level or the cluster level.
50–80%
50–90% - - 1. It is resistant to hydraulic shocks
2. Energy is not required 3. Higher reduction of BOD and
TSS 4. It can be built with local
materials 5. Moderate CAPEX and OPEX 6. Sludge removal frequency is
low
1. Lower reduction of pathogens
2. Requires skilled designers and labourers
3. Clogging of filter material possible
4. Cleaning of AF material is tedious
5. The treated liquid requires further tertiary treatment
UASB A UASB can be applied at the community level/cluster level/ward and city levels
75–80% 75–85% 60–80% - 1. High reduction of BOD 2. It can handle high organic and
hydraulic loading rates 3. Sludge production is low 4. Biogas can be used for energy.
1. Requires skilled personnel for O&M
2. Start-up time is long 3. High O&M cost 4. Electricity is required 5. All parts and materials are
not easily available 6. Sludge removed from the
UASB reactor may need thickening before disposal

Technology Options for the Sanitation Value Chain
26 www.cstep.in © CSTEP
Figure 21: Schematic View of Waste Stabilisation Pond
(Source: Tilley et al. 2014)
Figure 22: Schematic View of Activated Sludge Process
(Source: Tilley et al. 2014)
Figure 23: Schematic View of Constructed Wetland
(Sources: USEPA)
Technology Options for the Sanitation Value Chain
© CSTEP www.cstep.in 27 27
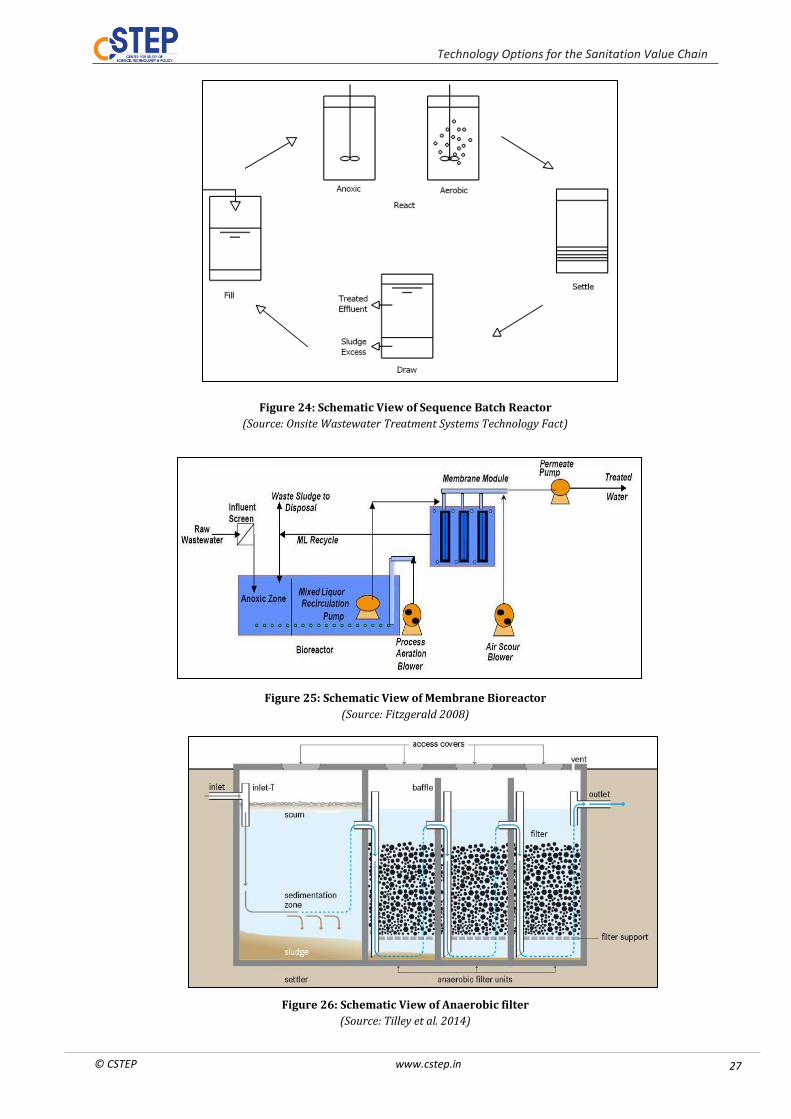
Figure 24: Schematic View of Sequence Batch Reactor
(Source: Onsite Wastewater Treatment Systems Technology Fact)
Figure 25: Schematic View of Membrane Bioreactor
(Source: Fitzgerald 2008)
Figure 26: Schematic View of Anaerobic filter
(Source: Tilley et al. 2014)

Technology Options for the Sanitation Value Chain
28 www.cstep.in © CSTEP
Decision Matrix for Effluent Treatment
Based on the technological options, a decision matrix was prepared with respect to land
availability, energy requirement, skill requirement, CAPEX, OPEX, groundwater depth and
discharge standard (Table 13). The matrix ascertains the favourability of a technology in
comparison with those of other identified technologies. Green colour symbolises low favourability,
yellow moderate favourability and red high favourability.
Table 13: Decision-Making Matrix for Effluent Treatment
Constraint Legend WSP ASP SBR MBR ABR+CW CW AF ASP+RB UASB ABR
Land requirement
Low
Medium
High
Energy
requirement
Low
Medium
High
Groundwater level
(shallow/deep)
Shallow
Deep
CAPEX
Low
Medium
High
OPEX
Low
Medium
High
Skill
Low
Medium
High
Discharge standard
Low
Medium
High

Technology Options for the Sanitation Value Chain
© CSTEP www.cstep.in 29 29
Step 3: Technology for Post-Effluent Treatment
The technologies used for post-effluent treatment are chlorination and ozonation (Table 14). Post-
Effluent Treatment stage is the final treatment of effluent/ liquid which is generated from effluent
treatment plant. Post-effluent treatment stage called as tertiary treatment.
Table 14: General Descriptions of Post-Effluent Treatments
Treatment Option
E. coli (Removal Efficiency) C
AP
EX
(R
s./M
LD
)
OP
EX
(R
s./M
LD
/yea
r)
Advantages Disadvantages
Ozonation >90% - - 1. It rapidly reacts with bacteria, viruses and protozoa over a wide pH range
2. Germicidal properties of ozonation are stronger than those of chlorination
3. For disinfection, chemicals are not added to water
4. This technology is efficient for removal of organics and inorganics
5. More than 90% removal of bacteria and viruses
6. It is cost-effective
1. Large amount of electricity is needed to produce ozone
2. Requires skilled personnel for design and construction
Chlorination 100% 3,00,000 2,000 1. It is a simple, inexpensive and reliable technique
2. kills bacteria and viruses up to 100%; good removal of microbes from treated water
3. Widely available in different countries
4. Cost-effective 5. Easy to handle
1. It cannot deactivate parasites like Giardia and cryptosporidium, and worm eggs
2. Chlorine availability may be restricted in rural and remote areas
3. High organic matter in treated water leads to the risk of toxic disinfection by chlorination through by-product formation
Technology Options for the Sanitation Value Chain
30 www.cstep.in © CSTEP
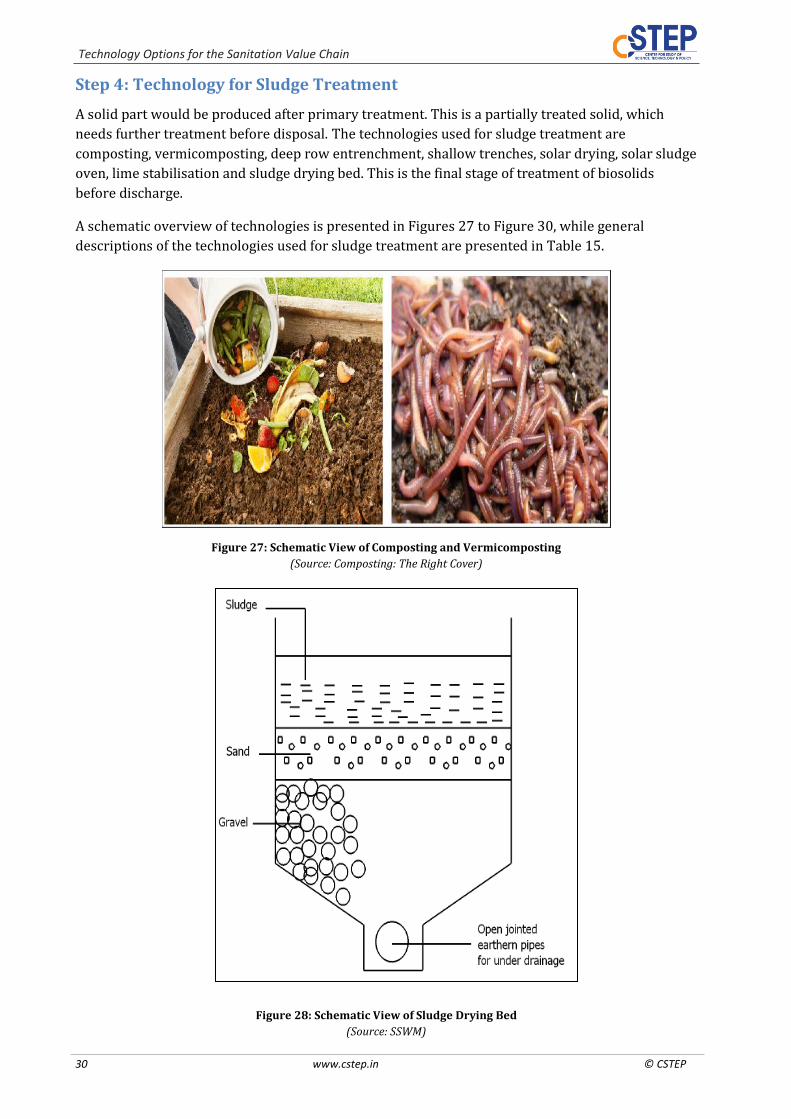
Step 4: Technology for Sludge Treatment
A solid part would be produced after primary treatment. This is a partially treated solid, which
needs further treatment before disposal. The technologies used for sludge treatment are
composting, vermicomposting, deep row entrenchment, shallow trenches, solar drying, solar sludge
oven, lime stabilisation and sludge drying bed. This is the final stage of treatment of biosolids
before discharge.
A schematic overview of technologies is presented in Figures 27 to Figure 30, while general
descriptions of the technologies used for sludge treatment are presented in Table 15.
Figure 27: Schematic View of Composting and Vermicomposting
(Source: Composting: The Right Cover)
Figure 28: Schematic View of Sludge Drying Bed
(Source: SSWM)

Technology Options for the Sanitation Value Chain
© CSTEP www.cstep.in 31 31
Figure 29: Schematic View of Planted Burying Pits or Trenches
(Source: Low Cost Systems for the Management of Sludge from Toilets and Shower Units)
Figure 30: Schematic View of Solar Sludge Oven
(Source: Low Cost Systems for the Management of Sludge from Toilets and Shower Units)

Technology Options for the Sanitation Value Chain
32 www.cstep.in © CSTEP
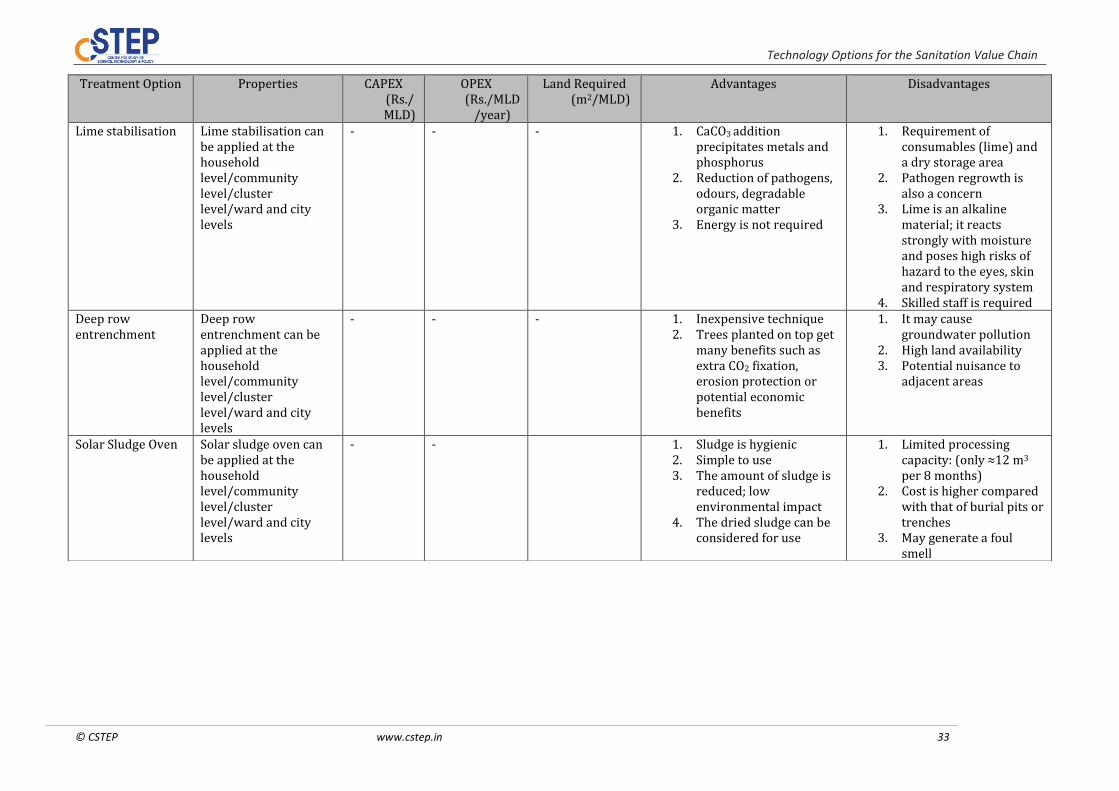
Table 15: General Descriptions of Sludge Treatment Technologies
Treatment Option Properties CAPEX (Rs./MLD)
OPEX (Rs./MLD
/year)
Land Required (m2/MLD)
Advantages Disadvantages
Co-composting Co-composting can be applied at the household level/community level/cluster level/ward and city levels
- - - 1. High pathogen reduction 2. Output of co-composting
is a good soil conditioner
1. Requires technical and managerial skills for operation of the co-composting plant and for generating a safe product with value
Vermicomposting Vermicomposting can be applied at the household level/community level/cluster level/ward and city levels
3,00,00,000 8,00,00,000 1,000 1. Pathogen inactivation is good
2. End product generated from vermicomposting is a good soil conditioner
1. Requires technical and managerial skills
2. Worms are liable to be affected by toxic components
3. (Cost is higher than co-composting
Sludge drying bed + Co-composting
Sludge drying bed can be applied at the community level/cluster level/ward and city levels
- - - 1. Easy to operate 2. Energy is not required 3. End product can be used
as a fertiliser 4. Water amount of sludge
is reduced
1. Requires stabilised sludge to reduce nuisance and odours
2. High land requirement 3. Blockage of sand bed
Solar Drying Solar drying can be applied at the community level/cluster level/ward and city levels
- - - 1. Low energy requirements
2. Low investment costs 3. High potential
dewatering efficiency
1. High space requirements
2. Skilled staff is required
Shallow Trenches Shallow trenches can be applied at the household level/ community level/cluster level/ward and city levels
- - - 1. Simple system 2. Helps in land
remediation 3. No nuisance; Flexibility:
no restriction on the amount or characteristic of sludge
1. Land area required is high
2. Pests/groundwater pollution
3. Needs regular groundwater monitoring
Technology Options for the Sanitation Value Chain
© CSTEP www.cstep.in 33
Treatment Option Properties CAPEX (Rs./MLD)
OPEX (Rs./MLD
/year)
Land Required (m2/MLD)
Advantages Disadvantages
Lime stabilisation
Lime stabilisation can be applied at the household level/community level/cluster level/ward and city levels
- - - 1. CaCO3 addition precipitates metals and phosphorus
2. Reduction of pathogens, odours, degradable organic matter
3. Energy is not required
1. Requirement of consumables (lime) and a dry storage area
2. Pathogen regrowth is also a concern
3. Lime is an alkaline material; it reacts strongly with moisture and poses high risks of hazard to the eyes, skin and respiratory system
4. Skilled staff is required Deep row entrenchment
Deep row entrenchment can be applied at the household level/community level/cluster level/ward and city levels
- - - 1. Inexpensive technique 2. Trees planted on top get
many benefits such as extra CO2 fixation, erosion protection or potential economic benefits
1. It may cause groundwater pollution
2. High land availability 3. Potential nuisance to
adjacent areas
Solar Sludge Oven Solar sludge oven can be applied at the household level/community level/cluster level/ward and city levels
- - 1. Sludge is hygienic 2. Simple to use 3. The amount of sludge is
reduced; low environmental impact
4. The dried sludge can be considered for use
1. Limited processing capacity: (only ≈12 m3 per 8 months)
2. Cost is higher compared with that of burial pits or trenches
3. May generate a foul smell

Technology Options for the Sanitation Value Chain
34 www.cstep.in © CSTEP
Decision Matrix for Sludge Treatment
Table 16 summarises the favourability of the different sludge treatment technologies, with respect
to different resource requirements and discharge standards. The matrix ascertains the favourability
of a technology in comparison with those of other identified technologies. Green colour symbolises
low favourability, yellow moderate favourability and red high favourability.
Table 16: Decision-Making Matrix for Sludge Treatment
Part D: Designed System for Faecal Sludge Management
Basically, there are three types of sanitation system in India, i.e., onsite12, decentralised13 and
networked14 are used for FS and wastewater management. In the present study total twelve
systems are designed for FSM at the household/cluster/community level.
12 Onsite technology refers to the treatment of waste at the point of generation either fully or partially, i.e., within the household premises. This technology is dependent on the periodic removal of faecal sludge from vaults, pits and tanks. 13 In the decentralised technology, the toilets are connected to tank for storage (e.g., septic tank); it requires a provision for transporting wastewater and sludge from the tank to the treatment facility. 14 A networked system also requires a provision for transporting wastewater from the toilet via a system of sewers to the treatment facility. Sewers consist of a network of buried pipes that carry wastewater from a house to the point of disposal. Sewers remove both excreta and sullage from the households, thereby negating the need for on-site servicing
Constraint Legend
Co
-Co
mp
ost
ing
Ver
mic
om
po
stin
g
Slu
dge
Dry
ing
Bed
+C
o-
Co
mp
ost
ing
Lim
e St
abil
izat
ion
Sola
r D
ryin
g
Shal
low
Tre
nch
es
Sola
r Sl
ud
ge O
ven
Dee
p R
ow
En
tren
chm
en
t
Land Requirement
Low
Medium
High
Energy Requirement
Low
Medium
High
Ground Water Level (Shallow/Deep)
Shallow
Deep
Capex
Low
Medium
High
Opex
Low
Medium
High
Skill
Low
Medium
High
Discharge Standard
Low
Medium
High

Technology Options for the Sanitation Value Chain
© CSTEP www.cstep.in 35 35
A brief description of each system is given below:
System 1: Twin-Pit System
Key Features of the Technology
It is not a complete system. It is a non-sewered system. There is no water treatment, reuse/recovery in a twin-pit system. FS after being given a
settling time can be used for land application. It should be used at the household level. In other cases, the volume of pit should be large. Time taken for installation: less than 1 month. System lifetime: porous pits have a lifetime of 10 years. Frequency of complete system cleaning/maintenance (years): three years is acceptable
under good conditions of low ground water and porous soil.
Land requirement: 5 m2/HH (household) land is required for the construction of the toilet and for
storage of products that are generated from the user interface.
Energy requirement: energy is not required for this treatment.
Environmental regulation: low, due to missing water treatment/recovery in a twin-pit system.
Health regulation: low, because of lower reduction of pathogens.
Figure 31: Twin-Pit System for FSM
System 2A: Septic Tank + UDB + WSP + Co-composting + Chlorination
Key Features of the Technology
It is a complete system. It is a non-sewered system. Septic tank could be designed for the household level, whereas the drying bed/WSP for the
community level. Time taken for the installation of this system is up to 6 months.
System lifetime (years): soak pit, 3–5 years; septic tank lifetime, 50 years. UDB/WSP: 50 years.
facilities. This technology is appropriate for urban areas with higher population density where water consumption is relatively high and soil permeability is low.
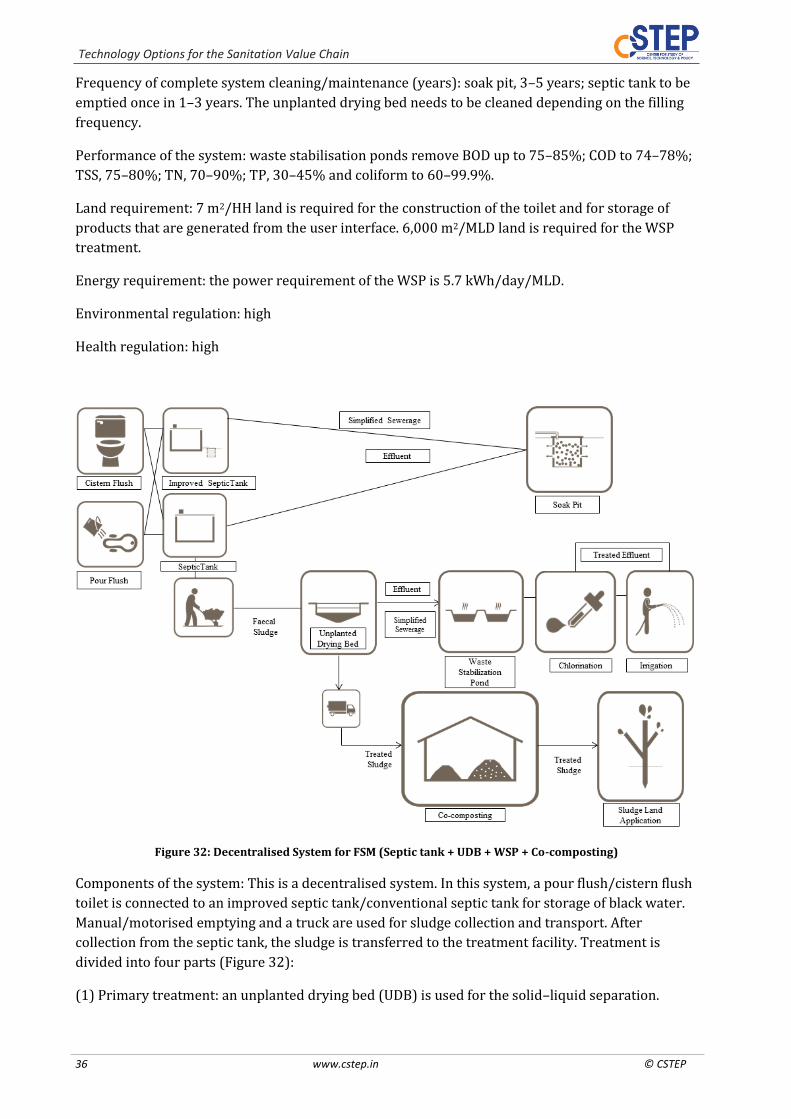
Technology Options for the Sanitation Value Chain
36 www.cstep.in © CSTEP
Frequency of complete system cleaning/maintenance (years): soak pit, 3–5 years; septic tank to be
emptied once in 1–3 years. The unplanted drying bed needs to be cleaned depending on the filling
frequency.
Performance of the system: waste stabilisation ponds remove BOD up to 75–85%; COD to 74–78%;
TSS, 75–80%; TN, 70–90%; TP, 30–45% and coliform to 60–99.9%.
Land requirement: 7 m2/HH land is required for the construction of the toilet and for storage of
products that are generated from the user interface. 6,000 m2/MLD land is required for the WSP
treatment.
Energy requirement: the power requirement of the WSP is 5.7 kWh/day/MLD.
Environmental regulation: high
Health regulation: high
Figure 32: Decentralised System for FSM (Septic tank + UDB + WSP + Co-composting)
Components of the system: This is a decentralised system. In this system, a pour flush/cistern flush
toilet is connected to an improved septic tank/conventional septic tank for storage of black water.
Manual/motorised emptying and a truck are used for sludge collection and transport. After
collection from the septic tank, the sludge is transferred to the treatment facility. Treatment is
divided into four parts (Figure 32):
(1) Primary treatment: an unplanted drying bed (UDB) is used for the solid–liquid separation.

Technology Options for the Sanitation Value Chain
© CSTEP www.cstep.in 37 37
(2) After the solid–liquid separation, the liquid part is transferred to an effluent treatment plant;
i.e., a waste stabilisation pond (WSP) is used for the effluent treatment.
(3) The treated liquid generated from the effluent treatment plant undergoes post-effluent
treatment for better quality; the chlorination technology is, hence, chosen for the final treatment of
the liquid.
(4) The solid part that is generated from the unplanted drying bed is transferred to the sludge
treatment plant for further treatment (i.e., co-composting technology for better quality of sludge).
System 2B: Septic Tank + AD + Co-composting + Chlorination
Key Features of the Technology
It is a complete system. It is a non-sewered system. Septic tank could be designed for the household level, whereas AD for the community level. Time taken for installation of this system is up to 1 year.
System lifetime (years): septic tank life time, 50 years; AD lifetime, 50 years if well designed and
constructed.
Frequency of complete system cleaning/maintenance (years): soak pit, 3–5 years; septic tank to be
emptied once in 1–3 years.
Performance of the system: anaerobic digester removes BOD up to 60–90%, COD to 60–80% and
TSS to 60–85%.
Land requirement: 7 m2/HH land is required for the construction of the toilet and for the storage of
products that are generated from the user interface. 600 m2/MLD land is required for the AD
treatment.
Energy requirement: the power requirement of the AD is 60 kWh/day/MLD.
Environmental regulation: high
Health regulation: high
Components of the system: This is a decentralised system. In this system, a pour flush/cistern flush
toilet is connected to an improved septic tank/conventional septic tank for storage of black water.
Manual/motorised emptying and a truck are used for sludge collection and transport. After
collection from the septic tank, the sludge is transferred to the treatment facility. Treatment is
divided into four parts (Figure 33):
(1) Primary treatment: an anaerobic digester (AD) is used for the solid–liquid separation as well as
treatment.
(2) After the solid–liquid separation, the liquid part is transferred to an effluent treatment plant;
i.e., constructed wetland (CW) is used for the effluent treatment.
(3) The treated liquid generated from the effluent treatment plant undergoes post-effluent
treatment for better quality; the chlorination technology is, hence, chosen for the final treatment of
the liquid.

Technology Options for the Sanitation Value Chain
38 www.cstep.in © CSTEP
(4) Solid part that is generated from the anaerobic digester (AD) is transferred to the sludge
treatment plant. The sludge treatment plant uses two components, i.e., centrifugation and co-
composting.
Figure 33: Decentralised System for FSM (AD + Co-composting + Chlorination)
System 2C: Septic Tank+ Centrifugation + ASP + Vermicomposting + Ozonation
Key Features of the Technology
It is a complete system. It is a non-sewered system. Septic tank could be designed for the household level, whereas the ASP for the community
level. The time taken for the installation of this system is up to 1 year.
System lifetime (years): septic tank lifetime, 50 years; ASP treatment plant lifetime, 50 years if well
designed and constructed.
Frequency of complete system cleaning/maintenance (years): Soak pit, 3–5 years; septic tank to be
emptied once in 1–3 years.
Performance of the system: ASP removes BOD up to 85–92%; COD to 93–94%, TSS to 75–80%, TN
to >90%, TP to >90% and coliform to 60–90%.
Land requirement: 7 m2/HH land is required for the construction of the toilet and for the storage of
products that are generated from the user interface. 900 m2/MLD land is required for the ASP
treatment.
Energy requirement: the power requirement of the ASP is 185.7 kWh/day/MLD.

Technology Options for the Sanitation Value Chain
© CSTEP www.cstep.in 39 39
Environmental regulation: high
Health regulation: high
Components of the system: This is a decentralised system. In this system, a pour flush/cistern flush
toilet is connected to an improved septic tank/conventional septic tank for storage of black water.
Manual/motorised emptying and a truck are used for sludge collection and transport. After
collection from the septic tank, the sludge is transferred to the treatment facility. Treatment is
divided into four parts (Figure 34):
Figure 34: Decentralised System for FSM (Centrifugation + ASP + Vermicomposting + Ozonation)
(1) Primary treatment: Centrifugation is used for solid–liquid separation.
(2) After the solid–liquid separation, the liquid part is transferred to an effluent treatment plant,
i.e., the activated sludge process (ASP) is used for the effluent treatment.
(3) The treated liquid generated from the effluent treatment plant undergoes post-effluent
treatment for better quality; the chlorination technology is, hence, chosen for the final treatment of
the liquid.
(4) The solid part that is generated from centrifugation is transferred to the sludge treatment plant.
The vermicomposting technology is chosen for better quality of sludge.
System 2D: Septic Tank + Centrifugation + SBR + Co-composting + Chlorination
Key Features of the Technology

Technology Options for the Sanitation Value Chain
40 www.cstep.in © CSTEP
It is a complete system. It is a non-sewered system. Septic tank could be designed for the household level, whereas the SBR for the community
level. Time taken for the installation of this system is up to 1 year.
System lifetime (years): septic tank lifetime, 50 years; SBR treatment plant lifetime, 50 years if well
designed and constructed.
Frequency of complete system cleaning/maintenance (years): soak pit, 3–5 years; septic tank to be
emptied once in 1–3 years.
Performance of the system: SBR removes BOD up to 95%, COD to 90%, TSS to 95% and TN to 70–
80%.
Land requirement: 7 m2/HH land is required for the construction of the toilet and for the storage of
products that are generated from the user interface. 450 m2/MLD land is required for the SBR
treatment.
Figure 35: Decentralised System for FSM (Centrifugation + SBR + Co-composting + Chlorination)
Energy requirement: the power requirement of the SBR is 153.7 kWh/day/MLD
Environmental regulation: high
Health regulation: high
Components of the system: This is a decentralised system. In this system, a pour flush/cistern flush
toilet is connected to an improved septic tank/conventional septic tank for storage of black water.
Manual/ motorised emptying and a truck are used for the sludge collection and transport. After

Technology Options for the Sanitation Value Chain
© CSTEP www.cstep.in 41 41
collection from the septic tank, the sludge is transferred to the treatment facility. Treatment is
divided into four parts (Figure 35):
(1) Primary treatment: Centrifugation is used for the solid–liquid separation.
(2) After solid liquid separation, the liquid part is transferred to the effluent treatment plant, i.e., a
sequential batch reactor (SBR) is used for the effluent treatment.
(3) The treated liquid generated from the effluent treatment plant undergoes post-effluent
treatment for better quality; the chlorination technology is, hence, chosen for the final treatment of
the liquid.
(4) The solid part that is generated from centrifugation is transferred to the sludge treatment plant.
Co-composting technology is chosen for better quality of sludge.
System 2E: Septic Tank + Centrifugation + MBR + Co-composting + Ozonation
Key Features of the Technology
It is a complete system. It is a non-sewered system. Septic tank could be designed for the household level, whereas the MBR for the community
level. Time taken for the installation of this system is up to 1 year.
System lifetime (years): septic tank lifetime, 50 years; MBR treatment plant lifetime, 50 years if well
designed and constructed.
Frequency of complete system cleaning/maintenance (years): soak pit, 3–5 years; septic tank to be
emptied once in 1–3 years.
Performance of the system: MBR removes BOD up to 95%, COD to >90%, TSS to >90%, TN to >90%
and TP to >90%.
Land requirement: 7 m2/HH land is required for the construction of the toilet and for the storage of
products that are generated from the user interface. 450 m2/MLD land is required for the MBR
treatment.
Energy requirement: the power requirement of the MBR is 302.5 kWh/day/MLD.
Environmental regulation: high
Health regulation: high
Components of the system: This is a decentralised system. In this system, a pour flush/cistern flush
toilet is connected to an improved septic tank/conventional septic tank for storage of black water.
Manual/ motorised emptying and a truck are used for sludge collection and transport. After
collection from the septic tank, the sludge is transferred to the treatment facility. Treatment is
divided into four parts (Figure 36):
(1) Primary treatment: Centrifugation is used for solid–liquid separation.
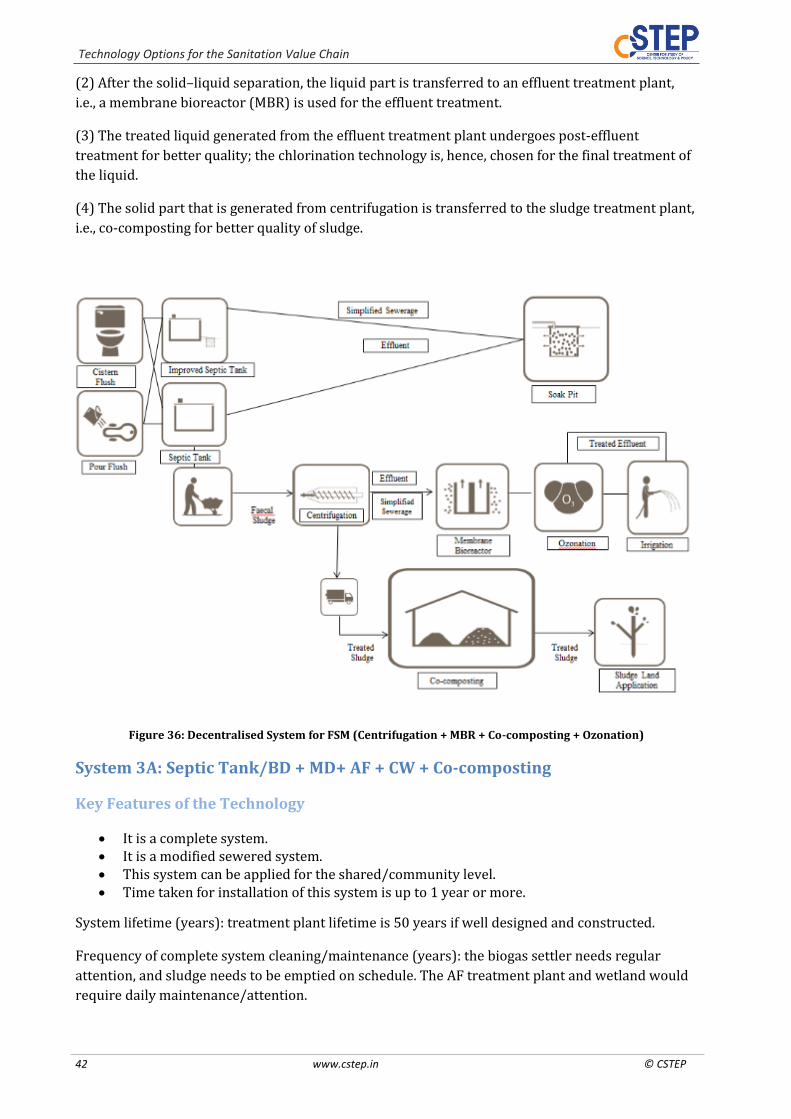
Technology Options for the Sanitation Value Chain
42 www.cstep.in © CSTEP
(2) After the solid–liquid separation, the liquid part is transferred to an effluent treatment plant,
i.e., a membrane bioreactor (MBR) is used for the effluent treatment.
(3) The treated liquid generated from the effluent treatment plant undergoes post-effluent
treatment for better quality; the chlorination technology is, hence, chosen for the final treatment of
the liquid.
(4) The solid part that is generated from centrifugation is transferred to the sludge treatment plant,
i.e., co-composting for better quality of sludge.
Figure 36: Decentralised System for FSM (Centrifugation + MBR + Co-composting + Ozonation)
System 3A: Septic Tank/BD + MD+ AF + CW + Co-composting
Key Features of the Technology
It is a complete system. It is a modified sewered system. This system can be applied for the shared/community level. Time taken for installation of this system is up to 1 year or more.
System lifetime (years): treatment plant lifetime is 50 years if well designed and constructed.
Frequency of complete system cleaning/maintenance (years): the biogas settler needs regular
attention, and sludge needs to be emptied on schedule. The AF treatment plant and wetland would
require daily maintenance/attention.
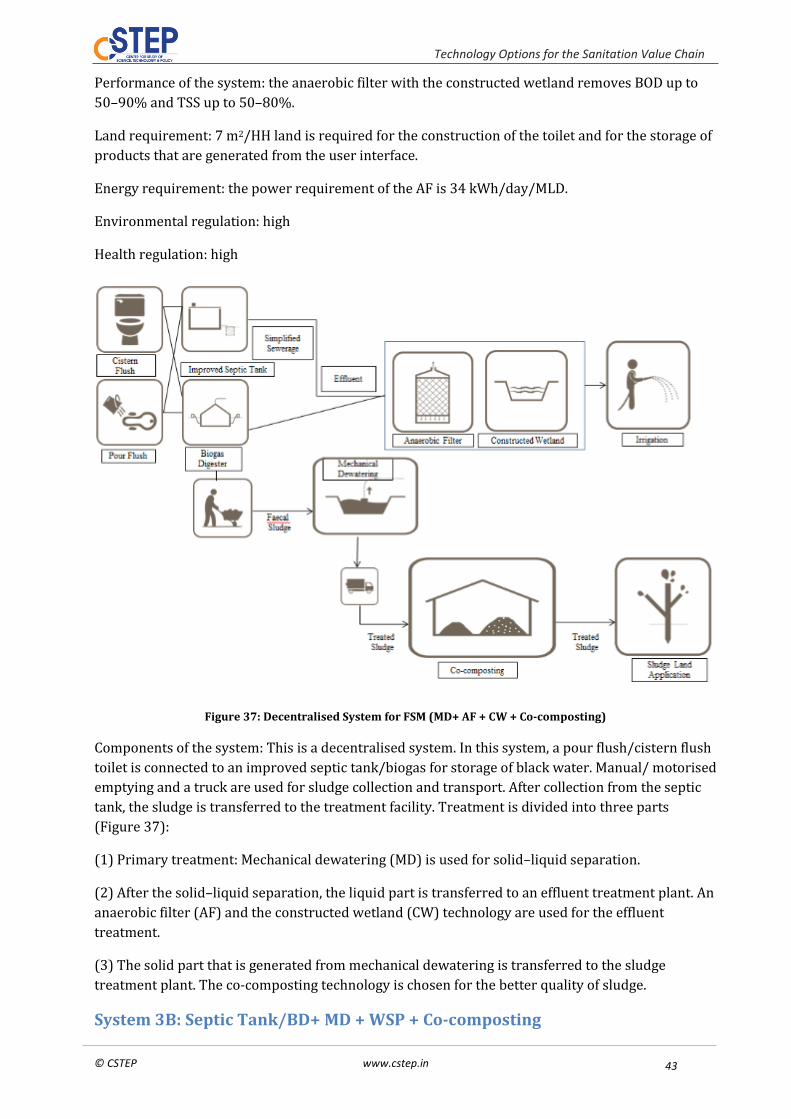
Technology Options for the Sanitation Value Chain
© CSTEP www.cstep.in 43 43
Performance of the system: the anaerobic filter with the constructed wetland removes BOD up to
50–90% and TSS up to 50–80%.
Land requirement: 7 m2/HH land is required for the construction of the toilet and for the storage of
products that are generated from the user interface.
Energy requirement: the power requirement of the AF is 34 kWh/day/MLD.
Environmental regulation: high
Health regulation: high
Figure 37: Decentralised System for FSM (MD+ AF + CW + Co-composting)
Components of the system: This is a decentralised system. In this system, a pour flush/cistern flush
toilet is connected to an improved septic tank/biogas for storage of black water. Manual/ motorised
emptying and a truck are used for sludge collection and transport. After collection from the septic
tank, the sludge is transferred to the treatment facility. Treatment is divided into three parts
(Figure 37):
(1) Primary treatment: Mechanical dewatering (MD) is used for solid–liquid separation.
(2) After the solid–liquid separation, the liquid part is transferred to an effluent treatment plant. An
anaerobic filter (AF) and the constructed wetland (CW) technology are used for the effluent
treatment.
(3) The solid part that is generated from mechanical dewatering is transferred to the sludge
treatment plant. The co-composting technology is chosen for the better quality of sludge.
System 3B: Septic Tank/BD+ MD + WSP + Co-composting

Technology Options for the Sanitation Value Chain
44 www.cstep.in © CSTEP
Key Features of the Technology
It is a complete system. It is a small-bore sewered system. This system can be used at the community level. Time taken for installation of this system is up to 1 year or more.
System lifetime (years): septic tank lifetime, 50 years; treatment plant lifetime, 50 years if well
designed and constructed.
Frequency of complete system cleaning/maintenance (years): septic tank to be emptied once in 2–3
years. The sludge drying bed is to be cleaned depending on the filling frequency. The WSP would
require daily maintenance/attention.
Performance of the system: the waste stabilisation pond removes BOD up to 75–85%, COD to 74–
78%, TSS to 75–80%, TN to 70–90%, TP to 30–45% and coliform to 60–99.9%.
Land requirement: 7 m2/HH land is required for the construction of the toilet and for the storage of
products that are generated from the user interface.
Energy requirement: the power requirement of this system is 5.7 kWh/day/MLD.
Environmental regulation: high
Health regulation: high
Figure 38: Decentralised System for FSM (MD + WSP + Co-composting)
Components of the system: This is a decentralised system. In this system, a pour flush/cistern flush
toilet is connected to an improved septic tank for storage of black water. Manual/ motorised
emptying and a truck are used for sludge collection and transport. After collection from the septic

Technology Options for the Sanitation Value Chain
© CSTEP www.cstep.in 45 45
tank, the sludge is transferred to the treatment facility. Treatment is divided into three parts
(Figure 38):
(1) Primary treatment: Mechanical dewatering (MD) is used for solid–liquid separation.
(2) After the solid–liquid separation, the liquid part is transferred to an effluent treatment plant.
The waste stabilisation pond (WSP) technology is used for the effluent treatment.
(3) The solid part that is generated from mechanical dewatering is transferred to the sludge
treatment plant. The co-composting technology is chosen for better quality of sludge.
System 4: ASP + Reed Bed + Sludge Drying Bed + Co-composting
Key Features of the Technology
It is a complete system. It is a sewered system. This system can be applied at the community/ward/city level. Time taken for the installation of this system is up to 1 year.
System lifetime (years): sewer lifetime, 50 years; treatment plant lifetime, 50 years if well designed
and constructed.
Frequency of complete system cleaning/maintenance (years): the sewer would require regular
maintenance. The treatment plant would require daily maintenance/attention.
Performance of the system: ASP +Reed Bed removes BOD up to 90–95%, COD to 85–90%, TSS to
>90%, TN to >60% and coliform to 90–99.9%.
Land requirement: 900 m2/MLD land is required for the ASP treatment.
Energy requirement: the power requirement of the ASP is 185.7 kWh/day/MLD.
Environmental regulation: high
Health regulation: high
Figure 39: Networked System for FSM (ASP + Reed Bed + Sludge Drying Bed + Co-composting)

Technology Options for the Sanitation Value Chain
46 www.cstep.in © CSTEP
Components of the system: This is a networked system. In this system, waste water is transported
from a cistern flush toilet via a system of sewers to the treatment facility. Treatment is divided into
three parts (Figure 39):
(1) Primary treatment: Activated sludge process (ASP) is used for solid–liquid separation as well as
treatment.
(2) Effluent treatment: After primary treatment, the liquid part is transferred to an effluent
treatment plant, i.e., reed bed (RB) for further treatment.
(3) Sludge treatment: The solid part that is generated from primary treatment is transferred to the
sludge treatment plant. The solar drying bed (SDB) + co-composting technology are chosen for
better quality of the sludge.
System 5: Septic Tank + IT + CW + Sludge Drying Bed + Co-composting
Key Features of the Technology
It is a complete system. It is a non-sewered system. Septic tank could be designed for the household level, whereas the sludge and effluent
treatment designed for the community level. Time taken for the installation of this system is 6 months to1 year for small systems.
System lifetime (years): septic tank lifetime, 50 years; drying bed/Imhoff tank lifetime, 50 years if
well designed and constructed.
Frequency of complete system cleaning/maintenance (years): septic tank to be emptied once in 2–3
years. The sludge-drying bed is to be cleaned depending on the filling frequency. The CW would
require daily maintenance/attention.
Figure 40: Decentralised System for FSM (IT + CW + Sludge Drying Bed + Co-composting)

Technology Options for the Sanitation Value Chain
© CSTEP www.cstep.in 47 47
Performance of the system: the Imhoff tank removes BOD up to 30–50% and TSS up to 50–70%.
Land requirement: 450 m2/MLD land is required for the Imhoff tank treatment.
Energy requirement: the power requirement of the IT is 45 kWh/day/MLD.
Environmental regulation: medium, due to less degradation of organic matter compared with that
in other systems.
Health regulation: low, due to lower reduction of pathogens.
Components of the system: This is a decentralised system. In this system, a pour flush/cistern flush
toilet is connected to an improved septic tank/conventional septic tank for storage of black water.
Manual/ motorised emptying and a truck are used for sludge collection and transport. After
collection from the septic tank, the sludge is transferred to the treatment facility. Treatment is
divided into three parts (Figure 40):
(1) Primary treatment: Imhoff tank (IT) is used for solid–liquid separation as well as treatment.
(2) After the solid–liquid separation, the liquid part is transferred to an effluent treatment plant,
i.e., a constructed wetland (CW) is used for the effluent treatment.
(3) The solid part that is generated from Imhoff tank is transferred to the sludge treatment plant,
i.e., sludge drying bed (SDB) + co-composting is used for better quality of the sludge.
System 6A: ABR+ Sludge Drying Bed + Co-composting
Key Features of the Technology
It is a complete system. It is a sewered system. This system can be applied at the community/ward/city level. Time taken for the installation of this system is 6 months to one year for small systems.
System lifetime (years): more than 50 years for this system.
Frequency of complete system cleaning/maintenance (years): the sewer would require regular
maintenance. The treatment plant would require daily maintenance/attention.
Performance of the system: the ABR removes BOD up to 70–95%, TSS to 80–90% and coliform to
20–30%.
Land requirement: 1,000 m2/MLD land is required for the ABR treatment.
Energy requirement: the power requirement of the ABR is 34 kWh/day/MLD.
Environmental regulation: high
Health regulation: medium
Components of the system: This is a networked system. In this system, waste water is transported
from a cistern flush toilet via a system of sewers to the treatment facility. Treatment is divided into
two parts (Figure 41):

Technology Options for the Sanitation Value Chain
48 www.cstep.in © CSTEP
(1) Primary treatment: An anaerobic baffled reactor (ABR) process is used for solid–liquid
separation as well as for treatment of solid and liquid.
(2) Sludge treatment: The solid part that is generated from primary treatment is transferred to the
sludge treatment plant, i.e., solar drying bed (SDB) + co-composting is used for the better quality of
sludge.
Figure 41: Networked System for FSM (ABR+ Sludge-Drying Bed + Co-composting)
System 6B: AF+ Sludge Drying Bed + Co-composting
Key Features of the Technology
It is a complete system. It is a sewered system. This system can be applied at the community/ward/city level. Time taken for the installation of this system is 6 months to 1 year for small systems.
Figure 42: Networked System for FSM (AF+ Sludge Drying Bed + Co-composting)
System lifetime (years): more than 50 years for this system.
Frequency of complete system cleaning/maintenance (years): the sewer would require regular
maintenance. The treatment plant would require daily maintenance/attention.

Technology Options for the Sanitation Value Chain
© CSTEP www.cstep.in 49 49
Performance of the system: the anaerobic filter removes BOD up to 50–90% and TSS up to 50–80%.
Energy requirement: the power requirement of the AF is 34 kWh/day/MLD.
Environmental regulation: high
Health regulation: medium
Components of the system: This is a networked system. In this system, waste water is transported
from a cistern flush toilet via a system of sewers to the treatment facility. Treatment is divided into
two parts (Figure 42):
(1) Primary treatment: An anaerobic filter (AF) process is used for solid–liquid separation as well
as for treatment of solid and liquid.
(2) Sludge treatment: The solid part that is generated from primary treatment is transferred to the
sludge treatment plant, i.e., solar drying bed (SDB) + co-composting is used for better quality of the
sludge.
System 7: Septic Tank + Belt Filter Press + CW + Lime Stabilisation +
Ozonation
Key Features of the Technology
It is not a complete system (the components of FSM are missing). It is a non-sewered system. Septic tank could be designed for the household level, whereas the sludge and effluent
treatment can be designed for the community level. Time taken for the construction of this system is less than 2 weeks.
System lifetime (years): septic tank lifetime, 50 years.
Frequency of complete system cleaning/maintenance (years): septic tank to be emptied once in 2–3
years once. The CW would require frequent maintenance/attention.
Energy requirement: the power requirement of this system is 22 kWh/day/MLD.
Environmental regulation: medium, due to missing components for FSM.
Health regulation: low, due to lower reduction of pathogens.
Components of the system: This is a decentralised system. In this system, a pour flush/cistern flush
toilet is connected to an improved septic tank/conventional septic tank for storage of black water.
Manual/ motorised emptying and truck is used for the sludge collection and transport. After
collection from the septic tank, the sludge is transferred to the treatment facility. Treatment is
divided into four parts (Figure 43):
(1) Primary treatment: Belt filter press (BFP) is used for the solid–liquid separation.
(2) After the solid–liquid separation, the liquid part is transferred to an effluent treatment plant,
i.e., constructed wetland (CW) is used for the effluent treatment.
(3) The treated liquid generated from the effluent treatment plant undergoes post-effluent
treatment for better quality; the ozonation technology is, hence, chosen for the final treatment of
the liquid.
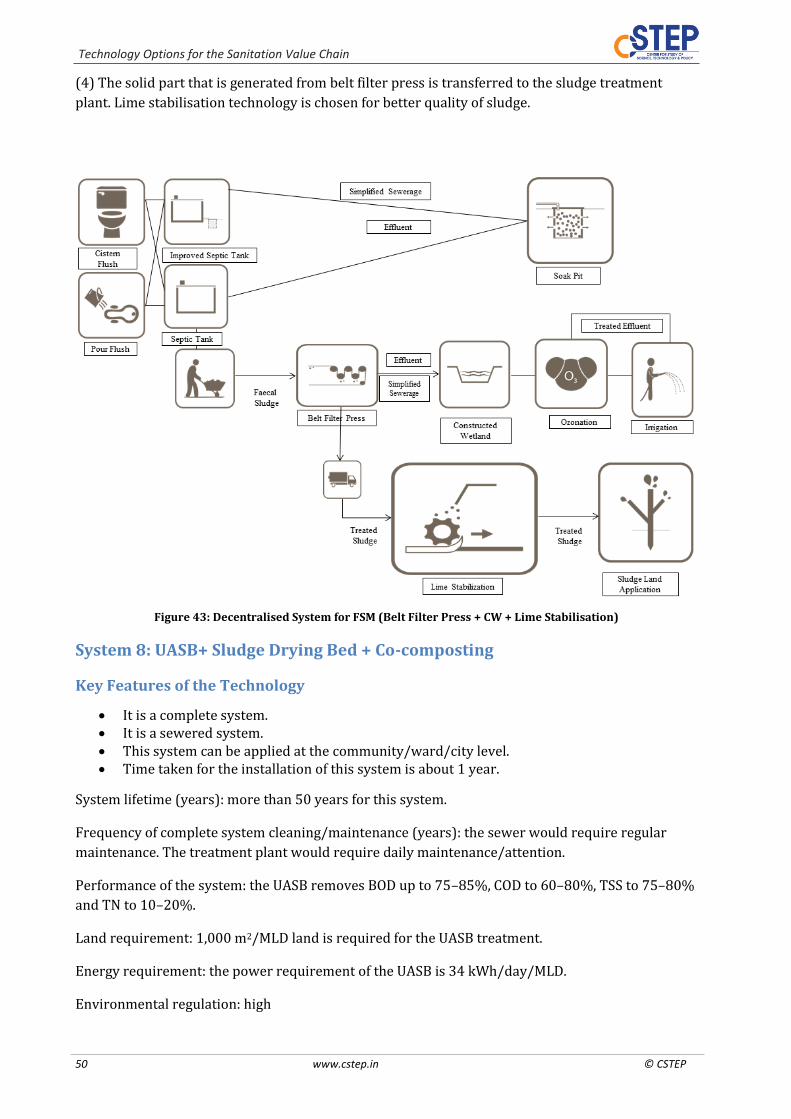
Technology Options for the Sanitation Value Chain
50 www.cstep.in © CSTEP
(4) The solid part that is generated from belt filter press is transferred to the sludge treatment
plant. Lime stabilisation technology is chosen for better quality of sludge.
Figure 43: Decentralised System for FSM (Belt Filter Press + CW + Lime Stabilisation)
System 8: UASB+ Sludge Drying Bed + Co-composting
Key Features of the Technology
It is a complete system. It is a sewered system. This system can be applied at the community/ward/city level. Time taken for the installation of this system is about 1 year.
System lifetime (years): more than 50 years for this system.
Frequency of complete system cleaning/maintenance (years): the sewer would require regular
maintenance. The treatment plant would require daily maintenance/attention.
Performance of the system: the UASB removes BOD up to 75–85%, COD to 60–80%, TSS to 75–80%
and TN to 10–20%.
Land requirement: 1,000 m2/MLD land is required for the UASB treatment.
Energy requirement: the power requirement of the UASB is 34 kWh/day/MLD.
Environmental regulation: high

Technology Options for the Sanitation Value Chain
© CSTEP www.cstep.in 51 51
Health regulation: high
Components of the system: This is a networked system. In this system, waste water is transported
from a cistern flush toilet via a system of sewers to the treatment facility. Treatment is divided into
two parts (Figure 44):
(1) Primary treatment: up-flow anaerobic sludge blanket (UASB) process is used for solid–liquid
separation as well as for treatment of solid and liquid.
(2) Sludge treatment: the solid part that is generated from primary treatment is transferred to the
sludge treatment plant, i.e., sludge drying bed (SDB) + co-composting is used for better quality of
the sludge.
Figure 44: Networked System for FSM (UASB+ Sludge Drying Bed + Co-composting)
System 9: Septic Tank + MD + WSP + Solar Drying
Key Features of the Technology
It is a complete system. It is a non-sewered system. Community-level public toilet and sludge-drying bed, and community-level WSP treatment. Time taken for the installation of the system: construction, 3–6 months for a public latrine;
3–6 months for a drying bed and for filtrate treatment.
System lifetime (years): septic tank lifetime, 50 years. WSP, 50 years if well designed and
constructed.
Frequency of complete system cleaning/maintenance (years): septic tank to be emptied once in 2–3
years once. The WSP would require frequent maintenance/attention.
Performance of the system: the waste stabilisation pond removes BOD up to 75–85%, COD to 74–
78%, TSS to 75–80%, TN to 70–90%, TP to 30–45% and coliform to 60–99.9%.
Land requirement: 7 m2/HH land is required for the construction of the toilet and for the storage of
products that are generated from the user interface. 6,000 m2/MLD land is required for the WSP
treatment.
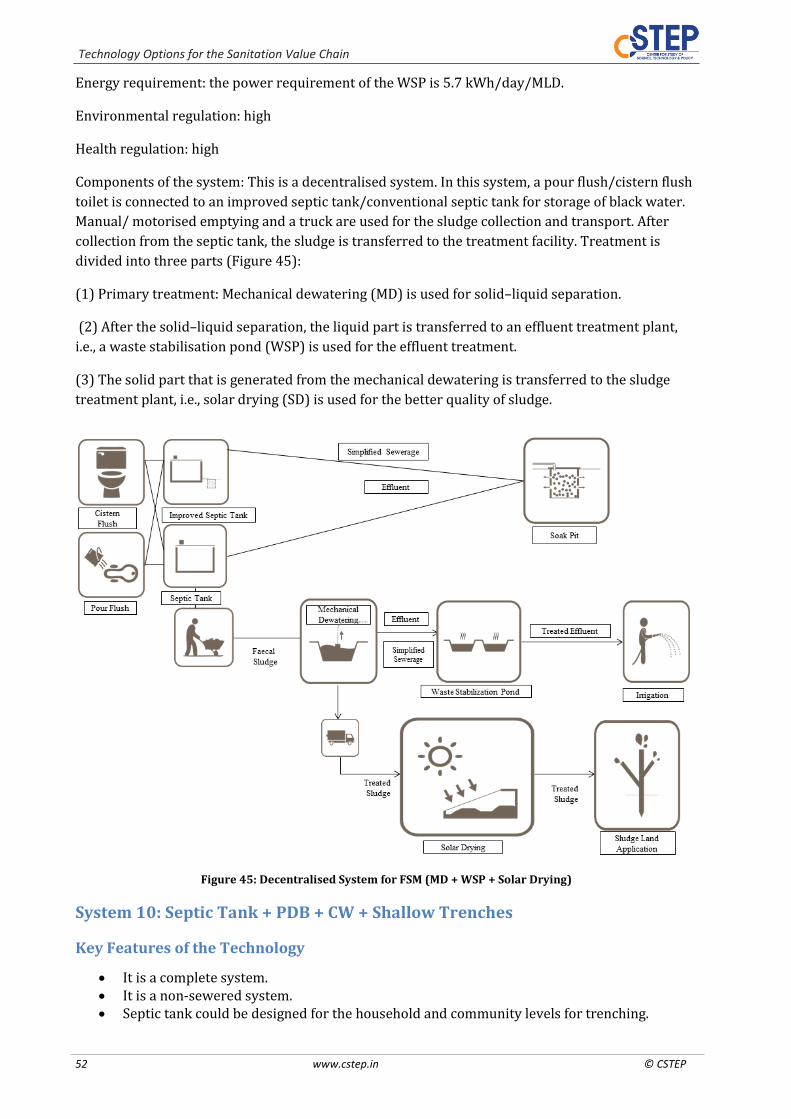
Technology Options for the Sanitation Value Chain
52 www.cstep.in © CSTEP
Energy requirement: the power requirement of the WSP is 5.7 kWh/day/MLD.
Environmental regulation: high
Health regulation: high
Components of the system: This is a decentralised system. In this system, a pour flush/cistern flush
toilet is connected to an improved septic tank/conventional septic tank for storage of black water.
Manual/ motorised emptying and a truck are used for the sludge collection and transport. After
collection from the septic tank, the sludge is transferred to the treatment facility. Treatment is
divided into three parts (Figure 45):
(1) Primary treatment: Mechanical dewatering (MD) is used for solid–liquid separation.
(2) After the solid–liquid separation, the liquid part is transferred to an effluent treatment plant,
i.e., a waste stabilisation pond (WSP) is used for the effluent treatment.
(3) The solid part that is generated from the mechanical dewatering is transferred to the sludge
treatment plant, i.e., solar drying (SD) is used for the better quality of sludge.
Figure 45: Decentralised System for FSM (MD + WSP + Solar Drying)
System 10: Septic Tank + PDB + CW + Shallow Trenches
Key Features of the Technology
It is a complete system. It is a non-sewered system. Septic tank could be designed for the household and community levels for trenching.

Technology Options for the Sanitation Value Chain
© CSTEP www.cstep.in 53 53
Time taken for the installation of the system: construction < 1 month for septic tank, 2–3 months for the trenching site.
System lifetime (years): septic tank, 50 years; trenching site, 5–10 years.
Frequency of complete system cleaning/maintenance (years): Septic tank, de-sludging every 2–3
years; trenching site, cover soil, maintenance of trees, etc.,—daily attention.
Land requirement: 7 m2/HH land is required for the construction of the toilet and for the storage of
products that are generated from the user interface.
Environmental regulation: medium
Health regulation: medium
Figure 46: Decentralised system for FSM (PDB + CW + Shallow Trenches + Chlorination)
Components of the system: This is a decentralised system. In this system, a pour flush/cistern flush
toilet is connected to an improved septic tank/conventional septic tank for storage of black water.
Manual/ motorised emptying and a truck are used for sludge collection and transport. After
collection from the septic tank, the sludge is transferred to the treatment facility. Treatment is
divided into three parts (Figure 46):
(1) Primary treatment: A planted drying bed (PDB) is used for solid–liquid separation.
(2) After the solid–liquid separation, the liquid part is transferred to an effluent treatment plant,
i.e., a constructed wetland (CW) is used for the effluent treatment.
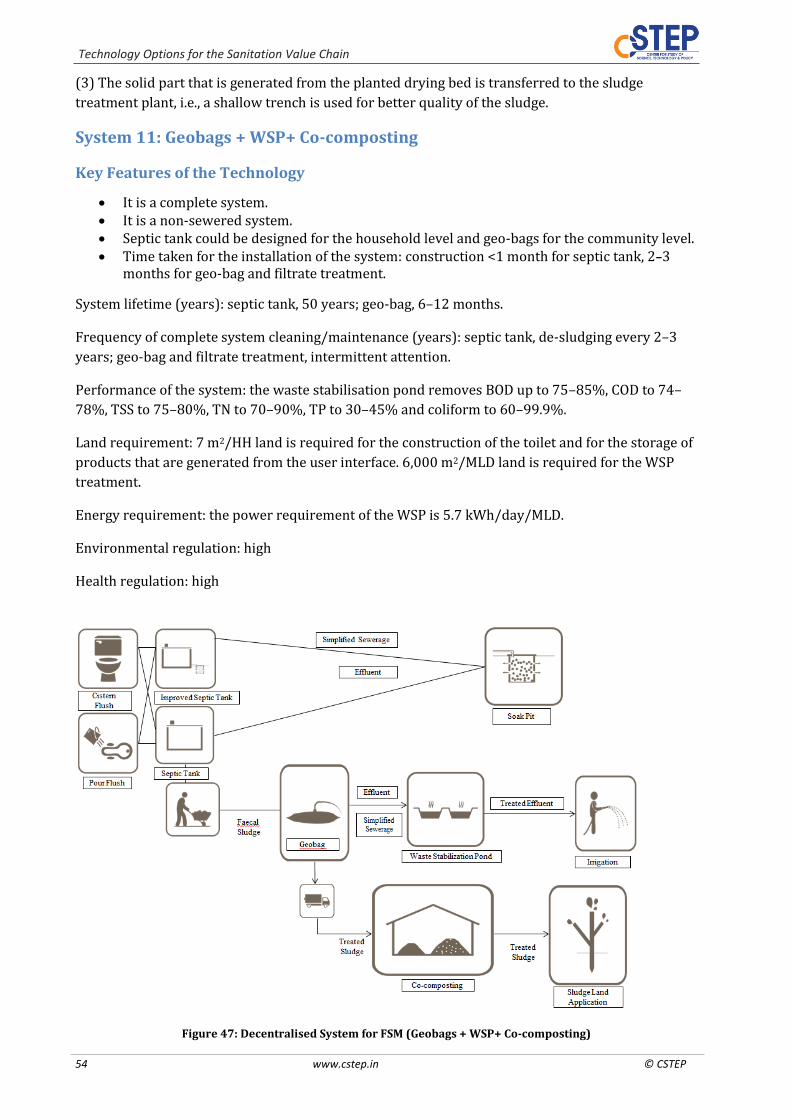
Technology Options for the Sanitation Value Chain
54 www.cstep.in © CSTEP
(3) The solid part that is generated from the planted drying bed is transferred to the sludge
treatment plant, i.e., a shallow trench is used for better quality of the sludge.
System 11: Geobags + WSP+ Co-composting
Key Features of the Technology
It is a complete system. It is a non-sewered system. Septic tank could be designed for the household level and geo-bags for the community level. Time taken for the installation of the system: construction <1 month for septic tank, 2–3
months for geo-bag and filtrate treatment.
System lifetime (years): septic tank, 50 years; geo-bag, 6–12 months.
Frequency of complete system cleaning/maintenance (years): septic tank, de-sludging every 2–3
years; geo-bag and filtrate treatment, intermittent attention.
Performance of the system: the waste stabilisation pond removes BOD up to 75–85%, COD to 74–
78%, TSS to 75–80%, TN to 70–90%, TP to 30–45% and coliform to 60–99.9%.
Land requirement: 7 m2/HH land is required for the construction of the toilet and for the storage of
products that are generated from the user interface. 6,000 m2/MLD land is required for the WSP
treatment.
Energy requirement: the power requirement of the WSP is 5.7 kWh/day/MLD.
Environmental regulation: high
Health regulation: high
Figure 47: Decentralised System for FSM (Geobags + WSP+ Co-composting)
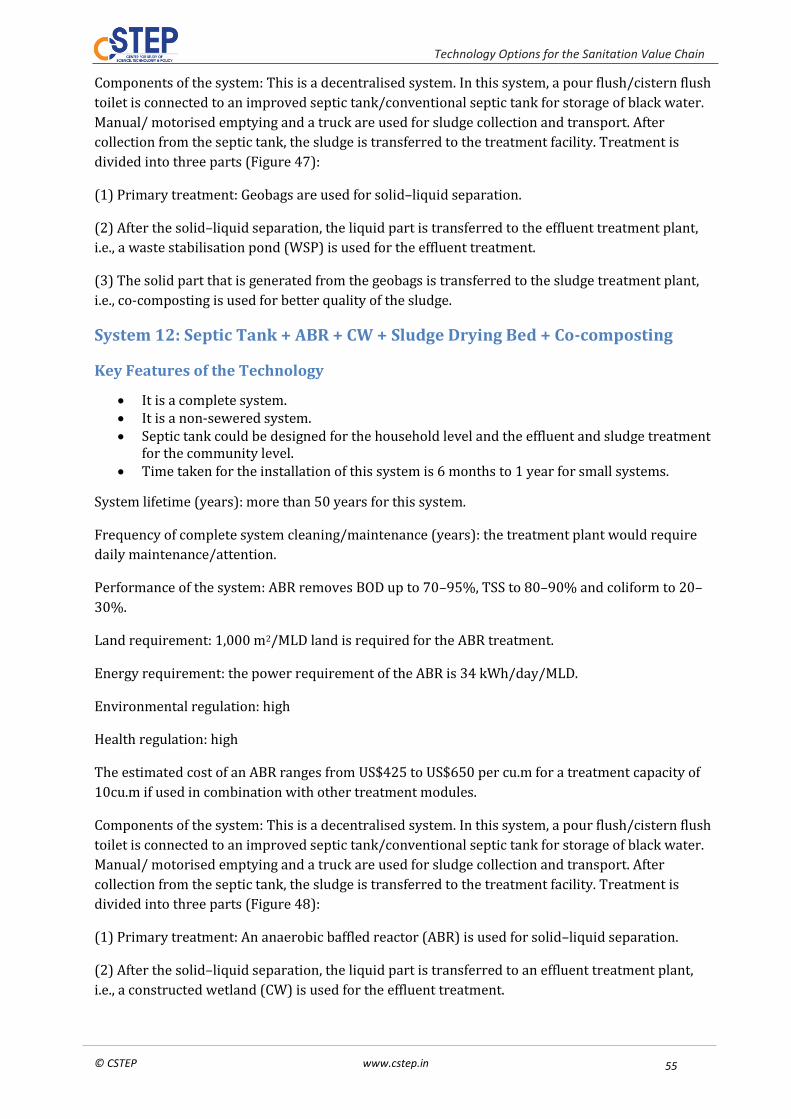
Technology Options for the Sanitation Value Chain
© CSTEP www.cstep.in 55 55
Components of the system: This is a decentralised system. In this system, a pour flush/cistern flush
toilet is connected to an improved septic tank/conventional septic tank for storage of black water.
Manual/ motorised emptying and a truck are used for sludge collection and transport. After
collection from the septic tank, the sludge is transferred to the treatment facility. Treatment is
divided into three parts (Figure 47):
(1) Primary treatment: Geobags are used for solid–liquid separation.
(2) After the solid–liquid separation, the liquid part is transferred to the effluent treatment plant,
i.e., a waste stabilisation pond (WSP) is used for the effluent treatment.
(3) The solid part that is generated from the geobags is transferred to the sludge treatment plant,
i.e., co-composting is used for better quality of the sludge.
System 12: Septic Tank + ABR + CW + Sludge Drying Bed + Co-composting
Key Features of the Technology
It is a complete system. It is a non-sewered system. Septic tank could be designed for the household level and the effluent and sludge treatment
for the community level. Time taken for the installation of this system is 6 months to 1 year for small systems.
System lifetime (years): more than 50 years for this system.
Frequency of complete system cleaning/maintenance (years): the treatment plant would require
daily maintenance/attention.
Performance of the system: ABR removes BOD up to 70–95%, TSS to 80–90% and coliform to 20–
30%.
Land requirement: 1,000 m2/MLD land is required for the ABR treatment.
Energy requirement: the power requirement of the ABR is 34 kWh/day/MLD.
Environmental regulation: high
Health regulation: high
The estimated cost of an ABR ranges from US$425 to US$650 per cu.m for a treatment capacity of
10cu.m if used in combination with other treatment modules.
Components of the system: This is a decentralised system. In this system, a pour flush/cistern flush
toilet is connected to an improved septic tank/conventional septic tank for storage of black water.
Manual/ motorised emptying and a truck are used for sludge collection and transport. After
collection from the septic tank, the sludge is transferred to the treatment facility. Treatment is
divided into three parts (Figure 48):
(1) Primary treatment: An anaerobic baffled reactor (ABR) is used for solid–liquid separation.
(2) After the solid–liquid separation, the liquid part is transferred to an effluent treatment plant,
i.e., a constructed wetland (CW) is used for the effluent treatment.
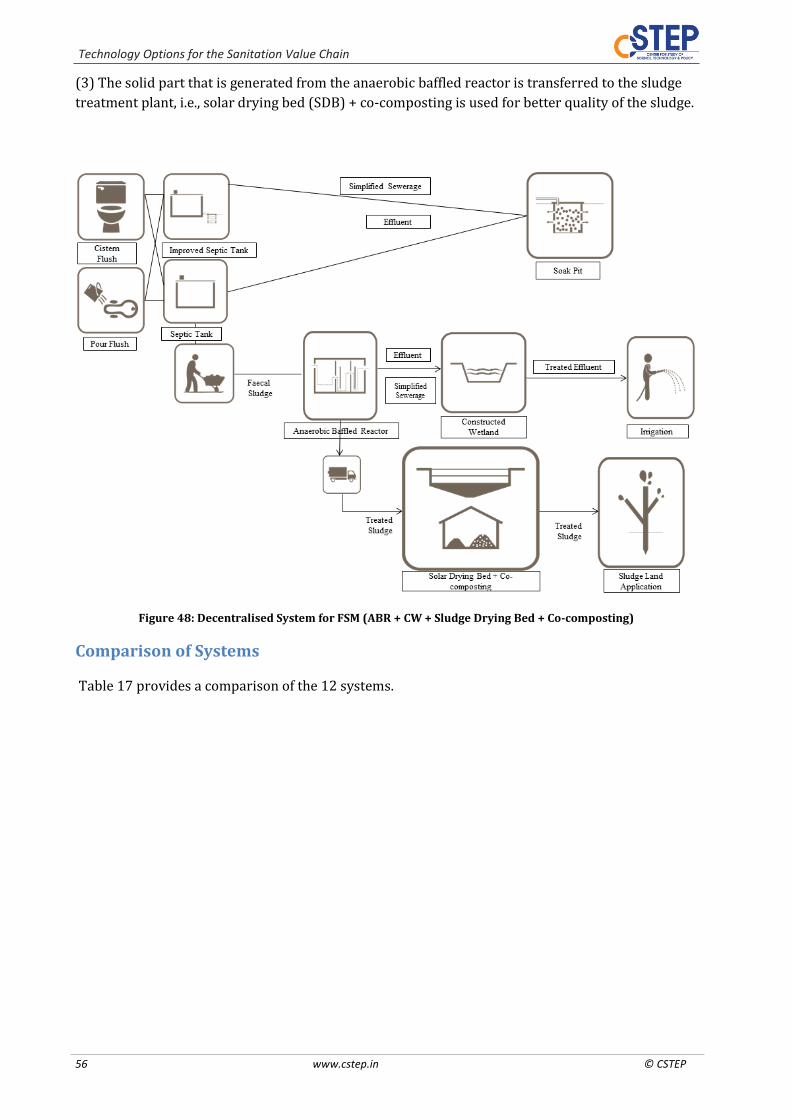
Technology Options for the Sanitation Value Chain
56 www.cstep.in © CSTEP
(3) The solid part that is generated from the anaerobic baffled reactor is transferred to the sludge
treatment plant, i.e., solar drying bed (SDB) + co-composting is used for better quality of the sludge.
Figure 48: Decentralised System for FSM (ABR + CW + Sludge Drying Bed + Co-composting)
Comparison of Systems
Table 17 provides a comparison of the 12 systems.

Technology Options for the Sanitation Value Chain
© CSTEP www.cstep.in 57
Table 17: Comparison of 12 Systems w.r.t. Land, Energy, Performance & Cost
System Nu
mber
System Name Type of System
System Lifeti
me
Applicability of
System
Land Availabi
lity
Performance of the
System
Energy Requirem
ent
CAPEX OPEX
System 1 Twin-pit system Onsite system Twin pit, 10
years Household
level 5 m2/HH for Pit + Toilet
- Not required INR 4,500 /HH for
pit INR 400/HH/year
System 2A UDB + WSP + Co-
composting + Chlorination
Decentralised system
ST, 50 years;
soak pit, 3–5 years,
UDB/WSP, 50 years
Ward/city/cluster level
7 m2/HH for Storage +
Toilet; WSP, 6,000
m2/MLD
BOD, 75–85%; COD, 74–78%; TSS, 75–80%; TN, 70–90%; TP, 30–45%; coliform, 60–
99.9%
WSP, 5.7 kWh/d/MLD
IST, INR 75,000/HH; WSP: INR
23,00,000/MLD; UDB:
3,00,00,000/MLD
IST, INR 1,500/HH/year; UDB,
INR 50,00,000/MLD/year;
WSP, INR 2,00,000/MLD/year
System 2B AD + Co-
composting + Chlorination
Decentralised system
ST, 50 years;
soak pit, 3–5 years, AD, 50 years
Ward/city/cluster level
7 m2/HH for Storage +
Toilet; AD, 600 m2/MLD
BOD, 60–90%; COD, 60–80%; TSS, 60–85%
AD, 60 kWh/d/MLD
IST, INR 75,000/HH; AD, INR
5,00,00,000/MLD
IST, INR 1,500/HH/year;
AD, INR 30,00,000/MLD/year
System 2C
Centrifugation + ASP +
Vermicomposting + Ozonation
Decentralised system
ST, 50 years;
soak pit, 3–5 years, ASP, 50
years
Ward/city/cluster level
7 m2/HH for Storage +
Toilet; ASP, 900 m2/MLD
BOD, 85–92%; COD, 93–94%; TSS, 75–80%;
TN, >90%; TP, >90%;
coliform, 60–90%
ASP, 185.7 kWh/d/MLD;
Centrifugation: 20–300 kWh per metric tonne of
solid
IST, INR 75,000/HH; ASP, 68,00,000/MLD
IST, INR 1,500/HH/year;
ASP, INR 7,00,000/MLD/year
System 2D
Centrifugation + SBR + Co-
composting + Chlorination
Decentralised system
ST, 50 years;
soak pit, 3–5 years, SBR, 50
years
Ward/city/cluster level
7 m2/HH for Storage +
Toilet; SBR, 450 m2/MLD
BOD, 95%; COD, 90%; TSS,
95%; TN, 70–80%
SBR, 153.7 kWh/d/ MLD; Centrifugation:
20–300 kWh per metric tonne of
solid
IST, INR 75,000/HH; SBR, INR
75,00,000/MLD
IST, INR 1,500/HH/year;
SBR, INR 6,00,000/MLD/year
System 2E
Centrifugation + MBR + Co-
composting + Ozonation
Decentralised system
ST, 50 years;
soak pit, 3–5 years, MBR, 50
years
Ward/city/cluster level
7 m2/HH for Storage +
Toilet; MBR, 450 m2/MLD
BOD, 95%; COD, >90%; TSS, >90%;
TN, >90%; TP, >90%
MBR, 302.5 kWh/d/ MLD; Centrifugation:
20–300 kWh per metric tonne of
solid
IST, INR 75,000/HH; MBR, INR
30,000,000 /MLD
IST, INR 1,500/HH/year;
MBR, INR 9,00,000 /MLD/year

Technology Options for the Sanitation Value Chain
58 www.cstep.in © CSTEP
System Nu
mber
System Name Type of System
System Lifeti
me
Applicability of
System
Land Availabi
lity
Performance of the
System
Energy Requirem
ent
CAPEX OPEX
System 3A MD+ AF + CW +
Co-composting + Chlorination
Decentralised system
Treatment plant life, 50 years
Ward/city/cluster level
7 m2/HH for Storage +
Toilet
BOD, 50–90%; TSS, 50–80%
AF, 34 kWh/d/MLD
BD, INR 60,000/HH
BD, INR 1,400/HH/year
System 3B
MD + WSP + Co-composting + Chlorination
Decentralised system
Treatment plant life, 50 years
Ward/city/cluster level
7 m2/HH for Storage +
Toilet
BOD, 75–85%; COD, 74–78%; TSS, 75–80%; TN, 70–90%; TP, 30–45%; coliform, 60–
99.9%
WSP, 5.7 kWh/d/MLD
IST, INR 75,000/HH; WSP, INR
23,00,000/MLD
IST, INR 1,500/HH/year; WSP,
INR 2,00,000/MLD/year
System 4
ASP + reed bed + Sludge Drying
Bed + Co-composting
Networked system
Sewer and treatment plant life, 50 years
Ward/city/cluster level
ASP, 900 m2/MLD
BOD, 90–95%; COD, 85–90%; TSS, >90%; TN,
>60%; coliform, 90–
99.9%
ASP: 185.7 kWh/d/MLD
ASP, INR 68,00,000/MLD
ASP, INR 7,00,000/MLD/year
System 5
IT + CW + Sludge Drying Bed + Co-
composting + Chlorination
Decentralised system
ST, 50 years;
IT, 50 years
Ward/city/cluster level
7 m2/HH for Storage +
Toilet; IT, 900 m2/MLD
BOD, 30–50%; TSS, 50–70%.
IT, 45 kWh/d/MLD
IST, INR 75,000/HH; IT, INR
5,00,00,000/MLD
IST, INR 1,500/HH/year;
IT, INR 30,00,000/MLD/year
System 6A ABR+ Sludge
Drying Bed + Co-composting
Networked system
Treatment plant life, 50 years
Ward/city/cluster level
ABR, 1,000 m2/MLD
BOD, 70–95%; TSS, 80–90%; coliform, 20–
30%
ABR, 34 kWh/d/MLD
ABR, INR 5,00,00,000
INR/MLD
ABR, INR 30,00,000/MLD/year
System 6B AF+ Sludge
Drying Bed + Co-composting
Networked system
Treatment plant life, 50 years
Ward/city/cluster level
- BOD, 50–90%; TSS, 50–80%
AF, 34 kWh/d/MLD
AF, US$350 to US$500 per cu.m for a treatment capacity of 10 cu.m, if the AF
is used in combination with other treatment modules (e.g., in DEWATS) [39]
-
System 7
Belt Filter Press + CW + Lime
Stabilisation + chlorination
Decentralised system
ST, 50 years
Ward/city/cluster level
7 m2/HH for Storage +
Toilet - 22 kWh/d/MLD - -
System System Name Type of System Applicability Land Performance Energy CAPEX OPEX

Technology Options for the Sanitation Value Chain
© CSTEP www.cstep.in 59
Numbe
r
System Lifetime
of System
Availability
of the System
Requirement
System 8 UASB+ Sludge
Drying Bed + Co-composting
Networked system
>50 years Ward/city/clus
ter level UASB, 1,000
m2/MLD
BOD, 75–85%; COD, 60–80%; TSS, 75–80%; TN, 10–20%.
UASB, 34 kWh/d/MLD
UASB, INR 68,00,000 /MLD;
UASB, INR 6,00,000/MLD/year
System 9 MD + WSP +
Solar Drying + Chlorination
Decentralised system
ST, 50 years;
WSP, 50 years
Ward/city/cluster level
7 m2/HH for Storage +
Toilet; WSP, 6,000
m2/MLD
BOD, 75–85%; COD, 74–78%; TSS, 75–80%; TN, 70–90%; TP, 30–45%; coliform, 60–
99.9%
WSP, 5.7 kWh/d/MLD
IST, INR 75,000/HH; WSP, INR
23,00,000MLD
IST, INR 1,500/HH/year; WSP,
INR 2,00,000/MLD/year
System 10
PDB + CW + Shallow
Trenches + Chlorination
Decentralised system
ST, 50 years;
trenching site, 5–10
years
Ward/city/cluster level
7 m2/HH for Storage +
Toilet - - IST, INR 75,000/HH
IST, INR 1,500/HH/year
System 11 Geo-bags + WSP+
Chlorination Decentralised
system
ST, 50 years; geo-bag, 6–12 months
Ward/city/cluster level
7 m2/HH for Storage +
Toilet; WSP: 6,000
m2/MLD
BOD, 75–85%; COD, 74–78%; TSS, 75–80%; TN, 70–90%; TP, 30–45%; coliform, 60–
99.9%
WSP, 5.7 kWh/d/MLD
IST, INR 75,000/HH; WSP, INR
23,00,000/MLD
IST, INR 1,500/HH/year; WSP,
INR 2,00,000/MLD/year
System 12
ABR + CW + Sludge Drying
Bed + Co-composting + Chlorination
Decentralised system
>50 years Ward/city/clus
ter level ABR, 1,000
m2/MLD
BOD, 70–95%; TSS, 80–90%; coliform, 20–
30%
ABR, 34 kWh/d/MLD
IST, INR 75,000/HH; ABR, INR
5,00,00,000 /MLD;
IST, INR 1,500/HH/year; ABR,
INR 30,00,000/MLD/year
TP: Twin Pit; IST: Improved Septic Tank; ST: Septic Tank; BD: Biogas Digester; UDB: Unplanted Drying Bed; PDB: Planted Drying Bed/Reed Bed; AD: Anaerobic Digester; MD: Mechanical Dewatering; IT: Imhoff Tank; ABR: Anaerobic Baffled Reactor; BFP: Belt Filter Press; WSP: Waste Stabilisation Pond; ASP: Activated Sludge Process; SBR: Sequence Batch Reactor; MBR:
Membrane Bioreactor; CW: Constructed Wetland; AF: Anaerobic Filter; UASB: Upflow Anaerobic Sludge Blanket.

Technology Options for the Sanitation Value Chain
www.cstep.in © CSTEP 60
Part E: Benefits of Treated Sludge
After the final stage of sludge treatment, “treated sludge” would be produced. Treated sludge, which
is fully stabilised sludge, can serve in different reuse options such as in combustion as fuel [48], in
biochar production [49], in building materials [50] [51] and as a soil conditioner [52] [53] [54]
[55]. The most common reuse option for treated sludge is as a soil conditioner and fertiliser in
developing countries. Human excreta is rich in plant nutrients; the nitrogen, phosphorus and
potassium contained in human excreta are suitable as fertiliser. However, treated sludge and
effluent might still contain pathogens, and so it is recommended that before use of wastewater and
sludge for agricultural purposes, the applied material be characterised.
Part F: Compatibility Matrix
Compatibility matrix
Compatibility matrix defines the components (Table 18) that are compatible with each other.
Example of compatibility relation: if x and y are two options of two different sub processes, then
C(x,y) is defined as follows:
C(x,y) = 1, if the two options are fully compatible.
C(x,y) = 0.5, if the two options are neither fully compatible nor fully incompatible.
C(x,y) = 0, if the two options are fully incompatible.
C(x,y) = NA, if the sub-processes to which the second option belongs is not applicable to the first
option.
Table 18: Components of the Sanitation Value Chain
Sanitation value chain Components Components code User Interface Pour flush toilet U1
Cistern flush U2 UDDT (Urine Diverting Dry Toilet) U3
Dry Toilet (composting toilet) U4 UDT U5
Community – Pour Flush U6
Public – pour flush U7 Community – Cistern U8
Public – Cistern U9 Storage/Collection/Treatment Twin pit S1
Septic Tank with soak pit , water tight (single/twin)
S2
Conventional septic tank S3 Biogas digester S4
Septic Tank with soak pit – (Community and Public)
S5
Biogas Digester – (Community and Public) S6 Composting Chamber+Urine Tank S7
VIP S8
Composting Chamber S9
Emptying and Conveyance Gulper + Trucks E1
Manual Diaphragm Pump + Trucks E2
MAPET (Manual Pit Emptying E3

Technology Options for the Sanitation Value Chain
© CSTEP www.cstep.in 61
Sanitation value chain Components Components code Technology) + Trucks
Motorised Diaphragm Pump + Trucks E4 Trash Pump + Trucks E5
Pit Screw Auger + Trucks E6
Gobbler + Trucks E7 Small Bore E8
Simplified Sewerage E9 Primary Treatment Unplanted Drying Bed SE1
Planted Drying Bed/Reed Bed SE2 AD/UASB Reactor SE3
Centrifugation SE4 Thickening And Dewatering (Mechanical
Dewatering) SE5
Settling And Thickening Tank SE6
Imhoff Tank SE7
Anaerobic Baffled Reactor SE8
Belt Filter Press SE9 Geobags SE10
Horizontal Gravel Filter SE11
Effluent Treatment WSP ET1
ASP ET2
SBR ET3
MBR ET4
ABR+CW ET5
CW ET6
AF ET7
ASP+reed bed ET8
UASB ET9
ABR ET10
Sludge Treatment Co-Composting ST1
Vermicomposting ST2
Deep Row Entrenchment ST3
Sludge Drying Bed +Co-Composting ST4
Lime Stabilisation ST5
Solar Drying ST6
Shallow Trenches ST7
Geobag ST8
Solar Sludge Oven ST9 Disinfection Chlorination – Disinfection DI1
Ozone – Disinfection DI2 Disposal Irrigation; Aquaculture; Macrophyte;
Disposal/ Recharge D1
Sludge: Land Application; Surface Disposal D2
Soak Pit / Leach Field & Dispose To HH Garden
D3
Part G: Sanitech Tool
The “Sanitech tool” has been developed by the Center for Study of Science, Technology and Policy
(CSTEP). This tool can be accessed at http://darpan.cstep.in/sanitation.
Technology Options for the Sanitation Value Chain
www.cstep.in © CSTEP 62
Objective The objective is to develop a decision-support tool that will help cities in India to provide cost-
effective and sustainable sanitation options for all, especially the urban poor, through an integrated
framework for assessment of different sanitation options. It is well recognised by sanitation
researchers and strategic policy makers that there is a need for portfolio approaches to sanitation.
However, there is a need to build a broader framework for decision makers whose understanding
of the approach can influence how sanitation investments are prioritised. There is a need to
develop a broad resource base for decision makers, which will enable them to understand the
sanitation needs of a city as well as provide them information about a range of sanitation system
options that can serve these needs.
This platform will allow for a rational process for demonstrating the trade-offs between different
stakeholders preferences and views for addressing different key questions. All urban local bodies
need to have a sanitation plan, and this tool can help in this process of planning where the decision
of right systems (information from different sources mentioned above has been collated) is of
ultimate importance.
The Tool In this context, the decision-support tool has been developed to facilitate an integrated approach to
the sanitation investment planning process for urban local bodies in India. The tool is envisioned to
provide stakeholders information and knowledge of existing and new technologies in a manner that
allows them to compare options, assess cost/benefits and make informed decisions. This will also
help decision makers to understand the relative value for money associated with decentralised
options, and to support an enabling policy and market environment for providers of sanitation
products and services. It can also be used as a capacity-building tool. The design of the tool will be
generic such that it can be used for any area provided certain data are available. Field data from a
city in India are being collected to demonstrate the potential of the tool. Sustainable access to
sanitation would mean not only access to sanitation, but also addressing the whole value chain. The
tool has a GIS-enabled user interactive interface, and allows users to create and compare scenarios;
it also allows the assessment of the impact of various sanitation options. It will provide a
framework for analysis, visualisation and self-learning where modification of system/technology
inputs based on new information, addition of new parameters for a system, and
addition/deletion/modification of systems can be done easily, enabling iterative action plans to get
the best solution by comparing scenarios. It will also help facilitate collaboration and consultation
with the partners, stakeholders, and decision makers within this sector. The information and
research outputs of the non-government organisations and knowledge partners working in the
sanitation domain can be integrated into this platform, enhancing the robustness of the tool,
instead of re-inventing the work done by them.
In short, this tool will aid decision-making by sharing data; creating, storing, and sharing scenarios;
comparing scenarios and identifying trade-offs; identifying avenues for improvement of models;
and identifying the need for new models and more sophisticated models. The tool will be
sufficiently robust to add new innovative sanitation systems for assessment as data from field
studies become available.
Target Audience The target audience for this tool could be elected officials and policymakers influencing sanitation
infrastructure decisions; utilities and government agencies responsible for sanitation provision;
technocrats and consultants; decision makers in Urban Local Bodies (ULBs); the Ministry of Urban
Development (MoUD), the Government of India (GoI), and its technical/capacity-building

Technology Options for the Sanitation Value Chain
© CSTEP www.cstep.in 63
departments; and also technology developers.
When to Use SANITECH will be used at the Pre-Feasibility stage of the project cycle. It will give an idea of the
different systems that are suitable to the city/ward context. The user at this point can select a range
of suitable technologies (scenarios) and compare them against certain key parameters like
environmental compliance, costs, resource needs, etc.
Data Needs The data required for the city/ward or any other spatial unit are shown in Table 19 and 20.
Table 19: City/Ward/Any Spatial Unit – Population and Sanitation Data
Table 20: Constraints Data for City/Ward/Any Spatial Unit
Part of Sanitation Value
Chain
Constraints Please indicate:
User Interface
Water Availability (High/Medium/Low)
Land Availability (Yes/No)
Anal Cleansing Method (Water/Soft Paper/Hard or Bulky)
Water Supply
(None/ Fetched/Hand Pump/Standpipe/Tanker
Connection)
Containment/Storage
Groundwater Level (Shallow/Deep)
Soil Type (Clayey/ Silty/ Sandy/Rocky)
Emptying and
Conveyance
(Vehicular Accessibility) (Yes/No)
For Treatment Facility Land Availability (Low/Medium/High)
Soil Type (Clayey/ Silty/ Sandy/ Rocky)
Groundwater Level (Shallow/Deep)
Flood-Prone (Not Affected/ Frequent (Low-Lying Area)/ Not
Frequent)
Terrain/Topography/Slope (Flat/ Slope)
Treatment Type Mechanised/Ecological–
Biological
Mechanised
Ecological–Biological
No Preference
Decision Flow
SANITECH has two repositories of information that are used to carry out analyses on the sanitation
situation of any area. These repositories contain information on the spatial unit (city or ward or
Data Required Non slum Slum Type of Unit
Population _ _
No. of households _ _ Numerical Value
No. of commercial institutions _ _ Numerical Value
% of homes having toilets and septic tank _ _ Percentage
% of homes having toilets (but no storage/collection) _ _ Percentage
% of homes has sewerage system _ _ Percentage
% of homes having a decentralised system _ _ Percentage
% of homes having no toilets _ _ Percentage
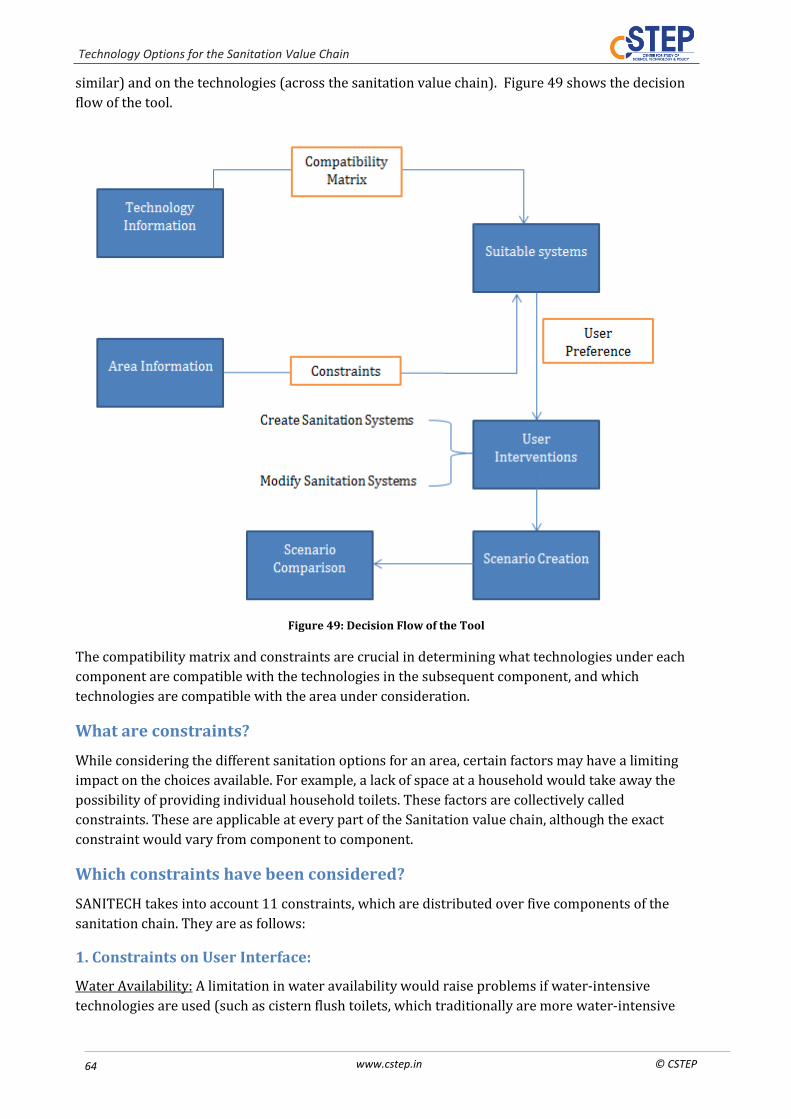
Technology Options for the Sanitation Value Chain
www.cstep.in © CSTEP 64
similar) and on the technologies (across the sanitation value chain). Figure 49 shows the decision
flow of the tool.
Figure 49: Decision Flow of the Tool
The compatibility matrix and constraints are crucial in determining what technologies under each
component are compatible with the technologies in the subsequent component, and which
technologies are compatible with the area under consideration.
What are constraints?
While considering the different sanitation options for an area, certain factors may have a limiting
impact on the choices available. For example, a lack of space at a household would take away the
possibility of providing individual household toilets. These factors are collectively called
constraints. These are applicable at every part of the Sanitation value chain, although the exact
constraint would vary from component to component.
Which constraints have been considered?
SANITECH takes into account 11 constraints, which are distributed over five components of the
sanitation chain. They are as follows:
1. Constraints on User Interface:
Water Availability: A limitation in water availability would raise problems if water-intensive
technologies are used (such as cistern flush toilets, which traditionally are more water-intensive

Technology Options for the Sanitation Value Chain
© CSTEP www.cstep.in 65
than manually pouring water for flushing). Water availability is categorised into low [less than 25
lpcd (Litres per Capita per Day)], medium (25–60 lpcd) and high (more than 25 lpcd).
Land Availability: In order to build a toilet within a dwelling, a minimum about of space (3 m2) is
required. If this area is not available, the users would need to consider building public or
community toilets instead.
2. Constraints on Storage:
Groundwater Level: While choosing a sanitation system, it is important to keep the groundwater
level of the area in mind. Aquifers are often a source of freshwater for household use, especially
drinking and bathing. It is therefore important to ensure that aquifers do not get contaminated by
wastewater. The risk of contamination is higher if the aquifer is closer to the surface as any leachate
from a sanitation system could flow into it. Further, storage technologies are generally
underground; therefore, the distance between the bottom of the storage unit and the aquifer is
lowered. The risk of groundwater contamination can be lowered by watertight storage units or
lining them with impermeable material. Here, the distance to the groundwater is measured from
the surface. Deep groundwater would be 5 m or more below the ground surface (bgs), whereas
shallow groundwater would be less than 5 m bgs.
Soil Type: The performance and suitability of onsite systems and storage components depends
heavily on the local geography. Like groundwater, the type of soil is an important factor as it will
influence the soil permeability – a feature of soil that is often used in the design of sanitation
technologies. Soak pits, for example, perform best in soil with good absorptive properties, and,
thus, clayey soil would not be the ideal choice. SANITECH allows users to choose the soil type in a
region (silty, sandy, and clayey). In case of mixed soil, users should choose the predominant soil
type.
3. Constraints on Emptying and Conveyance:
Vehicular Accessibility: Most onsite and decentralised systems require removal or movement of FS
that is collected by some form of storage technology. For this purpose, vehicles (big or small trucks)
need to be able to move across the spatial unit. Users can choose whether the area under
consideration can be accessed by FS transport vehicles. The possible conveyance options will be
highlighted accordingly.
Slope: In case of a sewerage network, the presence of a natural gradient will allow the wastewater
to flow simply by the force of gravity. If the surface is flat, then additional digging work and/or
pipes adapted to flat areas might be needed. In the constraints, “high” denotes slopes greater than
1% (1m/100m) and “low” denotes slopes less than 1%.
Soil Type: A rocky layer near the surface would make it difficult to lay pipes for a sewerage
network. For this constraint, users can define the spatial unit as either “rocky” or “not rocky”.
4. Constraints on Treatment:
Groundwater Level: Similar to the constraint for storage.
Energy Availability: This constraint relates the energy intensiveness of the technologies to the
availability of energy in the spatial unit. Some technologies (membrane bioreactor), especially the
highly mechanised ones, will be highly dependent on a constant source of energy for operation,
whereas others will have little to no dependence on energy.

Technology Options for the Sanitation Value Chain
www.cstep.in © CSTEP 66
Land Availability: This constraint relates the land-use intensiveness of the technologies to the
availability of land in the spatial unit. Many technologies require a large area to perform effectively.
In regions where space available is limited, it will be difficult (and expensive) to implement such
technologies.
Technical Skill Availability: Depending on the type of technology, the skill level needed will differ.
Technical skill availability is associated to the depth of technical knowledge required for the
operation of any technology. Generally, the required know-how is initially more available for "Old"
techniques like composting or drying, which are easy to understand. For energy-intensive
technology, the maintenance–repair, especially, will be more challenging.
What should be kept in mind while using constraints?
It is important to remember that many technologies can be improved in order to overcome the
limitations set by the constraints. The tool, however, assumes that the technologies being used are
not improved and/or adapted to local needs. If users feel that a pre-existing constraint for the
spatial unit can be overcome, then they can change the constraints through the list available on the
left-hand side of the tool. Any additional expense that may occur due to the improvement of the
technology design will not be taken into account by the tool.
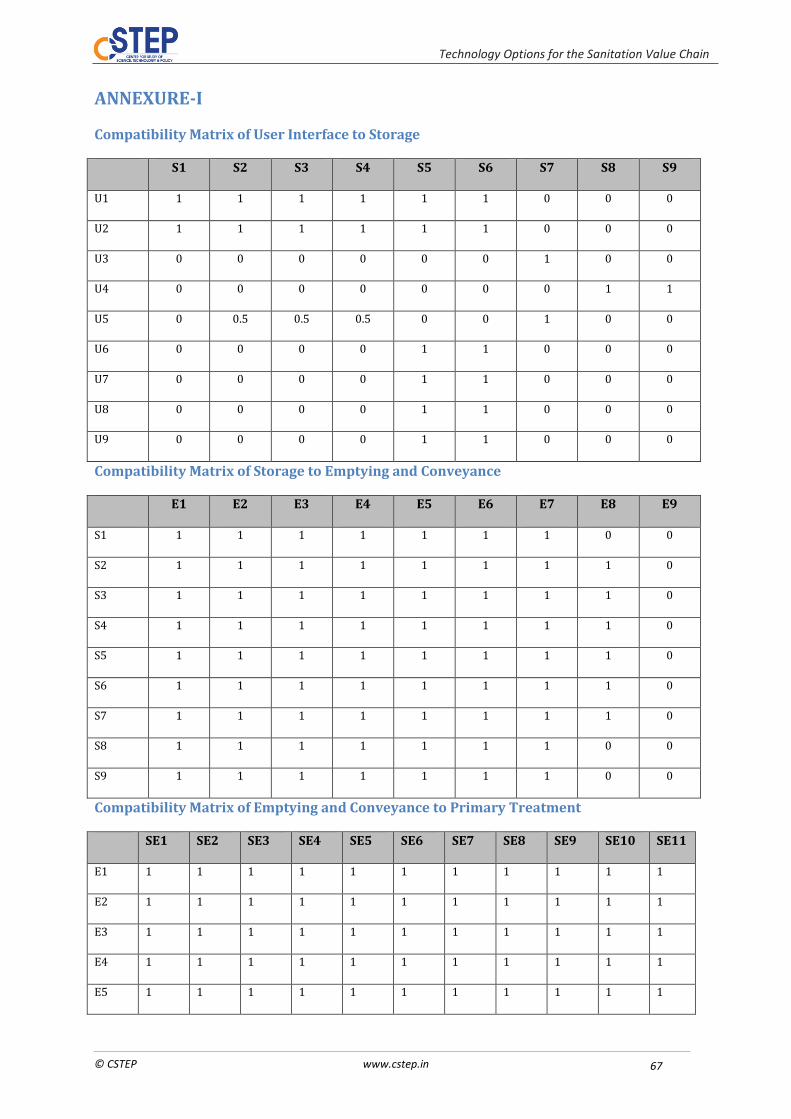
Technology Options for the Sanitation Value Chain
© CSTEP www.cstep.in 67
ANNEXURE-I
Compatibility Matrix of User Interface to Storage
S1 S2 S3 S4 S5 S6 S7 S8 S9
U1 1 1 1 1 1 1 0 0 0
U2 1 1 1 1 1 1 0 0 0
U3 0 0 0 0 0 0 1 0 0
U4 0 0 0 0 0 0 0 1 1
U5 0 0.5 0.5 0.5 0 0 1 0 0
U6 0 0 0 0 1 1 0 0 0
U7 0 0 0 0 1 1 0 0 0
U8 0 0 0 0 1 1 0 0 0
U9 0 0 0 0 1 1 0 0 0
Compatibility Matrix of Storage to Emptying and Conveyance
E1 E2 E3 E4 E5 E6 E7 E8 E9
S1 1 1 1 1 1 1 1 0 0
S2 1 1 1 1 1 1 1 1 0
S3 1 1 1 1 1 1 1 1 0
S4 1 1 1 1 1 1 1 1 0
S5 1 1 1 1 1 1 1 1 0
S6 1 1 1 1 1 1 1 1 0
S7 1 1 1 1 1 1 1 1 0
S8 1 1 1 1 1 1 1 0 0
S9 1 1 1 1 1 1 1 0 0
Compatibility Matrix of Emptying and Conveyance to Primary Treatment
SE1 SE2 SE3 SE4 SE5 SE6 SE7 SE8 SE9 SE10 SE11
E1 1 1 1 1 1 1 1 1 1 1 1
E2 1 1 1 1 1 1 1 1 1 1 1
E3 1 1 1 1 1 1 1 1 1 1 1
E4 1 1 1 1 1 1 1 1 1 1 1
E5 1 1 1 1 1 1 1 1 1 1 1

Technology Options for the Sanitation Value Chain
www.cstep.in © CSTEP 68
E6 1 1 1 1 1 1 1 1 1 1 1
E7 1 1 1 1 1 1 1 1 1 1 1
E8 0 0 0 0 0 0 0 0 0 0 0
E9 N.A. N.A. N.A. N.A. N.A. N.A. N.A. N.A. N.A. N.A. N.A.
Compatibility Matrix of Primary Treatment (Sludge Effluent Separation) to Effluent
Treatment
ET1 ET2 ET3 ET4 ET5 ET6 ET7 ET8 ET9 ET10
SE1 1 1 1 1 1 1 1 1 1 1
SE2 1 1 1 1 1 1 1 1 1 1
SE3 0 0 0 0 0 0 0 0 0 0
SE4 1 1 1 1 1 1 1 1 1 1
SE5 1 1 1 1 1 1 1 1 1 1
SE6 1 1 1 1 1 1 1 1 1 1
SE7 1 1 1 1 1 1 1 1 1 1
SE8 1 1 1 1 1 1 1 1 1 1
SE9 1 1 1 1 1 1 1 1 1 1
SE10 1 1 1 1 1 1 1 1 1 1
Compatibility Matrix of Primary treatment (Sludge Effluent Separation) to Sludge Treatment
ST1 ST2 ST3 ST4 ST5 ST6 ST7 ST8 ST9
SE1 1 1 1 1 1 1 1 1 1
SE2 1 1 1 1 1 1 1 1 1
SE3 1 1 1 1 1 1 1 1 1
SE4 1 1 1 1 1 1 1 1 1
SE5 1 1 1 1 1 1 1 1 1
SE6 1 1 1 1 1 1 1 1 1
SE7 1 1 1 1 1 1 1 1 1
SE8 1 1 1 1 1 1 1 1 1
SE9 1 1 1 1 1 1 1 1 1
SE10 1 1 1 1 1 1 1 1 1
Compatibility Matrix of Effluent Treatment to Disinfection
DI1 DI1
ET1 1 1
ET2 1 1

Technology Options for the Sanitation Value Chain
© CSTEP www.cstep.in 69
ET3 1 1
ET4 1 1
ET5 1 1
ET6 1 1
ET7 1 1
ET8 1 1
ET9 1 1
ET10 1 1
Compatibility Matrix of Effluent Disinfection to Disposal
D1 D2 D3
DI1 1 0 0
DI2 1 0 0
Compatibility Matrix of Sludge Treatment to Disposal
D1 D2 D3
ST1 0 1 0
ST2 0 1 0
ST3 0 1 0
ST4 0 1 0
ST5 0 1 0
ST6 0 1 0
ST7 0 1 0
ST8 0 1 0
ST9 0 1 0
If an Onsite System: Compatibility Matrix of Emptying and Conveyance to Disposal
D1 D2 D3
E1 0 0.5 0
E2 0 0.5 0
E3 0 1 0
E4 0 0.5 0
E5 0 0.5 0
E6 0 1 0
E7 0 1 0
E8 N.A. N.A. N.A.

Technology Options for the Sanitation Value Chain
www.cstep.in © CSTEP 70
E9 N.A. N.A. N.A.
If a Networked System: Compatibility Matrix of User Interface to Emptying and Conveyance
E1 E2 E3 E4 E5 E6 E7 E8 E9
U1 0 0 0 0 0 0 0 0 1
U2 0 0 0 0 0 0 0 0 1
U3 NA NA NA NA NA NA NA NA NA
U4 NA NA NA NA NA NA NA NA NA
U5 NA NA NA NA NA NA NA NA NA
U6 0 0 0 0 0 0 0 0 1
U7 0 0 0 0 0 0 0 0 1
U8 0 0 0 0 0 0 0 0 1
U9 0 0 0 0 0 0 0 0 1
If a Networked System: Compatibility Matrix of Emptying and Conveyance to Effluent
Treatment
ET1 ET2 ET3 ET4 ET5 ET6 ET7 ET8 ET9 ET10
E1 0 0 0 0 0 0 0 0 0 0
E2 0 0 0 0 0 0 0 0 0 0
E3 0 0 0 0 0 0 0 0 0 0
E4 0 0 0 0 0 0 0 0 0 0
E5 0 0 0 0 0 0 0 0 0 0
E6 0 0 0 0 0 0 0 0 0 0
E7 0 0 0 0 0 0 0 0 0 0
E8 0 0 0 0 0 0 0 0 0 0
E9 0 0 0 0 0 0 1 1 1 1

Technology Options for the Sanitation Value Chain
© CSTEP www.cstep.in 71
References
1. Morella, E., Forster, V., and Banerjee, S. . (2008). Africa Infrastructure: Country Diagnostic: Climbing the sanitation ladder - the state of sanitation in sub-Saharan Africa.
2. Carr, R. Excreta-related infections and the role of sanitation in the control of transmission (IWA Publishing, London, UK).
3. Murray, C. J. L., and Lopez, A. D. (1996). The Global Burden of Disease, Vol. II, Global Health Statistics: A compendium of incidence, prevalence and mortality estimates for over 200 conditions. Harv. Sch. Public Health Behalf World Health Organ. World Bank Camb. MA.
4. United Nations Population Division (1998). World Population Nearing 6 Billion Projected Close to 9 Billion by 2050. In United Nations Population Division (New York, United Nations Population Division, Department of Economic and Social Affairs (Internet communication of 21 September 2000 at www.popin.org/pop1998/1.htm)).
5. WHO (2000). Global Water Supply and Sanitation Assessment (Geneva: World Health Organization) Available at: http://www.who.int/water_sanitation_health/monitoring/jmp2000.pdf.
6. WHO (2000). The World Health Report 2000 – Health systems: Improving performance (Geneva: World Health Organization).
7. Rice, A. ., Sacco, L., Hyder, A., and Black, R. . (2000). Malnutrition as an underlying cause of childhood deaths associated with infectious diseases in developing countries. Bull. World Health Organ. 78(10), 1207–1221.
8. Esrey, S. ., Feachem, R. ., and Hughes, J. . (1985). Interventions for the control of diarrhoeal diseases among young children: improving water supplies and excreta disposal facilities. Bull. World Health Organ. 63(4), 757–772.
9. Esrey, S. ., Potash, J. ., Roberts, L., and Shiff, C. (1991). Effects of improved water supply and sanitation on ascariasis, diarrhoea, dracunculiasis, hookworm infection, schistosomiasis, and trachoma. Bull. World Health Organ. 69(5), 609–621.
10. Strande, L., Ronteltap, M., and Brdjanovic, D. (2014). Faecal sludge mangement – systems approach for implementation and operation (London: IWA Publishing).
11. Lentner, C., Lentner, C., and Wink, A. (1981). Units of Measurement, Body Fluids, Composition of the Body, Nutrition. Geigy Scientific Tables. (CIBA-GEIGY Ltd, Basle, Switzerland.).
12. Feachem, R. ., Bradley, D. ., Garelick, H., and Mara, D. . (1983). Sanitation and disease: health aspects of excreta and wastewater management (World Bank Studies in Water Supply and Sanitation 3, Wiley, Chichester, UK).
13. Jonsson, H., Baky, A., Jeppsoon, U., Hellstrom, D., and Karrman, E. (2005). Composition of urine, faeces, greywater and biowaste for utilization in the URWARE model (Gothenburg, Sweden: Chalmers University of Technology) Available at: www.urbanwater.org.
14. Vinneras, B., Palmquist, H., Balmer, P., Weglin, J., Jensen, A., Andersson, A., and Jonsson, H. (2006). The characteristics of household wastewater and biodegradable waste - a proposal for new Swedish norms. Urban Water 3, 3–11.

Technology Options for the Sanitation Value Chain
www.cstep.in © CSTEP 72
15. Gao, X. Z., Shen, T., Zheng, Y., Sun, X., Huang, S., Ren, Q., Zhang, X., Tian, Y., and Luan, G. Practical manure handbook. (In Chinese). Chinese Agricultural Publishing House. Beijing, China. In: WHO. 2006. Guidelines for the safe use of wastewater, excreta and greywater. (2002).
16. Pieper, W. (1987). Das scheiss-Buch Entstehung, Nutzung, Entsorgung menschlicher Fakalien (The shift book- production, use Entsorgung human faeces; in German) Der Grune Zweig 123, Werner Pieper and the Grune Kraft. Germany.
17. Schouw, N., Danteravanich, S., Mosbaek, H., and Tjell, J. Composition of human excreta – a case study from Southern Thailand. Sci. Total Environ. 286, 155–166.
18. Rossi, L., Lienert, J., and Larsen, T. . (2009). Real-life efficiency of urine source separation. J. Environ. Manage. 90, 1909–1917.
19. Jonsson, H., Vinneras, B., Hoglund, C., and Stenstrom, T. . (1999). Source separation of urine. Wasser Boden 51 (11), 21–25.
20. Koanda, H. (2006). vers un assainissement urbain durable en afrique subsaharienne: approche innovante de planification de la gestion des boues de vidange. Available at: https://infoscience.epfl.ch/record/83516/files/EPFL_TH3530.pdf.
21. Klingel, F., Montangero, A., Kone, D., and Strauss, M. (2002). Fecal Sludge Management in Developing Countries, A planning manual (EAWAG: Swiss Federal Institute for Environmental Science and Technology Sandec: Department for Water and Sanitation in Developing Countries.) Available at: http://www.sswm.info/sites/default/files/reference_attachments/KLINGEL%202002%20Fecal%20Sludge%20Management%20in%20Developing%20Countries%20A%20planning%20manual.pdf.
22. USEPA (1994). Guide to septage treatment and disposal (Washington, D.C: U.S. Environmental Protection Agency, Office of Research and Development).
23. Kengne, I. ., Kengne, E. ., Akoa, A., Bemmo, N., Dodane, P.-H., and Koné, D. Vertical-flow constructed wetlands as an emerging solution for faecal sludge dewatering in developing countries. J. Water Sanit. Hyg. Dev. 1, 13–19.
24. Koné, D., and Strauss, M. (2004). Low-cost Options for Treating Faecal Sludges (FS) in Developing Countries – Challenges and Performance. In (Avignon, France).
25. NWSC (National Water and Sewerage Corporation) (2008). Kampala Sanitation Program (KSP) - Feasibility study for sanitation master in Kampala, Uganda.
26. Heinss, U., Larmie, S. ., and Strauss, M. (1998). Solids Separation and Pond Systems for the Treatment of Faecal Sludges in the Tropics – Lessons Learnt and Recommendations for Preliminary Design (EAWAG/SANDEC).
27. Katukiza, A., Ronteltap, M., Niwagaba, C., Foppen, J., Kansiime, F., and Lens, P. (2012). Sustainable sanitation technology options for urban slums. Biotechnol. Adv. 30, 964–978.
28. Koottatep, T., Surinkul, N., Polprasert, C., Kamal, A. S. ., Kone, D., Montangero, A., Heinss, U., and Strauss, M. (2005). Treatment of septage in constructed wetlands in tropical climate: lessons learnt from seven years of operation. Water Sci. Technol. 51(9), 119–126.
29. Heinss, U., Larmie, S., and Strauss, M. (1994). Sedimentation Tank Sludge Accumulation Study. In (EAWAG/SANDEC publications).

Technology Options for the Sanitation Value Chain
© CSTEP www.cstep.in 73
30. Ingallinella, A., Sanguinetti, G., Koottatep, T., Montangero, A., and Strauss, M. (2002). The challenge of faecal sludge management in urban areas – strategies, regulations and treatment options. Water Sci. Technol. 46, 285–294.
31. Yen-Phi, V., Rechenburg, A., Vinnerås, B., Clemens, J., and Kistemann, T. (2010). Pathogens in septage in Vietnam. Sci. Total Environ. 408, 2050–2053.
32. Pour-flush Toilet,Sustainable sanitation and water management toolbox Available at: http://www.sswm.info/content/pour-flush-toilet.
33. Cistern Flush Toilet, Sustainable sanitation and water management toolbox Available at: http://www.sswm.info/category/implementation-tools/wastewater-treatment/hardware/user-interface/flush-toilet.
34. UDDT, Sustainable sanitation and water management toolbox Available at: http://www.sswm.info/category/implementation-tools/water-use/hardware/toilet-systems/uddt.
35. Septic Tank, Sustainable sanitation and water management toolbox Available at: http://www.sswm.info/category/implementation-tools/wastewater-treatment/hardware/semi-centralised-wastewater-treatments/s.
36. Bangladesh: Coastal Towns Infrastructure Improvement Project (2013). (ADB) Available at: http://www.adb.org/sites/default/files/project-document/79300/44212-012-tacr-04.pdf.
37. Still, D., and Foxon, K. (2012). Tackling The Challenges of Full Pit Latrines Volume 1: Understanding sludge accumulation in VIPs and strategies for emptying full pits. (Gezina: Water Research Commission) Available at: http://www.wrc.org.za/Knowledge%20Hub%20Documents/Research%20Reports/1745%20Volume%201.pdf.
38. Barreiro, W., Strauss, M., Steiner, M., Mensah, A., Jeuland, M., Bolomey, S., and Kone, D. (2003). Urban excreta management - Situation, challenges, and promising solutions. In.
39. Chowdhry, S., and Kone, D. (2012). Business Analysis of Faecal Sludge Management: Emptying and Transportation Services in Africa and Asia. Seattle: The Bill & Melinda Gates Foundation.
40. O’Riordan, M. (2009). Investigation into methods of pit latrine emptying - Management of sludge accumulation in VIP latrines (Water Research Commission (WRC), South Africa).
41. McBride, A. (2012). A Portable Pit Latrine Emptying Machine - The eVac. Pietermaritzburg, South Africa: PID, EWBUK, WfP.
42. Bhagwan, J., Wall, K., Kirwan, F., Ive, O. ., Birkholtz, W., Shaylor, E., and Lupuwana, N. (2012). Demonstrating the Effectivenes of Social Franchising Principles: The Emptying of Household VIPs, a Case Study from Govan Mbeki Village.
43. Muspratt, A. ., Nakato, T., Niwagaba, C., Dione, H., Kang, J., and Stupin, L. (2014). Fuel potential of faecal sludge: calorific value results from Uganda, Ghana and Senegal. J Water Sanit Hyg Dev 4(2). Available at: http://www.iwaponline.com/ washdev/004/01/default.htm.
44. Rulkens, W. (2008). Sewage Sludge as a Biomass Resource for the Production of Energy: Overview and Assessment of the Various Options. Energy Fuels 22, 9–15.
45. Jordan, M. ., Almendro-Candel, M. ., Romero, M., and Rincón, J. . (2005). Application of sewage sludge in the manufacturing of ceramic tile bodies. Appl. Clay Sci. 30, 219–224.
Technology Options for the Sanitation Value Chain
www.cstep.in © CSTEP 74
46. Lin, Y., Zhou, S., Li, F., and Lin, Y. (2012). Utilization of municipal sewage sludge as additives for the production of ecocement. J. Hazard. Mater., 457–465.
47. Winblad, U., and Kilama, W. (1980). Sanitation Without Water. (SIDA, Stockholm).
48. Diener, S. ., Semiyaga, S., Niwagaba, C. ., Muspratt, A. ., Gning, J. ., Mbéguéré, M., Ennin, J. ., Zurbrugg, C. ., and Strande, L. (2014). A value proposition: Resource recovery from faecal sludge—Can it be the driver for improved sanitation? Resour. Conserv. Recycl. 88, 32–38.
49. Nikiema, J., Cofie, O., Asante-Bekoe, B., Otoo, M., and Adamtey, N. (2013). Potential of locally available products for use as binders in producing fecal compost pellets in Ghana. Env. Progr Sustain Energy 33(2), 504–11.
50. Nikiema, J., Cofie, O., and Impraim, R. (2014). Technological Options for Safe Resource Recovery from Fecal Sludge (IWMI).
Technology Options for the Sanitation Value Chain
© CSTEP www.cstep.in 75