tÉcnicas reunidas, s.a. · opinion in our opinion, the accompanying annual accounts present...
TRANSCRIPT

TÉCNICAS REUNIDAS, S.A. Audit report, Annual Accounts and Directors’ Report at 31 December 2015

PricewaterhouseCoopers Auditores, S.L., Torre PwC, Pº de la Castellana 259 B, 28046 Madrid, España Tel.: +34 915 684 400 / +34 902 021 111, Fax: +34 913 083 566, www.pwc.com/es R. M. Madrid, hoja 87.250-1, folio 75, tomo 9.267, libro 8.054, sección 3ª Inscrita en el R.O.A.C. con el número S0242 - CIF: B-79 031290
This version of our report is a free translation of the original, which was prepared in Spanish. All possible care has been taken to ensure that the translation is an accurate representation of the original. However, in all matters of interpretation of information, views or opinions, the
original language version of our report takes precedence over this translation
INDEPENDENT AUDITOR’S REPORT ON ANNUAL ACCOUNTS To the Shareholders of Técnicas Reunidas, S.A. Report on the Annual Accounts We have audited the accompanying annual accounts of Técnicas Reunidas, S.A. (the “Company”), which comprise the balance sheet as at December 31, 2015, the income statement, the statement of changes in equity, the cash flow statement and related notes for the year then ended. Directors' Responsibility for the Annual Accounts The company´s directors are responsible for the preparation of these annual accounts, so that present fairly the equity, financial position and financial performance of Técnicas Reunidas, S.A., in accordance with the financial reporting framework applicable to the entity in Spain, as identified in Note 2 to the accompanying annual accounts, and for such internal control as directors determine is necessary to enable the preparation of annual accounts that are free from material misstatement, whether due to fraud or error. Auditor's Responsibility Our responsibility is to express an opinion on these annual accounts based on our audit. We conducted our audit in accordance with legislation governing the audit practice in Spain. This legislation requires that we comply with ethical requirements and plan and perform the audit to obtain reasonable assurance about whether the annual accounts are free from material misstatement. An audit involves performing procedures to obtain audit evidence about the amounts and disclosures in the annual accounts. The procedures selected depend on the auditor's judgment, including the assessment of the risks of material misstatement of the annual accounts, whether due to fraud or error. In making those risk assessments, the auditor considers internal control relevant to the entity's preparation of the annual accounts in order to design audit procedures that are appropriate in the circumstances, but not for the purpose of expressing an opinion on the effectiveness of the entity's internal control. An audit also includes evaluating the appropriateness of accounting policies used and the reasonableness of accounting estimates made by management, as well as evaluating the presentation of the annual accounts taken as a whole. We believe that the audit evidence we have obtained is sufficient and appropriate to provide a basis for our audit opinion.

Opinion In our opinion, the accompanying annual accounts present fairly, in all material respects, the equity and financial position of Técnicas Reunidas, S.A. as at December 31, 2015, and its financial performance and its cash flows for the year then ended in accordance with the applicable financial reporting framework, and in particular, with the accounting principles and criteria included therein. Report on Other Legal and Regulatory Requirements The accompanying directors’ Report for 2015 contains the explanations which the directors consider appropriate regarding the company’s situation, the development of its business and other matters and does not form an integral part of the annual accounts. We have verified that the accounting information contained in the directors’ Report is in agreement with that of the annual accounts for 2015. Our work as auditors is limited to checking the directors’ Report in accordance with the scope mentioned in this paragraph and does not include a review of information other than that obtained from the company´s accounting records. PricewaterhouseCoopers Auditores, S.L. Original in Spanish signed by Rafael Pérez Guerra 29 February 2016

This version of the annual accounts is a free translation from the original, which is prepared in Spanish.
All possible care has been taken to ensure that the translation is an accurate representation of the
original. However, in all matters of interpretation of information, views or opinions, the original
language version of the annual accounts takes precedence over this translation.
TÉCNICAS REUNIDAS, S.A. Annual accounts for the year ended 31 December 2015 and 2015 Director’s Report

2
Contents of the annual accounts of Técnicas Reunidas, S.A.
Note
Page Balance sheet 4
Income statement 6
Statement of recognised income and expense 7
Statement of changes in equity 8
Cash flow statement 9
Notes to the financial statements
1 Company information 10
2 Basis of presentation 10
3 Accounting policies 13
3.1 Intangible assets 13
3.2 Property, plant and equipment 14
3.3 Borrowing costs 15
3.4 Impairment of non-financial assets 15
3.5 Financial assets 15
3.6 Inventories 17
3.7 Cash and cash equivalents 17
3.8 Equity 17
3.9 Financial liabilities 17
3.10 Grants received 18
3.11 Derivative financial instruments and hedging activities 18
3.12 Current and deferred tax 18
3.13 Provisions and contingent liabilities 19
3.14 Revenue recognition 19
3.15 Foreign currency transactions 20
3.16 Employee benefits 21
3.17 Leases 22
3.18 Group companies and associates 22
3.19 Jointly controlled entities, UTEs and consortiums 22
3.20 Business combinations 22
3.21 Related-party transactions 23
3.22 Cash flow statement 23
4 Financial risk management 23
4.1 Financial risk factors 23
4.2 Capital risk management 26
4.3 Fair value estimation 27
5 Intangible assets 29
6 Property, plant and equipment 31
7 Analysis of financial instruments 32
8 Investments in Group companies, jointly-controlled entities and associates
33
9 Financial assets at fair value through profit or loss
37
10 Loans and receivables 38
11 Derivative financial instruments 39
12
13
Inventories Advances to suppliers
41
42

3
14 Cash and cash equivalents 42
15 Capital and share premium 42
16 Reserves 44
17
18
Profit for the year Translation differences
44
45
19 Grants received 45
20 Provisions 46
21 Long-Term Employee benefit obligations 47
22 Long-Term & Short-Term Debts 49
23 Borrowings from related parties 50
24 Trade and other payables 50
25 Income tax and tax matters 51
26 Revenue and expense 54
27 Finance income and finance cost 56
28 Contingencies 56
29 Temporary joint ventures (UTEs) and consortiums 57
30 Director and senior management remuneration 58
31 Other related-party transactions 59
32 Environmental disclosures 60
33 Events after the end of the reporting period 61
34 Audit fees 61
Exhibit I: UTEs and consortiums in which the Company has shareholdings
62

4
TÉCNICAS REUNIDAS, S.A. BALANCE SHEET AT 31 DECEMBER 2015 AND 2014 (Figures in Thousands of Euros)
Note 2015 2014
NON-CURRENT ASSETS 281,853 232,428
Intangible assets 5 63,649 59,345
Property, plant and equipment 6 46,395 35,147
Equity investments in group companies, jointly-controlled entities and associates 8 91,622 79,987
Financial assets 7 19,640 16,125
Shares and non-current equity holdings 885 885
Loans to third parties 1,764 1,534
Derivatives 7 & 11 4,112 1,681
Other financial assets 12,879 12,025
Deferred tax assets 25 60,547 41,824
CURRENT ASSETS 2,947,509 1,949,236
Inventories 12 16,166 19,826
Advances to suppliers 13 289,786 158,013
Trade and other receivable accounts 7 & 10 1,779,968 1,130,839
Investments in group companies, jointly-controlled entities and associates 8 488,438 295,976
Financial assets 58,473 81,726
Financial assets at fair value 7 & 9 40,488 39,711
Loans to third parties 94 94
Derivatives 7 & 11 12,905 32,394
Other financial assets 4,986 9,527
Cash and cash equivalents 14 314,678 262,856
TOTAL ASSETS 3,229,362 2,181,664
Notes 1 to 34 and Exhibit I are an integral part of these annual accounts.

5
TÉCNICAS REUNIDAS, S.A. BALANCE SHEET AT 31 DECEMBER 2015 AND 2014 (Figures in Thousands of Euro) Note 2015 2014
EQUITY 296,707 202,282
Capital and reserves 337,965 252,359
Capital 15 5,590 5,590
Registered capital 5,590 5,590
Share premium 15 8,691 8,691
Reserves 16 279,126 161,869
Legal reserve 1,137 1,137
Other reserves 277,989 160,732
(Treasury shares and equity holdings) 15 (74,134) (73,371)
Profit for the year 17 154,537 185,426
(Interim dividend) 17 (35,846) (35,846)
Adjustments for changes in value (41,791) (50,611)
Hedging transactions 14 (30,330) (39,182)
Translation differences 18 (11,461) (11,429)
Grants, donations and bequest received 19 534 534
NON-CURRENT LIABILITIES 244,536 119,148
Long-Term Provisions 86,682 78,701
Long-term Employee benefit obligations 21 984 7,969
Other provisions 20 85,698 70,732
Long-Term Debts 22 157,690 35,896
Debts to credit institutions 155,584 23,414
Finance lease obligations - -
Derivatives 11 - 11,813
Other financial liabilities 2,106 669
Deferred tax liabilities 25 164 4,551
CURRENT LIABILITIES 2,688,118 1,860,234
Short-Term Provisions 20 267 544
Current borrowings 22 131,819 126,556
Debts to credit institutions 15,759 3,559
Derivatives 80,091 86,990
Other financial liabilities 35,969 36,007
Borrowings from related parties 23 51,217 32,860
Trade and other payables 24 2,504,815 1,699,738
Accruals and deferred income - 536
TOTAL EQUITY AND LIABILITIES 3,229,362 2,181,664
Notes 1 to 34 and Exhibit I are an integral part of these annual accounts.

6
TÉCNICAS REUNIDAS, S.A. INCOME STATEMENT FOR THE YEARS ENDED 31 DECEMBER 2015 AND 2014 (Figures in Thousands of Euro)
Note 2015 2014
CONTINUING OPERATIONS
Revenue 26 2,615,252 1,873,356
Sales and services rendered 2,615,252 1,873,356
Changes in inventory of finished goods and work in progress (1,626) (1,574)
Work carried out by the company for assets - -
Supplies (1,382,522) (980,410)
Consumption of goods purchased for resale (1,382,522) (980,410)
Other operating income 5,441 4,074
Non-trading and other operating income 3,543 2,374
Operating grants taken to income 1,898 1,700
Employee expenses 26 (278,328) (257,161)
Wages and salaries (232,499) (213,601)
Staff welfare expenses (48,829) (42,905)
Impairment provisions 3000 (655)
Other operating expenses 26 (774,332) (600,629)
External services (728,762) (588,903)
Taxes other than income tax (1,632) (3,634)
Losses on, impairment of, and change in provisions for trade receivables Otros gastos de gestión corriente (836) (8,170)
Depreciation and amortisation 5 & 6 94 78
Overprovisions (10,383) (8,019)
Excess provisions Impairment of and gains (losses) on disposal of non-current assets (7) (65)
OPERATING PROFIT (LOSS) 225,416 29,572
Finance income 9,543 157,087
Finance cost (2,037) (2,789)
Change in fair value of financial instruments 816 1,568
Net exchange differences (10,158) 13,341
Impairment of and gains (losses) on disposal of financial instruments (43,198) -
NET FINANCE INCOME 27 (45,034) 169,207
PROFIT BEFORE INCOME TAX 180,383 198,779
Income tax 25 (25,846) (13,353)
PROFIT FOR THE YEAR 154,537 185,426
Notes 1 to 34 and Exhibit I are an integral part of these annual accounts.
8,725

7
TÉCNICAS REUNIDAS, S.A. STATEMENT OF CHANGES IN EQUITY FOR THE YEARS ENDED 31 DECEMBER 2015 AND 2014
A) STATEMENT OF RECOGNISED INCOME AND EXPENSE (Figures in Thousands of Euro)
Note 2015 2014
Profit for the year as per income statement 154,537 185,426
Income and expense recognized directly in equity On cash flow hedges 11 (30,223) (17,290) On actuarial gains and losses and other adjustments (32) (1,774) Tax effect 25 6,499 (55)
Total income and expense recognised directly in equity (23,724) (19,119)
Amounts transferred to income statement On cash flow hedges 11 40,720 (13,458) Tax effect (8,144) -
Total amounts transferred to income statement 32,576 (13,458)
TOTAL RECOGNISED INCOME AND EXPENSE 163,357 152,849
Notes 1 to 34 and Exhibit I are an integral part of these annual accounts.

8
TÉCNICAS REUNIDAS, S.A. STATEMENT OF CHANGES IN EQUITY FOR THE YEARS ENDED 31 DECEMBER 2015 AND 2014 B) TOTAL STATEMENT OF CHANGES IN EQUITY (Figures in Thousands of Euro)
Share capital
Share premium Reserves (Treasury
shares) Retained earnings
Profit for the year
(Interim dividend)
Reserve for valuation
adjustments
Grants, donations and
legacies received
TOTAL
BALANCE AT 1 JANUARY 2014 5,590 8,691 150,173 (73,371) - 82,657 (35,846) (17,904) 534 120,524
Total recognized income and expense - - 160 - - 185.426 - (32,707) - 152,849 Transactions with shareholders and owners
- Dividend payment - - - - (39,154) - (35,846) - - (75,000) Other changes in equity -Distribution of income -Other changes 3,909 3,909
BALANCE AT 31 DECEMBER 2014 5,590 8,691 161,869 (73,371) - 185,426 (35,846) (50,611) 534 202,282
BALANCE AT 1 JANUARY 2015 5,590 8,691 161,869 (73,371) - 185,426 (35,846) (50,611) 534 202,282
Total recognized income and expense 154,537 8,820 163,357 Transactions with shareholders and owners
- Dividend payments -Other operations with partners (3,154) (35,846) (75,000)
Other changes in equity (763) (779)
- Distribution of income 110,426 39,154 (185,426) 35,846
- Other changes 6,831 6,831
BALANCE AT 31 DECEMBER 2015 5,590 8,691 279,126 (74,134) - 154,537 (35,846) (41,791) 534 296,707
Notes 1 to 34 and Exhibit I are an integral part of these annual accounts.
7,657 39,154 (82,657) 35,846

9
TÉCNICAS REUNIDAS, S.A. CASH FLOW STATEMENTS FOR THE YEARS ENDED 31 DECEMBER 2015 AND 2014 (Figures in Thousands of Euro) Note 2015 2014
Cash flows from operating activities 1. Profit for the year 180,383 198,779 2. Adjustments for non-cash income and expense: - Depreciation and amortisation of PPE and intangible assets 5 & 6 10,383 8,019 - Change in provisions for contingencies and charges (net) (8,725) 20,360 - Impairment losses 44,033 1,175 - Gains (losses) on fixed asset disposals/derecognitions 7 - - Finance income 27 (9,543) (157,087) - Finance cost 27 2,073 2,789 - Change in gains/losses on derivatives 17,356 16,024 - Exchange gains/losses - - - Change in fair value of financial instruments (816) - - Other gains (losses) (1,374) 9,732 3. Changes in working capital - Inventories and advances to suppliers (128,113) 52,642 - Trade and other receivables (649,129) (200,643) - Other accounts receivable 4,541 (2,240) - Financial assets at fair value through profit or loss - - Trade payables 804,503 106,001 - Current tax liabilities - - Other changes 353 (278) 4. Other cash flows from operating activities - Interest paid (2,037) - - Dividends received 151,236 1,057 - Interest received 9,543 - - Income tax received paid (11,236) (13,118) - Other amounts paid (received) (3,888) 11,236
5. Net cash flows from (used in) operating activities 409,514 54,448
Cash flows from investing activities 6. Payment on investments - Purchases of property, plant and equipment 5 (20,834) (13,559) - Purchases of intangible assets 6 (7,014) (1,338) - Investment in group companies and associates (25,057) (26,979) - Other financial assets - - 7. Proceeds from disposals - Other financial assets 1,906 -
8. Net cash flows used in investing activities (50,999) (41,876)
Cash flows from financing activities (779) - 9.Collections and payments for equity intruments - acquisition of own equity instruments 10. Proceeds from and repayments of financial liabilities a) Issuance of: 114,420 - Borrowings from related parties 1,581 21,729 b) Repayment of: - Bank loans (2,872) (2,582) - Borrowings from related parties (344,043) (31,276) 11. Dividends paid and payments on other equity instruments - Dividends paid (75,000) (75,000)
12. Net cash flows used in financing activities (306,693) (87,129)
Net increase/(decrease) in cash and cash equivalents 51,882 (74,557)
Cash and cash equivalents at beginning of year 262,856 337,413 Cash and cash equivalents at end of the year 314,678 262,856
Notes 1 to 34 and Exhibit I are an integral part of these annual accounts.

10
TÉCNICAS REUNIDAS, S.A. NOTES TO THE 2015 FINANCIAL STATEMENTS (Thousand euro)
1. Company information
Técnicas Reunidas, S.A. (the Company) was incorporated on 6 July 1960 as a limited liability
company (“sociedad anónima”). It is entered in the Madrid Companies Register in volume 1407, sheet
129, page 5692. The latest adaptation and amendment of its Articles of Association is registered in
volume 22573, section 8, book 0, sheet 197, page M-72319, entry 157.
The registered offices of Técnicas Reunidas, S.A. are located at calle Arapiles, 14, Madrid (Spain). It is
headquartered in Madrid, at calle Arapiles, 13.
The Company’s corporate purpose, according to article 4 of the Articles of Association, consists of the
performance of all classes of engineering services and the construction of industrial plants, ranging
from viability or basic and conceptual engineering studies to turnkey engineering, design and
construction of large, complex projects, management of supply, equipment and material deliveries and
construction of plants and related or associated services, such as technical assistance, construction
supervision, project management, technical management, start-up and training.
Within its engineering services business, the Company operates through a number of business lines,
mainly in the refinery, gas and power sectors.
Since 21 June 2006, the shares of Técnicas Reunidas, S.A. have been admitted to trading on the four
Spanish stock exchanges and the continuous market and are part of the Ibex-35 benchmark index.
As indicated in Note 8, the Company is the parent of a Group of companies. The accompanying
financial statements were drawn up on an unconsolidated basis. On 29 February 2016, the Company’s
Board of Directors authorised the 2015 consolidated annual accounts of Técnicas Reunidas, S.A. and
subsidiaries for issue. The consolidated financial statements were drawn up under the International
Financial Reporting Standards adopted by the European Union (IFRS-EU). As per the consolidated
annual accounts, the Group’s equity at year-end 2015 stood at €397,471k (2014: €455,832 k), a figure
which includes Group profit for 2015 of €62,895 k (2014: €134,459 k).
2. Basis of presentation
a) Fair presentation
The 2014 annual accounts were prepared from the Company’s accounting records and are presented
in accordance with prevailing company law and the accounting rules laid down in the Spanish National
Chart of Accounts, enacted by means of Royal Decree 1514/2007, as amended by Royal Decree
1159/2010 and Ministry of Economy and Finance Order EHA/3362/2010, of 23 December, approving
the rules for adapting the Spanish National Chart of Accounts for public infrastructure concession
operators. The accompanying accounts were prepared by the Company’s directors in order to present
fairly its equity and financial position and its financial performance and the changes in equity and cash
flows in accordance with the above legislation.
The figures shown are presented in thousand euro, unless otherwise indicated.

11
b) Critical aspects of measurement and estimation of uncertainty
The preparation of the annual accounts requires the Company to make estimates and judgements
concerning the future that may affect the amount of related assets, liabilities, income and expense and
the scope of related disclosures. Critical judgements and key sources of estimation uncertainty are
assessed continually and are based on historic experience and other factors, including forward-looking
expectations, which are considered reasonable under the circumstances. Actual results may differ
from estimated results.
The main estimates applied by Company management are as follows:
Revenue recognition
The Company uses the percentage-of-completion method to recognise revenue. Use of the
percentage-of-completion method requires it to estimate the services performed to date as a
proportion of the total services to be performed. This revenue recognition method is applied only when
the outcome of the contract can be reliably estimated and it is likely that the contract will generate
profits. If the outcome of the contract cannot be reliably estimated, revenue is recognised to the extent
that costs are recovered. When it is likely that the costs of a contract will exceed the revenues, the loss
is immediately recognised as an expense. When applying the percentage-of-completion method, the
Company makes significant estimates regarding the total costs necessary to perform the contract.
These estimates are reviewed and assessed regularly in order to verify whether or not a loss has been
generated and whether it is possible to continue to apply the percentage-of-completion method or
whether it is necessary to re-estimate the expected margin on the project.
Contract revenues arising from claims made by the Group against customers or from changes in the scope of the project concerned are included in service revenue when they are approved by the final customer or when it is probable that the Group will receive an inflow of funds.
Income tax and deferred tax assets
The calculation of income tax requires the interpretation of tax legislation applicable to the Company.
There are also several factors related mainly, but not exclusively, to changes in tax laws and changes
in the interpretation of tax laws already in force that require the use of estimates by Company
management. In addition, the Company assesses the recoverability of deferred tax assets based on
the existence of future taxable income against which these assets may be utilised. Regarding
uncertain tax positions, the Company’s management, as the head of the consolidated tax group,
evaluates the probabilities and quantifies the amounts based on past experience with similar
operations, consulting with tax advisers and other experts as needed.
Provisions
Provisions are recognised when it is probable that a present obligation, arising as a result of past
events, will give rise to an outflow of resources embodying economic benefits, and the amount of the
obligation can be estimated reliably. Significant estimates are required to fulfil the applicable
accounting requirements. Company management estimates, evaluating all relevant information and
events, the probability of a contingency occurring and the amount of the liability to be settled in the
future.

12
Accounts receivable
The Company makes estimates relating to the collectability of trade receivables for projects affected by
unresolved disputes or litigation in progress deriving from acceptance issues regarding completed
work or the failure to comply with contractual clauses related to the performance of assets delivered to
customers.
Fair value of unlisted financial instruments
The Company determines the fair value of unlisted financial instruments (assets and liabilities) using
valuation techniques. The Company exercises judgement in selecting a range of methods and
assumptions which are based primarily on prevailing market conditions at the reporting date. The
Company has used discounted cash flow analyses for some derivatives not traded on active markets,
or other objective evidence of the fair value of the instrument concerned, such as recent comparable
transactions or the value of call or put options outstanding at the balance sheet date.
Warranty claims
The Company generally offers 24 or 36-month warranties on its work and services. Management
estimates the relevant provision for future warranty claims based on past information regarding such
claims, as well as recent trends that may suggest that past information regarding costs may differ from
future claims.
Employee benefits
The present value of employee benefit obligations depends on a number of factors that are determined
using actuarial assumptions. The assumptions made to determine employee benefit costs and
obligations include the appropriate discount rate and a growth rate for salaries and other benefits.
Other key assumptions for pension obligations are based in part on prevailing market conditions.
Based on these estimates and in accordance with the advice of independent actuaries, the Company
estimates at each close, the provision required. Any change in these assumptions will have an impact
on the amount of the expense and liability recognised in connection with employee benefits. Additional
information is disclosed in Note 21.
Impairment of investments in Group companies, jointly-controlled entities and associates
Investments in Group companies, jointly-controlled entities and associates are tested for impairment,
as set forth in Note 3. As these companies are not listed, their recoverable amounts are based on the
carrying amount of the shareholdings adjusted for any unrealised capital gains at the measurement
date. These calculations require the use of estimates.
Useful lives of items of PPE and intangible assets
Management determines the estimated useful lives and resulting depreciation and amortisation
charges for PPE and intangible assets. The useful lives of non-current assets are estimated based on
the period over which the asset will generate economic benefits. At each close, the Company reviews
the useful lives of its assets. When changes from previous estimations are identified, the necessary
adjustments are made on a prospective basis.

13
Impairment of concession assets
The estimated recoverable amount of the concessions operated by the Group was determined using
discounted cash flow analysis based on budgets and projections for the respective assets and
business-appropriate discount rates.
Management did not exercise judgement in applying its accounting policies other than in calculating
the estimates listed above.
c) Aggregation
Certain of the items presented on the balance sheet, income statement, statement of changes in
equity and cash flow statement are aggregated to facilitate reader comprehension, while the required
breakdowns are provided in the accompanying notes.
3. Accounting policies
3.1 Intangible assets
a) Software
Software includes the ownership and user rights for computer software acquired from third parties or
developed by the Company and intended for use during several years. Licences for software acquired
from third parties are capitalised at the cost of acquisition plus the costs incurred to ready it for use.
Development costs that are directly attributable to the design and testing of identifiable and unique
software products controlled by the Company which are deemed likely to generate future economic
benefits in excess of costs for more than one year are recognised as intangible assets. Direct costs
include software developer costs and an appropriate portion of relevant overhead.
Software is amortised on a straight-line basis over a four-year period from when it is implemented.
Software maintenance charges are expensed in the year incurred.
b) Patents, licenses and trademarks
This heading recognises the amounts satisfied for ownership of or licences for its various items of
industrial property. Industrial property has a finite useful life and is amortised over this term on a
straight-line basis. c) Concession arrangements, regulated assets
Concessions refer to the administrative authorisations granted by a number of municipal councils to build and operate car parks and other assets for the period of time stipulated in each contract. The accounting treatment of these assets has been defined based on the classification of the concession assets as intangible assets measured at fair value (understood to be the value resulting from their construction). Once the assets held under concession become operational, the concession receipts are recognised as revenue, operating expenses are expensed currently, while the intangible assets are amortised on a straight-line basis over the term of the concession. Project returns are reviewed at each year-end to assess whether or not there is any indication of impairment, i.e., an indication that their value may not be recoverable through the revenues generated while in use. Throughout the terms of these concessions, the concessionaire is obliged to repair and maintain the facilities and to keep them in a perfect state of repair. These maintenance and repair expenses are recognised in the income statement. No liabilities were recognised since the current value of the obligation is negligible.

14
3.2 Property, plant and equipment
Items of property, plant and equipment are recognised at cost less accumulated depreciation and any
accumulated impairment losses.
Own work capitalised is calculated by summing the acquisition cost of consumables, direct costs and
indirect costs attributable to the assets and is recognised as revenue in the income statement. The
costs incurred to extend, modernise or upgrade items of property, plant and equipment are capitalised
only when they entail an increase in the asset’s capacity, productivity or an extension of its useful life,
and so long as it is possible to ascertain or estimate the carrying amount of the assets derecognised in
the course of the substitution.
The costs of major repairs are capitalised and depreciated over their estimated useful lives, while
recurring maintenance expenses are taken to the income statement in the year incurred. The depreciation of items of property, plant and equipment is calculated on a straight-line basis based on their estimated useful lives and residual values, with the exception of land which is not depreciated. The estimated useful lives of each asset category are as follows:
Depreciation
rates
Buildings 2%
Laboratory facilities 20%
Photocopiers 10%
General installations 6%
Air conditioning equipment 8%
Topography work stations 10%
Furniture and office equipment 10%
Other equipment 15%
Data-processing equipment 25%
Vehicles 14%
The assets’ residual values and useful lives are reviewed, and adjusted if appropriate, at each balance
sheet date.
When the carrying amount of an asset is higher than its estimated recoverable amount, the carrying
amount is immediately reduced accordingly (Note 3.4).
Gains and losses on the sale of property, plant and equipment are calculated by comparing the
consideration received with the carrying amount and are recognised in the income statement.
3.3 Borrowing costs
The borrowing costs directly attributable to the acquisition or construction of items of property, plant
and equipment that require more than one year to ready for their intended use are capitalised until the
qualifying assets are ready for use.
15
3.4 Impairment of non-financial assets
The Company has not recognised any intangible assets with an indefinite useful life in the balance
sheet.
The Company reviews the assets subject to depreciation at each close to verify whether or not any
events or changes in circumstances indicate that the carrying amount may not be recoverable. The
excess of the carrying amount of an asset over its recoverable amount, deemed the higher of fair
value less costs to sell or value in use, is recognised as an impairment loss. For the purposes of
assessing impairment, assets are grouped at the lowest levels for which there are separately
identifiable cash flows (cash-generating units). For those assets that do not generate cash flows that
are largely independent, the recoverable amount is determined for the cash-generating units to which
the asset belongs. Impaired non-financial assets are reassessed at each balance sheet date for
potential reversal of the impairment.
3.5 Financial assets
Management establishes the classification of investments for measurement purposes upon initial
recognition and reviews the classification at each reporting date. The classification depends on the
purpose for which the financial assets were acquired. Financial assets are measured as follows:
a) Loans and receivables: financial assets deriving from the sale of goods or rendering of services
as part of the Company’s ordinary course of business. This category also includes loans that are
not commercial in origin, are neither equity instruments nor derivatives, carry fixed or determinable
payments and are not quoted in an active market.
These financial assets are recognised initially at fair value, including directly attributable transaction
costs, and are subsequently measured at amortised cost using the effective interest method,
understood as the rate that exactly discounts estimated future cash payments or receipts through
the expected life of the financial instrument to its net carrying amount. Nevertheless, trade
receivables which are due within less than one year are carried at nominal value, upon initial
recognition and for subsequent measurement purposes, when the effect of not discounting the
cash flows is not material.
Loans and receivables are tested for impairment at least at each reporting date and the
corresponding impairment losses are recognised when there is objective evidence that all amounts
due to the Company will not be collected. Impairment losses are recognised at the difference
between the carrying amount of the asset and the present value of estimated future cash flows,
discounted at the effective interest rate prevailing at the initial recognition date. Impairment losses
and any subsequent reversals are recognised in the income statement.
b) Held-to-maturity investments: debt securities with fixed maturities and fixed or determinable
payments traded on active markets which the Company has the positive intention and the ability to
hold to maturity. If the Company were to sell a material portion of its held-to-maturity investments,
the entire category would be reclassified to available-for-sale. These financial assets are included
in current assets, except for amounts due more than 12 months from the end of the reporting
period, which are classified as non-current assets.
The criteria for measuring these investments are the same as those for measuring loans and
receivables.
c) Financial assets held for trading and other financial assets at fair value through profit or loss:
Financial assets at fair value through profit or loss include all assets held for trading acquired for
sale in the short term or as part of a portfolio of identified financial instruments that are managed
together with a view to generating short term returns and financial assets designated within this

16
category by management upon initial recognition based on the determination that so doing results
in more meaningful disclosures. Derivatives are also classified as held for trading unless they
constitute financial guarantee contracts or are designated as hedging instruments (Note 3.11).
These instruments are initially recognised and subsequently measured at fair value and any
changes in fair value are recognised in the income statement. Transaction costs that are directly
attributable to the acquisition of these assets are expensed currently.
d) Equity investments in Group companies, jointly-controlled entities and associates: this category
recognises equity investments in Group companies, jointly-controlled entities and associates.
These financial assets are measured at cost, less any accumulated impairment losses.
However, if the Company held an investment in these entities before they were classified as a
Group company, jointly controlled entity or associate, cost is deemed the carrying amount of
that investment prior to the classification change. Prior measurement adjustments recognised
directly in equity are kept in equity until the investments are derecognised.
At year-end the Company determines whether there is any objective evidence that the carrying
amount of these investments may not be recoverable, recognising any corresponding
impairment losses, calculated as the difference between the investment’s carrying amount and
recoverable amount, deemed to be the higher of fair value less costs to sell and the present
value of projected cash flows from the investment. Unless better evidence is available,
impairment of this type of asset is estimated based on the investee’s equity, adjusted for any
unrealised capital gains at the measurement date. Impairment losses and any subsequent
reversals are recognised in the income statement in the year they arise.
e) Available-for-sale financial assets: This classification relates to non-derivative financial assets
that are designated as available for sale or are not included in any other category. They are
included in non-current assets unless management intends to dispose of the investment within 12
months of the balance sheet date. These financial assets are subsequently measured at fair value.
Unrealised gains and losses resulting from changes in the fair value of non-monetary instruments
classified as available for sale are recognised in other comprehensive income. When securities
classified as available for sale are sold or impaired, the accumulated fair value adjustments
recognised in equity are reclassified to profit or loss as gains and losses on investment securities.
The fair values of listed investments are based on prevailing bid prices. If there is no active market for
a financial asset (as in the case of unlisted securities), the Company establishes fair value by using
valuation techniques such as analysis of recent transactions between knowledgeable, willing
parties involving instruments which are substantially identical, discounted cash flow analysis and
option pricing models, making maximum use of market observable inputs and relying as little as
possible on subjective judgements made by the Company.
Financial assets are derecognised when substantially all the risks and rewards of ownership of the financial asset have been transferred. Specifically in relation to accounts receivable, this transfer is generally deemed to take place when the risks of insolvency and non-payment have been transferred. Financial assets designated as hedged items are subject to hedge accounting measurement rules (note 3.11).
3.6 Inventories
Inventories include the cost of construction of investment property held for sale and also the cost of
certain materials yet to be allocated to projects. The costs incurred to submit bids are recognised in
inventories when it is likely or certain that the contract will be secured or when it is known that the
costs will be reimbursed or included in the revenues originating from the contract. Inventories are
stated at the lower of cost and net realisable value. When the net realisable value of inventories is
less than cost, the corresponding impairment provision is recognised in the income statement. If
the circumstances giving rise to the impairment cease to exist, the impairment loss is reversed and

17
the reversal is credited to the income statement. Cost is calculated as acquisition price or direct
production cost. The cost of inventories includes design costs, raw materials, direct labour, other
direct costs and manufacturing overheads (based on ordinary operating capacity), excluding
interest expense. The net realisable value is the estimated selling price in the ordinary course of
business, less applicable variable cost of sales.
3.7 Cash and cash equivalents
Cash and cash equivalents include cash, deposits held at call with banks and other short-term
highly liquid investments with an original maturity of three months or less, subject to an insignificant
risk of changes in value. Bank overdrafts are included within borrowings in current liabilities on the
balance sheet. The Company had no bank overdrafts at either year-end. 3.8 Equity
The Company’s share capital is represented by ordinary shares.
The costs of issuing new shares or stock options are recognised directly against equity as a
deduction from reserves.
If the Company purchases own shares, the consideration paid, including any directly attributable
incremental costs, is deducted from equity until the shares are redeemed, reissued or sold. When
these shares are sold or subsequently reissued, any amount received, net of any incremental
directly attributable transaction costs, is included in equity.
3.9 Financial liabilities
Financial liabilities at amortised cost:
This category includes trade and non-trade payables. These liabilities are classified as current
liabilities unless the Company has an unconditional right to defer settlement for at least 12 months
from the balance sheet date.
These liabilities are initially recognised at fair value, adjusted for directly attributable transaction
costs, and are subsequently measured at amortised cost using the effective interest rate method.
The effective interest rate is that which exactly discounts estimated future cash payments through
the expected life of the financial instrument to the net carrying amount of the financial liability.
Nevertheless, trade payables which are due within less than one year and do not carry a
contractual interest rate are carried at their nominal value upon initial recognition and for
subsequent measurement purposes, when the effect of not discounting the cash flows is not
material.
These financial liabilities are initially recognised and subsequently measured at fair value and any
changes in fair value are recognised in the income statement. Transaction costs that are directly
attributable to the issuance of these liabilities are recognised in the income statement in the year
they are incurred.
A financial liability is derecognised when the corresponding obligation is extinguished.
3.10 Grants received
Government grants are recognised at fair value when there is reasonable assurance that the grant
will be collected and the Company will comply with all established terms and conditions.

18
Grants for the acquisition of items of property, plant and equipment or intangible assets are
included in non-current liabilities as deferred government grants and released to the income
statement on a straight-line basis over the estimated useful lives of the assets concerned.
3.11 Derivative financial instruments and hedge accounting
Derivatives are initially recognised at fair value on the date a derivative contract is entered into and
are subsequently re-measured at their fair value. The method of recognising the resulting gain or
loss depends on whether the derivative is designated as a hedging instrument, and if so, the nature
of the item being hedged.
The Company designates certain derivatives as cash flow hedges. The Company documents at the
inception of the transaction the relationship between hedging instruments and hedged items, as
well as its risk management objectives and strategy for undertaking various hedging transactions.
The effective portion of changes in the fair value of derivatives designated and qualifying as cash
flow hedges is recognised temporarily in equity. The gain or loss relating to the ineffective portion is
recognised immediately in the income statement within net finance income/cost. Amounts deferred
in equity are transferred to the income statement in the year in which the hedged transaction
affects profit or loss. When the hedged forecast transaction results in the recognition of a non-
financial asset or liability, the losses and gains previously deferred in equity are transferred out of
equity, and included in the initial measurement of the cost of the asset or liability.
When a forecast transaction is no longer expected to occur, the cumulative gain or loss that was
reported in equity is immediately transferred to the income statement.
In the case of derivatives not designated as hedging instruments, or which do not qualify for hedge
accounting, fluctuations in their fair value at each measurement date are recognised within net
finance income/cost in the income statement.
3.12 Current and deferred tax
Tax expense (income) is the amount of income tax accrued for the year and includes current and
deferred tax expense (income).
Both current and deferred tax expense (income) are recognised in the income statement. However,
the tax effects of items recognised directly with a credit or charge to equity are also recognised in
equity.
Current tax assets and liabilities are measured at the amounts expected to be payable or
recoverable from the tax authorities based on tax regulations prevailing at year-end. Deferred tax
assets and liabilities are not discounted for measurement purposes.
Deferred taxes are calculated, using the liability method, on temporary differences arising between
the tax bases of assets and liabilities and their carrying amounts.
Deferred tax assets are recognised to the extent that it is probable that future taxable profit will be
available against which the tax assets can be utilised.
However, deferred income tax is not accounted for if it arises from initial recognition of an asset or
liability in a transaction other than a business combination that at the time of the transaction affects
neither accounting nor taxable profit nor loss.
Deferred income tax is determined using tax rates and laws, that have been enacted or
substantially enacted by the balance sheet date and are expected to apply when the related
deferred income tax asset is realised or the deferred income tax liability is settled.

19
Técnicas Reunidas, S.A. files its income tax return as part of a consolidated tax group together with
certain Group companies.
3.13 Provisions and contingent liabilities
The Company recognises provisions when it has a present legal or constructive obligation as a
result of past events, settlement of which is expected to result in an outflow of resources, the
amount of which can be reliably estimated. The Company does not recognise provisions for future
operating losses although it does recognise provisions for engineering contracts expected to
generate losses.
Provisions are recorded based on the best estimate of the liability payable by the Company,
bearing in mind the effects of exchange rate fluctuations on amounts denominated in foreign
currency and the time value of money, if the effect of discounting is significant.
Contingent liabilities, meanwhile, are possible obligations that arise from past events whose
existence will be confirmed only by the occurrence or non-occurrence of one or more uncertain
future events not wholly within the control of the Company. Contingent liabilities are not recognised
in the financial statements but are disclosed in Note 27.
3.14 Revenue recognition
Revenue is measured at the fair value of the consideration received or receivable on the sale of
goods and services in the ordinary course of the Company’s business. Revenue is recognised net
of value added tax, returns, rebates and discounts. The Company recognises revenue when the
amount can be reliably calculated, the future economic benefits are likely to flow to it and the
specific conditions applicable to each of its businesses are fulfilled, as described below. In relation
to inventories, the Company recognises revenue and profit/loss when the significant risks and
rewards of ownership have been transferred to the buyer. The amount of revenue can not be
measured until all of the contingencies associated with the sale have been resolved. The
Company’s estimates are based on historical data, taking into account customer and transaction
types, as well as the specific terms of each contract.
Administrative agreements: revenue from the rendering of services under administrative
agreements is recognised in the financial year in which the services are provided by reference to
the stage of completion method. The price payable by the end customer consists of the direct costs
incurred, to which a fixed margin is applied for indirect costs and business profit.
Engineering contracts: when the outcome of a contract cannot be reliably estimated, the relevant
revenue is recognised to the extent of the expenses recognised that are recoverable.
When the outcome of a contract can be reliably estimated and it is probable that the contract will be
profitable, contract revenues are recognised over the term of the contract. The revenue recognition
method for turnkey engineering contracts varies based on the estimated outcome. When it is
probable that contract costs will exceed total contract revenues, the expected loss is recognised
immediately as an expense. Otherwise, profits are recognised during the term of the contract
according to the stage of completion of the project. The Company uses the percentage-of-completion method to calculate the adequate amount to be recognised in a given accounting period. The percentage-of-completion is determined based on a financial assessment of costs of the services performed at the balance sheet date as a percentage of the estimated cost of total services to be performed for each contract.
The Company recognises a receivable for the gross amount owed by customers for work
performed under all ongoing contracts for which the costs incurred plus recognised profits (less

20
recognised losses) exceed the amount of interim billings. Interim billings outstanding and retentions
are included in trade and other accounts receivable.
The Company recognises a liability for the gross amount owed by customers for work performed
under all ongoing contracts for which the interim billings exceed costs incurred plus recognised
profits (less recognised losses).
The Group occasionally negotiates and signs two or more contracts with the same customer. They are
usually contracts in which the cost and turnaround times of one affect the conditions of the other. They
are performed simultaneously or overlapping one another for part of the time, in the same industrial
area. In these cases, they are treated by the Group as a single contract.
Other times, a single contract may have clearly differentiated parts with different budgets signed with
the same customer. In these types of agreements, the customer benefits from each part of the contract
while the Group has different performance obligations. If the income and costs of the different parts
can be clearly identified, each part is treated as a separate entity.
Given the nature of the Company’s business, contracts are often modified while in progress due to
changes in the scope of the work that needs to be done under the terms of the contract. These
changes can lead to increases or decreases in the revenue from the contract.
Changes are recognised as increases in the value of the contract when it is likely that the customer will
approve the change in scope and the resulting price increase and when the amount of the additional
income can be reliably calculated.
Situations may also arise while a contract is underway in which the contractor expects to be
reimbursed by the customer or a third party for costs not included in the price of the contract. The
grounds for such claims are related to and supported by the clauses of the contract and/or situations of
force majeure. Income from claims filed under contracts is included as contractual income when the
negotiations are in the advanced stages and there is good reason to believe that an agreement will be
reached with the customer and the Group will receive the additional income. When evaluating the
probability of a claim being successful, in addition to the technical analysis of each case, past
experience in situations that are similar either because of the nature of the claim or the counterparty
involved are also analysed, as well as the discussions with the customer in relation to the case.
Depending on the types of projects in the portfolio, negotiations with customers regarding claims may
go on during the entire life of the project
Service concession arrangements
Revenue from activities performed under concession arrangements are recognised as a function of
services rendered at the contractually agreed prices.
Interest income
Interest income is recognised using the effective interest rate method.
Dividend income
Revenue from dividends is recognised when the shareholder’s right to receive payment is
established.
3.15 Foreign currency transactions
Functional and presentation currency
The Company’s annual accounts are presented in Euro, which is both its functional and
presentation currency.
Transactions and balances

21
Foreign currency transactions are translated into the functional currency using the exchange rates
prevailing on the dates of the transactions.
Foreign exchange gains and losses resulting from the settlement of such transactions and from the
translation at year-end exchange rates of monetary assets and liabilities denominated in foreign
currencies are recognised in the income statement, except when deferred in equity as qualifying
cash flow hedges.
3.16 Employee benefits
a) Pension commitments
The liability recognised in the balance sheet in respect of defined benefit pension plans is the
present value of the defined benefit obligation at the end of the reporting period less the fair value
of plan assets, together with adjustments for unrecognised past-service costs, if any.
If this difference gives rise to the recognition of an asset, its measurement may not exceed the
present value of the benefits that may be repaid to the Company in the form of direct
reimbursements or reduced future contributions, plus any unrecognised past-service costs. If the
Company has to make any adjustment in respect of this asset measurement cap, the adjustment is
recognised directly in equity within reserves.
The present value of the obligation is determined using actuarial calculation methods and unbiased
and mutually compatible financial and actuarial assumptions.
Any changes at the balance sheet date in the calculation of the fair value of the benefit obligations,
or in the fair value of plan assets where appropriate, that are attributable to actuarial gains or
losses are recognised in the year in which they arise, directly in equity, within reserves. For these
purposes, gains or losses relate exclusively to variations arising from changes to actuarial
assumptions or adjustments applied based on experience.
Past-service costs are recognised immediately in the income statement unless they relate to
conditional rights or vested benefits, in which case they are recognised in the income statement on
a straight-line basis over the remaining vesting period. However, if an asset is recognised, the
vested benefits are recognised in the income statement immediately, unless it gives rise to a
reduction in the present value of any economic benefits available in the form of refunds from the
plan or reductions in future contributions to the plan, in which case the surplus over this reduction is
recognised immediately in the income statement.
b) Other long-term remuneration obligations
The Company recognises an implicit obligation to provide defined benefits that are treated as non-current remuneration. The right to receive this type of benefit is normally subject to the employee remaining at the company for a certain number of years. The forecast costs of these benefits accrue over the employees’ term of employment using an accounting method similar to the one applied to defined benefit pension plans. Actuarial gains and losses arising from experience adjustments and changes in actuarial assumptions are charged or credited to the income statement in the year in which they arise. These obligations are assessed on an annual basis by qualified independent actuaries.
c) Termination benefits
Termination benefits are paid to employees as a result of a decision to terminate employment
contracts before the normal retirement age or when employees voluntarily agree to resign in return
for such benefits. The Company recognises termination benefits when it is demonstrably committed
to either terminating the employment of current employees according to a detailed formal plan

22
without possibility of withdrawal or providing termination benefits as a result of an offer made to
encourage voluntary redundancy. Benefits falling due more than 12 months after the end of the
reporting period are discounted to their present value.
d) Profit-sharing and bonus plans
The Company recognises a liability and an expense for bonus and/or profit-sharing arrangements
when it is contractually obliged to make payment and when past practice has created a
constructive obligation.
3.17 Leases
Finance leases
Asset leases in which the Company acts as lessee and retains substantially all the risks and
rewards of ownership of the assets are classified as finance leases. Finance leases are recognised
at the inception of the lease term at the lower of the fair value of the leased asset and the present
value of the minimum lease payments. Present value is calculated using the rate of interest implicit
in the lease agreement, or the interest rate used by the Company for similar transactions.
Lease payments are apportioned between finance charges and reduction of the lease liability. The
total finance charge is apportioned over the term of the lease and is recognised in the income
statement in the year accrued. The payment obligation under the lease, net of finance charges, is
recognised in non-current payables, except for the portion falling due within 12 months. Items of
property, plant and equipment acquired under finance leases are depreciated over the shorter of
the useful life of the asset and the lease term.
Operating leases
Leases arrangements where the lessor retains substantially all the risks and benefits inherent to
ownership of the asset are classified as operating leases. When the Company acts as lessee,
operating lease payments (net of any bonus received by the lessor) are recognised in the income
statement on a straight-line basis over the lease term.
3.18 Group companies and associates
For the purposes of presenting its annual accounts, a Group company is one over which the
Company exercises control. Control is presumed to exist when the shareholding exceeds 50% of
the voting rights or, if less, when other reasons or events demonstrate the existence of control (for
example, agreements between shareholders).
Associates are companies over which the Company exercises significant influence but not control.
Significant influence is presumed to exist when the shareholding is between 20% and 50% of the
voting rights or, when the shareholding is lower, there are events and circumstances which
demonstrate the exercise of significant influence.
3.19 Jointly-controlled entities – UTEs and consortiums
The proportional part of the balance sheet and income statement items of UTEs and consortiums
are incorporated into the Company’s balance sheet and income statement based on its ownership
interest in the venture.
None of the UTEs use accounting criteria that differs from those applied by the Company.
3.20 Business combinations
The Company recognises business combinations resulting from the acquisition of shares or equity

23
stakes in another company in accordance with the rules for accounting for investments in Group
companies, jointly-controlled entities and associates (Note 3.5.d).
3.21 Related party transactions
As a general rule, transactions between Group companies are initially recognised at fair value and
in accordance with the economic substance of the transaction. Subsequent measurement follows
prevailing accounting rules.
3.22 Cash flow statement
The following expressions are used in the statement of cash flows:
- Cash flows: inflows and outflows of cash and cash equivalents (Note 14).
- Cash flows from operating activities: the principal revenue-producing activities of the Company
and other activities that are not investing or financing activities.
- Cash flows from investing activities: payments and collections originating in the acquisition and
disposal of non-current assets.
- Cash flows from financing activities: payments and collections arising from the issue and
repayment/cancellation of financial liabilities, equity instruments and dividends.
4. Financial risk management
The Company’s business activities expose it to a series of financial risks: market risk (including interest rate, foreign currency risk and other price risks), credit risk and liquidity risk. The Company’s comprehensive risk management program is focused on the prevailing financial market uncertainty in an attempt to mitigate any potential adverse effects on its profitability. The Company uses derivatives to hedge certain risks.
Risk management is carried out by the Group’s Finance Department, Business Units and corporate
Treasury Department following policies approved by the Board of Directors. This department
identifies, evaluates and hedges financial risks in close co-operation with the Group’s operating
units.
4.1 Financial risk factors
The activities of the Company are exposed to various financial risks: market risk (including foreign
exchange risk, interest rate risk and price risk), credit risk and liquidity risk. The program's overall
risk management of the Company focuses on the unpredictability of financial markets and seeks to
minimize potential adverse effects on its financial performance. The Company uses derivative
financial instruments to hedge certain risk exposures.
Risk management is controlled by the Treasury Department of the Company that identifies,
evaluates and hedges financial risks under policies approved by the Board of Directors. The Board
of Directors provides written for overall risk management policies, as well as for specific areas such
as exchange rate risk, interest rate risk, liquidity risk, use of derivative and non-derivative and
investment of excess liquidity.
a) Market risk
a.1) Exchange rate risk
The Company operates internationally and is exposed to foreign exchange risk arising from various
currency exposures, particularly to the US dollar (USD) and roubles (RUB) and, to a lesser extent,

24
currencies tied to the USD. There is residual exposure to suppliers operating in other currencies
(principally yen, Australian dollars, and Turkish liras). Foreign exchange risk arises on forecast
commercial transactions and recognised assets and liabilities.
To manage the foreign exchange risk that derives from future transactions and recognised assets
and liabilities, the Company uses forward contracts, in accordance with the hedging policy in place,
brokered by the Company’s corporate Treasury Department. Foreign exchange risk arises when
the future transactions and recognised assets and liabilities are denominated in a currency other
than the Company’s functional currency. The Treasury Department is responsible for managing the
net position in each foreign currency using external foreign exchange forward contracts. In addition,
the Company tries to hedge exchange rate risk via ‘multicurrency’ contracts with its customers,
segregating the selling price in the various currencies from the foreseen expenses and preserving
the projected margins in euro terms.
The Company’s risk management policy is to hedge most highly probable forecast transactions in
each of the main currencies during the months the project is scheduled to last. The portion of the
risk to be hedged in relation to projected sales in each of the main currencies varies by project.
These hedges are classified as highly probable forecast transactions for hedge accounting
purposes.
The nature of the Company’s business operations means that it is very common to denominate
customer transactions in US dollars, while the corresponding costs are habitually denominated in
multiple currencies, albeit principally US dollars. If the euro had depreciated / appreciated against
the US dollar by a hypothetical 10% in 2015, leaving all other variables constant, profit before tax
for the year would have been €1.346k higher / lower (2014: €23.401k higher / lower), mainly due to
hypothetical gains / losses generated on the revaluation / devaluation of open positions in US
dollars.
Meanwhile, if the euro had depreciated / appreciated against the US dollar by a hypothetical 10%
in 2015, equity would have been €104.638k lower / higher (2014: €64.628k lower / higher); these
amounts were calculated based on the changes in profits outlined in the paragraph above and the
estimated changes in the value of hedging derivatives recognised in the hedging reserve (all before
considering the related tax effects).
a.2) Price risk The Company is partially exposed to commodity price risks, basically with respect to metals and oil, to the extent that they affect the price of equipment and manufactured materials used in construction projects. In general these impacts are effectively passed on in sales prices by all peer contractors operating in the sector. The Company is exposed to price risk with respect to equity instruments. Exposure to this risk on account of the investments held by the Company and classified in the balance sheet at fair value through profit or loss is limited because they correspond primarily to investments in fixed-income funds which invest in very short-term assets (assets maturing in less than six months and not exposed to interest rate risk) (Note 9). The Company reduces and mitigates price risk through the policies established by Group management, which basically consist of accelerating or slowing the rate of placements and selecting the currencies and countries of origin. An additional mechanism used to mitigate this risk takes the form of contracting formulae that apportion a price component for covering possible cost deviations.
a.3) Cash flow interest rate risk The Company generally attempts to self-finance its projects, establishing invoicing and collection milestones with its clients which cover the payment deadlines committed to with suppliers. This is

25
why the Company presents significant net cash balance. This means that interest rate risk on liability positions is negligible.
The exposure to floating interest at each year-end is as follows:
2015 2014
Referenced to Euribor
Other benchmarks
Total
Referenced to Euribor
Other benchmarks
Total
Borrowings (Note 22) (171,343) (171,343) (26,973) - (26,973) Interest-earning cash and cash equivalents (Note 14) 61,168 253,510 314,678 121,227 141,629 262,856 Net cash position (110,175) 253,510 143,335 94,254 141,629 235,883
Based on sensitivity analysis performed on cash and cash equivalents, the impact of a 25 basis point fluctuation (in either direction) in interest rates would imply, at most, an increase / decrease in profit of €419k (2014: €525k).
b) Credit risk The Company manages its credit risk exposure as a function of the following groups of financial assets: Assets arising from derivatives (Note 11). Various balances included in cash and cash equivalents (Note 14). Trade and other receivable balances (Note 10). The derivatives and other instruments arranged with financial institutions included as cash and cash equivalents are contracted with highly prestigious financial entities. In relation to trade accounts receivable it is worth noting that, due to the nature of the business, receivables are highly concentrated among counterparties, mirroring the Company’s most important projects. These counterparties are generally state oil companies or multinationals, along with major Spanish energy groups. The Company’s key customers represented 55% of total “Trade receivables” (within Trade and other receivables) at 31 December 2015 (2014: 77%) and are tied to transactions with entities such as those described in the preceding paragraph. As a result, the Company considers credit risk to be very low. In addition to the credit analysis performed before entering into a contract, the global position of trade and other receivables is monitored on an ongoing basis, while the most significant exposures (including exposure to the type of entities mentioned earlier) are monitored at the individual level. Trade receivables are generally not secured by collateral or subject to other credit enhancements, except when warranted by specific circumstances. c) Liquidity risk The prudent management of liquidity risk entails maintaining sufficient cash and marketable securities, ensuring available funding in the form of sufficient committed credit facilities and the ability to monetise market positions. Due to the dynamic nature of the underlying businesses, the Treasury Department aims to maintain funding flexibility by keeping credit lines available. Because of the tendency of contracts with customers to include tighter cash flows and the difficulty of passing these payment terms on to suppliers, the Group has had to increase its external financing.

26
Management monitors liquidity forecasts on the basis of projected cash flows. As mentioned above, the strategy of self-financing projects results in significant net cash balances. In addition, the Company has in place undrawn credit lines that increase its liquidity balance. As a result, the Company’s directors believe that its liquidity risk is low. The following is a breakdown of the significant liquidity parameters: Thousand euro
2015 2014
Debts to credit institutions (Note 22) (171,343) (26,973) Cash and cash equivalents (Note 14) 314,678 262,856
Net cash balance 143,335 235,883
Undrawn credit lines (Note 22) 275,943 31,000
Total liquidity reserves 419,278 266,883
The table below analyses the Company’s financial liabilities into relevant maturity groupings based on the remaining period at the balance sheet date to the contractual maturity date. The amounts disclosed in the table are the contractual undiscounted cash flows. The balances payable within 12 months are equivalent to their carrying amounts, since the effect of discounting them is insignificant. Figures in Thousands of Euros Less than
one year Between 1
and 2 years Between 2
and 5 years Over 5 years
At 31 December 2015
Borrowings 15,759 136,730 - 18,854 Derivative financial instruments 80,091 - - - Trade and other payables 2,504,815 - - -
Total 2,600,665 136,730 - 18,854
At 31 December 2014 Borrowings 3,559 3,559 10,677 9,178 Derivative financial instruments 86,990 11,813 - - Trade and other payables 1,699,738 - - -
Total 1,790,287 15,372 10,677 9,178
4.2. Capital risk management
The Company’s objectives when managing capital are to safeguard its ability to continue as a going concern and to offer existing and prospective clients sufficient capital to guarantee its ability to handle their projects. In order to maintain or adjust the capital structure, the Company can adjust the amount of dividends paid to shareholders and return capital to shareholders, among other potential initiatives.
The Company monitors capital based on a leverage ratio. This ratio is calculated as debt divided by equity. Debt is calculated as total borrowings. Capital is calculated as equity, as shown in the financial statements.
2015 2014
Borrowings (Note 22) (171,343) (26,973)
Net cash position 143,335 235,883
Equity 296,708 202,282
% Borrowings / Equity (57,75%) (13.33%)

27
4.3. Fair value estimation
The fair value of a financial instrument is the amount for which an asset could be exchanged, or a liability settled, between knowledgeable, willing parties in an arm’s length transaction. The fair value of financial instruments traded on active markets is based on market prices at each reporting date. The quoted market price used for financial assets held is the current bid price. A market is considered active if quoted prices are readily and regularly available from an exchange, dealer, broker, industry group, pricing service or regulatory agency, and those prices represent actual and regularly occurring market transactions on an arm’s length basis. The quoted market price used for the financial assets held by the Group is the current bid price.The fair value of financial instruments that are not quoted in an active market (e.g. derivatives of non-official market) is determined by using valuation techniques. These valuation techniques maximise the use of available observable data inputs and rely as little as possible on entity-specific estimates. The fair value of trade receivables and payables is assumed to approximate their carrying amount less any impairment provisions. The fair value of financial liabilities for reporting purposes is estimated by discounting future contractual cash flows at the prevailing market interest rate that would be borne by the Company on equivalent financial instruments. Specific valuation techniques used to value financial instruments include: Quoted market prices or dealer quotes for similar instruments. The current value of the FX futures is determined using the futures exchange rate on the balance sheet date, discounting the result from the current value. Other techniques, such as analysing discounted cash flows, are used to analyse the fair value of other financial instruments. When measuring the fair value of financial instruments, credit risk must be considered, this being understood as the credit risk of the counterparty but also that of the Company itself, where necessary. In view of the characteristics of the Company's portfolio, the application of credit risk has the most significant impact on the portfolio of financial derivatives designated as cash flow hedges, which are measured at fair value. These instruments are unique in that the expected cash flows are not pre-determined; rather, they vary based on the underlying financial variable so determining the credit risk to be applied, i.e., the Company's own or the counterparty's, is not intuitive but rather depends on market conditions at any given time and hence needs to be quantified using measurement models. The current value of the FX futures is determined using the futures exchange rate on the balance sheet date, discounting the result from the current value. Other techniques, such as analysing discounted cash flows, are used to analyse the fair value of other financial instruments. Currency forwards consist of the purchase of one currency against the sale of a different currency in which the exchange rate is fixed on the date of the contract to be delivered or settled in the future, starting on the third business day after the contract date. Raw material forwards consist of the future purchase or sale of a raw material in which the exchange rate is fixed on the date of the contract and to be delivered or settled in the future, starting on the third business day after the contract date. The effect of credit risk on the value of currency and raw material forwards will depend on future settlements. If the settlement is positive for the Company, a credit spread is incorporated for the counterparty to quantify the probability of non-payment at the time of maturity; otherwise, if the settlement is expected to be negative for the Company, the credit risk is applied to the Company's final settlement. To determine whether or not the settlement of the forwards will be favorable for

28
the Group, a stochastic model is used to simulate the derivative's behavior in different scenarios using complex mathematical models that consider the underlying's volatility and applying the resulting credit spread to each simulation. It is assumed that the carrying value less the provision for impairment of accounts receivable and payable approximates fair value. The fair value of financial liabilities for reporting purposes is estimated by discounting future contractual cash flows at the prevailing market interest rate that would be borne by the Company on equivalent financial instruments.
5. Intangible assets
Detail & changes of the various items comprising ‘Intangible assets’ is provided below: Thousand euro
Concession arrangements,
regulated assets
Concession arrangement
prepayments, regulated
assets
Patents, licenses
and trademarks
Computer software Total
Balance at 01/01/2014
Cost 60,447 - 13 9,565 70,025
Accumulated amortisation (1,489) - - (6,991) (8,480) Accumulated impairment losses (2,200) - - - (2,200)
Carrying amount 56,758 - 13 2,574 59,345
-
Additions 42 - 1,296 1338
Decreases - - - - -
Transfers (8,778) - - - (8.778) Amortisation charge (686) - - (1,340) (2,026) Amortisation decreases - - - - - Other movements 384 - - 21 405
Impairment charge - - - - -
Balance at 31/12/2014
Cost 60,447 13 9.565 70,025
Accumulated amortisation (1,489) - - (6,991) (8,480) Accumulated impairment losses (2,200) - - - (2,200)
Carrying amount 56,758 - 13 2,574 59,345
Additions 4,552 - 2,492 7,014
Decreases - - - -
Transfers - - - -
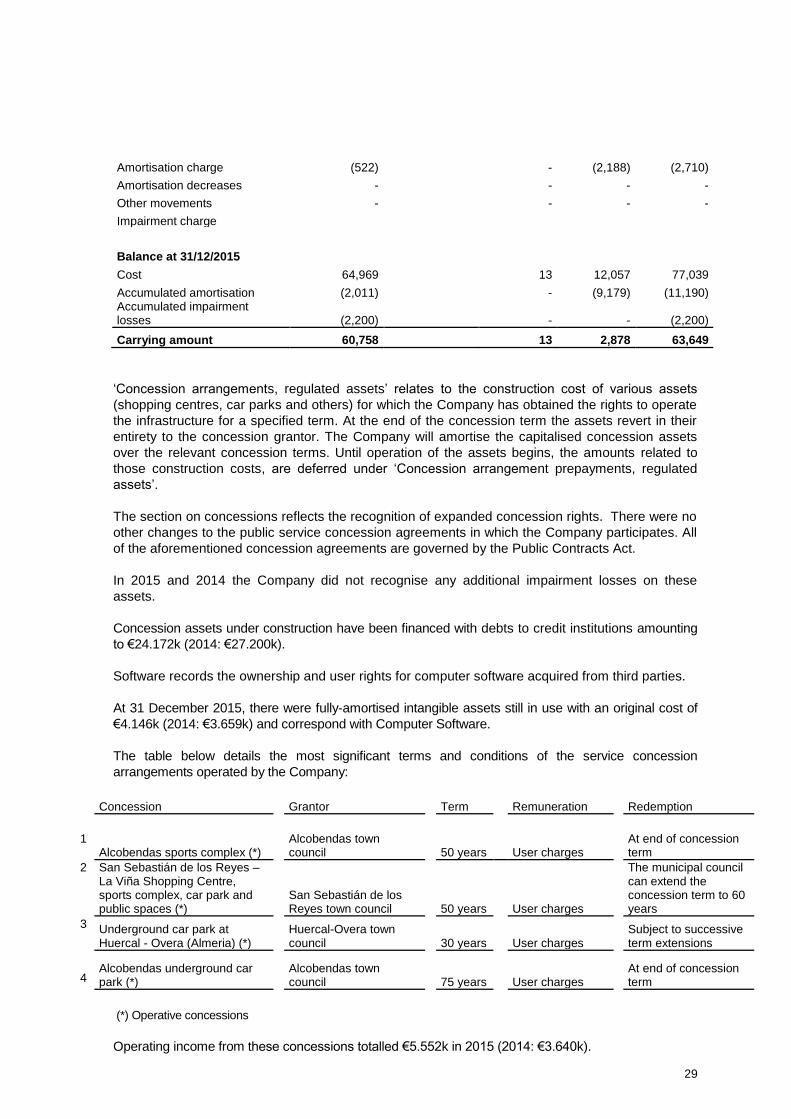
29
Amortisation charge (522) - (2,188) (2,710)
Amortisation decreases - - - -
Other movements - - - -
Impairment charge
Balance at 31/12/2015
Cost 64,969 13 12,057 77,039
Accumulated amortisation (2,011) - (9,179) (11,190) Accumulated impairment losses (2,200) - - (2,200)
Carrying amount 60,758 13 2,878 63,649
‘Concession arrangements, regulated assets’ relates to the construction cost of various assets
(shopping centres, car parks and others) for which the Company has obtained the rights to operate
the infrastructure for a specified term. At the end of the concession term the assets revert in their
entirety to the concession grantor. The Company will amortise the capitalised concession assets
over the relevant concession terms. Until operation of the assets begins, the amounts related to
those construction costs, are deferred under ‘Concession arrangement prepayments, regulated
assets’.
The section on concessions reflects the recognition of expanded concession rights. There were no
other changes to the public service concession agreements in which the Company participates. All
of the aforementioned concession agreements are governed by the Public Contracts Act.
In 2015 and 2014 the Company did not recognise any additional impairment losses on these
assets.
Concession assets under construction have been financed with debts to credit institutions amounting
to €24.172k (2014: €27.200k).
Software records the ownership and user rights for computer software acquired from third parties.
At 31 December 2015, there were fully-amortised intangible assets still in use with an original cost of
€4.146k (2014: €3.659k) and correspond with Computer Software.
The table below details the most significant terms and conditions of the service concession
arrangements operated by the Company:
Concession Grantor Term Remuneration Redemption 1
Alcobendas sports complex (*) Alcobendas town council
50 years User charges
At end of concession term
2 San Sebastián de los Reyes – La Viña Shopping Centre, sports complex, car park and public spaces (*)
San Sebastián de los Reyes town council
50 years User charges
The municipal council can extend the concession term to 60 years
3 Underground car park at Huercal - Overa (Almeria) (*)
Huercal-Overa town council
30 years User charges Subject to successive term extensions
Alcobendas underground car park (*)
Alcobendas town council
75 years User charges At end of concession term 4
(*) Operative concessions
Operating income from these concessions totalled €5.552k in 2015 (2014: €3.640k).

30
At the end of each fiscal year, the Group analyses the yield on each service concession asset in order
to detect indicators of impairment, loss of value or asset recovery. The different internal and external
circumstances that could result in impairment, such as the market value of assets, the evolution of
business plans, changes in management (page 34), changes in the legal, fiscal, economic
environment, etc.) evolution of interest rates, obsolescence or physical deterioration are evaluated.
With regard to concession contracts, the Company is complying with the terms of the business plans
for each project, although operating losses are expected in the first few years. The validity and
progress of those plans are reviewed annually. At the end of 2015 and 2014, no indications of
impairment were detected regarding the concession assets recorded under this heading.
6. Property, plant and equipment
The reconciliation of the carrying amount the items comprising property, plant and equipment at the
beginning and end of the period is as follows:
Thousand euro
Land and buildings Plant and other
PPE Total
Balance at 1/01/2014
Cost 2,636 74,333 76,969 Accumulated depreciation (701) (41,121) (41,822)
Carrying amount 1,935 33,212 35,147
Additions 100 13,459 13,559 Decreases - (685) Depreciation charge (92) (5,993)
Derecognition of accumulated depreciation - 190
Balance at 31/12/2014
Cost (2,636) 74,333 76,969 Accumulated depreciation (701) (41,121) (41,822)
Carrying amount 1,935 33,212 35,147
Additions 74 20,760 20,834 Decreases - (2,036) (2,036) Depreciation charge (97) (7,662) (7,719) Derecognition of accumulated depreciation - 169 169
Balance at 31/12/2015
Cost 2,710 93,057 95,767 Accumulated depreciation (798) (48,574) (49,372)
Carrying amount 1,912 44,483 46,395
a) Impairment losses
The Company neither recognised new impairment losses nor reversed previously recognised
impairment losses on any item of property, plant and equipment in either 2015 or 2014.
b) Property, plant and equipment located abroad
At 31 December 2015, the carrying amount of items of property, plant and equipment located

31
outside Spain (plant and other PPE) was €538k (2014: €538k). Accumulated depreciation on these
assets stands at €530k (2014: €498k).
c) Fully-depreciated assets
At 31 December 2015, there were fully depreciated items of property, plant and equipment still in use
with an original cost of €20.509k (2014: €17.050k).
d) Assets under finance lease
“Plant and other items of PPE” includes the following amounts held under finance leases in which the
Company is the lessee:
Thousand euro
2015 2014
Capitalised finance lease cost 6,805 6,805
Accumulated depreciation (6,805) (6,758)
Carrying amount - 47
Finance lease agreements entered into by the Company mainly relate to the acquisition of computer
equipment. These contracts have an average term of 3 years.
e) Assets under operating lease
The 2015 income statement recognises operating lease expense related to office rentals in the amount
of €18,530k (2014: €19,964k).
f) Insurance
The Company's policy is to write any insurance policies deemed necessary to cover risks to which its
property, plant and equipment are exposed. 7. Analysis of financial instruments
7.1 Analysis by category
The carrying amount of the financial instrument categories established in the rules for recognition
and measurement of financial instruments, with the exception of equity investments in Group
companies, jointly-controlled entities and associates (Note 8.a), are follows:
a) Financial assets:
Thousand euro
At 31 December 2015 Other
At fair value through profit
or loss (Note 9)
Loans and receivables
(Notes 8 & 10)
Hedging derivatives (Note 11)
Cash and cash
equivalents (Note 14)
Equity instruments 885 - - - -
Derivatives - - - 4,112 -
Other financial assets - - 14,643 - -
Non-current 885 - 14,643 4,112 -
Debt securities - 40,448 - -
Derivatives - - 12,905 -
Other financial assets - - 2,201,834 - 314,678
Current - 40,488 2,201,834 12,905 314,678

32
Thousand euro
At 31 December 2014 Other
At fair value through profit
or loss (Note 9)
Loans and receivables
(Notes 8 & 10)
Hedging derivatives (Note 11)
Cash and cash
equivalents (Note 14)
Equity instruments 885 - - - -
Derivatives - - - 1,681 -
Other financial assets - - 13,559 - -
Non-current 885 - 13,559 1,681 -
Debt securities - 39,711 - - -
Derivatives - - - 32,394 -
Other financial assets - - 1,390,369 - 262,856
Current - 39,711 1,390,369 32,394 262,856
b) Financial liabilities:
Thousand euro
2015 2014
Debts and other payables (Notes
22 & 24)
Hedging derivatives (Note 11)
Debts and
other payables
(Notes 22 & 24)
Hedging derivatives (Note 11)
Debts to credit institutions (Note 20) 155,584 - 23,414 - Derivatives - - - 11,813
Other financial liabilities 2,106 - 669 -
Non-current 157,690 - 24,083 11,813
Debts to credit institutions (Note 20) 15,759 - 3,559 - Derivatives - 80.091 - 86,990
Other financial liabilities 2,531,878 - 1,736,687 -
Current 2,547,547 80,091 1,740,246 86,990
8. Investments in group companies, jointly-controlled entities and associates
The breakdown of investments in group companies, jointly controlled entities and associates is as
follows:
Thousand euro
2015 2014
Non-current assets - Equity investments in group companies, jointly-controlled entities and associates (a) 91,622 79,987 Current assets - Investments in group companies, jointly-controlled entities and associates (b) 488,438 295,976
(a) Non-current assets - Equity investments in group companies, jointly-controlled entities and
associates
This heading reflects the Company’s equity investments in group companies, jointly-controlled

33
entities and associates.
In 2015, dividends received amounted to €1.236k (2014: €151.057k) and are recognised as finance
income in the income statement (Note 27).
In 2015, the following companies were incorporated:
- Tecnicas Reunidas UK, Ltd.
- TR Inzynieria i Budownictwo.
- Tecnicas Reunidas US, LLC
- Tecnicas Reunidas Mexico, Ingenieria y Cosntrucción.
- Tecnicas Reunidas Mexico, Servicios
- TR Sagemis Italia, S.R.L.
In 2014, the following companies were incorporated:
- Tecnicas Reunidas of Talara, S.A.C.
- TR Peru Ingeniería y Construcción, S.A.C.
- Tecnicas Reunidas Malaysia SDN. BHD
- TR Tecreun República Dominicana, S.R.L.
- Empresarios Agrupados S.R.L. de C.V.
In addition, during the year the Company acquired the remaining 25% in Técnicas Reunidas Gulf,
Ltd. for €14.645k.
The breakdown of investments in group companies, jointly-controlled entities and associates at year-
end 2015 and 2014 is follows:
31.12.14 Altas
Bajas 31.12.15 Investments in group companies, multigroup and associated 123,198 25,057- - 148,255 Capital not paid (1,191) - - (1,191)
Impairment of investments (42,020) (13,442) - (55,442)
Total 79,987 11,635 - 91,622
Investments in group companies, multigroup and associated 96,176 - (72) 123,198 Capital not paid (1,150) 80.091 - (1,191)
Impairment of investments (40,845) - 2,221 (42,020)
Total 54,181 23,657 2,141 79,987
The main source of impairment is the Bolivia subsidiary in the amount of €11,274,000. In addition, a provision for
risks and expenses was set up in the amount of €24,871,000 euros in relation to the Canadian subsidiary for the
proportional part of the negative equity. No provisions for impairment were set up for the company TR Saudia
since the losses were considered exceptional and Técncicas Reunidas has a history of profits in that geographical
area. In addition, the business plan includes signed contracts for new projects with positive margins that will
generate sufficient asset value.
31.12.13 31.12.14

34
Participaciones empresas grupo, multigrupo y asociadas 2015
Patrimonio neto
Compañía Domicilio Actividad Part. Directa Part. Indirecta
Valor neto contable
Capital Reservas Resultados
Dividendos
Comercial Técnicas Reunidas, S.L. MADRID PROMOCION COMERCIAL 100,00% - - - - - - Técnicas Reunidas Internacional, S.A. MADRID SERVICIOS INGENIERIA 100,00% - 120 120 1.814 5 - Técnicas Reunidas Australia Pty. MELBOURNE SERVICIOS INGENIERIA 100,00% - - - 2.550 298 - Termotécnica, S.A. MADRID MAYORISTA MAQUINARIA 99,98% - 300 781 1.080 (184) - TR Construcción y Montaje S.A. MADRID PROMOCION INMOBILIARIA 100,00% - 150 332 1.165 17 - Técnicas Reunidas Ecología, S.A. MADRID SERVICIOS INGENIERIA 100,00% - 120 120 1.404 5 - Técnicas Reunidas Metalúrgicas, S.A. MADRID SERVICIOS INGENIERIA 100,00% - 60 120 2.349 (107) - Técnicas Reunidas Trade Panamá, S.A. PANAMA PROMOCION COMERCIAL 100,00% - 46 46 56 - - Española de Investigación y Desarrollo S.A. MADRID SERVICIOS INGENIERIA 100,00% - 438 90 11.381 475 - TR Proyectos Internacionales, S.A. MADRID PROMOCION Y CONTRATACION 100,00% - - 1.503 (728) (219) - Técnicas Reunidas Venezuela S.A CARACAS PROMOCION COMERCIAL 100,00% - 9 - - - - Layar, S.A. MADRID GESTION DE EMPRESAS 100,00% - 5.483 1.085 4.398 168 - Initec Plantas Industriales, S.A. MADRID SERVICIOS INGENIERIA 100,00% - 4.613 6.600 134.217 (33.640) - Initec Infraestructuras, S.A. MADRID SERVICIOS INGENIERIA 100,00% - 1.322 1.800 1.563 (1.535) - Técnicas Reunidas Ecuador S.A. QUITO SERVICIOS INGENIERIA 100,00% - 3 - - - - Técnicas Reunidas Gulf L.T.D. YEDAH SERVICIOS INGENIERIA 100,00% - 30.376 550 49.982 4.766 - ReciclAguilar, S.A. MADRID SERVICIOS INGENIERIA 80,00% - - 60 (369) - - Técnicas Reunidas Hellas S.A. ATENAS SERVICIOS INGENIERIA 100,00% - - 60 (1.149) 155 - Técnicas Reunidas Netherlands B.V LA HAYA SERVICIOS INGENIERIA 100,00% - 18 18 1.141 (1.778) 2 TR De Construcao Unip. LDA LISBOA SERVICIOS INGENIERIA 100,00% - - 3.500 (31.745) (2.542) - TR SNG Alliance Ltd. CHIPRE SERVICIOS INGENIERIA 30,00% - 38 - - - - TR Algerie S.A. ARGELIA SERVICIOS INGENIERIA 100,00% - 2 - - - - Servicios Unidos S.A. CARACAS SERVICIOS INGENIERIA 100,00% - 74 - - - - TR Hungary Dufi CCGT Kft HUNGRIA SERVICIOS INGENIERIA 80,00% 20,00% 2 2 638 73 - TR Rup Insaat Ve TaahhüT L.S. TURQUIA SERVICIOS INGENIERIA 80,00% 20,00% 32 40 60.627 10.373 - TR Brasil Participaçoes Ltd. BRASIL SERVICIOS INGENIERIA 50,00% - 7 - - - - TR Tec Ltda BOLIVIA SERVICIOS INGENIERIA 15,00% 85,00% 11.771 2 149.085 (70.615) - TR Canada INC CANADA SERVICIOS INGENIERIA 15,00% 85,00% 6 39 27.887 (194.302) - TR Engineers India Private LTD INDIA SERVICIOS INGENIERIA 100,00% - 10 7 442 205 - TR Saudi Arabia LLC JEDDAH SERVICIOS INGENIERIA 50,00% 50,00% - 479 (832) 271 - Al Hassan Técnicas Reunidas Project LLC OMAN SERVICIOS INGENIERIA 100,00% - 19 - - - - TR Saudia for Services and Contracting Co. Limited AL-KHOBAR SERVICIOS INGENIERIA 50,00% 50,00% 25.013 504 26.737 (95.333) - Treunidas Mühendislik ve İnsaat A.S ESTAMBUL SERVICIOS INGENIERIA 100,00% - 905 905 (9) (132) - TSGI Mühendislik İnşaat Limited Şirketi ESTAMBUL SERVICIOS INGENIERIA 30,00% - 75 203 5.446 20.064 - Tecnicas Reunidas de Talara, S.A.C. PERU SERVICIOS INGENIERIA 100,00% - 449 528 (14.816) 19.706 - TR Tecreun República Dominicana, S.R.L. REP. DOMIN. SERVICIOS INGENIERIA 100,00% - 2 2 29 1.147 - Tecnicas Reunidas Malaysia SDN. BHD MALASIA SERVICIOS INGENIERIA 100,00% - 207 243 (26.463) (3.193) - Heymo Ingeniería, S.A. MADRID SERVICIOS INGENIERIA 100,00% - 757 903 1.895 (833) - TR Servicios S.R.L. de C.V. MEXICO D.F. SERVICIOS INGENIERIA 100,00% - 4 6 (2) 27
Técnicas Reunidas USA L.L.C. EEUU SERVICIOS INGENIERIA 100,00% - - 27 (40) (2)
TR Sagemis Italia S.R.L. ITALIA SERVICIOS INGENIERIA 100,00% - 495
Total participación en Empresas del Grupo 82.506
EMPRESAS ASOCIADAS Y MULTIGRUPO
Layar Castilla, S.A. MADRID PROMOCION INMOBILIARIA 25,39% - 427 685 994 12 - Empresarios Agrupados, A.I.E. MADRID SERVICIOS A EMPRESAS 34,40% 8,60% 39 162 588 - - Empresarios Agrupados Internacional, S.A. MADRID SERVICIOS A EMPRESAS 34,40% 8,60% 264 1.202 10.109 1.223 516 KJT Engehnaria Materiais MADEIRA SERVICIOS INGENIERIA 33,33% - - 5 (291) 2.323 718 Ibérica del Espacio MADRID SERVICIOS INGENIERIA 39,09% 9,78% 3.650 4.459 4.125 2.178 - Master S.A. de Ingeniería y Arquitectura MADRID SERVICIOS INGENIERIA 40,00% - - 152 (867) 15 - Proyectos Ebramex, S. de R.L. de C.V. MEXICO D.F. SERVICIOS INGENIERIA 33,33% - - 21.639 (32.191) (592) - Minatrico, S. de R.L. de C.V. MEXICO D.F. SERVICIOS INGENIERIA 33,33% - 4.287 41.289 (28.962) 535 - Otras
449
Total participación en Empresas Asociadas y multigrupo 9.116
Total 91.622
Equity at year-end 2012

35
Participaciones empresas grupo, multigrupo y asociadas 2014 Patrimonio neto
Compañía Domicilio Actividad Part. Directa
Part. Indirecta
Valor neto contable
Capital Reservas Resultados
Dividendos
Comercial Técnicas Reunidas, S.L. MADRID PROMOCION COMERCIAL 100,00% - - - - - - Técnicas Reunidas Internacional, S.A. MADRID SERVICIOS INGENIERIA 100,00% - 120 120 1.770 44 - Técnicas Reunidas Australia Pty. MELBOURNE SERVICIOS INGENIERIA 100,00% - - 1 2.157 822 - Termotécnica, S.A. MADRID MAYORISTA MAQUINARIA 99,98% - 300 781 1.102 -195 - TR Construcción y Montaje S.A. MADRID PROMOCION INMOBILIARIA 100,00% - 150 332 1.164 1 - Técnicas Reunidas Ecología, S.A. MADRID SERVICIOS INGENIERIA 100,00% - 120 120 1.383 21 - Técnicas Reunidas Metalúrgicas, S.A. MADRID SERVICIOS INGENIERIA 100,00% - 60 120 2.490 -17 - Técnicas Reunidas Trade Panamá, S.A. PANAMA PROMOCION COMERCIAL 100,00% - 46 46 45 - - Española de Investigación y Desarrollo S.A. MADRID SERVICIOS INGENIERIA 100,00% - 438 90 7.945 3.436 - TR Proyectos Internacionales, S.A. MADRID PROMOCION Y CONTRATACION 100,00% - - 1.503 392 -38 - Técnicas Reunidas Venezuela S.A CARACAS PROMOCION COMERCIAL 100,00% - 9 - - - - Layar, S.A. MADRID GESTION DE EMPRESAS 100,00% - 6.057 1.085 4.294 103 - Initec Plantas Industriales, S.A. MADRID SERVICIOS INGENIERIA 100,00% - 4.613 6.600 118.565 15.770 -150.000 Initec Infraestructuras, S.A. MADRID SERVICIOS INGENIERIA 100,00% - 1.322 1.800 5.463 66 - Técnicas Reunidas Ecuador S.A. QUITO SERVICIOS INGENIERIA 100,00% - 3 - - - - Técnicas Reunidas Gulf L.T.D. YEDAH SERVICIOS INGENIERIA 100,00% - 30.376 550 51.011 -1.258 - ReciclAguilar, S.A. MADRID SERVICIOS INGENIERIA 80,00% - - 60 -324 - - Técnicas Reunidas Hellas S.A. ATENAS SERVICIOS INGENIERIA 100,00% - 60 60 1.857 3.455 - Técnicas Reunidas Netherlands B.V LA HAYA SERVICIOS INGENIERIA 100,00% - 18 18 1.037 124) - TR De Construcao Unip. LDA LISBOA SERVICIOS INGENIERIA 100,00% - - 3.500 -23.781 -7.708 - TR SNG Alliance Ltd. CHIPRE SERVICIOS INGENIERIA 30,00% - 38 - - - - TR Algerie S.A. ARGELIA SERVICIOS INGENIERIA 100,00% - 2 - - - - Servicios Unidos S.A. CARACAS SERVICIOS INGENIERIA 100,00% - 74 - - - - TR Hungary Dufi CCGT Kft HUNGRIA SERVICIOS INGENIERIA 80,00% 20,00% 2 2 653 -16 - TR Rup Insaat Ve TaahhüT L.S. TURQUIA SERVICIOS INGENIERIA 80,00% 20,00% 32 40 27.999 43.024 - TR Brasil Participaçoes Ltd. BRASIL SERVICIOS INGENIERIA 50,00% - 7 - - - - TR Tec Ltda BOLIVIA SERVICIOS INGENIERIA 15,00% 85,00% - 24.840 -16.245 -4.365 - TR Canada INC CANADA SERVICIOS INGENIERIA 15,00% 85,00% 6 39 4.295 11.863 - TR Engineers India Private LTD INDIA SERVICIOS INGENIERIA 100,00% - 10 7 210 207 - TR Saudi Arabia LLC JEDDAH SERVICIOS INGENIERIA 50,00% 50,00% - 479 -795 -6 - Al Hassan Técnicas Reunidas Project LLC OMAN SERVICIOS INGENIERIA 100,00% - 19 - - - - TR Saudia for Services and Contracting Co. Limited AL-KHOBAR SERVICIOS INGENIERIA 50,00% 50,00% 25.013 504 26.553 6.692 - Treunidas Mühendislik ve İnsaat A.S ESTAMBUL SERVICIOS INGENIERIA 100,00% - 905 905 2 95 - TSGI Mühendislik İnşaat Limited Şirketi ESTAMBUL SERVICIOS INGENIERIA 30,00% - 75 203 2.169 5.679 - Tecnicas Reunidas de Talara, S.A.C. PERU SERVICIOS INGENIERIA 100,00% 449 528 -8 800 - TR Tecreun República Dominicana, S.R.L. REP. DOMIN. SERVICIOS INGENIERIA 100,00% 2 2 1 16 - Tecnicas Reunidas Malaysia SDN. BHD MALASIA SERVICIOS INGENIERIA 100,00% 207 243 -7.119 1.398 -
Total participación en Empresas del Grupo 70.403
EMPRESAS ASOCIADAS Y MULTIGRUPO
Heymo Ingeniería, S.A. MADRID SERVICIOS INGENIERIA 39,98% - 517 903 3.212 -1.644 - Layar Castilla, S.A. MADRID PROMOCION INMOBILIARIA 25,39% - -147 685 984 14 - Empresarios Agrupados, A.I.E. MADRID SERVICIOS A EMPRESAS 34,40% 8,60% 69 162 588 - - Empresarios Agrupados Internacional, S.A. MADRID SERVICIOS A EMPRESAS 34,40% 8,60% 264 1.202 9.901 1.760 - KJT Engehnaria Materiais MADEIRA SERVICIOS INGENIERIA 33,33% - - 5 1.856 7 - Ibérica del Espacio MADRID SERVICIOS INGENIERIA 39,09% 9,78% 2.451 3.147 2.219 217 - Master S.A. de Ingeniería y Arquitectura MADRID SERVICIOS INGENIERIA 40,00% - - 152 870 -1.737 - Proyectos Ebramex, S. de R.L. de C.V. MEXICO D.F. SERVICIOS INGENIERIA 33,33% - - 21.639 -28.270 -941 - Minatrico, S. de R.L. de C.V. MEXICO D.F. SERVICIOS INGENIERIA 33,33% - 5.991 41.289 -24.212 898 - Otras 369
Total participación en Empresas Asociadas y multigrupo 9.544
Total 79.987

36
None of the Company’s subsidiaries, jointly-controlled entities or associates is publicly listed.
b) Current assets - Investments in group companies, jointly-controlled entities and associates
Thousand euro
2015 2014
Loans and receivables 486,281 145,224
Other financial assets 2,157 150,752
Total 488,438 295,976
The breakdown by credit of company group at 31 December 2015 is:
Credits for tax purposes
Other credits Dividends pending
collection
Initec Plantas Industriales, S.A.
56,186 172,881 -
TR Saudia LTD
- 156,408 -
Tecnicas Reunidas de Talara, S.A.C.
- 23,819 -
TR De Construcao Unip. LDA
- 28,244 -
Layar, S.A.
4,756 9,071 -
TR Canada INC
- 12,500 -
Técnicas Reunidas Internacional, S.A.
3,165 - 3,000
Otras empresas del grupo, asociadas y UTEs 3.924 14,484 -
Current Total
68,031 417,407 3,000
At 31 December 2015, loans to Group companies includes €68.040k (2014: €30.043k) relating to tax receivables arising from income taxes payable by the companies comprising the consolidated tax group (Note 25). The rest of this balance corresponds to trade credit extended to Group companies, associates and UTEs, relating primarily to engineering services. The recoverability of the loans made to companies of the Técnicas Reunidas Group are evaluated based on the business plans submitted by those subsidiaries, which are in turn based on their current customer portfolios The loans to partners in UTEs and joint ventures earn interest at market Euribor + 1,5% (2014: Euribor + 1,5%).
At year-end 2015, “Other financial assets” corresponding to dividend pending to collect from Group
companies.
The carrying amount of loans to Group companies and other financial assets above does not differ
materially from the fair values of these financial assets.

37
9. Financial assets at fair value through profit or loss
Set out below is an analysis of this heading showing movements:
Thousand euro
2015 2014
- Investments in short-term fixed income securities 31,468 18,258
- Investments in listed equity securities 9,020 21,453
40,488 39,711
All these financial assets are designated as held for trading. Financial assets at fair value through profit or loss are presented within cash flows from operating activities as part of changes in working capital in the statement of cash flows. Financial assets at fair value through profit and loss represent investments in listed equities and short-term fixed-income securities. The fair value of these securities at 31 December 2014 was determined based on year-end closing prices. Returns on fixed-income securities are tied to trends in eurozone interest rates.
The movement of this investments in 2015 and 2014 is:
2015 2014
Saldo a 1 de enero 39,711 38,175
Additions 5,001 2,139
Disposals (5,040) (2,171)
Results for change in value (Nota 27) 816 1,568
Balance at 31 of december 40,488 39,711
The maximum exposure to credit risk at the reporting date is the fair value of these assets. 10. Loans and receivables 2015 2014
Trade receivables for sales and provision of services 1,451,948 835,387
Trade receivables, related parties 193,496 138,758
Sundry receivables 59,329 26,366
Debtors group company 55,774 89,526
Receivable from employees 966 760
Current income tax assets 5,069 14,084
Other tax receivables 20,347 31,983
Impairment provisions (6,962) (6,025)
1,779,967 1,130,839
The carrying amounts of trade and other receivables do not differ materially from their fair values.

38
At year-end 2015, trade receivables include €1.113.146k (2014: €633.818k) relating to completed
work pending billing, measured on the basis of the accounting criteria set forth in Note 3.14.
Miles de euros
2015 2014
Initec Plantas Industriales, S.A.
116,737 102,290
Initec Infraestructuras, S.A.
15,285 12,367
TR Tecreun República Dominicana, S.R.L.
20,223 20,115
UTE TR Volgogrado
12,483 16,446
Otras empresas del grupo, asociadas y UTEs
28,768 77,066
Total account receivable group
193,496 228,284
The movement in the provision for impairment losses on trade receivables is as follows:
Miles de euros
2015 2014
Opening balance 6,025 5,907
Provision for receivables impairment 937 118
Receivables written off during the year as uncollectible - -
Closing balance 6,962 6,025
The balance of trade receivables past due but not impaired at 31 December 2015 was €207.664k
and primarily correspond to amounts past due by more than one year (2014: €37.481k, primarily
corresponding to amounts past due by less than 6 months).
Trade receivables past due by less than six months are not deemed impaired.
No other balances included “Trade and other receivables” are deemed impaired.
The carrying amounts of trade receivables, excluding the portion pertaining to work executed
pending billing, are denominated in the following currencies:
Thousand euro
2015 2014
Euro 370,412 369,467
USD 201,189 112,443
Other currencies 95,221 15,111
Subtotal 666,822 497,021
Completed work pending certification 1,562,174 633,818
Total 2,228,996 1,130,839
The maximum exposure to credit risk at the reporting date is the carrying amount of each class of

39
receivable mentioned above.
11. Derivative financial instruments
The derivative balances at year-end 2015 and 2014 are as follows:
Thousand euro
2015 2014
Assets Liabilities Assets Liabilities
Foreign exchange forwards – cash flow hedges
17,017 80,091 33,665 98,487
Inventory forward - - 410 316
Total 17,017 80,091 34,075 98,803
Less non-current portion:
Foreign exchange forwards – cash flow hedges
4,112 - 1,681 11,813
Non-current portion 4,112 - 1,681 11,813
Current portion 12,905 80,091 32,394 86,990
Set out below is a maturity schedule for the contracts in force at 31 December 2015 and 2014:
Fair value (in euro
thousands):
Notional currency
Notional maturity (thousands)
Type of instrument 2015
2016 2017 2018 Total
Foreign currency forwards
USD / JPY 129 USD 6,084 - - 6,084 USD / EUR 15,015 USD 95,554 319,020 29,500 444,074 RUB / EUR 678 RUB 529,000 - - 529,000 CAD / EUR 1 CAD 206 - - 206 PLN / EUR 88 PLN 18,458 - - 18,458 KWD / EUR 966 KWD 31,459 - - 31,459
Raw material forwards Cooper 140
Assets 17,017
Foreign currency forwards
USD / EUR 51,146 USD 556,147 - - 556,147 USD / JPY 4,956 USD 63,859 - - 63,859 RUB / EUR 23,622 RUB 2,869,701 - - 2,869,701 USD / NOK 31 USD 2,072 - - 2,072 NOK / EUR 328 NOK 25,742 - - 25,742 PLN / EUR 8 PLN 15,773 - - 15,773
Liabilities 80,091
Net balances (63,074)

40
Fair value (in euro
thousands): Notional currency
Notional maturity (thousands)
Type of instrument 2014 2015 2016 2017 Total
Foreign currency forwards
USD / JPY 14 USD 1,941 - - 1,941
USD / EUR 27,644 USD 423,865 20,753 - 444,618
RUB / EUR 5,992 RUB 1,665,000 - - 1,665,000
CAD / EUR 15 CAD 207 103 - 310
Raw material forwards
Copper derivative (584 TN) 368
Copper derivative (65 TN) 42
Assets 34,075
Raw material forwards
Copper derivative (584 TM) 3,452 USD 21,380 - - 21,380
Copper derivative (65 TM) 47,892 USD 1,077,539 32,587 - 1,110,126
5,795 USD 87,553 1,298 - 88,850
Foreign currency forwards 29 USD 1,038 - - 1,038
USD / AUD 51 USD 2,321 - - 2,321
USD / EUR 41,268 RUB 4,538,571 1,757,720 - 6,296,291
USD / JPY
USD / GBP
USD / TRY 50
RUB / EUR 266
Liabilities 98,803
Net balances (64,728)
Set out below is a maturity schedule in fair value terms for the contracts in force at 31 December 2015 and 2014:
2015 2016 2017 2018
Total Valor razonable
Total assets, 2015 12,905 3,757 355 17,017
Total liabilities 2015 80,091 - - 80,091
Total assets, 2014 32,394 1,681 - - 34,075
Total liabilities 2014 86,990 11,813 - - 98,803
The total fair value of hedging derivatives is classified as a non-current asset or liability if the time
remaining to maturity of the hedged item is more than 12 months from the reporting date and as a
current asset or liability if the time remaining to maturity of the hedged item is less than 12 months of
that date.
The highly probable forecast transactions denominated in foreign currency that have been hedged
are expected to materialise within the forecast timeline.
The statement of recognised income and expense discloses the impact of cash flow hedges on
equity and transfers to the income statement. In FY 2015 and 2014 there were no problems worthy
of note with cash flow hedges, which are recognised in the income statement.

41
12. Inventories
This heading includes the following items in the amounts set forth below:
Thousand euro
2015 2014
Ongoing and finished construction projects 4,892 6,980
Bid presentation costs 11,203 12,775
Materials 71 71
16,166 19,826
’Ongoing and finished construction projects’ in the table above capitalise the cost of several assets (mainly car parks), as described in Note 5, in respect of the portions held for sale. Given their characteristics, a significant portion of these assets require over 12 months to ready for sale. 13. Advances to suppliers This heading includes the following ítems in the amounts set forth below:
Thousand euro
2015 2014
Group 197,379 115,627
Non Group 92,407 42,386
Advances to suppliers 289,786 158,013
The balance with the group is:
Thousand euros
2015 2014
Initec Plantas Industriales, S.A. 110.941 55.450
UTE TR Volgogrado 40.103 38.562
Rest 46.335 21.615
197.379 115.627
14. Cash and cash equivalents
Thousand euro
2015 2014
Cash 167,182 204,704
Cash equivalents 147,496 58,152
314,678 262,856
This heading includes cash (cash in hand and deposits held at call with banks) and cash equivalents
(short-term highly-liquid investments readily convertible into specific amounts of cash within a
maximum of three months, the value of which is not subject to significant risks).
In 2015 the effective average interest rate earned on short-term deposits at banks was 0.40% on
euro deposits (2014: 0.60%) and 0.65% on US dollar deposits (2014: 0.61%) and the average
deposit term was 15 days (2014: 15 days).

42
Of total cash and cash equivalents at 31 December 2015, €147,533k (2014: €164,528k) relates to
balances recorded by the joint ventures and UTEs in which the Company has shareholdings, as
indicated in Note 29.
There were no cash or cash equivalents with restricted availability at 31 December 2015. For the
purposes of the statement of cash flows, the cash balance includes cash and other cash equivalents.
15. Capital and share premium
Share capital Share
premium
Treasury shares Total
Balance at 1 January 2014 5,590 8,691 (73,371) (59,090)
Other movements - - - -
Balance at 31 December 2014 5,590 8,691 (73,371) (59,090)
Other movements - - (763) (763)
Balance at 31 December 2015 5.590 8.691 (74.134) (59.853)
a) Capital At 31 December 2015 and 2014 the total number of authorised ordinary shares was 55.896.000, each having a par value of €0.10. All issued shares are fully paid up and carry equal voting and dividend rights. There are no restrictions on the transfer of shares. According to a notice filed with the Spanish securities market regulator in June 2015, Mr. José Lladó Fernández-Urrutia holds a direct and indirect shareholding, through Araltec S.L. and Aragonesas Promoción de Obras y Construcciones, S.L. in TÉCNICAS REUNIDAS, S.A. of 37.20%. The shareholder structure of Tecnicas Reunidas, S.A. is as follows:
2015 2014
Stakeholder % Share % Share
Aragonesas Promoción de Obras y Construcciones, S.L. 5.10% 5.10%
Araltec, S.L. 31.99% 31.99%
Causeway Capital Management, LLC 5.02% 5.00%
Resto de accionistas 53.99% 51.05%
(incluyendo capital flotante )
Acciones propias 3.90% 3.85%
TOTAL 100.00% 100.00%
b) Share premium
This reserve is freely distributable.
c) Treasury shares
There were no changes in treasury stocks in fiscal years 2015 or 2014:

43
2015 2014
Number of treasury shares
Amount Number of treasury shares
Amount
Opening balance 2,154,324 73,371 2,154,324 73,371
Additions / purchases 3,890,825 165,837 - -
Decreases / sales (3,866,775) (165,058) - -
Closing balance 2,178,374 74,150 2,154,324 73,371
At 31 December 2015 treasury shares represented 3.90% of the parent company’s share capital
acquired at an average price of €38.81 per share (€34.33 per share in 2014).
On 25 June 2014, the General Shareholders Meeting authorized the acquisition of the maximum
number of treasury stock shares allowed by law for a maximum price of 75% of the acquisition value
and a maximum price of 120% of the acquisition value on the transaction date. The authorization
was granted for a five-year period as from the date of the resolution.
The Company has signed a liquidity contract with Santander Investment Bolsa , Sociedad de Valores
, SAU Under this contract will be the Spanish stock exchanges and the intended purpose will
increase the liquidity of transactions. The contract is valid for 1 year. The number of actions to the
account associated with the contract values is 55,000 and the amount allocated to the cash account
associated with the contract is 2,500 thousand euros.
16. Reserves
a) Reserves
Thousand euros
2015
2014
- Reserve 1,137
1,137
- Other Reserves 277,989 160,732
279,126
161,869
Legal reserve
The legal reserve, which is fully paid in and has been endowed in accordance with article 274 of
Spain’s Corporate Enterprises Act, may not be distributed to shareholders and may only be used to
offset losses should sufficient other reserves not be available. It may also be used to increase share
capital under certain circumstances.
Other reserves
This reserve is freely distributable.
17. Profit for the year
a) Proposed distribution of profit
The proposed distribution of 2015 profit to be put before the shareholders in general meeting and
the ratified distribution of 2014 profit is set forth below:

44
2015 2014
Basis of appropriation
Profit for the year 154,537 185,426
154,537 185,426
Appropriation to:
Reserv of capitalization 3,056 -
Reserve 76,481 110,426
Dividends 75,000 75,000 154,537 185,426
b) Interim dividend
As agreed by the Board of Directors on 18 December 2015, the Company paid an interim dividend
against 2014 profit totalling €35,830k (€0.667 per share) on January, 12 2016.
In compliance with article 277 of the Spanish Corporate Enterprises Act, as amended, enacted by Legislative Royal Decree 1/2010 of 2 July 2010, set forth below are the forecast accounting and cash statements as of the dates of payment of the interim dividends: Thousand euro
Forecast accounting statement 2015 2014
Estimated profit for the year 169,000 166,000 Estimated income tax (42,000) (31,500)
Maximum possible payout 127,000 134,500
Proposed payout (35,830) (35,846)
Surplus 91,170 98,654
Cash balance prior to payout 350,000 560,000 Interim dividend (35,830) (35,846)
Cash surplus 314,170 524,154
The €75,000k dividend charged against 2014 profits consisted of the following:
- A €35,846k interim dividend approved by the Board of Directors on 18 December 2014 and paid
on 15 January 2015. - A dividend of €39,154k pending to be approved at the AGM that will ratify the 2014 annual
accounts. 18. Translation differences
Thousand euro
2015 2014
Accumulated translation difference
(11,461)
(11,429)

45
The breakdown of the cumulative translation difference by branch at the 2015 and 2014 year ends is as follows:
Thousand euro
2015 2014
Abu Dhabi branch
(2,300) (493)
Khabarovsk branch (7,595) (9,796)
Australia branch (786) (769)
Ankara branch 928 1,221
Moscow branch (1,083) (1,845)
Others (625) 253
(11,461) (11,429)
19, Grants received The breakdown of non-repayable grants recognised under ‘Grants, donations and bequest received’ is as follows:
Grantor Euro Purpose Grant date Huercal Overa town council 534 Huercal Overa concession 28/06/2006
534
The movements in this heading during the year are as follows: Thousand euro
2015 2014
Opening balance 534 534 Additions - -
Released to income - - Other decreases - -
Closing balance 534 534
20, Provisions
Thousand euro
2015 2014
Long-term employee benefit obligations (Note 21) 984 7,969
Other provisions 85,698 70,732
Non-current 86,682 78,701
Short-term provisions 544
Current 267 544
The movement of other provisions has been:
Miles de euros
2015
2014
Initial balance 71,276
50,916
Endowtments 32,464
33,938
Aplications/Reversals (17,775)
(13,578)
Final balance 85,965
71,276

46
They refer to provisions set up to cover the negative equity of subsidiaries in the amount of €62,756,000, (2014: €32,981,000) (Note 8) and other non-current risks and expenses, a) Other provisions (non-current) This balance breaks down as follows:
Thousand euro
2015 2014
Provision for project completion - 2,000
Other provisions 85,698 68,732
Non-current 85,698 70,732
Provision for project completion: For projects that are completed or substantially completed and, therefore, are in the warranty period or are close to entering the warranty period, the Company estimates the probable costs that will be incurred during the warranty period and records the relevant provision,
Provisions for risk: It relates to provisions to cover negative equity of subsidiaries amounting to 62,756 thousand euros ( 2014: 32,981 thousand euros ) long-term ( Note 8 ) as well as other risks and expenses b) Other provisions (current)
This balance corresponds to provisions recognised in connection with current liabilities and charges,
21, Long-term employee benefit obligations
The breakdown of the amounts recognised under non-current employee benefit obligations assumed by the Company vis-à-vis its employees is as follows:
Thousand euro
2015 2014
Balance sheet commitments:
Pension and retirement benefits
984 7,969
984 7,969
Income statement charges for:
Pension and retirement benefits
- 1,025
- 1,025
Pension and retirement benefits

47
On 19 November 2015, the Madrid Commercial Court ruled that the collective agreement in question was no longer valid, resulting in the disappearance of the retirement bonus, Therefore, as of this fiscal year no further future obligations will be assumed by Group companies , At 31 December 2015 and 2014, there are no assets associated with commitments to defined benefit plans for employees, Given the negligible relevance of the amounts recognised by the Group for employee loans, no additional disclosure is required on this subject,
22, Long-Term and Short-Term Debts
Thousand euro
2015 2014
Debts to credit institutions 155,584 23,414
Finance lease obligations - -
Derivatives (Note 11) - 11,813
Other financial liabilities 2,106 669
Non-current borrowings 157,690 35,896
Debts to credit institutions 15,759 3,559
Derivatives (Note 11) 80,091 86,990
Other financial liabilities 35,969 36,007
Current borrowings 131,819 126,556
The carrying amount of borrowings (both current and non-current) approximates their fair value,
a) Debts to credit institutions The carrying amount is close to the fair value, The payables are pegged to the Euribor and are revised every 6 months, There are loans in the amount of €24,172,000 (2014: €27,200,000) to guarantee concession assets (Note 5), Set out below is a maturity schedule for the contracts in force at 31 December 2015 and 2014:
2015 2016 2017 2018 and over Total
2015 15,759 136,730 18,854 171,343
2014 3,559 3,559 3,559 16,296 26,973
The carrying amounts of debts to credit institutions are denominated in euros, and carried average effective interest rates (all of which floating) at year-end of 1,25% (2014: 1,48%), The carrying amount of borrowings (both current and non-current) approximates their fair value since the impact of discounting the cash flows would not be material, The Company has the following undrawn credit lines:
Floating rate: Thousand euro
2015 2014
– Maturing in less than one year 28,118 31,000
– Maturing in more than one year 247,825 -
275,943 31,000
b) Other financial liabilities (current)
This heading primarily reflects the Board-approved €35,846k dividend payable at year-end (2014:

48
€35,846k) (Note 16),
23, Borrowings from related parties
Thousand euro
2015 2014
Group companies 24,599 23,165
Associates 26,618 9,695
51,217 32,860
The breakdown of the items comprising this heading is as follows:
Thousand euro
2015 2014
Engineering services payable 6,465 16,184
Current loans 18,134 6,981
Group companies 24,599 23,165
Engineering services payable 800 -
Consolidation of UTEs 25,818 9,695
Associates 26,618 9,695
In 201, the balances payable to Group companies carried interest at an average rate of Euribor + 1,5%
(2014: Euribor + 1,5%),
24, Trade and other payables
Thousand euro
2015 2014
Due to suppliers 1,615,489 944,695
Trade payables, related parties 248,361 196,247
Sundry payables 10,329 1,659
Employee benefit obligations payable 648 600
Other taxes payable 60,213 31,918
Customer prepayments 569,775 524,619
2,504,815 1,699,738
Discounting has no significant effect on the fair values of trade and other payables, The nominal
values of these payables are considered a good proxy of their fair values,
The detail of suppliers, group companies and associates is as follows:
Miles de euros
2015
2014
Initec Plantas Industriales, S,A, 163,861
108,107
Initec Infraestructuras, S,A, 8,425
8,543
Técnicas Reunidas Internacional, S,A, 11,231
10,010
Branch Abu Dhabi 33,942
39,803

49
Rest 30,902
29,784
248,361
196,247
The carrying amounts of trade payables are denominated in the following currencies:
Thousand euro
2015 2014
USD 154,772 40,791
Other currencies 19,696 14,029
174,468 54,820
Information on the average period of payment to suppliers , Third additional provision , " Duty
of information" of Law 15/2010 of 5 July
As stipulated in the law of reference and in the resolution of 4 February 2016, the following information
is provided on the weighted average days to pay suppliers:
2015
Days
Weighted average days to pay suppliers 62
Number of payments made 63
Number of payments pending 60
Amount (thousands of euros)
Total payments made 1,161,497
Total payments pending 176,483
The Company is complying with the legally-mandated payment terms, with minor delays on invoices
that do not meet the contractual conditions, either due to lack of official approval, missing guarantees
or failure on the part of the supplier to meet other obligations under the signed order or service
agreement, Minor payment delays can be caused by any of these issues,
The information shown on the table above was calculated as stipulated in the resolution of 4 February
2016, For the purposes of this note, the concept of trade payables includes the miscellaneous
suppliers and creditors for amounts owed to the supplier of goods or services including the scope of
the regulation governing payment deadlines,
Since the resolution only took effect this year, there is no comparative information available for this
new obligation, since these consolidated annual accounts are considered first time accounts only
inasmuch as the application of the principle of uniformity and the comparability requirement are
concerned,
25, Income tax and tax matters
On 30 September 1993, the Spanish tax authorities authorised the following companies to apply the
tax consolidation regime: Técnicas Reunidas, S,A,, Técnicas Reunidas Internacional, S,A,,
Termotécnica, S,A,, Técnicas Reunidas Construcciones y Montajes, S,A, and Técnicas Reunidas
Ecología, S,A, Subsequently, in 1994, Técnicas Siderúrgicas, S,A,, Española de Investigación y

50
Desarrollo, S,A, and Técnicas Reunidas Proyectos Internacionales, S,A, were included in the tax
consolidation regime, The tax group was enlarged in 1998 to include Técnicas Reunidas
Metalúrgicas, S,A, and, in 1999, Layar, S,A,, Layar Castilla, S,A, and Layar Real Reserva, S,A,
Eurocontrol, S,A, and ReciclAguilar, S,A, were included in 2003 and Initec Plantas Industriales, S,A,
and Initec Infraestructuras, S,A, in 2005, In 2007, Layar Castilla, S,A, left the tax group, In 2015
Eurocontrol International Services, S,L y Euromody International Services, S,L was added,
The reconciliation of income and expenses to taxable income for 2015 is set forth below:
Thousand euro 2015
Income and expense recognised Income statement directly in equity
Recognised income and expense 154,537 154,537 Increases Decreases Increases Decreases
Income tax expense 25,846 - 25,846 - - -
Permanent differences 4,132 (117,970) (113,838) - - -
Temporary differences: 128,270 (63,946) 64,324 - - -
Taxable income (tax loss) 130,869
The breakdown of income tax expense (income) is as follows: Thousand euro
2015 2014
Current tax 38,326
32,334 Deferred tax (12,481) (18,980) Other adjustments -
25,846 13,353
The additions attributable to permanent differences correspond to the following items:
Thousand euro
2015 2014
Losses of permanent establishments 3,618 - Non-deductible expenses - 1,163 Provisions recognised 514 49,630 Double taxation dividend deduction (art 32) - -
4,132 50,793
The decreases attributable to permanent differences correspond to the following items: Thousand euro
2015 2014
Profits generated abroad 58,872 47,970
Double taxation deduction 516 150,000

51
Deduction for technology transfer 16,087 -
Loss deduction permanent cessation activity Establishments 39,946 -
Others 2,549 182
117,970 198,152
Deferred tax Thousand euro
2015 2014
Deferred tax assets
- to be recovered after more than 12 months 60,547 41,824
- to be recovered within 12 months - -
60,547 41,824
Deferred tax liabilities
- to be recovered after more than 12 months 164 4,551
- to be recovered within 12 months - -
164 4,551
The movements in deferred income tax assets and liabilities during the year are as follows:
2015 2014
Activo Pasivo
Activo
Pasivo
At 1 January 41,824 4,551
14,003
164
Reversals / Utilisations (21,543) (19,404)
(1,456)
-
Endowment 35,916 10,667 29,277
4,387
Reclassifications 4,350 4,350 - -
At 31 December 60,547 164 41,824
4,551
The deferred taxes relate to the following items: Activo por impuesto diferido
Thousand euro
2015
2014
- Pensions Plans
2,330
2,330
- Hedging reserve
9,677
11,983
- - Deferred tax related to permanent establishments 4,411 62
- Tax losses carried forward related to permanent establishments
28,329 18,716
- Provisions in portofolio 9,895
- - Provisions for liabilities and charges
5,905
8,733
60,547
41,824
Deferred tax liabilities Thousand euro
2015 2014
Hedging reserve 164 164
Taxes related to permanent establishments - 4,387
164 4,551

52
There are no unused recognised tax losses at year-end 2015 and 2014,
Deferred tax assets in respect of unused tax losses are recognised to the extent that it is probable
that future taxable profit will be available against which the losses can be utilised,
Due to the amendment introduced by Law 27/2014, according to which the general corporate income tax rate falls from 30% to 28% for the tax periods starting on and after 1 January 2015, and to 25% for the tax periods starting on and after 1 January 2016, at 31 December 2014 deferred tax assets and liabilities have been adjusted on the basis of the amount expected to be recovered or paid, respectively, The impact of these adjustments has increased the corporate income tax expense by 1,187 thousand euro (2014: €1,456k)
On 28 June 2014 the tax agency informed Técnicas Reunidas, S,A,, as the Tax Group's parent, of the start of inspection proceedings in connection with corporate income tax for the years 2008-2011, On 15 June 2015 the Company received a proposed assessment in the amount of €136,2 million plus interest, which it signed in disagreement, The assessment is based on the tax authorities’ disagreement with the principles used by the Group to support its transfer pricing study, On 10 July 2015, the proposed assessment was appealed to the tax authorities, which rejected the appeal, The Company then filed an appeal against the decision with the courts, It is the opinion of the Company’s management and its tax advisers that it is unlikely that the tax assessment will have to be paid, Management believes that there are technical arguments to support the position of Técnicas Reunidas and that the Company’s chances for success are even greater in the contentious administrative appeals process, The criterion of Técnicas Reunidas is based on the fact that the assessments signed in 2010 recognised the right to exclude the Joint Ventures in which the Técnicas Reunidas Group operates abroad and also defined the intergroup transactional model that was used by Técnicas Reunidas, with the help of its tax advisers, to develop a new transfer pricing model, In addition to the technical arguments that support this position, it is important to note that the model currently under inspection was devised on the basis of the points made by the tax authorities in the assessments signed with the tax agency in 2010, Consequently, management believes there is no need to recognise any liability whatsoever, As of the date of these Annual Accounts, the Company has not made any payments on the balances shown in the disputed tax assessments, Guarantees in the amount of €136,2 million euros for principal and €28,6 million in late interest were provided,
In the opinion of Company management and their tax advisors, there are solid grounds to uphold the
Tax Group's position, The final decision is therefore expected to be favourable to the Group's
interests,
Tax Years
Corporate income tax 2012 a 2015 Value added tax 2015 Withholding tax 2011 a 2015 Other taxes Last four years
Other information
Spanish Law 16/2012 of 27 December 2012, enacting several fiscal measures designed to further

53
the consolidation of the public finances and to shore up economic activity, affords corporate income
tax payers the option of voluntarily restating the value of certain assets (property, plant and
equipment and investment properties),
At the date of authorising these annual accounts for issue, the directors had yet to take a decision
regarding the potential restatement of any of the Company’s assets,
26, Revenue and expense
a) Revenue
The geographic breakdown of the Company’s revenue in 2015 and 2014 is as follows:
Market
Thousand euro
2015 2014
Spain 46,610 39,788
European Union 87,710 183,193
OECD (excl, Spain and EU) 503,941 306,505
Other 1,976,990 1,343,870
2,615,252 1,873,356
The revenue split by operating segment was as follows:
Business Thousand euro
2015 2014
Oil & Gas 2,310,970 1,729,862
Power 244,154 115,828
Other 60,128 27,666
Total
2,615,252 1,873,356
In fiscal years 2015 and 2014 the Company did not recognise any significant penalty or bonus for
delays, advances or any other item,
b) Foreign currency transactions
The balances corresponding to transactions denominated in foreign currency are the following:
Thousand euro
2015 2014
Sales 1,763,336 891,137
Purchases 1,139,365 164,228
Services received 299,506 27,995

54
c) Employee benefit expense
Thousand euro
2015 2014
Wages and salaries 231,831 212,851 Termination benefits 668 750 Staff welfare expenses 48,829 42,905 Charge for employee benefit obligations (Note 21) (3,000) 655
278,328 257,161
Average headcount by job category:
2015 2014
Directors and senior management 25 25 Graduates, diploma holders and administrative staff 2,526 2,370
Skilled workers 1,066 996
Sales staff 25 23
3,642 3,414
The breakdown of the Company’s year-end headcount by gender is as follows: 2015 2014
Men Women Total Men Women Total
Directors and senior management
23 2 25 23 2 25
Graduates, diploma holders and administrative staff
1,783 771 2,554 1,736 725 2,461
Skilled workers 619 460 1,079 603 432 1,035 Sales staff 16 9 25 15 9 24
2,441 1,242 3,683 2,377 1,168 3,545
Figures above include 610 subcontracted employees (2014: 780 employees)
None of the workforce presented disabilities of a severity of 33% or higher in either 2015 or 2014,
d) Other expenses
The breakdown of the income statement heading is as follows:
Thousand euro
2015 2014
Services 585,268 401,032
Rent and fees 31,623 27,412
Independent professional services 40,251 61,219
Transport expense 11,172 11,830
Repairs and maintenance 4,974 3,336
Insurance premiums 13,162 34,151
Banking and similar services 22,890 23,876
Other 19,422 26,047

55
External services 728,762 588,903
Taxes other than income tax 1,632 3,634 Losses on, impairment of and change in trade provisions (Note 20) Other operating expenses
836 (94)
8,170 (78)
731,136 600,629
27, Finance income and finance cost
Thousand euro
2015 2014
Finance income:
From equity investments:
In group companies and associates (Note 8) 1,236 151,057
In third parties - -
From marketable securities and other financial instruments:
In group companies and associates 6,162 3,911
In third parties 2,145 2,119
9,543 157,087
Finance cost:
Borrowings from related parties (67) (68)
Third-party borrowings (1,970) (2,494)
Discounting of provisions (Note 19) - (227)
(2,037) (2,789)
Change in fair value of financial instruments:
Held for trading and other securities 816 1,568
816 1,568
Exchange differences (10,158) 13,341
Financial asset impairment and disposal gains/(losses)
Impairment charges and losses (Note 8) -
(43,198) -
Finance income and finance cost (43,198) 169,207
28, Contingencies
a) Contingent liabilities The Company has contingent liabilities relating to bank sureties and other guarantees granted during the ordinary course of business, The contingent liabilities are not expected to give rise to additional material liabilities other than those already provisioned, as disclosed in Note 20, In the ordinary course of the Company's activities, as is common practice with engineering and construction companies, the Company extended guarantees to third parties totalling €3,249,641k (2014: €2,283,670k) in order to duly guarantee contract delivery, In accordance with the general terms of contracting, the Company is required to provide technical guarantees for the execution of works, in cash or in the form of bank guarantees, which must be upheld for a specified period, The Group is party to certain legal proceedings arising in the ordinary course of its business operations (mainly disputes with customers, suppliers, employees or government/tax authorities), The Group’s legal advisors believe that the outcome of these proceedings will not have a material impact on its financial situation,

56
The most noteworthy dispute involved the Sines project in Portugal, An arbitration process is underway, still in the early stage, with Técnicas Reunidas and the customer making claims against one another related primarily to the liability of the respective parties for a series of delays, The customer is also claiming damages for production losses caused by fraud, However, the plant was received to the customer’s satisfaction and payment was made in full, The performance bonds were also returned by the customer in full, The Group’s management and legal advisers therefore believe there is a very good chance that Técnicas Reunidas will prevail and that the possibility of a significant liability is remote, with no financial effect whatsoever, As regards the Hellenic Project in Greece, arbitration proceedings were initiated by Técnicas Reunidas to collect the payment of an 18 million euro balance for the engineering and supervisory service project completed in 2013, The claim was subsequently disputed by the client, Management has conducted an evaluation and determined that there is no risk of insolvency on the part of the end customer,
b) Commitments
Capital commitments
As of the balance sheet date, there are no commitments to make significant asset purchases,
Operating lease commitments
The Company rents several premises under irrevocable operating lease agreements (Note 6), These
leases have variable terms, segment clauses and renewal rights, The Company is required to
provide six months’ termination notice on these agreements,
Minimum future payments on irrevocable operating leases are as follows:
2015 2014
Less than 1 year 16,724 16,185
Between 1 and 5 years 16,566 17,298
Over 5 years - -
Purchase commitments (suppliers and subcontractors)
The Company has payment commitments to its suppliers in addition to those recognised in trade
payables as a result of orders that are still in the drafting or construction phase and cannot be
invoiced until the scheduled payment milestones are reached, This is offset by the fact that the
Company in turn invoices its customers in accordance with similar milestones to those in place with
its suppliers,
29, Temporary joint ventures (UTEs) and consortiums
The Company has interests in the UTEs listed in Exhibit I, The amounts set out below represent its
percentage interest in the assets, liabilities, revenues and expenses of these UTEs, The following
amounts are recognised in the balance sheet and income statement:

57
Assets: 2015 2014
Non-current assets 68,791 58,133
Current assets 820,776 900,604
889,567 958,737
Liabilities:
Non-current liabilities 18,801 30,062
Current liabilities 772,288 954,708
791,089 984,771
Net assets (liabilities) 98,478 (26,033)
Revenue 1,580,637 1,141,866
Expenses (1,453,913) (1,124,054)
Profit after tax 126,725 17,812
There are no contingent liabilities in relation to the Company’s shareholdings in the UTEs, nor
contingent liabilities in the UTEs and consortiums themselves,
30, Director and senior management remuneration
a) Director remuneration
There follows information on total compensation paid to members of the Company’s Board of Directors
during the years ended 31 December 2015 and 2014:
- Board meeting attendance fees received by all board members: €1,131k (2014: €1,082k), - Wages and salaries: €1,705k (2014: €1,121k), - Insurance premiums and pension plans: €7k (2014: €13k), - Services provided to the company: €257k (2014: €134k),
b) Senior management compensation
Total compensation paid in 2015 to key management personnel was €3,191k (2014 comparative:
€2,788k),
- Advances: €0k (2014: €0k),
c) Information required under article 229 of the Spanish Corporate Enterprises Act
Article 229 of Spain’s Corporate Enterprises Act, enacted by means of Legislative Royal Decree 1/2010, of 2 July 2010, obliges directors to report to the boards on which they serve, their fellow directors, or if they are sole directors, the General Meeting, on any potential direct or indirect conflict of interest vis-à-vis the entity whose interests they represent, A potentially-conflicted director must abstain from intervening in the resolutions or decisions concerning the transaction giving rise to the conflict in question, In addition, the Directors must disclose any direct or indirect shareholdings they or their related parties hold in the share capital of any other company with the same, similar or complementary corporate purpose as that of the Company, additionally disclosing the positions/duties discharged at those companies, - Mr José Lladó Fernández-Urrutia is the Chairman of Técnicas Reunidas Internacional, S,A,

58
- Mr Juan Lladó Arburúa is a non-executive director of Initec Plantas Industriales, S,A,U, Initec Infraestructuras, S,A,U, Empresarios Agrupados Internacional, S,A,, Técnicas Reunidas Internacional, S,A, Española de Investigación y Desarrollo, S,A, and Eurocontrol, S,A, He is also member of the directors’ committee of Empresarios Agrupados A,I,E, and is vice-president of Técnicas Reunidas Internacional, S,A and Eurocontrol, S,A,, as well as sole director of Técnicas Reunidas Proyectos Internacionales, S,A,
- Mr Javier Gómez Navarro Navarrete is a non-executive Director of Grupo Isolux Corsán, S,A, - Mr William Blaine Richardson is a non-executive director who sits on the International Advisory
Committee of Abengoa S,A,
31, Other related-party transactions
As indicated in Note 1, the Company is the parent company of a Group of companies, Related party transactions are as follows:
a) Transactions with the Company's core shareholders
The Company did not carry out any transactions with primary shareholders in 2015 or 2014,
b) Transactions with Company directors and officers and their related parties
The Company did not carry out any transactions with its directors in either 2015 or 2014, Note 30 provides details of the compensation paid to the directors of Técnicas Reunidas, S,A, and its senior officers,
c) Transactions with Group companies, jointly-controlled entities and associates
The table below details aggregate transactions with the Group companies, jointly-controlled entities and associates listed in Note 8:
2015 Group companies Jointly-controlled entities
and associates
Services received 344,486 -
Finance costs 67 -
Total expenses 344,553 -
Services rendered 31,383 1,716
Finance income 5,774 -
Dividends received (Note 25) 2 1,234
Total revenue 37,159 2,950

59
2014 Group companies Jointly-controlled entities
and associates
Services received 171,842 -
Finance costs 5 25
Total expenses 171,847 25
Services rendered 248,961 -
Finance income 1,698 -
Dividends received (Note 25) 150,265 792
Total revenue 400,924 792
In addition, there were no real estate purchase-sale transactions with Group companies in 2015 or 2014,
32, Environmental disclosures
Given the activities in which the Group companies are involved, it has no expenses, assets,
provisions or contingencies that could be significant in relation to its equity, financial position or
performance, Therefore, no specific disclosures relating to environmental issues are included in
these notes to the financial statements,
33, Events after the end of the reporting period
Between the balance sheet close and the date the accompanying financial statements were
authorised for issue no significant events have occurred that have not been recognised in these
financial statements,
34, Audit fees
The fees accrued for services engaged by the Company from its auditor and other audit firms in 2015 are detailed below:
The fees for services:
,Audit services: €270k (2014: €229k),
,Other work required under prevailing regulations: €80k (2014: €56k),
,PwC Firms: €153k (2014: €178k),

60
EXHIBIT I – TEMPORARY JOINT VENTURES (UTEs) AND CONSORTIUMS IN WHICH THE COMPANY HAS SHAREHOLDINGS The temporary joint ventures (UTEs) and consortiums included in these annual accounts are the following:
Nombre Actividad % Partic,
Nombre Actividad % Partic,
CONSORCIO VIETNAM SUPERVISION DE CONSTRUCCION Y PUESTA EN MARCHA 20%
UTE TR/INITEC P,I, JV TR RABIGH DP SERVICIOS INGENIERIA Y PROCURA 85% TR FRANCIA BRANCH SUPERVISION DE CONSTRUCCION Y PUESTA EN MARCHA 100%
UTE TR/INITEC PROYECTO DGC CHILE SERVICIOS INGENIERIA Y PROCURA 15%
TR KHABAROVSK BRANCH SUPERVISION DE CONSTRUCCION Y PUESTA EN MARCHA 100%
UTE TR/INTERCONTROL VARIANTE PAJARES SERVICIOS INGENIERIA Y PROCURA 80% TR MOSCU BRANCH SUPERVISION DE CONSTRUCCION Y PUESTA EN MARCHA 100%
UTE TR/IONICS RAMBLA MORALES SERVICIOS INGENIERIA Y PROCURA 40%
TR ABU DHABI BRANCH SUPERVISION DE CONSTRUCCION Y PUESTA EN MARCHA 100%
UTE TR/IONICS/TCOSA/CHSA DEP,OROPESA SERVICIOS INGENIERIA Y PROCURA 25% TR AUSTRALIA BRANCH SERVICIOS INGENIERIA Y PROCURA 100%
UTE TR/IPI ELEFSINAS SERVICIOS INGENIERIA Y PROCURA 65%
TR ANKARA BRANCH SERVICIOS INGENIERIA Y PROCURA 100%
UTE TR/IPI KHABAROVSK SERVICIOS INGENIERIA Y PROCURA 15% TR OPTARA BRANCH SERVICIOS INGENIERIA Y PROCURA 100%
UTE TR/IPI REFINERIA SINES GALP SERVICIOS INGENIERIA Y PROCURA 85%
TR VOLGOGRADO BRANCH SERVICIOS INGENIERIA Y PROCURA 100%
UTE TR/KV CON,PL,Y URB,ZALIA SERVICIOS INGENIERIA Y PROCURA 50% TR ARGELIA BRANCH SERVICIOS INGENIERIA Y PROCURA 100%
UTE TR/RTA VILLAMARTIN SERVICIOS INGENIERIA Y PROCURA 50%
TR QATAR BRANCH SERVICIOS INGENIERIA Y PROCURA 100%
UTE TR/SENER PROEYCTO HPP GEPESA SERVICIOS INGENIERIA Y PROCURA 60% TR OMAN SERVICIOS INGENIERIA Y PROCURA 100%
UTE TR/SERCOAL CENTRO DE DIA SERVICIOS INGENIERIA Y PROCURA 50%
TR POLONIA SERVICIOS INGENIERIA Y PROCURA 100%
UTE TR/SERCOAL EDIFICIO SERVICIOS MULTIPLES SERVICIOS INGENIERIA Y PROCURA 50% TR MARRUECOS BRANCH SERVICIOS INGENIERIA Y PROCURA 100%
UTE TR/TREC OPER,DESALADORA R,MORALES SERVICIOS INGENIERIA Y PROCURA 50%
UTE ALQUILACION CHILE SERVICIOS INGENIERIA Y PROCURA 15%
UTE TR/TT HORNOS RUSIA SERVICIOS INGENIERIA Y PROCURA 95% UTE EP SINES SERVICIOS INGENIERIA Y PROCURA 80%
INT,VALORIZA SERVICIOS INGENIERIA Y PROCURA 50%
UTE HDT/HDK FASE II SERVICIOS INGENIERIA Y PROCURA 15%
UTE TR RUP TURQUIA SERVICIOS INGENIERIA Y PROCURA 80% UTE HYDROCRACKER HUNGARY SERVICIOS INGENIERIA Y PROCURA 15%
UTE TR YANBU REFINERY - TRYR SERVICIOS INGENIERIA Y PROCURA 80%
UTE INITEC/TR JU'AYMAH GPE SERVICIOS INGENIERIA Y PROCURA 15%
UTE TR ABU DHABI SHAH I SERVICIOS INGENIERIA Y PROCURA 15% UTE INITEC/TR MEJILLONES SERVICIOS INGENIERIA Y PROCURA 15%
UTE PERELLO tr/vialobra SERVICIOS INGENIERIA Y PROCURA 50%
UTE INITEC/TR PLANTAS HDT Y HCK SERVICIOS INGENIERIA Y PROCURA 15%
UTE ENSA/TR CAMBIADORES TAISHAN SERVICIOS INGENIERIA Y PROCURA 50% UTE INITEC/TR RKF ARGELIA SERVICIOS INGENIERIA Y PROCURA 15%
UTE TANQUE MEJILLONES SERVICIOS INGENIERIA Y PROCURA 15%
UTE INITEC/TR SAIH RAWL SERVICIOS INGENIERIA Y PROCURA 15%
UTE TR/ESPINDESA SERVICIOS INGENIERIA Y PROCURA 25% UTE INITEC/TR TFT ARGELIA SERVICIOS INGENIERIA Y PROCURA 15%
UTE URBANIZACION PALMAS ALTAS SUR SERVICIOS INGENIERIA Y PROCURA 40%
UTE PEIRAO XXI SERVICIOS INGENIERIA Y PROCURA 50%
UTE TSK TR ASHUGANJ NORTH SERVICIOS INGENIERIA Y PROCURA 50% UTE TR POWER SERVICIOS INGENIERIA Y PROCURA 85%
UTE TR OPTARA SERVICIOS INGENIERIA Y PROCURA 85%
UTE TR/ALTAMARCA COMPLEJO LA VIÑA SERVICIOS INGENIERIA Y PROCURA 80%
UTE TR/ESPINDESA - AUGUSTUS SERVICIOS INGENIERIA Y PROCURA 85% UTE TR/ALTAMARCA PISCINA CUBIERTA SERVICIOS INGENIERIA Y PROCURA 80%
UTE TR/SGS PISTA 18 R SERVICIOS INGENIERIA Y PROCURA 50%
UTE TR/ALTAMARCA/HMF C,ALCOBENDAS SERVICIOS INGENIERIA Y PROCURA 34%
UTE FORT HILLS SERVICIOS INGENIERIA Y PROCURA 50% UTE TR/ANETO RED NORTE OESTE SERVICIOS INGENIERIA Y PROCURA 50%
UTE TR-JJC SERVICIOS INGENIERIA Y PROCURA 51%
UTE TR/ASFALTOSY CONS,APARCAM,ALCOBENDAS SERVICIOS INGENIERIA Y PROCURA 50%
UTE TR MINATITLAN SERVICIOS INGENIERIA Y PROCURA 75% UTE TR/CTCI GUANDONG EO/EG SERVICIOS INGENIERIA Y PROCURA 90%
UTE TR Integrated gas SERVICIOS INGENIERIA Y PROCURA 85%
UTE TR/CTCI JIANGSU SERVICIOS SERVICIOS INGENIERIA Y PROCURA 90%
UTE STURGEON SERVICIOS INGENIERIA Y PROCURA 15% UTE TR/CTCI JIANGSU SUMINISTROS SERVICIOS INGENIERIA Y PROCURA 90%
UTE TR Talara SERVICIOS INGENIERIA Y PROCURA 85%
UTE TR/ESPINDESA - PEL SINES SERVICIOS INGENIERIA Y PROCURA 85%
JV Sohar SERVICIOS INGENIERIA Y PROCURA 50% UTE TR/ESPINDESA - TR AKITA SERVICIOS INGENIERIA Y PROCURA 85%
JV Darsait SERVICIOS INGENIERIA Y PROCURA 50%
UTE TR/FERROVIAL LA PLANA DEL VENT SERVICIOS INGENIERIA Y PROCURA 58%
UTE PERLA VENEZUELA SERVICIOS INGENIERIA Y PROCURA 15% UTE TR/GDF AS PONTES SERVICIOS INGENIERIA Y PROCURA 50%
UTE TR DUFI HUNGRIA SERVICIOS INGENIERIA Y PROCURA 80%
UTE TR/GDF BARRANCO DE TIRAJANA SERVICIOS INGENIERIA Y PROCURA 50%
UTE TR INTEGRATED PROJECT ( TRIP ) SERVICIOS INGENIERIA Y PROCURA 65% UTE TR/GDF CTCC BESOS SERVICIOS INGENIERIA Y PROCURA 50%
UTE TR VOLGOGRAD SERVICIOS INGENIERIA Y PROCURA 15%
UTE TR/GDF CTCC PUERTO DE BARCELONA SERVICIOS INGENIERIA Y PROCURA 50%
JAZAN REFINERY AND T SERVICIOS INGENIERIA Y PROCURA 85% UTE TR/GEA COLECTOR PLUVIALES H,O, SERVICIOS INGENIERIA Y PROCURA 80%
UTE TR/INITEC INFRA CONSTRUCCI,PARCELA S SERVICIOS INGENIERIA Y PROCURA 85%
UTE TR/GEA/SANHER EL CARAMBOLO, SERVICIOS INGENIERIA Y PROCURA 40%
UTE TR/INITEC JV HAWIYAH GPE SERVICIOS INGENIERIA Y PROCURA 15% UTE TR/GUEROLA CENTRAL TERMOSOLAR SERVICIOS INGENIERIA Y PROCURA 50%
UTE TR/INITEC KJT PR, LNG SERVICIOS INGENIERIA Y PROCURA 85%
UTE TR/I,P,I, TR JUBAIL SERVICIOS INGENIERIA Y PROCURA 85%
UTE TR/INITEC MINATRICO INGENIERIA SERVICIOS INGENIERIA Y PROCURA 51% UTE TR/I,P,I, ABUH DABIH -SAS SERVICIOS INGENIERIA Y PROCURA 15%
UTE TR PHB JORDAN SERVICIOS INGENIERIA Y PROCURA 50%
UTE TSGI SOCAR SERVICIOS INGENIERIA Y PROCURA 33%
UTE TR EUROCONTROL ELORRIO SERVICIOS INGENIERIA Y PROCURA 50% UTE TR/I,P,I, C,P,BIO BIO SERVICIOS INGENIERIA Y PROCURA 15%
CONSORCIO POLONIA SERVICIOS INGENIERIA Y PROCURA 100%
UTE TR/I,P,I, FENOLES KAYAN SERVICIOS INGENIERIA Y PROCURA 85%
UTE POLONIA SERVICIOS INGENIERIA Y PROCURA 50%

61
Nombre Actividad % Partic,
Nombre Actividad % Partic,
UTE TR/I,P,I, OFFSITES ABU DHABI SERVICIOS INGENIERIA Y PROCURA 85%
CONSORCIO KUWAIT SERVICIOS INGENIERIA Y PROCURA 50% UTE TR/INITEC DAMIETTA LNG SERVICIOS INGENIERIA Y PROCURA 85%
TR KUWAIT SERVICIOS INGENIERIA Y PROCURA 100%
UTE TR/INITEC EBRAMEX INGENIERIA SERVICIOS INGENIERIA Y PROCURA 51%
EP BANGLADESH SERVICIOS INGENIERIA Y PROCURA 50% UTE TR/INITEC INFRA CONS,COMP,LA VIÑA
SERVICIOS INGENIERIA Y PROCURA 85%
EP OMAN SERVICIOS INGENIERIA Y PROCURA 100%
UTE TR/INITEC INFRA CONS,PC,HUERCAL OVERA
SERVICIOS INGENIERIA Y PROCURA 85%
EP TR JORDANIA SERVICIOS INGENIERIA Y PROCURA 50%
UTE TR TIOX SERVICIOS INGENIERIA Y PROCURA 85%
EP NORUEGA SERVICIOS INGENIERIA Y PROCURA 100% UTE TR IGD GASCO SERVICIOS INGENIERIA Y PROCURA 15%
EP SINES SERVICIOS INGENIERIA Y PROCURA 100%
UTE TR ETO SERVICIOS INGENIERIA Y PROCURA 85%
EP JORDANIA SERVICIOS INGENIERIA Y PROCURA 50% UTE TR FAHDILI SERVICIOS INGENIERIA Y PROCURA 50%
JV RAILWAY SERVICIOS INGENIERIA Y PROCURA 34%
UTE TR JJC SERVICIOS INGENIERIA Y PROCURA 51%
2014 Nombre Actividad % Partic,
Nombre Actividad % Partic,
CONSORCIO VIETNAM SUPERVISION DE CONSTRUCCION Y PUESTA EN MARCHA 20%
UTE TR/INITEC P,I, JV TR RABIGH DP SERVICIOS INGENIERIA Y PROCURA 85% TR FRANCIA BRANCH SUPERVISION DE CONSTRUCCION Y PUESTA EN MARCHA 100%
UTE TR/INITEC PROYECTO DGC CHILE SERVICIOS INGENIERIA Y PROCURA 15%
TR KHABAROVSK BRANCH SUPERVISION DE CONSTRUCCION Y PUESTA EN MARCHA 100%
UTE TR/INTERCONTROL VARIANTE PAJARES SERVICIOS INGENIERIA Y PROCURA 80% TR MOSCU BRANCH SUPERVISION DE CONSTRUCCION Y PUESTA EN MARCHA 100%
UTE TR/IONICS RAMBLA MORALES SERVICIOS INGENIERIA Y PROCURA 40%
TR ABU DHABI BRANCH SUPERVISION DE CONSTRUCCION Y PUESTA EN MARCHA 100%
UTE TR/IONICS/TCOSA/CHSA DEP,OROPESA SERVICIOS INGENIERIA Y PROCURA 25% TR AUSTRALIA BRANCH SERVICIOS INGENIERIA Y PROCURA 100%
UTE TR/IPI ELEFSINAS SERVICIOS INGENIERIA Y PROCURA 65%
TR ANKARA BRANCH SERVICIOS INGENIERIA Y PROCURA 100%
UTE TR/IPI KHABAROVSK SERVICIOS INGENIERIA Y PROCURA 15% TR OPTARA BRANCH SERVICIOS INGENIERIA Y PROCURA 100%
UTE TR/IPI REFINERIA SINES GALP SERVICIOS INGENIERIA Y PROCURA 85%
TR VOLGOGRADO BRANCH SERVICIOS INGENIERIA Y PROCURA 100%
UTE TR/KV CON,PL,Y URB,ZALIA SERVICIOS INGENIERIA Y PROCURA 50% TR ARGELIA BRANCH SERVICIOS INGENIERIA Y PROCURA 100%
UTE TR/LOGPLAN A,T,AENA SERVICIOS INGENIERIA Y PROCURA 55%
TR QATAR BRANCH SERVICIOS INGENIERIA Y PROCURA 100%
UTE TR/PAI URBANIZACION CALAFELL SERVICIOS INGENIERIA Y PROCURA 55% TR OMAN SERVICIOS INGENIERIA Y PROCURA 100%
UTE TR/RTA VILLAMARTIN SERVICIOS INGENIERIA Y PROCURA 50%
TR POLONIA SERVICIOS INGENIERIA Y PROCURA 100%
UTE TR/SEG PROY,NT AENA SERVICIOS INGENIERIA Y PROCURA 70% TR MARRUECOS BRANCH SERVICIOS INGENIERIA Y PROCURA 100%
UTE TR/SENER PROEYCTO HPP GEPESA SERVICIOS INGENIERIA Y PROCURA 60%
UTE ALQUILACION CHILE SERVICIOS INGENIERIA Y PROCURA 15%
UTE TR/SERCOAL CENTRO DE DIA SERVICIOS INGENIERIA Y PROCURA 50% UTE EP SINES SERVICIOS INGENIERIA Y PROCURA 80%
UTE TR/SERCOAL EDIFICIO SERVICIOS MULTIPLES SERVICIOS INGENIERIA Y PROCURA 50%
UTE HDT/HDK FASE II SERVICIOS INGENIERIA Y PROCURA 15%
UTE TR/SOLAER I,S,F, MORALZARZAL SERVICIOS INGENIERIA Y PROCURA 90% UTE HYDROCRACKER HUNGARY SERVICIOS INGENIERIA Y PROCURA 15%
UTE TR/TECNORESIDUOS PT VALDEMINGOMEZ SERVICIOS INGENIERIA Y PROCURA 90%
UTE INITEC/TR JU'AYMAH GPE SERVICIOS INGENIERIA Y PROCURA 15%
UTE TR/TREC OPER,DESALADORA R,MORALES SERVICIOS INGENIERIA Y PROCURA 50% UTE INITEC/TR MEJILLONES SERVICIOS INGENIERIA Y PROCURA 15%
UTE TR/TRIMTOR DEP,CAÑADA GALLEGO SERVICIOS INGENIERIA Y PROCURA 50%
UTE INITEC/TR PLANTAS HDT Y HCK SERVICIOS INGENIERIA Y PROCURA 15%
UTE TR/TRIMTOR EDAR LIBRILLA SERVICIOS INGENIERIA Y PROCURA 50% UTE INITEC/TR RKF ARGELIA SERVICIOS INGENIERIA Y PROCURA 15%
UTE TR/TT HORNOS RUSIA SERVICIOS INGENIERIA Y PROCURA 95%
UTE INITEC/TR SAIH RAWL SERVICIOS INGENIERIA Y PROCURA 15%
INT,VALORIZA SERVICIOS INGENIERIA Y PROCURA 50% UTE INITEC/TR TFT ARGELIA SERVICIOS INGENIERIA Y PROCURA 15%
UTE TR RUP TURQUIA SERVICIOS INGENIERIA Y PROCURA 80%
UTE PEIRAO XXI SERVICIOS INGENIERIA Y PROCURA 50%
UTE TR YANBU REFINERY - TRYR SERVICIOS INGENIERIA Y PROCURA 80% UTE TR POWER SERVICIOS INGENIERIA Y PROCURA 85%
UTE TR ABU DHABI SHAH I SERVICIOS INGENIERIA Y PROCURA 15%
UTE TR/ALTAMARCA COMPLEJO LA VIÑA SERVICIOS INGENIERIA Y PROCURA 80%
UTE MARGARITA SERVICIOS INGENIERIA Y PROCURA 15% UTE TR/ALTAMARCA PISCINA CUBIERTA SERVICIOS INGENIERIA Y PROCURA 80%
UTE PERELLO tr/vialobra SERVICIOS INGENIERIA Y PROCURA 50%
UTE TR/ALTAMARCA/HMF C,ALCOBENDAS SERVICIOS INGENIERIA Y PROCURA 34%
UTE ENSA/TR CAMBIADORES TAISHAN SERVICIOS INGENIERIA Y PROCURA 50% UTE TR/ANETO RED NORTE OESTE SERVICIOS INGENIERIA Y PROCURA 50%
UTE TANQUE MEJILLONES SERVICIOS INGENIERIA Y PROCURA 15%
UTE TR/ARDANUY ALGECIRAS SERVICIOS INGENIERIA Y PROCURA 70%
UTE TR/SEG PORTAS SERVICIOS INGENIERIA Y PROCURA 50% UTE TR/ASFALTOSY CONS,APARCAM,ALCOBENDAS
SERVICIOS INGENIERIA Y PROCURA 50%
UTE TR/ESPINDESA SERVICIOS INGENIERIA Y PROCURA 25%
UTE TR/CTCI GUANDONG EO/EG SERVICIOS INGENIERIA Y PROCURA 90%
UTE URBANIZACION PALMAS ALTAS SUR SERVICIOS INGENIERIA Y PROCURA 40% UTE TR/CTCI JIANGSU SERVICIOS SERVICIOS INGENIERIA Y PROCURA 90%
UTE TSK TR ASHUGANJ NORTH SERVICIOS INGENIERIA Y PROCURA 50%
UTE TR/CTCI JIANGSU SUMINISTROS SERVICIOS INGENIERIA Y PROCURA 90%
UTE TR OPTARA SERVICIOS INGENIERIA Y PROCURA 85% UTE TR/ESPINDESA - PEL SINES SERVICIOS INGENIERIA Y PROCURA 85%
UTE TR/ESPINDESA - AUGUSTUS SERVICIOS INGENIERIA Y PROCURA 85%
UTE TR/ESPINDESA - TR AKITA SERVICIOS INGENIERIA Y PROCURA 85%
UTE TR/SGS PISTA 18 R SERVICIOS INGENIERIA Y PROCURA 50% UTE TR/FERROVIAL LA PLANA DEL VENT SERVICIOS INGENIERIA Y PROCURA 58%
UTE FORT HILLS SERVICIOS INGENIERIA Y PROCURA 50%
UTE TR/GDF AS PONTES SERVICIOS INGENIERIA Y PROCURA 50%
UTE TR-JJC SERVICIOS INGENIERIA Y PROCURA 51%

62
Nombre Actividad % Partic,
Nombre Actividad % Partic,
UTE TR/GDF BARRANCO DE TIRAJANA SERVICIOS INGENIERIA Y PROCURA 50%
UTE TR MINATITLAN SERVICIOS INGENIERIA Y PROCURA 75% UTE TR/GDF CTCC BESOS SERVICIOS INGENIERIA Y PROCURA 50%
UTE TR Rapid SERVICIOS INGENIERIA Y PROCURA 85%
UTE TR/GDF CTCC PUERTO DE BARCELONA SERVICIOS INGENIERIA Y PROCURA 50%
UTE TR Integrated gas SERVICIOS INGENIERIA Y PROCURA 85% UTE TR/GEA COLECTOR PLUVIALES H,O, SERVICIOS INGENIERIA Y PROCURA 80%
UTE STURGEON SERVICIOS INGENIERIA Y PROCURA 15%
UTE TR/GEA/SANHER EL CARAMBOLO, SERVICIOS INGENIERIA Y PROCURA 40%
UTE TR Talara SERVICIOS INGENIERIA Y PROCURA 85% UTE TR/GUEROLA CENTRAL TERMOSOLAR SERVICIOS INGENIERIA Y PROCURA 50%
JV Sohar SERVICIOS INGENIERIA Y PROCURA 50%
UTE TR/I,P,I, TR JUBAIL SERVICIOS INGENIERIA Y PROCURA 85%
JV Darsait SERVICIOS INGENIERIA Y PROCURA 50% UTE TR/I,P,I, ABUH DABIH -SAS SERVICIOS INGENIERIA Y PROCURA 15%
UTE PERLA VENEZUELA SERVICIOS INGENIERIA Y PROCURA 15%
UTE TSGI SOCAR SERVICIOS INGENIERIA Y PROCURA 33%
UTE TR DUFI HUNGRIA SERVICIOS INGENIERIA Y PROCURA 80% UTE TR/I,P,I, C,P,BIO BIO SERVICIOS INGENIERIA Y PROCURA 15%
UTE TR INTEGRATED PROJECT ( TRIP ) SERVICIOS INGENIERIA Y PROCURA 65%
UTE TR/I,P,I, FENOLES KAYAN SERVICIOS INGENIERIA Y PROCURA 85%
UTE TR VOLGOGRAD SERVICIOS INGENIERIA Y PROCURA 15% UTE TR/I,P,I, OFFSITES ABU DHABI SERVICIOS INGENIERIA Y PROCURA 85%
JAZAN REFINERY AND T SERVICIOS INGENIERIA Y PROCURA 85%
UTE TR/INITEC DAMIETTA LNG SERVICIOS INGENIERIA Y PROCURA 85%
UTE TR/INITEC INFRA CONSTRUCCI,PARCELA S SERVICIOS INGENIERIA Y PROCURA 85% UTE TR/INITEC EBRAMEX INGENIERIA SERVICIOS INGENIERIA Y PROCURA 51%
UTE TR/INITEC JV HAWIYAH GPE SERVICIOS INGENIERIA Y PROCURA 15%
UTE TR/INITEC INFRA CONS,COMP,LA VIÑA SERVICIOS INGENIERIA Y PROCURA 85%
UTE TR/INITEC KJT PR, LNG SERVICIOS INGENIERIA Y PROCURA 85% UTE TR/INITEC INFRA CONS,PC,HUERCAL OVERA
SERVICIOS INGENIERIA Y PROCURA 85%
UTE TR/INITEC MINATRICO INGENIERIA SERVICIOS INGENIERIA Y PROCURA 51%

63
2015 INDIVIDUAL DIRECTORS' REPORT 1, Development of the business
Técnicas Reunidas' business model has proven to be solid as it enjoys a well-diversified portfolio of products and services, which has allowed it to attend to the differing needs of the main customers in the sector in a complex environment, The fall in oil prices that started in 2014 has had consequences for many of the members of the oil sector value chain, In addition to the habitual difficulties inherent to the execution of the projects, the long-running decline in prices has led to cuts in the investment plans of certain customers, especially those relating to exploration and production activities, This has all affected the oil services sector through delays or the cancellation of specific projects and some contractors have been forced to adjust their size to match the new market situation, and even divest assets, Due to its experience, flexible assets, broad portfolio of state customers and a downstream business approach, whose dependence on crude oil prices is notably less, Técnicas Reunidas has been less affected by the difficulties faced by many of its competitors,
There were downstream sector growth opportunities in 2015 in the Middle East, where Técnicas Reunidas already has much experience and knowledge of operations in the area, The Company was thus able to attain significant contract awards in countries such as Kuwait and Saudi Arabia, It also concluded its first equipment supply and detailed engineering contract in the United States, which has been a target market for the company over the past few years, These new contracts were concluded with well-known customers such as KNPC and SAUDI ARAMCO, and new customers have been added to the customer portfolio, such as SASOL,
Although the results obtained by Técnicas Reunidas were satisfactory, the same was not the case with the Consolidated Group, In fact, the Group has not been immune to the turbulence caused by the continuous decline in crude oil prices, The cost overruns incurred on the project in Canada associated with delays on the part of the main project supplier, as well as the high salary costs and low productivity in the country, caused a sharp deterioration of the profit obtained by TR, Even so, sales grew by 33% but the Group's operating profit fell to €82 million, The tax legislation that modifies the tax treatment of the joint ventures through which Técnicas Reunidas operates abroad entered into force in January 2015, which gave rise to an increase in the tax cost for the Group, All of this led to profits falling to €60 million,
Shares in Técnicas Reunidas showed a very different performance during the two halves of 2015, While the Company was able to maintain its contracting rhythm in a stable environment during the first half of the year, the share accumulated a 27% gain up to the end of June, and beat the performance of the Ibex-35 (+5%), During the second half of the year, when the price of oil started to fall (more than 40% between July and December), coinciding with lower growth forecasts for China, the market reacted to the fear of eventual overcapacity in the sector,
Some oil companies also announced layoffs and cuts in investments and gradually this was also the case with large oil and gas sector contractors, Despite the fact that Técnicas Reunidas' business is more resistant due to the type of product and customer to which it is directly, the share price was affected by the negative environment in the sector, As a result, shares in Técnicas Reunidas ended 2015 down 4% while the local benchmark index, the Ibex 35, lost 11%,
The Company distributed a total of €75 million in dividends charged against the net profit for 2014, which is equivalent to €1,395 per share, This figure is equal to that paid last year and represents 55% of profits, exceeding the company's pay out policy (50% of net profits),
Awarded contracts and the environment
As has already been mentioned, 2015 presented a new scenario for the oil and gas sector which is not only affected by the slow global economic recovery that still had not achieved the financial

64
stability prior to the crisis, and the outlook for demand and energy production has also changed, Investments in the oil and gas industry have a long-term focus but the adaptation to new environmental regulations, the need to renovate infrastructure and business development continue to support short-term investments in the sector, Nevertheless, in the very short-term the growing production of oil and gas production in the United States through fracking techniques, the growth of the Chinese economy at a rate slower than expected, OPEC maintaining member production rates and the imminent lifting of sanctions against Iran have all given rise to excess capacity in the market,
Despite these circumstances, the primary official bodies in the sector, the International Energy Agency and OPEC estimate sustained growth of demand for both oil and gas over the coming 25 years, once adjustments have been made to accommodate the new environment, The International Energy Agency's World Energy Outlook 2015 estimates a total investment of $68,000 billion in energy infrastructure over the coming 25 years, which is a 30% increase over the investment estimate from last year, primarily due to the future growth of renewable energies, This figure means that there will be an average investment of $2,720 billion per year, of which more than 60% will take place in non-OECD countries, The International Energy Agency estimates a total investment of more than $25,000 billion in the oil and gas sector between 2015 and 2040, which represents 37% of the overall estimated investment in energy,
Taking into account these data, Técnicas Reunidas carefully plans its position to allow it to be present in key markets and to work with those strategic customers that pursue large investment plans, Accordingly, in 2015 the Company concluded new contracts in the United Arab Emirates, Kuwait and Saudi Arabia, which are known markets, and it was also able to conclude its first relevant contract in a new market such as the United States,
a) Refining and Petrochemicals
In July TR was selected by Kuwait National Petroleum Company (KNPC) to execute the processing unit project at the new Al-Zour refinery, which will be the highest capacity refinery in the Middle East, The contract was awarded on a turnkey basis to the international consortium led by Técnicas Reunidas (Spain), Sinopec Engineering Group (China) and Hanwha Engineering and Construction (South Korea) for approximately $4,100 million over 45 months, TR is the majority shareholder with a 50% interest and therefore more than $2,000 million will be accrued, The project will be developed at the Técnicas Reunidas office in Madrid, The new refinery will represent a total investment of $13,000 million and has the objective of producing and supplying oil derivative products with ultra-low sulphur content to satisfy both domestic and international demand, The scope of the TR contract includes the engineering, supply, construction and launch of the following refinery units: 3 crude oil distillation units, 3 residue desulfurization units, 3 diesel hydrotreating units, 2 naphtha hydrotreating units, 2 kerosene hydrotreating units, a saturated gas unit and a heavy crude cooling unit,
This project provides continuity to TR's experience in Kuwait, where it is carrying out another important recently awarded gas project for KNPC which, together with this contract award, represent a total of $6,000 million that TR will have to manage in that country over the coming years,
In October the multinational SASOL awarded TR a contract for the construction of the Guerbet alcohol and the Ethoxylation (ETO) plants at SASOL's Lake Charles petrochemical complex in Westlake, Louisiana, The scope of the contract includes the engineering, supply and the construction of the two plants, It is the last project awarded for this new large petrochemical complex built by SASOL in the United States, Alcohol ethoxylates are surfactants used in products such as detergents, surface cleaners and cosmetics, as well as in agricultural, textile and paint products, Guerbet alcohols are used in cosmetics, detergents and antifreeze, and as lubricating oil additives, among other

65
things, The project has an estimated execution schedule of 30 months and will be carried out at TR's offices in Madrid and the United States, This new project is of great importance to TR given that it has been selected by such a notable company as SASOL,
The rest of the projects that make up the portfolio of contracts awarded in prior years continued to follow their habitual schedule, The projects that most contributed to the division's revenues at the year-end were: the STAR refinery for SOCAR in Turkey, the modernization project at the Talara refinery for Petroperu in Peru, the RAPID refinery complex for Petronas in Malaysia and the refinery and the integration and Jazan IGCC auxiliary facility project for Saudi Aramco in Saudi Arabia,
In 2015 important projects were completed, such as the modernization of the Izmit refinery for Tüpras in Turkey and the Petrokemya petrochemical project for Sabic in Saudi Arabia, Both projects were completed in compliance with the specifications and deadlines required by the customer,
b) Natural gas
During the last quarter, Saudi Aramco awarded TR the execution of two turnkey contracts for the FADHILI gas plant, TR will perform all of the detailed engineering services, purchase and supply equipment and materials, build the plants and provide support during the launch of the units, The contract awarded to Técnicas Reunidas consists of two of the three packages into which the FADHILI program has been divided, Package 1, which is the most important one at the complex, consists of the gas receiving and processing facilities and has a value of nearly $2,000 million, Package 2 consists of the connections and the auxiliary service facilities and has a value of around $1,000 thousand, These facilities are expected to enter into operation in 2019, The FADHILI gas plant will have a total capacity of more than 70 million m³ per day, The Khursaniyah and Hasbah gas fields, which will supply the gas necessary for these projects, have been identified as the most economical alternative to comply with part of this large demand for additional gas, The Hasbah gas field is located in waters of the Gulf approximately 50 km from the coastline and the Khursaniyah gas deposit is located 30 km to the north-east of the plant, The projects will be developed close to the city of Al Jubail, which is the largest industrial area in the Middle East and the location of the largest petrochemical companies in the world, and where TR is currently executing another large project, The purpose of the FADHILI Gas Program is to support Saudi Aramco's corporate strategy in Saudi Arabia to satisfy domestic energy demand and to reduce the burning of liquid fuels by electricity plants, The peak gas demand in Saudi Arabia is currently expected to increase by 250 million standard cubic meters per day in 2013 and 340 million standard cubic meters in 2020,
The expected burning of crude oil at the energy plants in 2018 is 160,000 barrels per day, The awarding of this contract, which is the 15th contract awarded to TR by the Saudi company, once again reveals TR's excellent competitive position in the Saudi Arabian market and demonstrates how it continues to maintain the confidence of one of its most important customers, Saudi Aramco, with which it has been working without interruption since 2003,
c) Energy
The energy division has suffered the effects of the economic crisis more intensely than the other divisions due to the fact that investors encounter difficulties to obtain financing for projects and customers prefer to wait for an economic recovery that ensures the viability of those projects, In any event, since these projects are for shorter terms and are more closely associated with economic growth and consumption, customer investment decisions may be more flexibly adapted to the different market situations,

66
Over the past few years, Técnicas Reunidas has made great sales efforts outside of Spain since there are no large prospects in the local market, In 2014 contract expectations were met through 6 new turnkey projects that were diversified in terms of geographic location, customers and products, which contributed to the company recovering the activity of this division,
The Company currently identifies large short and medium-term opportunities in the sector in markets such as Canada, United States, Mexico and Europe where there are large investment plans,
2, Financial figures
The Group prepares its consolidated annual accounts in accordance with International Financial Reporting Standards adopted by the European Union, IFRS-EU,
In 2015 TR's net sales totalled €2,615 million 40% more than last year due to a higher contribution of contracts obtained in prior years, Operating profits totalled €225 million, which is 9% of revenues, Profit after taxes amounted to €155 million,
3, Research and development activities Técnicas Reunidas continues to make important R&D efforts in order to develop new technologies that allow it to obtain turnkey plants in new markets and differentiate itself from the competition in current markets by offering competitive advantages, In 2015 the José Lladó Technological Centre, which is in full service with new laboratories and pilot plant areas, has become one of the most modern and equipped centres in Spain for the business areas in which TR carries out R&D projects, The investments made over the past five years show TR's clear and decided commitment to R&D with a strategy based on the consolidation of mature technologies and the development of new technologies in various fields, using existing knowledge at the organization and making a commitment to diversification, R&D expense in 2015 was higher than last year, around €4 million to maintain the R&D investment policy,
In 2015 Técnicas Reunidas participated in the following national and European projects on an individual basis or as part of strategic consortia:
The European project GREENLION in which we develop technology for the recycling of batteries based on lithium chemistry and for which TR has a budget of €0,63 million,
The European project CERAMPOL in which the latest generation membranes for water treatment are developed with a budget of €0,65 million,
The European project RECLAIM in which TR will develop new technologies to recover rare earth and other high added value metals from electrical waste such as photovoltaic panels and fluorescent tubes, TR's budget is €1 million,
The European project DAPhNE in which we participate in the development of microwave oven technology for industrial sector applications with high energy consumption, TR's budget is €1,37 million,
The European project NECOBAUT in which TR collaborates with the development of iron/air batteries for the automotive sector, with a budget of €0,6 million,
The European project STEP in which TR participates in the scaling of new microwave oven technology applied to the natural stone industry, with a budget of €0,2 million,

67
The SAMER Project, which consists of the development of longer-lasting components for flow batteries using Zn/air technology for the massive storage of energy, with a budget of €1,65 million,
The European project WALEVA which will involve the scaling of the technology for obtaining levulinic acid from biomass to study technical/financial viability, with a budget of €1,04 million,
The European project ZAESS which will involve the scaling of the Zn/air flow battery technology developed at the laboratory level to study technical/financial viability, with a budget of €0,67 million,
The SDIL Direct Leaching of Zinc Sulphurs project with a budget of €0,84 million will develop a new technology that allows the application of the ZINCEXTM technology already implemented at the industrial level to be expanded,
The European project BUTANEXT with a budget of €0,92 million for which TR develops an innovative lignocellulosic biomass pre-treatment process for the production of bio-butanol,
The CIEN 3R2020 project, in which TR participates in the development of hydro-metallurgical processes to recover common metals in industrial and urban flows with a high metal content, TR's budget is €1,5 million,
The CIEN ESTEFI project, in which TR participates in the development of an energy storage technology based on nickel-zinc batteries for application in Intermodal transportation networks, with a budget of €1,96 million,
As a result of the investment in R&D, TR has a portfolio of technologies that it has already developed and is being implemented throughout the world, such as ZINCEXTM for the recovery of Zn and ECOLEADTM for the recovery of lead and silver, There is currently a portfolio of possible businesses for the industrial implementation of these technologies in new projects, despite the cycle of low prices for basic metals, Specifically, the Company is completing the basic engineering for the adaptation and 33% increase in the capacity of the Skorpion metallic zinc plant in Namibia, which uses the ZINCEXTM technology, The WALEVA and ZAESS projects, regarding the sustainable use of biomass and the mass storage of electricity, respectively, are in the demonstration stage and will be executed in 2016 and 2017, for which there is a high level of confidence, 4, Significant Post-balance sheet events
After the end of 2015 the circumstances that marked the economic environment and the situation of the sector throughout the second half of the year continued to be present during the first months of 2016,
The slowdown of the Chinese economy continues to be a centre of attention due to the effect that it may have on world economic growth and the low prices of oil and their influence on the profitability of new investments create uncertainty and instability in the oil and gas sectors, The market closely follows OPEC's production levels, which currently exceed demand, and the market is also awaiting the imminent lifting of sanctions against Iran, the consequences of which would have a dual effect, It would give rise to a new increase in supply to the market which would push oil prices lower but it also represents a new source of investment since it is a reserve-rich country with a large need to modernize its infrastructure, develop its own economy and to satisfy local demand, The market is anticipating the possible decision by OPEC to cut production to assist with the rebalancing of supply and demand, with the consequent impact on oil prices,

68
Although Técnicas Reunidas focuses on onshore and downstream segments and also has a customer portfolio that benefits from its exposure to national oil companies that possess large volumes of reserves and take investment decisions based on criteria independent of economic factors, it is possible that the sceptical outlook in the sector could affect all types of customers and projects, which would result in the delay of new contracts, The reality is that the drop in income due to the decline in oil prices has affected all types of customers and, consequently, could have an effect on the payment policy for projects, Customers could tend to reduce their advance payments and extend payment milestones that characterize the payment system, which could affect the Company's cash management,
Finally, the TR Consolidated Group provided an early report of 2015 profits on 15 February 2016 and revised the estimated net profit as a result of certain exceptional cost overruns affecting the improvement project in Alberta (Canada) for Canadian Natural Resources Limited (CNRL), This project was awarded in 2012, is in its final construction phase and delivery will take place in June 2016, The execution of this project was affected by specific factors relating to the instability in the oil and gas sector in Canada as a result of the sharp decline in oil prices, The main factors that negatively affected the execution of this project were: a longer than expected delay in the delivery of the final key modules, exceptional work necessary to complete those modules at the site before being assembled, costly acceleration and correction plans due to the high salary costs in Canada and average productivity that is lower than habitually seen due to current market and contracting circumstances, as well as a concentration of work that exceeded expectations in the middle of the Canadian winter in order to comply with TR's commitment to complete the project in June 2016, Técnicas Reunidas' priority is to complete projects in accordance with the terms agreed with customers and to maintain its reputation as a reliable quality contractor,
5, Acquisition of own shares, Within the framework of the liquidity agreement framework concluded with Santander, the Company increased its treasury shares to 2,178,374 shares, 6, Management of financial risks and use of financial instruments The main financial risks and management procedures are analysed in Note 3 of the accompanying notes to the annual accounts, 7, Other business risk factors The primary risks are:
- A high number of projects are contracted on a turnkey basis and the selling price is set at the start of the contract while costs generated during the execution of the projects are subject to change,
- The price of crude oil, in addition to other factors, affects the behaviour of our customers as well as our suppliers, competitors and shareholders,
- Projects are carried out in multiple geographic locations, each of which present a different risk profile to be mitigated,
o There are locations that are subject to strong political and social tensions, o Some have limited access, low skill levels in local resources, requirements
concerning local content or adverse weather, among others, o Some countries have limited legal security,
- At certain times the portfolio may show a high concentration in a low number of customers or high geographic dispersion,
- The plants that are built must satisfy the necessary environmental requirements, - Financial variables such as exchange rates, interest rates and the predisposition of
financial institutions and insurance companies to participate in projects, or tax legislation, have a significant impact on the business and the Company's results,
- A solid reputation and prior experience condition the success of future contracts,

69
8, Average number of employees at the Group by category
Category 2015
2014
Board Members 2
2 Senior managers 23
23
University graduates and technicians 2,526
2,370
Skilled workers 1,066
996
Sales personnel 25
23
TOTAL 3,642
3,414
9, Environment, Técnicas Reunidas integrates environmental sustainability in all work centres and projects in both the engineering and execution phases of the works as well as the launch and commissioning of facilities, as value added to our service, Our management system is certified in accordance with ISO 14001 and verified externally by two independent companies, It is based on the principles of the Global Pact and we report the data annually to the CDP and they are included in the Company's Integrated Annual Report, 10, Capital structure, restrictions on the transfer of shares and significant
shareholdings Share capital consists of 55,896,000 shares with a par value of €0,10 per share, There is only one class of shares and therefore they all have the same rights and obligations, There are no restrictions on the transfer of the shares, Significant shareholdings are as follows:
Company
Number of Shares
% stake
Araltec, S,L,
Direct
17,882,564
31,99%
Aragonesa de Promoción de Obras y Construcciones
Direct
2,848,383
5,10%
Causeway Capital Management LLC
Indirect
2,797,034
5,02%
11, Restrictions to voting rights In accordance with Article 16 of the bylaws at least 50 shares must be held to attend General Meetings,

70
12, Shareholder agreements By virtue of an agreement concluded between Aragonesas Promoción de Obras y Construcción, S,L,, BBVA Elcano Empresarial I, SCR and BBVA Elcano Empresarial II, SCR the following pacts were established on 23 May 2006:
- Syndicated vote commitment for the Company's governing bodies concerning the shares controlled by Mr, José Lladó Fernández Urrutia (Araltec, S,L, and Aragonesas Promoción de Obras y Construcciones, S,L,) together with the shares held by the companies BBVA Elcano Empresarial, SCR and BBVA Elcano Empresarial II, SCR, in order to ensure a majority of votes in favour of the companies controlled by Mr, José Lladó Fernández Urrutia,
- Commitment of the companies BBVA Elcano Empresarial I, SCR and BBVA Elcano
Empresarial II, SCR to remain for nearly 9 years, A progressive and optional exclusion schedule is established for the shares covered by the syndication and involvement agreements between 2010 and 2015, as well as a preferred acquisition right for Mr, José Lladó Fernández Urrutia,
13, Rules governing the appointment and removal of the members of the Board of
Directors and amendments to the bylaws The Annual Corporate Governance Report provides a detailed description of these rules relating to the Board of Directors, The most relevant aspects are: Articles 17 through 22 of the Board of Directors' Regulations govern the appointment and removal of the directors of Técnicas Reunidas, stipulating that: 1, The Directors shall be designated by the Nomination and Remuneration Committee, the General Shareholders’ Meeting or by the Board of Directors in accordance with the Spanish Companies Act, 2, The Board of Directors will ensure that the selection of candidates involves persons of recognized solvency, competence and experience, 3, In order to in order to fill an independent director position the Board of Directors may not propose or designate persons that hold any executive position at the Company or in its Group or that are associated through family and/or professional relationships with the executive directors, other senior executives and/or shareholders of the Company or its group, 4, The Directors will be appointed for terms of five (5) years, notwithstanding the possibility that they may be removed early by the General Shareholders' Meeting, They may be re-elected one or more times for equal terms at the end of their mandate, 5, Independent directors will cease in their positions when they have held the seat for an in interrupted period of 12 years as from the time of the listing of the Company's shares on the market, 6, Directors hold their positions at the pleasure of the Board of Directors and, if deemed appropriate, must present their resignations in the following cases:
- When they cease to hold the executive positions to which their appointment as a Director is associated,
- When they are involved in a legal incompatibility or prohibition, - When they receive any serious admonishment from the Board of Directors for failing to
have upheld their obligations as Directors,

71
- When their remaining on the Board may jeopardise the Company’s interests or when the reasons for which they were appointed no longer exist (for example, when a proprietary director disposes of his/her interest in the Company),
14, Powers of the members of the Board of Directors and, in particular, the power to
issue or buy back shares, The Board of Directors has the habitual management and representation powers as attributed by the Spanish Companies Act and is the maximum decision-making body at the Company, except with respect to those matters reserved for shareholders at a General Meeting, The Chair also holds the same powers as the Board of Directors (except for those established by Article 25) and is considered to be the top executive at the Company by virtue of Article 28 of the bylaws, Article 5 of the Board Regulations stipulates that the Board's functions regarding the powers relating to the possibility of issuing or buying back shares:
- The execution of the treasury share policy within the framework of the authorization provided by shareholders at a general meeting,
- The approval of the Company's general policies and strategies, including the treasury share policy and particularly its limits,
- The approval of the Company's most relevant operating decisions concerning investments and shareholdings in other companies, financial transactions, contracting and personnel remuneration,
15, Significant agreements concluded by the Company that may come into effect, may be amended or terminated in the event of a change in control in the Company as a result of takeover bid,
No agreements of this type exist, 16, Agreements between the Company and its administrative or management personnel
that provide for indemnities in the event of resignation or unfair dismissal or if the relationship ends as a result of takeover bid,
There are agreements with three senior executives who, in the event of unfair dismissal, are entitled to an indemnity as decided by the courts and in the event of a dismissal for objective purposes, layoff or any other reason deriving from a decision taken by the Company, the indemnity would total €5,953 thousand, 17. Corporate Governance Report The 2015 Corporate Governance Annual Report for Técnicas Reunidas forms part of the Directors' Report and as from the date on which the annual accounts are published is available on the
website of the National Stock Market Committee and the website of Técnicas Reunidas,