tectonics, vol. 6, no. 6, pages 707-725, december 1987
TRANSCRIPT

TECTONICS, VOL. 6, NO. 6, PAGES 707-725, DECEMBER 1987
MODELS OF POST-MIOCENE DEFORMATION OF
THE ARABIAN PLATE
Ze' ev Reches
Geology Department, Hebrew University, Jerusalem
Gerald Schubert
Department of Earth and Space Sciences, University of California, Los Angeles
Abstract. We investigate the defor- mation of the Arabian plate along a pro- file which extends from the Red Sea in
the southwest to the Zagros in the northeast. The post-Miocene tectonic pattern of this region includes contin- uing uplift, volcanism, and extensional faulting at the western margin adjacent to the Red Sea; subsidence, folding, and thrusting at the eastern margin near the Zagros; and lack of major ac- tive tectonism in the interior. Thus, the near-surface state of horizontal
deviatoric stress changes from exten- sional to compressional over a broad region of small tectonic stress. We derive models that can explain the ob- served distributions of stress and ver-
tical displacement. The stress distri- bution within the plate is derived from the static equilibrium of the lithosta- tic load, deviatoric tectonic stresses, and shear stresses along the base of the lithosphere. The vertical motions are derived from nonuniform vertical
deviatoric stresses at the base of the
lithosphere. The models indicate that the post-Miocene deformation occurs by the combined effects of lateral density
Copyright 1987 by the American Geophysical Union.
Paper number 7T0537 0278-7407/87/007T-0537510.00
variations within the mantle part of the plate, ridge push at the Red Sea, and convective shear stress at the
plate base. Density variations of 3.5% or less within the mantle part of the lithosphere induce a large portion of the tectonic stresses required for the observed deformation pattern in Arabia. The mean horizontal tensile tectonic
stress in the lithosphere at the Red Sea cannot exceed 12.5 MPa for reasonable
water depth in the Red Sea. The basal shear stress under Arabia must be di-
rected toward the Zagros, and it ranges from 1 to 2 MPa. By modeling Arabia as a uniform viscous plate undergoing large-scale bending, we find that the tectonic stresses generated by the lith- ospheric density variations and basal shear stress are sufficient to upwarp the Red Sea margins and downwarp the Zagros zone. A lithosphere viscosity of 5 x 1024 Pa s gives uplift of the Red Sea region at a rate of about 0.1 mm/yr.
INTRODUCTION
The central part of the Arabian plate, from the Rub-el Khali in the south to the Syrian desert in the north, is a 1500- to 1800-km-wide region that extends from the Red Sea in the south-
west to the Zagros in the northeast. This region displays relatively simple

?08 Reches and Schubert' Post-Miocene Deformation of Arabia
36• I I 45 ø 54 ø
,2-4
P•
.... 250 km ' '"' ' ß
36ø
!'7• Pleistocene to recent Phocene
Miocene
• Ohgocene Pn Phanerozo•c rocks 20ø- PC Precambrian rocks
--'- --'-- Margins of uphft 1000 '/ Depth of top crystalhne basement (m below m.s.I.)
•''• Fault (achve after M•ocene) (dashed where age •nferred)
Thrust
Terbary d•ke (partly •nferred from magnebc map) ....... Volcanic lineament
"-I'-' Paleostress axes -• Fold ax•s
• Geologic cross secbon Boundanes of tectomc units
ß Earthquake Iocahon
Fig. 1. Simplified tectonic map of Arabia indicating trends of major folds, faults, volcanic lineaments, structural contours of the basement, paleostress axes, and epicenters of earthquakes. Segment A-B overlaps the geophysical transect of the U.S. Geological Survey [Mooney et al., 1985]; segment B-C is perpendicular to the trend of the Zagros. Geology mostly after Brown [1972], Bender [1968], M. Gettings (private communication, 1986); paleostress axes after Eyal and Reches [1983]; epicenters of earthquakes determined by the Envi- ronmental and Information Service, U.S. Department of Commerce, Boulder, Colorado.
post-Miocene to Recent tectonic and structural patterns: uplift, volcanism, and extensional faulting characterize the western margin adjacent to the Red Sea, while subsidence, folding, and thrusting typify the eastern margins near the Zagros (Figure 1). Recent seismic activity is concentrated along
both these margins (Figure 1). In the interior, there is a lack of features indicative of any intense late Tertiary deformation as well as a lack of large earthquakes in the recorded seismic activity. Thus, along a line trending roughly E-NE across the Arabian penin- sula, the near-surface state of hori-

Reches and Schubert: Post-Miocene Deformation of Arabia ?09
zontal deviatoric stress changes from extensional to compressional over a broad region of small tectonic stress. In the present study we briefly describe the main tectonic features of
Arabia and derive a model that can
explain their origin and distribution.
TECTONIC SETTING
The Arabian peninsula consists of Precambrian basement rocks, the Arabian shield, that are exposed in the west and are covered by sedimentary formations in the east (Figure 1). The shield is com- posed of metamorphic and igneous rocks whose last major tectonothermal event was the Pan-African, some 850-550 m.y. ago [e.g., Bielski, 1982]o The shallow marine and continental sedimentary rocks comprise two zones: (1) a broad homocline and a few open bas ins north- east of the shield, and (2) the Persian Gulf-Zagros region (Figure 1) [Powers et al., 1967]. The sedimentary rocks of early Tertiary age and older were deposited when Arabia was part of the African plate and the Persian Gulf- Zagros was the continental margin along the Tethys ocean [e.g., Dewey et al., 1973]. The remnant of the Tethys ocean closed at the end of this period when continental collision commenced.
The Arabian plate split from the Afri- can plate in the middle Miocene with the opening of the Red Sea and the Gulf of Aden [Cochran, 1981] . The generally northward moving Arabian plate [e.g., Garfunkel, 1981] is presently bounded by the oceanic ridges of the Red Sea and the Gulf of Aden, the Dead Sea transform, the Owen fracture zone, the Anatolian fault, and the thrust and fold belt of the Zagros and Taurus mountains (Figure 1) .
Tectonic Features Along the Red Sea
Volcanism and extensional faulting. Several volcanic fields of Oligocene to Recent age form a 300 km by 2500 km belt along and north of the Red Sea (Figure 1) [e.g., Brown, 1972; Baker et al., 1973; Bender, 1974]. In Arabia, dikes, tuffs, and lava flows cover an area of approximately l0 s km2; flows of the Trap series in Yemen are the oldest Tertiary volcanic unit [Brown, 1972]. Some in- vestigators distinguish between the Arabian peninsula volcanic province and
the Jordan-Syria province on the basis of petrographic and structural differ- ences [e.g., Brenner, 1979]. In gener- al, the volcanics of Miocene age and younger in both provinces are alkali- olivine basalts [Baker et al., 1973; Gass et al., 1973; Brenner, 1979], and they differ from the more heterogeneous compositions of volcanics from the Red Sea and its islands [Gass et al., 1973]. The volcanic activity has continued in pulses from late Oglicene to the pre- sent [Bender, 1968; Brown, 1972].
Distinct lineaments are associated
with this volcanism. Particularly conspicuous are the lines of volcanic cones trending N-S on the flows covering the Arabian shield [Brown, 1972] and the NNW to NW lineaments of Jordan and Syria [e.g., Bender, 1968; Schulmann, 1981] (Figure 1). Another set of lineaments are the reverse magnetic anomalies that extend for more then 1500 km along the Red Sea [Brown, 1972]. These anomalies are associated with basalt dikes, up to 100 m thick, that are partly exposed in Arabia [Brown, 1972] and Sinai [Steinitz et al., 1978] (Figure 1). The volcanic lineaments most likely reflect long cracks in the crust which serve as con-
du{ts for the rising magma. Bender [1974] describes two systems
of numerous long normal faults with minor displacements in southeast Jordan' a NW set and a NNW set (Figure 1). The Kerak fault, for example, exceeds 300 km in length with a maximum vertical dis- placement of only 50 m. The narrow grabens and horsts observed along these faults [Bender, 1974, p. 114] clearly indicate extension in the NE or E-NE
directions. Field relationships do not provide accurate ages for these fault systems. However, the occurrence of long dikes and basaltic bodies of late Tertiary age along these systems [Bender, 1974, p. 109] suggests late Tertiary displacements of the faults.
The extensive volcanism, volcanic lineaments, long dikes, and extensional faults indicate the existence of a
regional tectonic tensile stress active since the late Tertiary. According to this interpretation, the 300-km-wide belt along the western margin of the Arabian plate has been subjected to tension at least since the early Miocene when intense volcanism started. The
orientation of the tectonic tension is
perpendicular to the direction of the

710 Reches and Schubert' Post-Miocene Deformation of Arabia
D
(w4) H.Ld 30
o o
•o
F-
Z

Reches and Schubert: Post-Miocene Deformation of Arabia 711
long dikes, the lines of volcanic cones, and the strikes of normal faults
[Nakamura, 1977] . These directions range from the common N-S and NNW trends in Arabia, to the dominant NNW trend in Jordan- Syria (there are also some instances of E-W directions). Thus, the late Tertiary to Recent tension axes are between E-W, in Arabia, and E-NE in Arabia and Jordan-Syria.
Uplift of the Red Sea margins. Brown [1970] suggested that the rise of the eastern margins of the Red Sea began in the late Oligocene or early Miocene, that the magnitude of the uplift increases northward along the Red Sea, and that differential uplift occurred among separate blocks. Gass [1970], on the other hand, suggested that domal uplift centered above Afar began about 70 Ma and ceased after the Eocene. He
proposed another domal uplift along the Red Sea, centered above 22øN.
M. Gettings (private communication, 1986) showed that uplift of Arabia commenced as early as the Cretaceous. The early uplift, which is not related to the opening of the Red Sea, is not restricted to the margins of the Red Sea, and it occupies large portions of Arabia. M. Gettings (private communica- tion, 1986) estimates that only 1-2 km of margin uplift in southwestern Arabia is related to the Red Sea spreading.
The rate of uplift has been deter- mined by fission track analysis in Sinai [Kohn and Eyal, 1981] and Arabia (M. Gettings, private communication, 1986). Kohn and Eyal [1981] found that the uplift in Sinai began 26 m.y. ago and has continued ever since; their results simply uplift rates as high as 0.2 mm/yr. The fission track results of Gettings indicate uplift rates of 0.02 to 0.03 mm/yr for J iddah to Yemen escarpment, whereas his analysis of altitudes of lava flows indicates rates as high as O. 07 mm/yr.
Paleostress pattern in the Sinai sub- plate. The tectonic paleostress field along the Dead Sea Rift, northwestern Arabia, has been recently determined from small-scale structures by Eyal and Reches [1983]. Their results indicate that the prevailing extension since early Miocene is the E-NE to E-W direction (Figure 1). The spatial distribution of the small structures suggests that the paleostress orientation is relatively uniform over hundreds of kilometers although the
magnitude of the deformation is more intense along the Dead Sea Rift.
The subsurface structure of the
western side of Arabia has been revealed
in a recent series of geophysical investigations. These investigations include seismic refraction, gravity, heat flow, and magnetic measurements along a 1000-km-long profile from the axial trough of the Red Sea to the proximity of Riyad (Figures 1 and 2) [Mooney et al., 1985; Gettings et al., 1986]. The structure of the lithosphere and the densities of the crust and the
mantle calculated in these studies are
used in the present analysis to estimate model parameters and to evaluate the model predictions.
Tectonic Features Along the Persian Gulf-Zagros Zone: Subsidence, folding, and thrusting
The northeastern margin of the Arabian plate is characterized by subsidence, sedimentation, and contemporaneous folding that date back to the early Miocene [e.g., Dunnington, 1958; Kamen- Kaye, 1970; Hull and Warmen, 1970]. That these processes started even earlier is suggested by pre-Eocene sedimentary rocks which are up to 3.5 km thick in central Arabia and at least 7
km thick in the Persian Gulf-Zagros zone. The subsidence and folding are restricted to a belt about 300 km wide
west of the Zagros (Figure 1). The dominant rock types are limestones, anhydrites, rock salt, marine shale, and continental clastics. Intense folding has occurred within the Zagros zone since the late Miocene and particularly during the Pliocene [e.g., Dunnington, 1958]. Hundreds of long folds trending NW have developed along the zone (Figure 1); their wavelengths range from 5 to 30 km, and their amplitudes may exceed 5 km. Since folding is contemporaneous with sedimentation, the thicknesses of late Tertiary sediments vary significantly between anticlines and synclines. For example, the structural difference between the anticlinal crest and the
synclinal trough in the Kuh-e-Khami, southwestern Iran, may exceed 9 km over a horizontal distance of only 20 km [Hull and Warmen, 1970]. Dunnington [1958] has suggested that the sedimen- tary thicknesses in the synclines give rough estimates of the magnitude of

712 Reches and Schubert' Post-Miocene Deformation of Arabia
subsidence of the folded region during the Tertiary.
This active folding is associated with thrusting distributed in the crust. Bird [1978], using earthquake focal mechanism solutions, showed that the thrusting prevails throughout the whole crust, in a belt almost 400 km wide and
40 km thick (see also Figure 1). Both the folding and the thrusting indicate horizontal compression normal to the Zagros, i.e., in the E-NE direction.
Tectonic Features in Central Arabia
Hancock et al. [1984] analyzed the tectonic deformation of central Arabia
using joint sets and subdued but long normal faults. The aggregate displace- ment of the oldest Neogene sediments along Wadi A1 Batin faults is only 10- 15 m. Since these faults are the most active faults in central Arabia, we consider central Arabia as lacking major tectonic activity during the post-Miocene period.
MECHANISMS FOR THE DEFORMATION OF ARABIA
The main post-Miocene tectonic features of central Arabia include the
following deformation belts, from W-SW toward E-NE: (1) uplifted margins of the Red Sea in tectonic tension, (2) a stable zone almost 1000 km wide lacking in prominent active tectonic features, and (3) the Zagros zone of tectonic compression and subsidence. Seismic activity is concentrated in the Red Sea and the Zagros (Figures 1 and 2). In this section we derive models that can
explain these distributions of stress and displacement. We determine the stress distribution within the plate from the static equilibrium of litho- static stresses, deviatoric tectonic stresses, and shear stresses along the base of the lithosphere. The litho- static load varies horizontally due to differences in density and crustal thickness between the lithosphere in the Red Sea and the Zagros. In our models the horizontal density variations are the main source of deviatoric tectonic
stress and deformation [Fleitout and Froidevaux, 1982]. Other models [e.g., McGarr, 1982] consider basal shear as
the major source of stress variations.
RED SEA ZAGROS
x=O Z=O x=l
! .... •Cr•ust '-Z=d CONTINENTAL CRUST
Z=ho • Pc
ridge push Fh(X) + ot(x)H + Ob'X LOWER LITHOSPHERE
IDGE PR Pt •NTLE
7-1-1 -
Z •
Z=h/.
RI MA]•
• ø•SUBLITHOSPHERIC MANTLE Pm=3330 kg m -3
Fig. 3. Idealized model for a force balance of the Arabian lithosphere (equation (1). Symbols are defined in Appendix A and in the text. Parameter
values are listed in Table 1. Open large arrow indicates a normal force; open large half arrow indicates a shear force.
A Model for the Spatial Distribution of Stresses and Vertical Motion
We first derive a model which de-
termines the depth average of the hori- zontal deviatoric tectonic stress in
the Arabian plate. This model has two variants: model A, which is derived for isostatic equilibrium, and model B, which allows some deviation from isos- tasy. Thus, model B can also account for the uplift and subsidence observed in Arabia.
The identical geometry of both models is shown in Figure 3 as a two-dimensional profile through the central part of Arabia, from the Red Sea to the Zagros. This profile generalizes some observations and assumptions. The profile indicates that the crust of Arabia thickens from the southwest toward the northeast. The
crust is 38 km thick along the Red Sea coast, about 43 km thick in central
Arabia [Gettings et al., 1986], and 45 m 5 km thick in the Zagros [Bird, 1978]. Snyder and Barazangi [1986] used gravity data to suggest a locally thickened crust under the Zagros front. They inferred that the crust thickens abruptly from 40- 42 km southwest of the thrust to as much as 65 km below it; the width of the thickened zone is 100 to 200 km [Snyder and Barazangi, 1986, Figure 5]. In our model, this abrupt thickening is replaced by a gradual thickening across the entire plate. It is assumed that along the profile the crust has a uniform density,

Reches and Schubert: Post-Miocene Deformation of Arabia 713
and the density of the mantle part of the lithosphere varies. These density varia- tions reflect the temperature differences between upwelling mantle under the Red Sea and old subducting mantle under the Zagros. The lithosphere in model A is assumed to be in isostatic equilibrium with compensation depth H along the entire profile (Figure 3). In model B, a nonzero vertical deviatoric stress is
specified at z = H. Elevated mantle of density PR lies
beneath the Red Sea (Figure 3). The crust of the Arabian plate has density Pc, and its thickness is h(x); here h(0) = h0, and h(g) = h , where x = 0 is the Red Sea and x = g Is the Zagros zone. Subcrustal lithosphere has density
p•(x,z) (z is depth); pg increases from the Red Sea to the Zagros as a conse- quence of the decrease in temperature with distance x from the upwelling mantle at the Red Sea spreading center.
The increase in pg(x,z) toward the Zagros offsets the increase in crustal thickness h(x) so as to achieve a state of isostasy in model A and a state of approximate isostasy in model B.
Figure 3 includes the forces and stresses acting within and along the boundaries of the plate; they are (1) the ridge push FR, the force applied by the elevated mantle, the oceanic crust, and the water column, at the Red Sea; in computing F R we assume that the stress at the ridge is hydrostatic; (2) the horizontal force F h (x) generated by the overburden; in computing Fh we assume that the stress is lithostatic; (3) the horizontal normal deviatoric tectonic
stress Pt(x); we first calculate the average tectonic stress for any given x, and later we derive its depth variation; and (4) a uniform shear stress •b applied along the base of the litho- sphere. The quantities F R and Fn are force per unit distance parallel to the strike of the ridge.
Table 1 summarizes the analytic formulas used for pœ_(x,z) and h(x). Lithospheric densit• Pfl varies with x and with z from the Motto z = h to the
depth z = H at which pA equals the density Pm of the underlying mantle (or asthenosphere). Lithosphere density is assumed to vary linearly with depth; it varies only approximately linearly with x since crustal thickness h also depends on x (Table 1). The equations relating
parameters of the density function pg with those of the crustal thickness
formula h(x) are a consequence of the isostatic state in model A or the pre- scribed vertical deviatoric stresses at
z = H in model B.
Model Solutions
We derive the deviatoric tectonic
stresses for several configurations and boundary stresses. We search for situations that best fit the observed
tectonic pattern of Arabia: extension and compression within the lithosphere along the Red Sea and the Zagros, respectively. Further, we search for tectonic stresses with magnitudes between about 5 and 50 MPa at the Red
Sea and the Zagros, in accordance with the intensive seismic activity in these regions [Bird, 1978] (Figures 1 and 2). The tectonic stresses Pt are calculated by solving the equation of force balance
F R + Fn(x) + •(x)H + •b x = 0 (1)
The formulas of Table 1 are used to
calculate the lithospheric density and the forces F R and Fn; parameter values are listed in Table 2 (mostly after Gettings et al. [1986] and Bird [1978]. All forces are defined positive to the right (Figure 3).
Model A: stress distribution with
isostatic equilibrium. Figure 4a shows • versus distance from the Red Sea x for basal shear stress •b = 0, 1, and 2 MPa and for two equivalent ridge structures: a water column of 6250 m
directly overlying the mantle, and a water column of 2500 m overlying a 6750- m-thick crust of sediments and basalt of
density 2000 kg m -s and the mantle. In both configurations the density of the mantle is 3330 kg m -s to a depth of 120 km, and the ridge force F R is 2.23 x 10 TM N m -• . The density of the mantle
par? of the lithosphere, p•(x,z) (Figure 4b) is at most 3430 kg m- or 3% larger than the density of the sublithospheric mantle.
The calculated deviatoric tectonic
stresses are tensile along the Red Sea with a magnitude of about 12 MPa (Figure 4a). The tectonic stress at the Zagros depends on the magnitude of the basal shear stress: a basal shear stress smaller than 1 MPa is insufficient to

714 Reches and Schubert' Post-Miocene Deformation of Arabia
Table 1. Analytic Formulas for Models A and B
Parameter Formula
Ridge push force, F R
1. For direct water/mantle contact
2. For water/oceanic crust/mantle sequence
PRgH2 - - p• 2 H2 - •] + [
Vertical stress, Red Sea, x = 0, z =H
1. For direct water/mantle contact PH -- PH Pw d
- + PR gH PR H
2. For water/oceanic crust/mantle PH -- sequence
PH Pw d + Pb (D-d) _
PR gH PR H PR H
Vertical stress, base of litho- sphere • _>x _>0, z -- H
P(x,H) = PH[ 1-m [1-n•})
Lithosphere density
1. For Model A, x H-z
Ph - Pm (1 + œkzo + kzg [}œH_h(x)}] h _> x _> O, H >_ z _> h(x)
where kz O =
kz • =
- h o 2PH(1-m) p--%-• - 2{ po - 1} •-- 2 Pm Pm
h o
2PH(1-m + mn)p•- 2{ Rs - 1}-•-- 2 Pm
h• kz o
h(x)
- PR 1 x
PH(1-m{1-n•})• m - [(kzo +kzg [) - 1 Pø - !(k z + k..g•) - 1 Pm 2 o
2. For Model B, _ _
replace PH by PH{1 + m(1-n x/g)}, where m,n are constants (see text).

Reches and Schubert' Post-Miocene Deformation of Arabia 715
Table 1 (continued)
Parameter Formula
Horizontal force due to lithostatic
load, F n
F h
pmgH :z - Pm [• H2 h(x)] + 1 H 2
I x] + kzo + kz• 1 h(x) h2(x) hS (x)]
[1 - h(x).] H
Notation Definition
d
D
ho
H
Pm
PR
Pc
depth of water in Red Sea for direct water/mantle contact depth of base of crust under Red Sea thickness of continental crust at the Red Sea thickness of continental crust at the Zagros thickness of continental crust
thickness of lithosphere density of water density of mantle under lithosphere density of mantle part of the lithosphere density of mantle beneath the Red Sea density of oceanic crust density of continental crust
generate compressive stress at the Zagros, whereas ab larger than 3 MPa reduces the width of the zone of high tensile stresses at the Red Sea to about 100-200 km and generates very high compression at the Zagros. A basal shear stress directed toward the Red Sea
would generate tension in the Zagros and compression along the Red Sea.
Another solution is presented in Figure 5. Here, we consider the effect of a less dense mantle under the Red Sea
[Gettings et al., 1986] o In Figure 5, PR is 0.98 Pm (or 3263 kg m-S), and the two equivalent structures of the Red Sea are d = 5.5 km for the case with direct
water/mantle contact and d = 2.5 km, D-- 9.25 km, and Pb = 2225 kg m -s for the case with oceanic crust. The mantle
part of the Arabian lithosphere in this case is less dense than the sublitho-
spheric mantle (Figure 5b) with a mini- mum density of about 3220 kg m -s. The tectonic stresses calculated for this
configuration are similar to those in Figure 4a, but the magnitudes are smaller; maximum tension at the Red Sea is about 5.5 MPa (Figure 5a).
Model B' stress distribution with
nonisostatic conditions. Vertical move-
ments are evident in Arabia: uplift of the Red Sea margins and subsidence and sedimentation along the Zagros suture (see introduction). We regard these vertical motions as reflecting nonuniform vertical deviatoric stress av at the base of the lithosphere. The vertical deviatoric stress is modeled as
nx
av(x) = PH m [ 1 - -•- ] (2) where PH is the lithostatic stress at z = 120 km under the ridge at the Red Sea (Table 1) and m and n are positive constants (m < 1); av is positive upward. Vertical deviatoric stress in shown
plotted as a function of x in Figure 6 for m = 0.001 and a few values of n.
There is a maximum upward vertical devi- atoric stress at the margins of the Red Sea (x = 0) corresponding to the uplift there. The vertical stress at the Zagros depends on the magnitude of n; •v(X = •) is downward for n > 1. Horizontal vari- ations in vertical stresses at the base
of the lithosphere are assumed to be associated with horizontal variations
in lithosphere density as described in

?16 Reches and Schubert: Post-Miocene Deformation of Arabia
TABLE 2. Parameter Values
Parameter Symbol Value or Range Reference
-3
Mantle density, kg m
Below lithosphere
At Red Sea
Crust density: Arabia, kg m
Crust thickness, km
At Red Sea
At Zagros
"Compensation" depth, km
Water depth: Red Sea, km
Thickness of oceanic
crust: Red Sea, km
-3
Pm 3330
<3330 PR _
2900
h o 38
Gettings et al. [1986]
Gettings et al. [1986]
Gettings et al. [1986]
hg 46 Bird [1978]
H 120
d 2.5-7
(D-d) 0-8
Table 1. These density variations also determine the horizontal deviatoric
stresses in the lithosphere according to the formulas of Table 1.
Horizontal deviatoric stresses and
lithospheric densities are shown in Figures 7 and 8 for values of m and n chosen on the basis of bending calculations discussed later in the
paper. In both figures, n = 2 while m in Figure 7 is 0.0002 and in Figure 8 it is 0.0003. Other parameters in Figures 7 and 8 are as in Figures 4 and 5, respectively. The horizontal tectonic stresses and lithospheric densities are similar in the corresponding isostatic and nonisostatic models (compare Figures 4a with 7a and 5a with 8a). The small vertical deviatoric stresses in the
nonisostatic models are directed upward at the Red Sea and downward at the
Zagros with the same absolute magnitude 0.6 MPa at both locations (Figures 7a and 8a).
Summary
Models A and B lead to some general conclusions about deformation and stress
in Arabia that are summarized here and
in Table 3. Reasonable density varia-
tions within the Arabian lithosphere (Figures 4b, 5b, 7b, and 8b) generate tectonic stresses in agreement with the main tectonic zones (Figures 4a, 5a, 7a, and 8a). However, the mean tectonic stresses due to density variation alone are small, only a few megapascals. More realistic tectonic stresses require a 1- to 2-MPa basal shear stress directed toward the Zagros. The mean horizontal tensile tectonic
stress in the lithosphere at the Red Sea cannot exceed about 12.5 MPa for a
reasonable water depth in the Red Sea. Compressive stress at the Zagros depends on the magnitude of the basal shear stress. Following Bird [1978], we estimate that the deviatoric horizontal
tectonic stress does not exceed 50 MPa.
A vanishing basal shear stress would require an unreasonable water depth in the Red Sea (about 9 km), whereas a basal shear stress larger then 3 MPa would yield a compressive stress exceed- ing 50 MPa at the Zagros (Figures 4a, 5a, and 7a).
The stress transition across Arabia, from extension to compression, is gradual, and thus even the central part of the plate is subjected to small tectonic stresses of a few megapascals.
Reches and Schubert' Post-Miocene Deformation of Arabia 717
• 25
• 20
03 15
cO 10
'C:: 5 o
o o
•) -5
•= -10
<-15 0
I I I I I I I I I
Ob---- 2 MP..a. .......... 1 MPa •
I I I I I I I I I 300 600 900 1200 1500
Distance from Red Sea (km)
R 0
20 2900 kg m '3
Q 80 L $397•.
-- 3347 .-..-.---- 120 I I I I I
0 300 600 900 1200 1500
Distance from Red Sea (km)
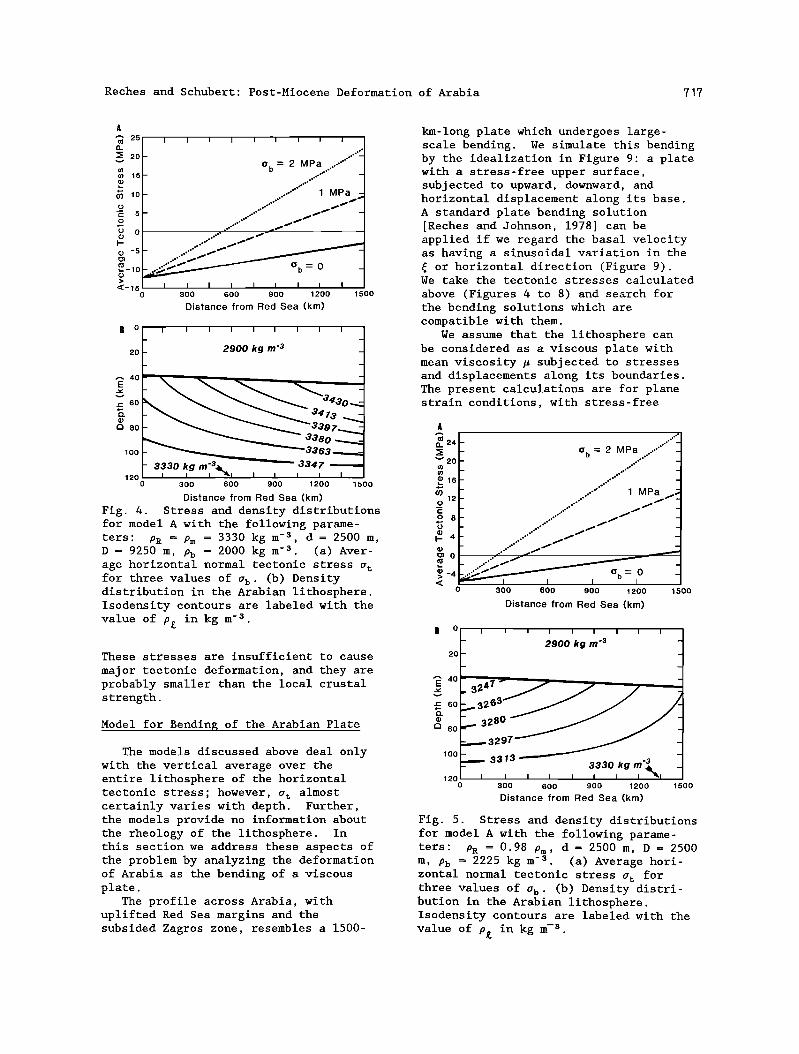
Fig. 4. Stress and density distributions for model A with the following parame- ters: PR = Pm = 3330 kg m -s, d = 2500 m, D = 9250 m, PD = 2000 kg m -s. (a) Aver- age horizontal normal tectonic stress •t for three values of •b' (b) Density distribution in the Arabian lithosphere. Isodensity contours are labeled with the
value of pg in kg m-S.
These stresses are insufficient to cause
major tectonic deformation, and they are probably smaller than the local crustal strength.
Model for Bending of the Arabian Plate
The models discussed above deal only with the vertical average over the entire lithosphere of the horizontal tectonic stress; however, •t almost certainly varies with depth. Further, the models provide no information about the rheology of the lithosphere. In this section we address these aspects of the problem by analyzing the deformation of Arabia as the bending of a viscous plate.
The profile across Arabia, with uplifted Red Sea margins and the subsided Zagros zone, resembles a 1500-
km-long plate which undergoes large- scale bending. We simulate this bending by the idealization in Figure 9: a plate with a stress-free upper surface, subjected to upward, downward, and horizontal displacement along its base. A standard plate bending solution [Reches and Johnson, 1978] can be applied if we regard the basal velocity as having a sinusoidal variation in the • or horizontal direction (Figure 9). We take the tectonic stresses calculated
above (Figures 4 to 8) and search for the bending solutions which are compatible with them.
We assume that the lithosphere can be considered as a viscous plate with mean viscosity • subjected to stresses and displacements along its boundaries. The present calculations are for plane strain conditions, with stress-free
EL 24
v 20
•)16
12
o 8
• 4
03 0
>-4
o
- 0 b -- 2 MPa .........
- ..-""' 1 MPa
I
300 600 900 1200 1500
Distance from Red Sea (km)
R 0
20
'• 40
r-i 80
IO0
120 0
I I I I I I I I I
2900 kg m '3 -
.3241
;..._.3297
300 600 900 1200 1500
Distance from Red Sea (km)
Fig. 5. Stress and density distributions for model A with the following parame- ters: PR = 0.98 Pm, d = 2500 m, D = 2500 m, Pb = 2225 kg m -s. (a) Average hori- zontal normal tectonic stress • for three values of •b' (b) Density distri- bution in the Arabian lithosphere. Isodensity contours are labeled with the
value of p• in kg m -s.

718 Reches and Schubert' Post-Miocene Deformation of Arabia
0.0010
n 0.0008
o b > 0.0006 '• • 0.0004
• • 0.0002
• 0 N.O
:• •) -0.0002 ,_ • -0.0004
o.[ Z -0.0006
-0.0008
-0.0010 0
I I I I I I i I I
0.•
1
300 600 900 1200
Distance from Red Sea (km)
Fig. 6. Normalized vertical deviatoric stress av/P H at the lithosphere base as a function of x for m = 0.001 and several
values of n. Values of av/P H larger than zero indicate uplift while values smaller than zero indicate subsidence.
upper surface (azz = a = 0 at z = 0) and specified velocitig z s at the base of
the lithosphere (Figure 9). We use the analysis of Reches and Johnson [1978, appendices I and II]; their formulas for velocities, deviatoric stresses, and boundary conditions are listed in Table 4. The vertical velocity at the base of the plate is WoSin(•/•), and the hori- zontal velocity is -u ocos•/•).
A solution that generally fits the stresses calculated in models A and B is
shown in Figure 10. The boundary veloc- ities (Figure 10a), the horizontal devi- atoric stress • (Figure 10b), and the basal shear strg•s and basal vertical stress (Figure 10c) are shown for a plate 1500 km long and 120 km thick with a mean viscosity of 5 x 1024 Pa s. The maximum vertical velocity along the base is w o = 0.1 mm yr -z, and the maxi- mum horizontal velocity at the base is u o = 0.002 mm yr -z. The magnitudes of the viscosity and the basal velocities determine the magnitudes of the bending stresses, but they do not affect their spatial distribution (Table 4). There- fore, the plotted stresses can be adjusted to other uplift rates and viscosities by linear scaling.
Figure 10a shows how the velocities at the upper and lower surfaces of the plate vary with horizontal distance. Since the plate is relatively thin (aspect ratio = 12.5), the vertical velocity is essentially constant with depth, whereas the magnitude of the horizontal velocity increases upward by
a small amount. Figure 10b shows how
the deviatoric horizontal stresses :• at the top and bottom of the plate the vertical mean of a depend on distance from the Red •ga. The mean horizontal deviatoric stress ranges from 12 MPa tensile stress at the Red Sea to
a compressire stress of the same magnitude at the Zagros. This mean horizontal stress is similar to the
deviatoric tectonic stress at(x ) in 15oo Figures 4, 7, and 8, for a b of 1 to 2
MPa. Figure 10c shows variations with horizontal distance of the vertical
• 15 • •o _03 5
•o•o o
-1- • -5
-lO 0 300 600 900 1200 1500
Distance from Red Sea (km)
g 0
20
lOO
120
I I I i I I I I I _
_ 2900 kg m '3 _
- - ., 3330 kg m '3 -
I •"•1 I I I I I I I 0 300 600 900 1200 1500
Distance from Red Sea (km)
Fig. 7. Horizontal and vertical devia- toric stresses and lithosphere density for model B with the following parameter values PR = Pm = 3330 kg m -s, d = 2500 m, D = 9250 m, Pb = 2000 kg m -s. There are small deviations from isostasy given by (2) with m = 0.0002 and n = 2. (a) Dis- tribution of tectonic stresses. Dash-dot
line: prescribed vertical, normal devia- toric stress a v at the base of the litho- sphere. Other lines are the average horizontal deviatoric stress a t for three values of a b . (b) Density distribution in the Arabian lithosphere. Isodensity contours are labeled with the value of pg in kg m -s .

Reches and Schubert' Post-Miocene Deformation of Arabia 719
A 20 I t t t t t I t t .....
_ • 16 0 b -- 2 MPa .... -'"' - o 12 .-" -
h•8 ................ - > • I MPa •- r- 4 • -
-- •
r- 'c. ......... //• - o •o-4 ......... // - '•-.• ....... // o b = 0 o > / % •-8
-12 i I i i i i I 300 600 goo •2oo
Distance from Red Sea (km)
e o
1500
I I I I i i i i
- 2900 kg m '3 - 20
•4o
•'60
Ch 80
100
- ,•3•330 kg rn '3 - 120 I I I I I I I ' 0 300 600 900 1200 1500
Distance from Red Sea (km)
Fig. 8. Similar to Figure 7 but with PR = 0.98 Pm and Pb = 2250 kg m- s.
deviatoric stress a zz (•,H) with maximum value of 0.6 MPa upward at the Red Sea,
and afz ((,H) with maximum magnitude of 3.2 MPa at the center of the plate. The mean shear stress along the base is 1.8 MPa toward the Zagros, in agreement with the values of •b inferred in the previous section (Figures 7 and 8).
The tectonic stresses determined by models A and B fit the stress field
associated with bending of the Arabian plate. Density variations in the Arabian lithosphere generate tectonic stresses that are sufficient to bend the
lithosphere along its entire 1500-km length between the Red Sea and the Zagros. For a lithosphere viscosity of 5 x 1024 Pa s, these density variations produce uplift of the Red Sea region and subsidence of the Zagros region at rates of about 0.1 mm yr- •. Figure 11 displays such a successful model for Arabia. The density distribution is from model B (Figure 8b), the vertical velocity distribution is from the bending analysis (Figure 10a), the horizontal normal stresses on lateral
boundaries are from Figure 10b, and the basal stresses are from Figure 10c.
DISCUSSION
In this section we extend our
previous discussion of the models and results to further assess how successful
they are in explaining the major tectonic features of Arabia.
Density Variations Within the Models
The derived density distributions in the mantle part of the lithosphere (Figures 4b, 5b, 7b, and 8b) can be compared with the density profile across western Arabia (Figure 12) obtained by Mooney et al. [1985] and Gettings et al. [1986] from inversion of seismic refrac- tion profiles and numerical analysis of gravity measurements. Mantle density variations in Figure 12 have the following major characteristics: (1) There is relatively light mantle just under the Red Sea (density of 3050 to 3070 kg m-S). (2) The uppermost mantle part of the lithosphere, Moho to 60 km depth, is everywhere lighter than the underlying mantle, 60 to 120 km depth. (3) Mantle density increases toward the northeast; in the uppermost mantle the density increases from 3100 kg m -s at the Red Sea to 3200 kg m -s in central Arabia, and in the lowermost mantle the density increases from 3330 kg m -s at the Red Sea to 3380 kg m -s in central Arabia.
The density variations of Figure 12 are similar in sense, i.e., p increasing northeastward and •ownward, to the variations predicted by model A (Figure 5b) and model B (Figure 8b) with light mantle under the Red Sea. The magnitudes of the downward density increases in models A and B range from 30 to 100 kg m -s (Figures 5b and 8b), whereas Figure 12 indicates a downward increase in pœ. of 180 to 230 kg m -s. Our simple model has a crustal density that does not account for the crustal
density variations with depth seen in Figure 12. These differences in crustal density must influence the comparison of subcrustal lithosphere density. Our model does include the increase in
crustal thickness with distance from the
Red Sea that is apparent in Figure 12. The models of this paper predict
mantle densities beneath Arabia in
qualitative accord with those inferred from the seismic and gravity observa- tions. It is significant then that

?20 Reches and Schubert: Post-Miocene Deformation of Arabia
TABLE 3. Summary of Results (Mode is A, B, and Bending Model)
Stresses, Velocities, and Viscosity Red Sea Zagros
Tectonic stresses (deviatoric, in MPa)
Mean horizontal normal stress Pt -5.5 to -12.5 5.5 to 12.5
Maximum •xx at surface (z = 0 km) -28.3 28.3
Maximum •xx at base (z = 120 km) 3.2 -3.2
Mean basal shear stress •b 1 to 2 1 to 2
Vertical basal normal stress •v 0.6 -0.6
Velocities, mm yr-1
Maximum, vertical, at base up 0.1 down 0.1
Maximum, horizontal (x = 750 km, z = 120 km)
0.002 westward
Mean lithosphere viscosity, Pa s 5 X 1024
these density variations can yield stresses that deform the Arabian litho-
sphere in a manner consistent with the observed tectonics and vertical
displacements.
Basal Shear Stress
The present analysis indicates that shear stress directed toward the Zagros must exist at the lithosphere base; its magnitude is about 1 to 2 MPa (Figures 4a, 5a, 7a, and 8a). A zero basal shear
w=• sin (n[H) • Fig. 9. Bending model for Arabia showing basal velocities, Wosin(•f/t ) and UoCOS(•f/t), the stress-free upper surface, and the horizontal deviatoric
normal stress off along the lateral boundaries.
is quantitatively unacceptable according to our model. For example, the solution in Figure 5a for zero basal shear implies that the horizontal tectonic stresses are about 1 MPa for the Zagros zone and about -5.5 MPa for the Red Sea.
While the -5.5 MPa tensile stresses may be sufficient for extensional tectonic
deformation, a compressive stress of 1 MPa at the Zagros is far below the expected few tens of megapascals in the Zagros [Bird, 1978]. The direction of this shear stress is in agreement with that expected from a mantle convection cell with hot upwelling material under the Red Sea and cold downwelling material under the Zagros. The magni- tude of the shear stress is in accord
with other estimates of basal shear
stresses. For example, the analysis of Richardson et al. [1979, Table 2] indicates basal shear stresses for
large plates in the range of 0.1-0.5 MPa. However, the basal shear for small plates may be much larger. Richardson et al. [1979, Table 3] found a basal shear stress of 2.19 MPa for Arabia in
one of their better fitting models (model 29).
Our model may also provide a crude

Reches and Schubert: Post-Miocene Deformation of Arabia ?Pl
TABLE 4. Analytical Solution for Bending of a Viscous Plate Under Plane Strain Conditions
Parameter Formula
øz•
z=0
Velocities
[[A + BAz] exp(iz) + [C + Diz] exp(-iz)} cos(i•) [[A + B(Iz - 1)] exp(Az) - [C + D(Az + 1)] exp(-Az)} sin(if)
Deviatoric Stresses
-2•A {[A + B(Az + 1)] exp(Az)+ [C + D(Az - 1)] exp(-Iz)} sin(A•)
2•I {[A + B(Iz - 1)] exp(Az) + [C + D(Az + 1)] exp(-Iz)} cos(i•)
2•I [[A + Biz] exp(Iz) - [C + Diz] exp(-Az)} cos(A•)
Boundary conditions
•zz = •z = 0 u = u o cos(if), w = w o sin (if). Solution:
C
(u o - Wo) - 2DIHexp(-IH) exp(IH) + exp(-IH)
(u o - Wo) - D[2AHexp(IH) + exp(IH) + exp(-IH)] 2[exp(IH) + exp(-IH)]
-(u o + Wo)[exp(IH ) + exp(-IH) + 21H(u o - Wo)exp(IH)] [exp(IH) + exp(-IH)]2 + 412H2
The solution is after Reches and Johnson [1978]. *Here A = =/• (g = length of plate); • is plate viscosity; and A, B, C, and D are constants.
estimate of the velocity of this convective flow. Let us assume that the
Arabian lithosphere had a uniform mantle density before the opening of the Red Sea, and that the calculated lateral density variations are solely due to heating by mantle flowing horizontally away from the center of upwelling in the Red Sea. The density variations are apparent at a distance of at least 800 km northeast of the Red Sea (Figure 11), and they may well extend further (Figure 8b). Therefore, the estimate of the advective velocity is 40 mm yr -• for a 20-m.y.-old Red Sea. This velocity is at least three times larger than the spreading rate of the Red Sea [Joffe and Garfunkel, 1987] .
Bending of Arabia
Are the parameters and assumptions of the bending analysis reasonable? The
applied uplift rate of 0.1 mm yr -• (Figure 10) is based on Kohn and Eyal's [1981] determination for the Sinai Peninsula. M. Gettings (private communi- cation, 1986), on the other hand, found uplift rates for Red Sea margins of Arabia in the range of 0.03 to 0.07 mm/yr. Thus, the bending calculations for 0.1 mm/yr should be regarded as an upper limit. Given 0.1 mm/yr as the uplift rate together with the assumption of a mean lithosphere viscosity of 5 x 1024 Pa s, the bending model yields deviatoric stresses in agreement with those deduced from the simple balance of forces. Not only is the value of • for the lithosphere supported by the inferred sensible stresses, but a lithosphere viscosity of 5 x 1024 Pa s is representative of other attempts [Walcott, 1973] to infer this parameter. An uplift rate of 0.05 mm/yr implies
722 Reches and Schubert' Post-Miocene Deformation of Arabia
o.•o _--.....• , i , , , , i [ , , i , ._.]
0.08 -
0.04 1 0.02 Horizontal velocity at base 0 '• ................. • .........................................
•'zø•a• ve•,•t top -0.02 $-o.o4
-0.06
-0.08
-0.10 I I I I I I I I I I 0 200 400 eoo 800 •000 •200 •400
Distance from Red Sea (km)
• 20 /
(D 10-
t,• Normal hor n / / • ................. !.•.o...:a !..•.!.Le•.•...%:..•.•. •.e.//-'' '• 0
• ss •o 9 ................................................. •-10 -•a• •o • •• - • -20 - -
-30 • • [ [ [ [ [ I [ [ I I I I 0 200 400 coo 800 1000 1200 1400
Distance from Red Sea (km)
C 1.0 , , , , , , , , , , , , , ,
q 0.5• - • •Vert•cal stress at base • o.o• / •-o.5 % • N / _ • -•.o - N / • _•.• _ N /
• -2.0 - o N / .• / _ • -2.5 - NN •-3,0- •__• al shear stres•
200 400 600 •oo •ooo •2oo •4oo
Distance from Red Sea (km)
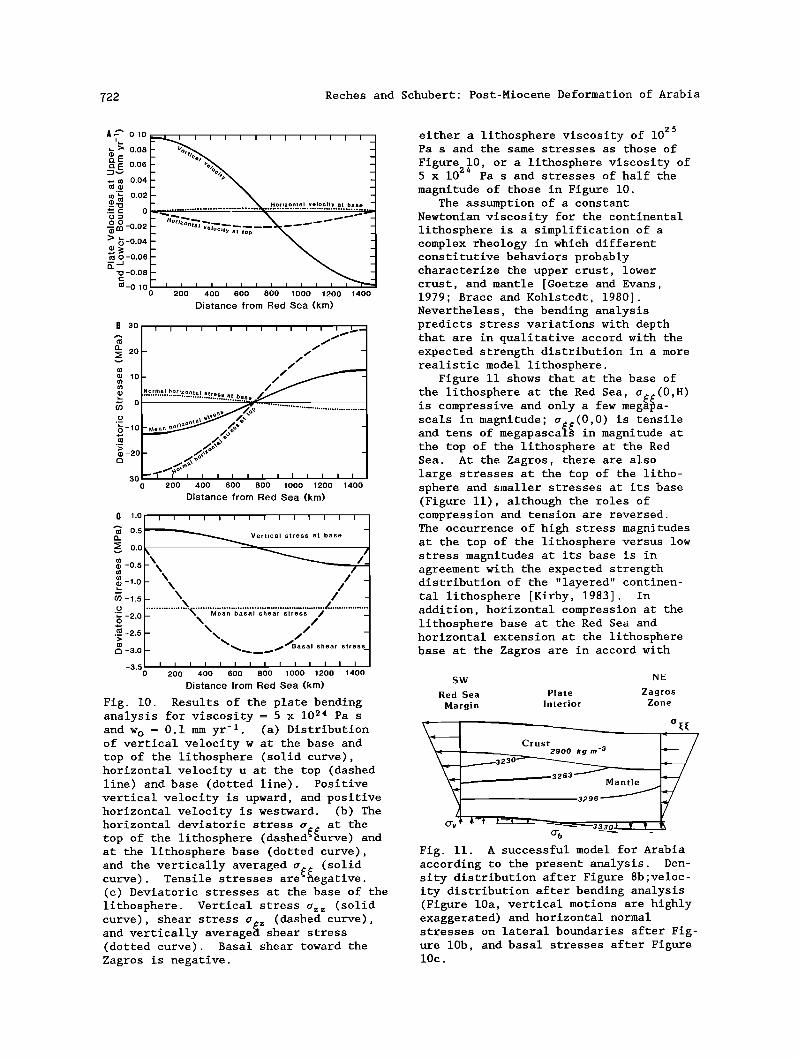
•$•. •0. •es•Z•s o• •e •a•e be•d• a•aZ•s$s •o• •$scos$• : 5 • •0 a• ?a s a•d •o = 0.• • •-•. (a) D$s•$b•$o• o• •e•$caZ •eZoc• • a• •e base a•d •o• o• •e Z$•os•e•e (soZSd c•e), •o•$zo•aZ •eZoc$• • a• •e •o• (dashed Z$•e) a•d base (do•ed Z$•e). 7os$•$•e •e•$caZ •eZoc$• $s •a•d, a•d •os$•$•e •o•zo•aZ •eZoc$• $s •es•a•d. (b) •e •o•$zo•aZ de•$a•o•$c s•ess •. a• •e
•o• o• •e Z$•os•e•e (das•ed••e) a•d a• •e Z$•os•e•e base (do•ed c•e),
a•d •e •e•$ca•Z• a•e•a•ed • (soZSd c•e). •e•sSZe s•esses a•e"•e•a•$•e. (c) De•$a•o•$c s•esses a• •e base o• •e Z$•os•e•e. Ve•$caZ s•ess • (soZSd c•e), s•ea• s•ess • (dashed c•e), a•d •e•$caZZ• a•e•a•e• s•ea• s•ess (do•ed c•e). •asaZ s•ea• •o•a•d •e Za•os $s •e•a•e.
either a lithosphere viscosity of 10 z5 Pa s and the same stresses as those of
Figure 410, or a lithosphere viscosity of 5 x 10² Pa s and stresses of half the magnitude of those in Figure 10.
The assumption of a constant Newtonian viscosity for the continental lithosphere is a simplification of a complex rheology in which different constitutive behaviors probably characterize the upper crust, lower crust, and mantle [Goetze and Evans, 1979; Brace and Kohlstedt, 1980]. Nevertheless, the bending analysis predicts stress variations with depth that are in qualitative accord with the expected strength distribution in a more realistic model lithosphere.
Figure 11 shows that at the base of
the lithosphere at the Red Sea, a•(0,H) is compressive and only a few megR•a- scals in magnitude; a•(0,0) is tensile and tens of megapascalg in magnitude at the top of the lithosphere at the Red Sea. At the Zagros, there are also large stresses at the top of the litho- sphere and smaller stresses at its base (Figure 11), although the roles of compression and tension are reversed. The occurrence of high stress magnitudes at the top of the lithosphere versus low stress magnitudes at its base is in agreement with the expected strength distribution of the "layered" continen- tal lithosphere [Kirby, 1983]. In addition, horizontal compression at the lithosphere base at the Red Sea and horizontal extension at the lithosphere base at the Zagros are in accord with
SW NE Red Sea Plate Zagros
Margin Interior Zone
• oft rust
Fig. 11. A successful model for Arabia according to the present analysis. Den- sity distribution after Figure 8b;veloc- ity distribution after bending analysis (Figure 10a, vertical motions are highly exaggerated) and horizontal normal stresses on lateral boundaries after Fig- ure 10b, and basal stresses after Figure 10c.

Reches and Schubert' Post-Miocene Deformation of Arabia 723
2,350 2,850 2,950
0
o. 80
- 1,51• 2'750 2'7501 2,750 2,700 2,680 - -3,050 '%• 2,950 2.900__ •2,920 2,950-- 3,00___0___ 2,950 3,000 - 3,100 3,125 3,180 3,200 -
_ _
_ _
_ 3,330 3,330 3,380 _ _
_
_ _
I I I I I I I I I I I I I I I I I I I I
2O
40
60
1•1oo 12o
0 1 O0 200 300 400 500 600 700 800 900 1000
Distance from Red Sea (km)
Fig. 12. Structure and density of the western half of Arabia as modeled from seismic refraction and gravity measurements by Gettings et al. [1986].
the stresses expected in a mantle convective cell with upwelling at the Red Sea and downwelling at the Zagros.
SUMMARY AND CONCLUSIONS
The Arabian plate shows a consistent tectonic pattern since the Miocene: uplift, volcanism, and extensional tectonics along the Red Sea, and subsidence, folding, and thrusting along the Zagros (Figures 1 and 2). This post- Miocene deformation occurs by the combined effects of lateral density variations within the mantle part of the plate, ridge push at the Red Sea, and convective shear stress at the base of
the plate. The Arabian plate is modeled as a
120-km-thick lithosphere with a constant density crust that is 38 km thick at the Red Sea and 45 km thick at the Zagros. The mantle part of the lithosphere becomes thinner and progressively denser from the Red Sea toward the Zagros; the mantle lithosphere also becomes denser with depth (Figures 5b and 8b). We determine the density of the mantle lithosphere by assuming isostasy or small prescribed departures therefrom and find that the maximum density difference in the lithosphere is 3.5% (Figure 8b). This value is smaller than the 8.3% maximum density difference computed from gravity data (Figure 12) [Gettings et al., 1986]. Thus, the density variations derived in our model (Figures 5b and 8b) are in qualitative agreement with those deduced from seismic and gravity data.
For a reasonable value of the ridge push force of 2.23 x 10 TM N m -• , the lateral density variations within the Arabian lithosphere produce small extensional stresses at the Red Sea and
small compressive stresses at the
Zagros. The magnitude of the tectonic stress is increased by a basal shear stress acting toward the Zagros (Figures 5a and 8a). The solution presented in Figure 8 is consistent with all the observational constraints; it involves a vertical normal stress of maximum
magnitude 0.6 MPa at the base of the lithosphere. The vertical stress agrees with the observed uplift and subsidence along the margins of the Arabian plate.
The deformation of Arabia has been
analyzed as a plate bending problem with uplift in the Red Sea and subsidence at the Zagros (Figure 9). The mean stresses associated with bending of the Arabian plate with mean lithospheric viscosity of 5 x 1024 Pa s and maximum uplift rate of 0.1 mm yr -• are in good agreement with the mean tectonic stresses due to the density variations in the lithosphere, the ridge push force, and the basal shear.
Acknowledgments. Discussions with Z. Garfunkel, D.L. Turcotte, and L. Fleitout, helped in formulating this study. The work was supported by a special grant of The Hebrew University and by NASA under grant NAG 5152o
REFERENCES
Baker, P. E., R. Brosset, I. G. Gass, and C. R. Neary, Jebel al Abyad' A Recent alkalic complex in western Saudi Arabia, Lithos, 6, 291-314, 1973.
Bender, F., Geologie yon Jordanian, 230 pp., Borntraeger, Berlin, 1968.
Bender, F., Geology of Jordan, 196 pp., Borntraeger, Berlin, 1974.
Bielski, M., Stages in the evolution of the Arabian-Nubian massif in Sinai, (in Hebrew with abstract in English), Ph.D. dissertation, 155 pp., Hebrew Univ., Jerusalem, 1982.

?24 Reches and Schubert' Post-Miocene Deformation of Arabia
Bird, P., Finite element modelling of the lithosphere deformation' The Zagros collision orogeny, Tectonophysics, 5_90 , 307-336, 1978.
Brace, W. F., and D. L. Kohlstedt, Limits on lithospheric stress imposed by laboratory experiments, J. Geophys. Res., 85, 6248-6252, 1980.
Brenner, I. B., The geochemical relations and evolution of the Tertiary- Quaternary volcanic rocks in northern Israel, Ph.D. dissertation, 202 pp., Hebrew Univ., Jerusalem, 1979.
Brown, G. F., Eastern margin of the Red Sea and the coastal structures in
Saudi Arabia, Philos. Trans. R. Soc. London, Ser. A, 267, 75-87, 1970.
Brown, G. F., Tectonic map of Arabian Peninsula, Minist. of Pet. and Min. Resour., Jiddah, Saudi Arabia, 1972.
Cochran, J. R., The gulf of Aden' Struc- ture and evolution of a young ocean basin and continental margin, J. Geophys. Res., 86, 263-288, 1981.
Dewey, J. F., W. C. Pitman III, W.B.F. Ryan, and J. Bonnin, Plate tectonics and the evolution of the Alpine system, Geol. Soc. Am. Bull., 84, 3135-3180, 1973.
Dunnington, H. V., Generation, migration, accumulation and dissipation of oil in Northern Iraq, in Habitat of Oil, edited by L. G. Weeks, pp. 1194-1251, American Association of Petroleum
Geologists, Tulsa, Okla., 1958. Eyal, Y., and Z. Reches, Tectonic anal-
ysis of the Dead Sea rift region since the Late-Cretaceous based on mesostruc-
tures, Tectonics, •, 167-185, 1983. Fleitout, L., and C. Froidevaux, Tecton-
ics and topography for a lithosphere containing density heterogeneities, Tectonics, •, 21-56, 1982.
Garfunkel, Z., Internal structure of the Dead Sea leaky transform (rift) in relation to plate tectonics, Tectonophysics, 80, 81-108, 1981.
Gass, I. G., The evolution of volcanism in the junction area of the Red Sea, Gulf of Aden and Ethiopian rifts, Philos. Trans. R. Sac. London, Ser. •, 267, 369-381, 1970.
Gass, I. G., I. J. Mallick, and K. G. Cox, Volcanic island of the Red Sea, J. Geol. Sac. London, Ser. A, 129, 275-310, 1973.
Gettings, M. E., H. R. Blank, W. D. Mooney, and J. H. Healy, Crustal structure of southwestern Saudi Arabia, J. Geophys. Res., 91, 6491-6512, 1986.
Goetze, R., and B. Evans, Stress and
temperature in the bending lithosphere as constrained by experimental rock mechanics, Geophys. J. R. Astron. Soc., 59, 463-478, 1979.
Hancock, P. L., A. A1 Kahdi, and N. A. Sha'at, Regional joint sets in the Arabian platform as indicators of intrapiate processes, Tectonics, 3, 27-43, 1984.
Hull, C. C., and H. R. Warmen, Asmari oil fields of Iran, Mem. Am. Assoc. Pet. Geol., 14, 428-437, 1970.
Joffe, S., and Z. Garfunkel, Plate kinematics of the circum Red Sea - A
re-evaluation, Tectonophysics, in press, 1987.
Kamen-Kaye, M., Geology and productivity of Persian Gulf synclinorium, Am. Assoc. Pet. Geol. Bull., 54, 2371-2394, 1970.
Kirby, S. H., Rheology of the litho- sphere, Rev. Geophys., 21, 1458- 1487, 1983.
Kohn, B. P., and M. Eyal, History of uplift of the crystalline basement of Sinai and its relation to opening of the Red Sea as revealed by fission track dating of apatite, Earth Planet. Sci. Lett., 52, 129-141, 1981.
McGarr, A., Analysis of states of stress between provinces of constant stress, J. Geophys. R•s., 87, 9279-9288, 1982.
Mooney, W. D., M. E. Gettings, H. R. Blank, and J. H. Healy, Saudi Arabian seismic deep-refraction profile' A travel time interpretation of crustal and upper mantle structure, Tectono- physics, 111, 173-246, 1985.
Nakamura, K., Volcanoes as possible indicators of tectonic stress orienta-
tion - Principle and proposal, J. Volcanol. Geotherm. Res., 2, 1-16, 1977.
Powers, R. W., L. F. Ramorez, C. D. Redmond, and E. L. Elberg, Geology of the Arabian peninsula, U.S. Geol. Surv. Prof. Pap., 560-D, 147 pp., 1967.
Reches, Z., and A.M. Johnson, The development of monoclines, II, Mechan- ical analysis of monoclines, in Lara- mide Folding Associated With Basement Block Faulting in the Rocky Mountains Region, edited by V. Matthews, Mem. Geol. Soc. Am., 151, 235-278, 1978.
Richardson, R. M., S.C. Solomon, and N. Sleep, Tectonic stress in the plates, Rev. Geophys., 17, 981-1019, 1979.
Schulmann, N., The Late Cenozoic hot spot of the Levant, paper presented at Annual Meeting, Isr. Geol. Soc., Jerusalem, Israel, 1981.
Snyder, D. B., and M. Barazangi, Deep

Reches and Schubert: Post-Miocene Deformation of Arabia 725
crustal structure and flexure of the
Arabian plate beneath the Zagros col- lisional mountain belt as inferred
from gravity observations, Tectonics, 5, 361-373, 1986.
Steinitz, G., Y. Bartov, and J. C. Huziker, K-Ar age determinations of some Miocene-Pliocene basalts in
Israel: Their significance to the tec- tonics of the Rift Valley, Geol. Mag., 115, 329-340, 1978.
Walcott, R. I., Structure of the Earth from glacio-isostatic rebound, Annu.
Rev. Earth Planet. Sci., 1, 15-37, 1973.
Z. Reches, Geology Department, Hebrew University, Jerusalem, Israel 91904
G. Schubert, Department of Earth and Space Sciences, University of California, Los Angeles, CA 90024-1567
(Received December 22, 1986; revised June 19, 1987; accepted June 19, 1987.)