teekay tankers q4-2016 earnings presentation
TRANSCRIPT
TEEKAY TANKERSQ4-2016 EARNINGS PRESENTATIONFebruary 23, 2017
Forward Looking Statements
This presentation contains forward-looking statements (as defined in Section 21E of the U.S. Securities Exchange Act of
1934, as amended) which reflect management’s current views with respect to certain future events and performance,
including statements regarding: vessel sales and deliveries; the Company’s forward fixed-rate charter coverage; the impact
of OPEC production cuts and increased non-OPEC production on the Company; the impact of the Company’s lighterage
and other fee-based businesses in 2017 and its ability to reduce future tanker market volatility; crude oil and refined
product tanker market fundamentals, including the balance of supply and demand in the tanker market, the amount of new
orders for tankers, the estimated growth in the world tanker fleet, the amount of tanker scrapping, estimated growth in
global oil demand and supply, the impact of changes to the regulatory landscape, and the length and depth of the current
tanker market cycle; tanker fleet utilization and spot tanker rates, including; the effect rates of refinery maintenance,
weather, changes in oil prices and refinery throughput;. The following factors are among those that could cause actual
results to differ materially from the forward-looking statements, which involve risks and uncertainties, and that should be
considered in evaluating any such statement: a delay in, or failure to complete, expected vessel sales; changes in the
production of, or demand for, oil or refined products; changes in trading patterns significantly affecting overall vessel
tonnage requirements; greater or less than anticipated levels of tanker newbuilding orders and deliveries and greater or
less than anticipated rates of tanker scrapping; changes in global oil prices; changes in applicable industry laws and
regulations and the timing of implementation of new laws and regulations; increased costs; the performance of the
Company's lighterage and other fee-based businesses in 2017; the potential for early termination of charter contracts of
existing vessels in the Company's fleet; the inability of charterers to make future charter payments; the inability of the
Company to renew or replace charter contracts; and other factors discussed in Teekay Tankers’ filings from time to time
with the United States Securities and Exchange Commission, including its Report on Form 20-F for the fiscal year ended
December 31, 2015. The Company expressly disclaims any obligation or undertaking to release publicly any updates or
revisions to any forward-looking statements contained herein to reflect any change in the Company’s expectations with
respect thereto or any change in events, conditions or circumstances on which any such statement is based.
2
3
Recent Highlights
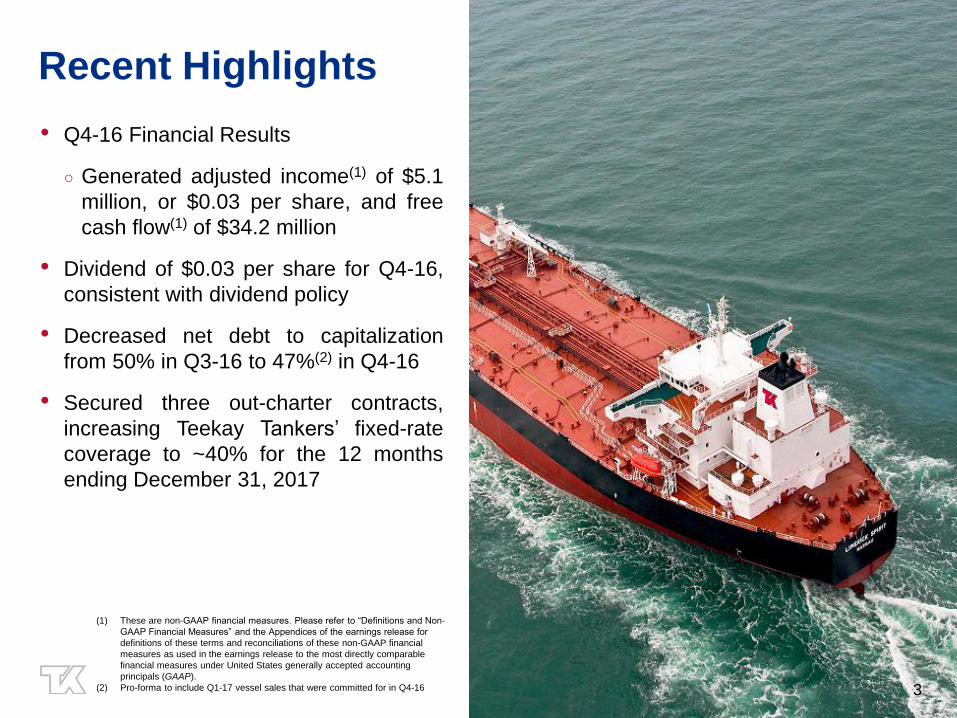
• Q4-16 Financial Results
○ Generated adjusted income(1) of $5.1
million, or $0.03 per share, and free
cash flow(1) of $34.2 million
• Dividend of $0.03 per share for Q4-16,
consistent with dividend policy
• Decreased net debt to capitalization
from 50% in Q3-16 to 47%(2) in Q4-16
• Secured three out-charter contracts,
increasing Teekay Tankers’ fixed-rate
coverage to ~40% for the 12 months
ending December 31, 2017
(1) These are non-GAAP financial measures. Please refer to “Definitions and Non-
GAAP Financial Measures” and the Appendices of the earnings release for
definitions of these terms and reconciliations of these non-GAAP financial
measures as used in the earnings release to the most directly comparable
financial measures under United States generally accepted accounting
principals (GAAP).
(2) Pro-forma to include Q1-17 vessel sales that were committed for in Q4-16 3
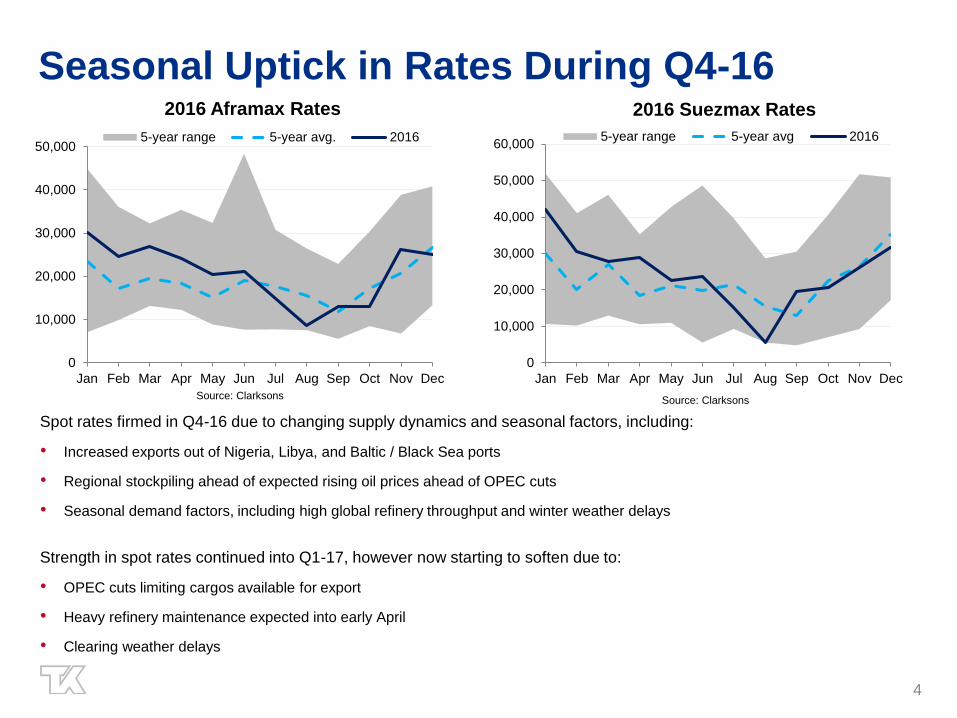
Seasonal Uptick in Rates During Q4-16
4
Spot rates firmed in Q4-16 due to changing supply dynamics and seasonal factors, including:
• Increased exports out of Nigeria, Libya, and Baltic / Black Sea ports
• Regional stockpiling ahead of expected rising oil prices ahead of OPEC cuts
• Seasonal demand factors, including high global refinery throughput and winter weather delays
Strength in spot rates continued into Q1-17, however now starting to soften due to:
• OPEC cuts limiting cargos available for export
• Heavy refinery maintenance expected into early April
• Clearing weather delays
0
10,000
20,000
30,000
40,000
50,000
Jan Feb Mar Apr May Jun Jul Aug Sep Oct Nov Dec
2016 Aframax Rates
5-year range 5-year avg. 2016
0
10,000
20,000
30,000
40,000
50,000
60,000
Jan Feb Mar Apr May Jun Jul Aug Sep Oct Nov Dec
2016 Suezmax Rates
5-year range 5-year avg 2016
Source: Clarksons Source: Clarksons
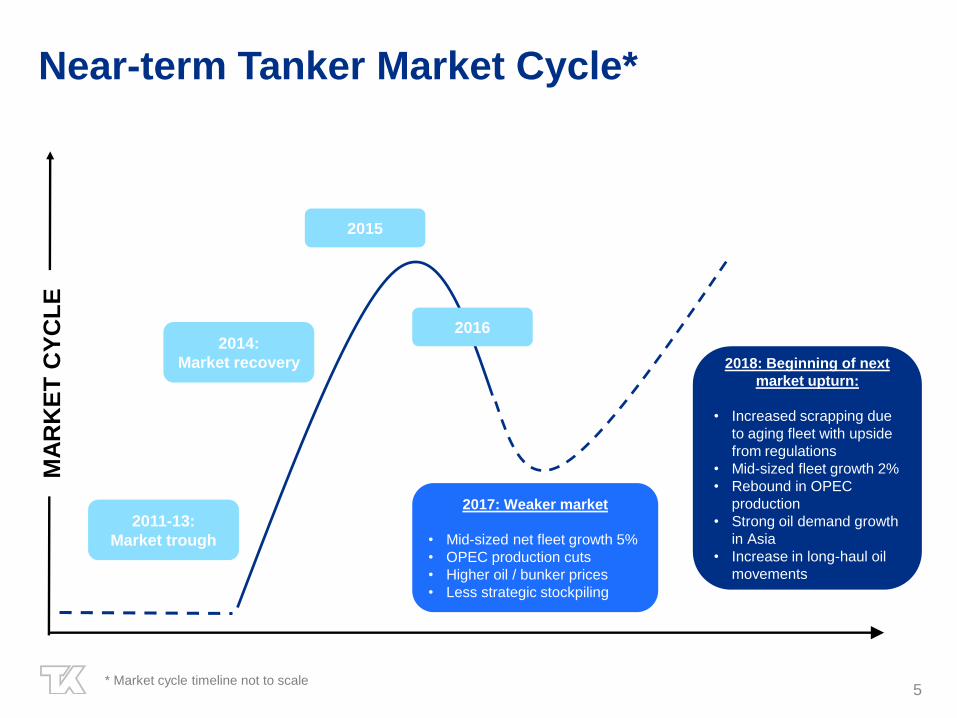
Near-term Tanker Market Cycle*
5* Market cycle timeline not to scale
2014:
Market recovery
2015
2018: Beginning of next
market upturn:
• Increased scrapping due
to aging fleet with upside
from regulations
• Mid-sized fleet growth 2%
• Rebound in OPEC
production
• Strong oil demand growth
in Asia
• Increase in long-haul oil
movements
2017: Weaker market
• Mid-sized net fleet growth 5%
• OPEC production cuts
• Higher oil / bunker prices
• Less strategic stockpiling
2011-13:
Market trough
MA
RK
ET
CY
CL
E
2016

2018 and Beyond: Positive Supply Factors
• Aging fleet: potential for more
scrapping
o 1/3 of mid-sized fleet reaches age 15 years or
older by 2020
o Capex requirements of new regulations
• Small orderbook for 2018 / 19 due to
a lack of newbuild orders
o Tanker ordering in 2016 was the lowest since
1995
• Decrease in ordering has been due to
three main factors:
o Lack of available financing
o Rationalization of shipyard capacity
o Increased spread between secondhand and
newbuild prices
Lack of newbuilding orders and aging fleet to limit supply growth
6
0
20
40
60
80
100
120
140
160
No
. S
hip
s
Mid-Size Fleet & Orderbook Age Profile
Suezmax Aframax
Reduction in Shipyard Capacity
Source: Clarksons
Age 15 or older by 2020
Small 2018 / 19
orderbook
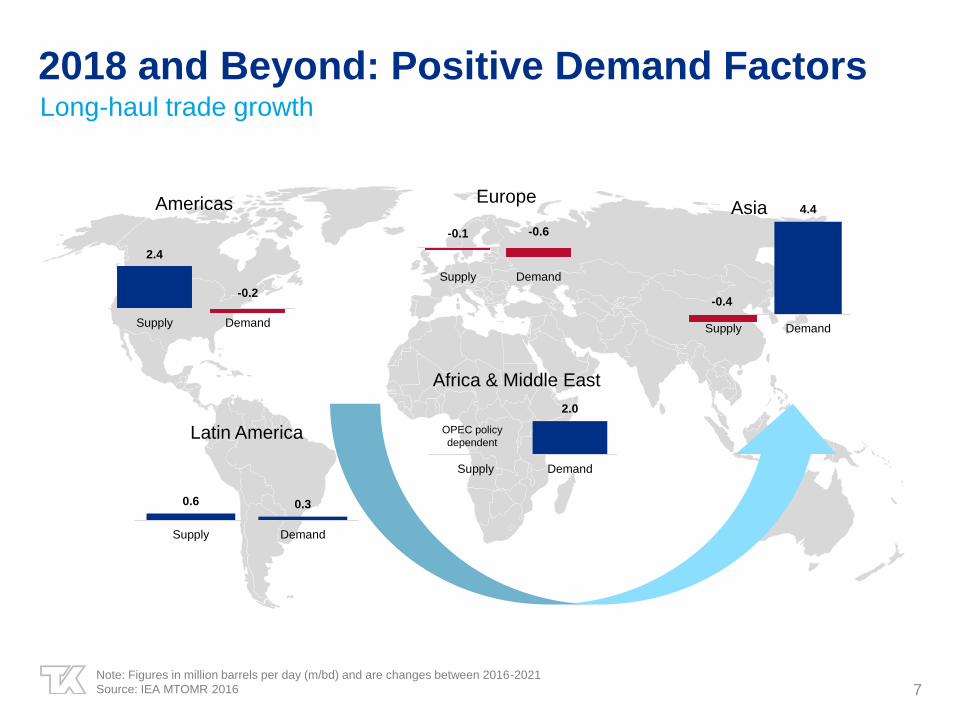
2018 and Beyond: Positive Demand FactorsLong-haul trade growth
7Note: Figures in million barrels per day (m/bd) and are changes between 2016-2021
Source: IEA MTOMR 2016
2.4
-0.2
Supply Demand
Americas
0.6 0.3
Supply Demand
Latin America
2.0
Supply Demand
Africa & Middle East
OPEC policy
dependent
-0.1 -0.6
Supply Demand
Europe
-0.4
4.4
Supply Demand
Asia
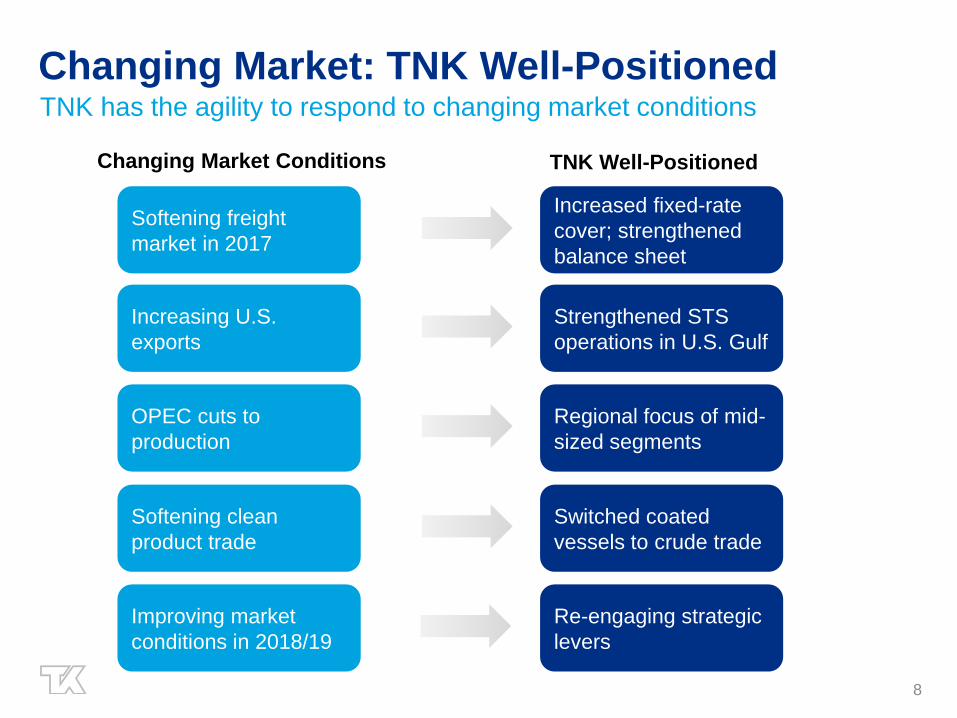
Changing Market: TNK Well-PositionedTNK has the agility to respond to changing market conditions
8
OPEC cuts to
production
Regional focus of mid-
sized segments
Changing Market Conditions TNK Well-Positioned
Softening freight
market in 2017
Increased fixed-rate
cover; strengthened
balance sheet
Increasing U.S.
exports
Strengthened STS
operations in U.S. Gulf
Softening clean
product trade
Switched coated
vessels to crude trade
Improving market
conditions in 2018/19
Re-engaging strategic
levers
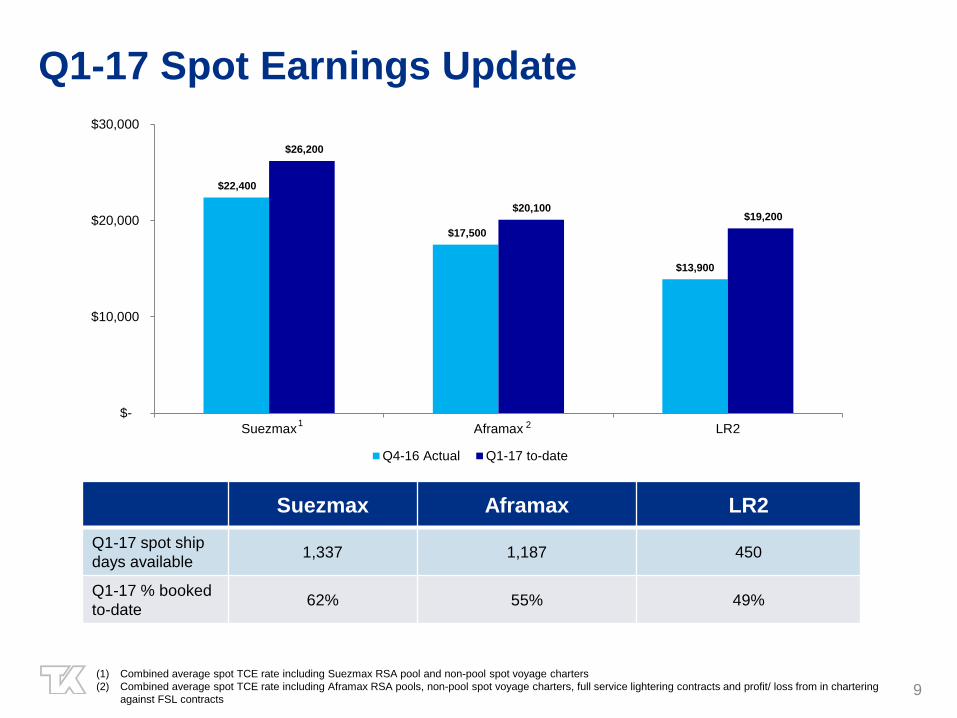
$22,400
$17,500
$13,900
$26,200
$20,100 $19,200
$-
$10,000
$20,000
$30,000
Suezmax Aframax LR2
Q4-16 Actual Q1-17 to-date
Q1-17 Spot Earnings Update
9
Suezmax Aframax LR2
Q1-17 spot ship
days available1,337 1,187 450
Q1-17 % booked
to-date62% 55% 49%
(1) Combined average spot TCE rate including Suezmax RSA pool and non-pool spot voyage charters
(2) Combined average spot TCE rate including Aframax RSA pools, non-pool spot voyage charters, full service lightering contracts and profit/ loss from in chartering
against FSL contracts
1 2
APPENDIX
10
11
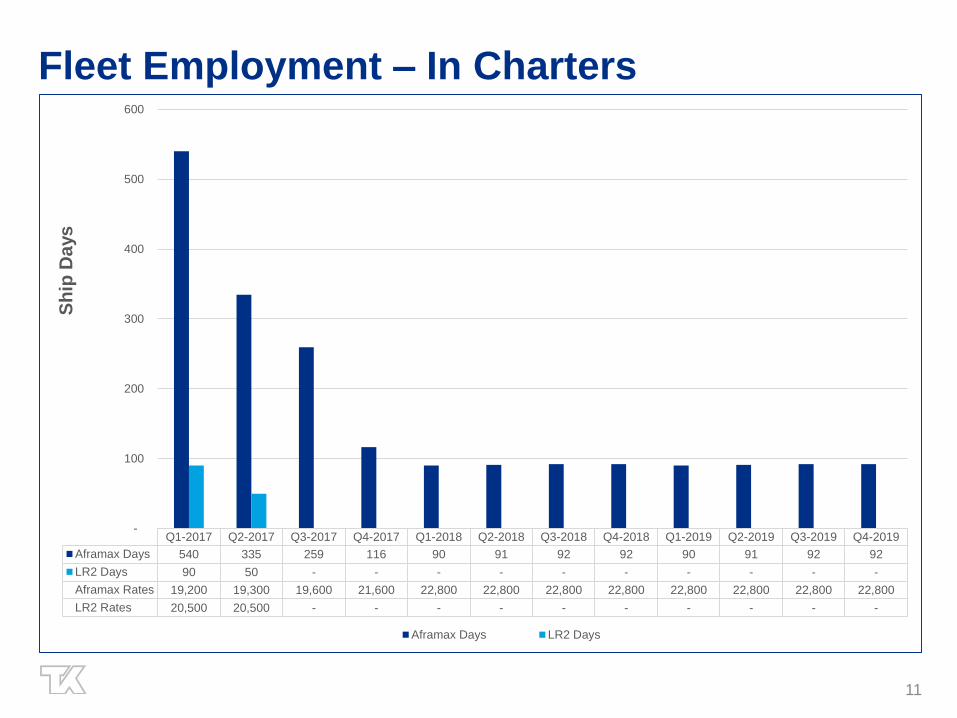
Fleet Employment – In Charters
Q1-2017 Q2-2017 Q3-2017 Q4-2017 Q1-2018 Q2-2018 Q3-2018 Q4-2018 Q1-2019 Q2-2019 Q3-2019 Q4-2019
Aframax Days 540 335 259 116 90 91 92 92 90 91 92 92
LR2 Days 90 50 - - - - - - - - - -
Aframax Rates 19,200 19,300 19,600 21,600 22,800 22,800 22,800 22,800 22,800 22,800 22,800 22,800
LR2 Rates 20,500 20,500 - - - - - - - - - -
-
100
200
300
400
500
600
Sh
ip D
ays
Aframax Days LR2 Days
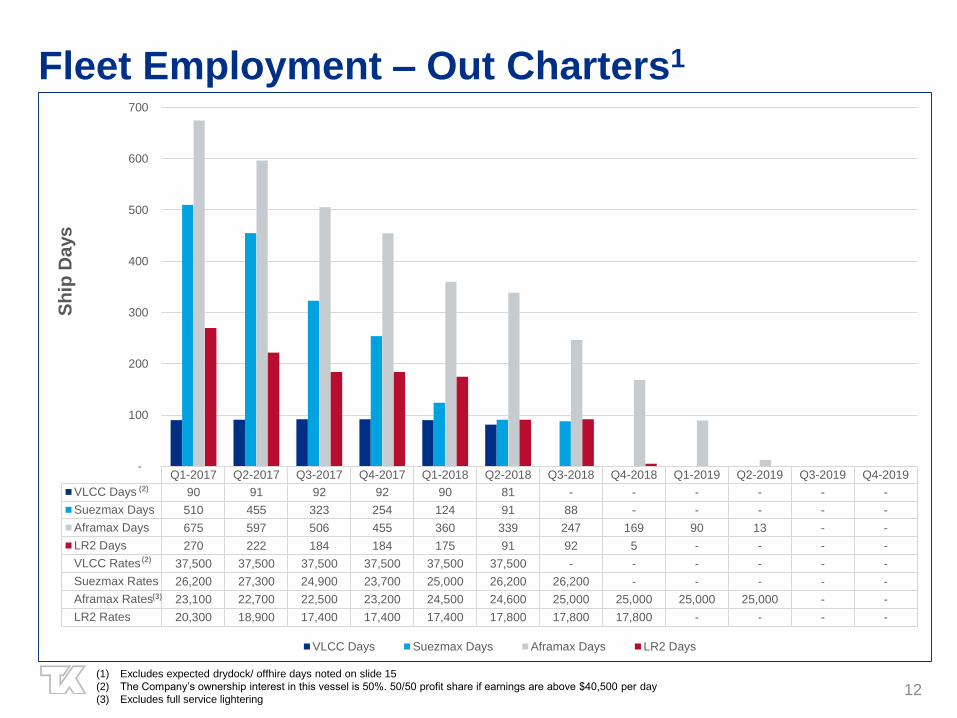
(1) Excludes expected drydock/ offhire days noted on slide 15
(2) The Company’s ownership interest in this vessel is 50%. 50/50 profit share if earnings are above $40,500 per day
(3) Excludes full service lightering12
Fleet Employment – Out Charters1
2 Q1-2017 Q2-2017 Q3-2017 Q4-2017 Q1-2018 Q2-2018 Q3-2018 Q4-2018 Q1-2019 Q2-2019 Q3-2019 Q4-2019
VLCC Days 90 91 92 92 90 81 - - - - - -
Suezmax Days 510 455 323 254 124 91 88 - - - - -
Aframax Days 675 597 506 455 360 339 247 169 90 13 - -
LR2 Days 270 222 184 184 175 91 92 5 - - - -
VLCC Rates 37,500 37,500 37,500 37,500 37,500 37,500 - - - - - -
Suezmax Rates 26,200 27,300 24,900 23,700 25,000 26,200 26,200 - - - - -
Aframax Rates 23,100 22,700 22,500 23,200 24,500 24,600 25,000 25,000 25,000 25,000 - -
LR2 Rates 20,300 18,900 17,400 17,400 17,400 17,800 17,800 17,800 - - - -
-
100
200
300
400
500
600
700
Sh
ip D
ays
VLCC Days Suezmax Days Aframax Days LR2 Days
(2)
(2)
(3)
13
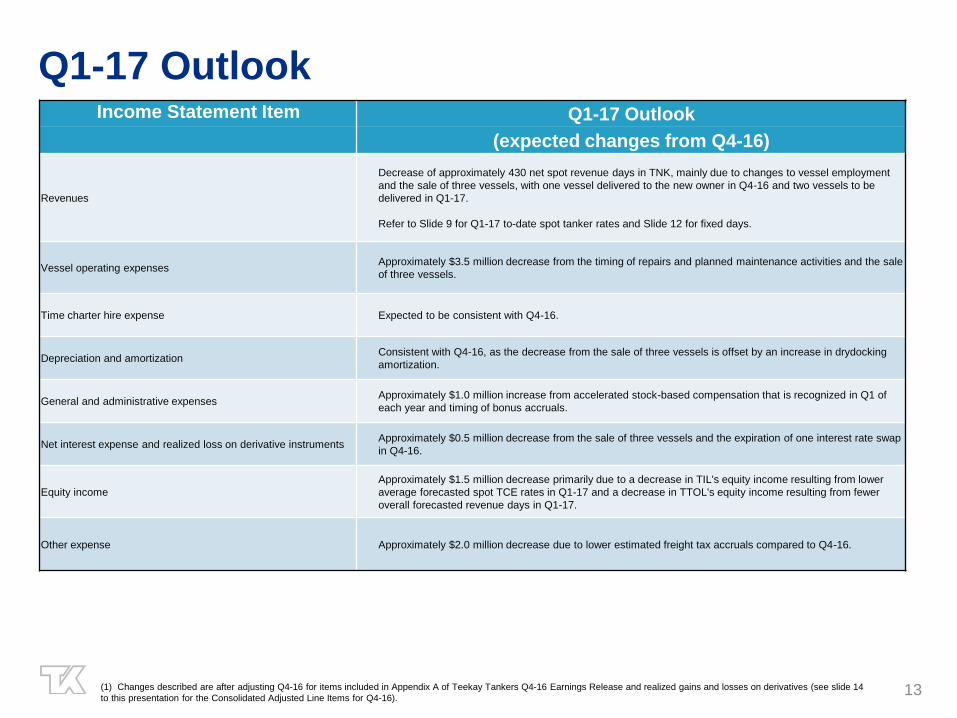
Q1-17 Outlook
(1) Changes described are after adjusting Q4-16 for items included in Appendix A of Teekay Tankers Q4-16 Earnings Release and realized gains and losses on derivatives (see slide 14
to this presentation for the Consolidated Adjusted Line Items for Q4-16).
Income Statement Item Q1-17 Outlook
(expected changes from Q4-16)
Revenues
Decrease of approximately 430 net spot revenue days in TNK, mainly due to changes to vessel employment
and the sale of three vessels, with one vessel delivered to the new owner in Q4-16 and two vessels to be
delivered in Q1-17.
Refer to Slide 9 for Q1-17 to-date spot tanker rates and Slide 12 for fixed days.
Vessel operating expensesApproximately $3.5 million decrease from the timing of repairs and planned maintenance activities and the sale
of three vessels.
Time charter hire expense Expected to be consistent with Q4-16.
Depreciation and amortizationConsistent with Q4-16, as the decrease from the sale of three vessels is offset by an increase in drydocking
amortization.
General and administrative expensesApproximately $1.0 million increase from accelerated stock-based compensation that is recognized in Q1 of
each year and timing of bonus accruals.
Net interest expense and realized loss on derivative instrumentsApproximately $0.5 million decrease from the sale of three vessels and the expiration of one interest rate swap
in Q4-16.
Equity income
Approximately $1.5 million decrease primarily due to a decrease in TIL's equity income resulting from lower
average forecasted spot TCE rates in Q1-17 and a decrease in TTOL's equity income resulting from fewer
overall forecasted revenue days in Q1-17.
Other expense Approximately $2.0 million decrease due to lower estimated freight tax accruals compared to Q4-16.
14
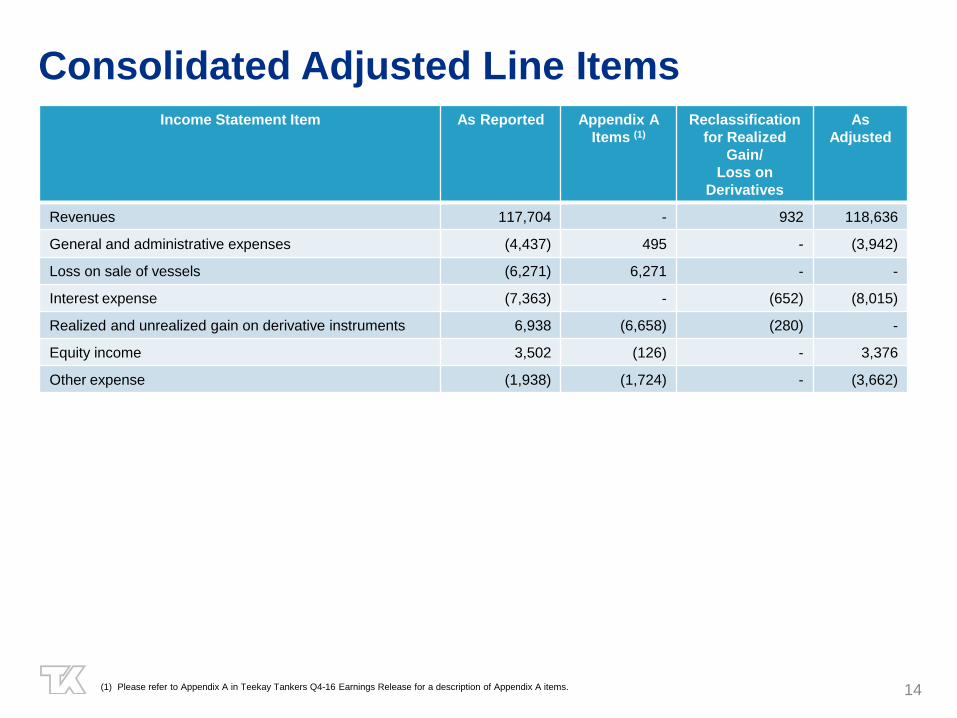
Consolidated Adjusted Line Items
(1) Please refer to Appendix A in Teekay Tankers Q4-16 Earnings Release for a description of Appendix A items.
Income Statement Item As Reported Appendix A
Items (1)
Reclassification
for Realized
Gain/
Loss on
Derivatives
As
Adjusted
Revenues 117,704 - 932 118,636
General and administrative expenses (4,437) 495 - (3,942)
Loss on sale of vessels (6,271) 6,271 - -
Interest expense (7,363) - (652) (8,015)
Realized and unrealized gain on derivative instruments 6,938 (6,658) (280) -
Equity income 3,502 (126) - 3,376
Other expense (1,938) (1,724) - (3,662)
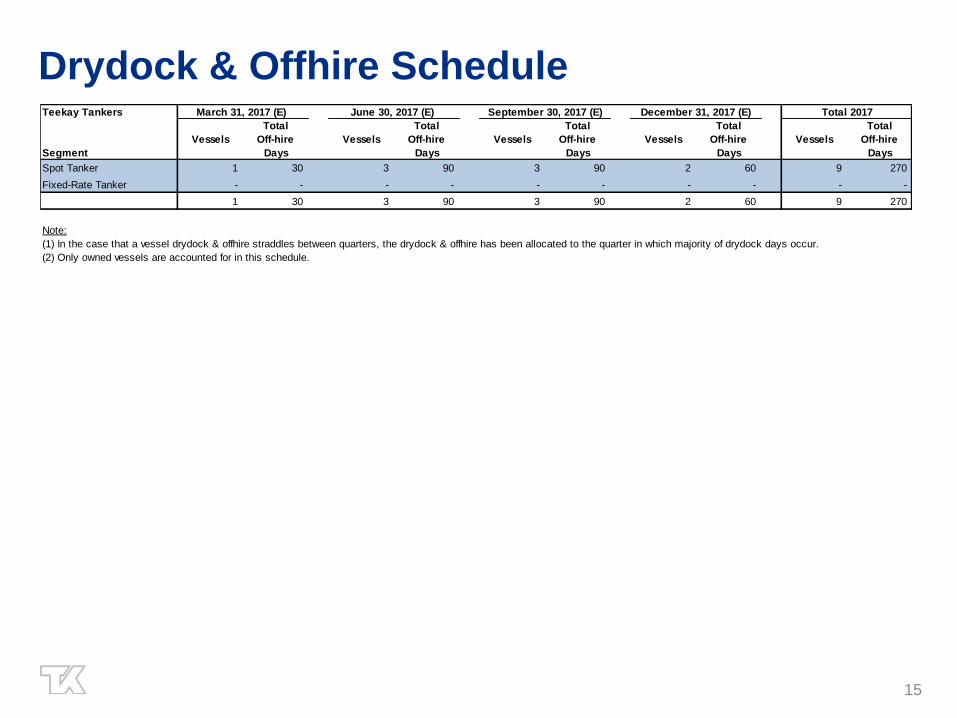
Drydock & Offhire Schedule
15
Teekay Tankers
Segment
Vessels
Total
Off-hire
Days
Vessels
Total
Off-hire
Days
Vessels
Total
Off-hire
Days
Vessels
Total
Off-hire
Days
Vessels
Total
Off-hire
Days
Spot Tanker 1 30 3 90 3 90 2 60 9 270
Fixed-Rate Tanker - - - - - - - - - -
1 30 3 90 3 90 2 60 9 270
Note:
(1) In the case that a vessel drydock & offhire straddles between quarters, the drydock & offhire has been allocated to the quarter in which majority of drydock days occur.
(2) Only owned vessels are accounted for in this schedule.
Total 2017March 31, 2017 (E) June 30, 2017 (E) September 30, 2017 (E) December 31, 2017 (E)