tegma gestão logística sa - s3.amazonaws.com · acquisition of silo carriers for industrial...
TRANSCRIPT

Tegma Gestão Logística SA Earnings Release
2019 second quarter
São Bernardo do Campo, August 7, 2019
Note: The Company ceased to consider Tegma Logística Integrada S.A. since February 2018 as a direct investment, due to the creation of the joint venture
"GDL" which has the objective of providing general and bonded warehouse services in Cariacica-ES. From this date on, GDL now holds direct control of
Tegma Logística Integrada S.A., therefore, GDL results will be accounted in equity in the Company. Cariacica operation result for January 2018 is shown in
the financial historical serial file in .xls on the Attachments tab and the Earnings release pro-forma tables are shown in the Earnings Release spreadsheets on
.xls.
Highlights
The 13.1% growth in net revenue in 2Q19 vs 2Q18 reflects the improvement in the average
distance of trips and in the number of vehicles transported in the vehicle logistics division.
Tegma transported 208.2 thousand vehicles in 2Q19, 7.4% more than the previous year,
reflecting 25.9% of market share or a 1.5 p.p gain vs 2Q18.
Tegma's EBITDA in 2Q19 was R$ 59.4 million. For comparative purposes, if we disregard the
impacts of IFRS 16, it was R$ 51.2 million, 13.3% higher vs the previous year.
2Q19 Tegma’s net income was R$ 32.5 million, 15.4% higher than 2Q18.
2Q19 free cash flow was R$ 36.6 million, influenced negatively by higher CAPEX and higher
cash cycle. For comparative purposes, if we disregard the impact of IFRS16, the 2Q19 free cash
flow was R$ 30.1 million.
The company's net debt on June 30, 2019 was R$ 31.9 million, corresponding to 0.1x adjusted
EBITDA of the last 12 months.
Tegma 2Q19 ROIC was 35.5%.
Chg % vs
Operational and financial highlights 2Q19 1S19 2Q18 1Q19 1S18
Net revenue (R$ million) 331.6 628.3 13.1% 11.8% 13.1%
Operating income (R$ million) 45.8 86.4 26.4% 12.7% 47.0%
EBITDA (R$ million) 59.4 115.5 31.7% 6.1% 54.8%
EBITDA 1Q19 ex-IFRS16 (R$ million) 51.2 97.5 13.3% 10.5% 30.7%
EBITDA Margin (ex-IFRS16) % 15.4% 15.5% - -0.2 p.p. 2.1 p.p.
Net income (R$ million) 32.5 59.1 15.4% 22.1% 40.2%
Net margin % 9.8% 9.4% 0.2 p.p. 0.8 p.p. 1.8 p.p.
Earnings per share (R$) 0.5 0.9 15.4% 22.1% 40.2%
Free cash flow (R$ million) 36.6 82.9 352.2% -20.8% 58.6%
CAPEX (R$ million) 14.6 21.2 208.1% 119.4% 194.9%
Vehicles transported (in thousand) 208.2 387.5 7.4% 16.1% 4.4%
Market Share % 25.9% 25.9% 1.5 p.p. - 1.4 p.p.
Average Km per vehicle transported 1,057.8 1,055.3 7.9% 0.5% 8.3%
2 Tegma Gestão Logística S.A | Earnings release | 2Q19 | in R$ million
Summary
Quarter Highlights ............................................................................................................................. 3
Automotive Market ........................................................................................................................... 5
Operational highlights – Automotive Logistics division ............................................................... 6
Results – Automotive Logistics Division ......................................................................................... 7
Results – Integrated logistics division ............................................................................................. 9
Results - Consolidated .................................................................................................................... 11
Results – Consolidated ….continuation ......................................................................................... 13
Cash flow ........................................................................................................................................... 14
Debt and Cash .................................................................................................................................. 15
Return on invested capital .............................................................................................................. 16
Annex I – Income statement ex-GDL in Jan/18 and ex-IFRS ..................................................... 17
Capital Markets TGMA3 .................................................................................................................. 19
Shareholder composition ............................................................................................................... 20
Click here for our Financial historical and explanatory notes in EXCEL.
Click here for this report’s spreadsheets in EXCEL.
Results conference call
|PORTUGUESE with simultaneous translation to ENGLISH|
Thursday, August 8, 2019
09:30 (Brasília)
08:30 am (US-ET)
Phone: +55 11 3193-1001 +55 11 2820-4001
Phone: +1 646 828-8246 +1 646 291-8936
Port Webcast: click here English Webcast: click here
Impacts of IFRS 16 in the results and cash flow
As explained in the 1Q19 earnings release, as of January/19, an accounting standard became effective
regarding the accounting of rents and leases (IFRS 16 / CPC 06 (R2)).
The impacts in 2Q19 result were: +R$ 8.3 million in rental expenses; -R$ 7.1 million in amortization of
right of use and -R$ 1.6 million in lease liabilities [+R$ 17.9 million; -R$ 16.1 million and -R$ 2.9 million,
respectively on 1S19].
The impact in 2Q19 cash flow was: +R$ 7.2 in operating cash flow and -R$ 6.5 million in cash flow from
financing activities [+R$ 16.6 million and -R$ 12.1 million, respectively on 1S19].
The impacts of IFRS 16 in the result and cash flow can be found in the financial historical file, in the
Annex tabs and in the Income Statement tabs below the result lines.

3 Tegma Gestão Logística S.A | Earnings release | 2Q19 | in R$ million
Quarter Highlights
• Acquisition of equipment (trucks) to renew the automotive logistics division's own fleet
In 2Q19 we acquired 20 trucks for our automotive logistics division own fleet. The renewal of part of the
109 owned truck occurred aiming the fleet modernization which will bring gains in terms of
maintenance. In parallel to the purchase, 28 trucks will be sold, resulting in a reduction of 8 trucks of our
own fleet.
The total investment was R$ 5.2 million and we do not expect further investments.
Acquisition of silo carriers for industrial logistics operation - chemicals
In line with the continuous improvement in the
productivity of our operations, we acquired 8 silo
carriers to replace outsourced equipments that transport
sulfate and soda ash for Tegma's chemical operation.
The new equipment developed by Tegma provides an
increase in load capacity and discharge productivity,
reduction of toll costs (one axis less compared to bi-
trains), maintenance costs, fuel costs and therefore pollutant
emissions.
These new equipments are added to the 21 that were acquired in 1S17, to the 20 bi-trains and to the 10
trucks already in operation. The main contract for this operation was recently renewed until the end of
2021.
The investment amounted was R$ 3.1 million.
Completion of investment in the yard in Sorocaba-SP and additional investment approved
In 2Q18 we announced the acquisition of a 40,000 m² piece of land in Sorocaba for Toyota's operation
in the same city. In 2Q19 we announce that we had finalized investments in improvements that totaled
R$ 22.3 million. The yard has been in operation since early 2019.
In the minutes of July 25, we announced that the Board of Directors approved the investment of R$ 10
million in another land of 20,000 m²
adjacent to the previously acquired. The
extension of the yard is justified by the
fact that the shipment of Toyota
vehicles manufactured in Sorocaba and
Indaiatuba will be carried out directly
from this new yard to the dealers, no
longer passing through the
consolidating centers in São Bernardo do
Campo.
Awards received by Tegma
On July 30, the ranking created by Infomoney (Financial magazine in Brazil) in
partnership with Ibmec (Financial College) and Economatica (Financial data
company) awarded Tegma as the “Best public company” in the industrial goods
category. The ranking considered three aspects: profitability, performance of
stocks and corporate governance practices among seven sectors: consumption,
industrial goods, public utilities, finance, oil and gas, health and telecom in the
period of the last 3 years (2016 to 2018).
To access the article “Tegma: the lemon turned lemonade and the stock rose more than 660% in 3 years”
(in portuguese) click here.

4 Tegma Gestão Logística S.A | Earnings release | 2Q19 | in R$ million
This quarter we were also ranked in the 36th place 2019 100 Open Startups
Ranking in the Top 50 Open Corps Category, which evaluates large companies
in relationships with startups. The Award is the result of the activities of the
startup accelerator tegUP, which in two years had already completed two cycles
with a total of 123 registered companies, 14 proofs of concept, 4 contracted
companies and one invested. We currently have the third cycle open to receive
new startups.
TegUP Update – Frete Rápido
The first investment in the company Frete Rápido made by tegUP has focused on implantation of new
clients that should bring recurring revenue from September 2019 and should starting present good results
in this Black Friday.
The startup has been recognized as an excellent digital transformation tool for shippers,
also it was awarded at the TOP 10 at the Innovation Show event, held in July 2019.
[The rest of the page was left intentionally blank]

5 Tegma Gestão Logística S.A | Earnings release | 2Q19 | in R$ million
Automotive Market
Automotive credit for individual person has shown significant improvements in the last twelve months.
The greater availability of credit reflects the increase in
concessions and, consequently, the loan balance, as
shown in Table 1. The continuous drop in default rates
favors this scenario, as well as the interest rates of the
segment, which despite having fluctuated in the last 12
months, has been showing a pace of decline vs. June
2018.
Industry inventory levels are higher in 2019 vs 2018.
As can be seen in Table 2, the most significant increase
can be identified in
automakers. Although
the domestic scenario
is more favorable for sales, exports are much lower than the first half
of 2018.
Domestic sales grew in 2019 in line with ANFAVEA's expectations for
2019, albeit the significant share of direct sales1 (45.5% of sales in
1S19).
Exports continue to drop sharply and ANFAVEA revised its 2019
estimates to a 28% reduction against 2018 (vs. a reduction of 6.2%). In
the quarter over quarter we can see a slight recovery of 12.3%. Production resumed its growth in 2Q19
due to the domestic sales performance and probably due to the drop in imports in 2Q19 and 1S19 in
the annual comparison.
Chg % vs
2Q19 1S19 2Q18 1Q19 1S18
Vehicles and light commercial sales 782.6 1,464.0 -1.0% 14.8% -1.7%
Domestic 670.3 1,251.8 11.5% 15.3% 10.9%
Exportations 112.3 212.2 -40.8% 12.3% -41.0%
Estimated wholesale sales 803.5 1,495.4 1.2% 16.1% -1.1%
(+) Production of vehicles and light commercial 737.9 1,404.8 5.2% 10.6% 2.5%
(+) Importation of vehicles and light commercial* 75.5 143.0 -18.5% 11.9% -11.4%
(-) OEM's inventories change 9.9 52.4 N/A N/A N/A
(in thousand)
* Due to the lack of updating of the Central Bank file (in Portuguese) about the number of vehicles imported by Brazil since December 2018, we had
temporarily replaced this information by the number of licensed imported vehicles. In July this information was updated and is in the financial historical file.
Source: ANFAVEA and BACEN
[The rest of the page was left intentionally blank]
1 Direct sales are characterized when they occur directly from the automaker. Examples of direct sales are for fleet owners and/or rental
companies, as well as in dealership operations such as sales made to taxi drivers, farmers and people with disabilities.
Table 1 - Automotive Credit Data
Loan Balance
(Individual and
Legal person)
(R$ bn)
Interest
Rate
(Individual
person)
Default
(Individual
person)
jun-18 179.8 22.0% 3.6%
sep-18 188.0 22.0% 3.5%
dec-18 199.1 21.7% 3.3%
mar-19 209.0 21.4% 3.3%
jun-19 221.7 21.1% 3.3%
Source: Banco Central, individual person
Table 2 - Vehicle inventories (in days)
Total Conces
sionaire
Auto
makers
jun-18 24.7 16.4 8.3
sep-18 25.7 15.7 10.1
dec-18 26.3 19.8 6.5
mar-19 29.8 19.2 10.6
jun-19 28.8 18.3 10.5
Source: ANFAVEA (Calculation available in
financial historical)
6 Tegma Gestão Logística S.A | Earnings release | 2Q19 | in R$ million
Operational highlights – Automotive Logistics division
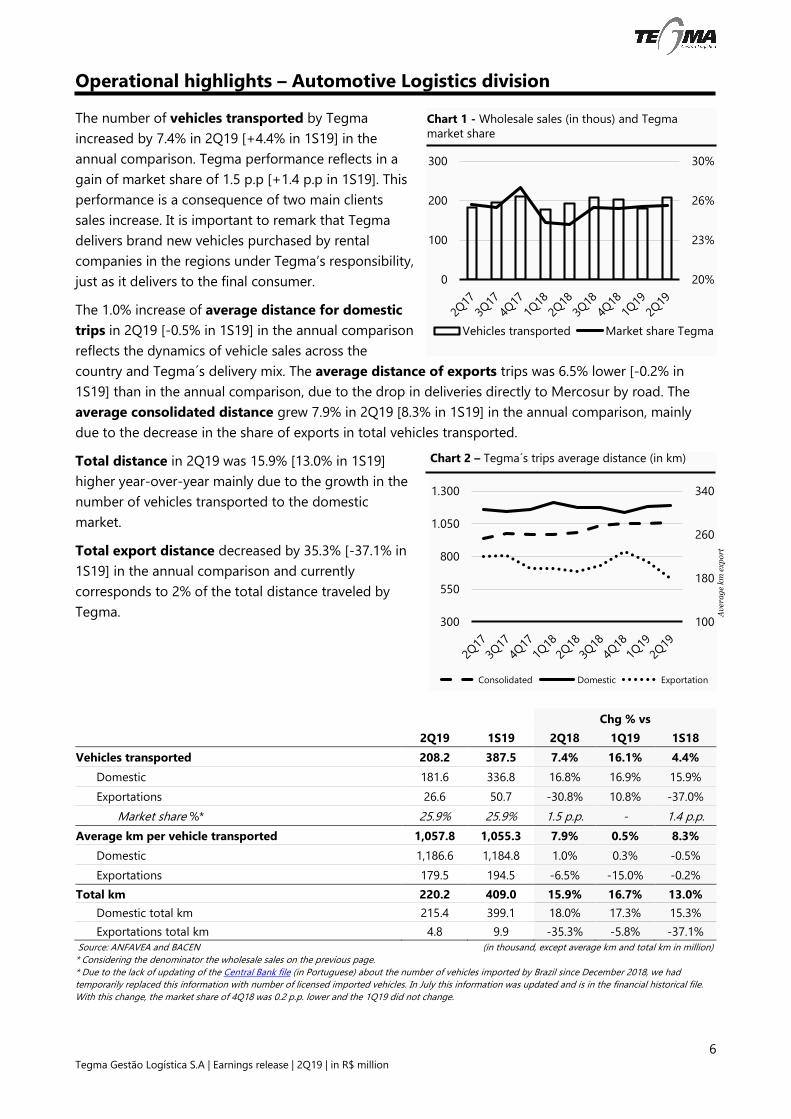
The number of vehicles transported by Tegma
increased by 7.4% in 2Q19 [+4.4% in 1S19] in the
annual comparison. Tegma performance reflects in a
gain of market share of 1.5 p.p [+1.4 p.p in 1S19]. This
performance is a consequence of two main clients
sales increase. It is important to remark that Tegma
delivers brand new vehicles purchased by rental
companies in the regions under Tegma’s responsibility,
just as it delivers to the final consumer.
The 1.0% increase of average distance for domestic
trips in 2Q19 [-0.5% in 1S19] in the annual comparison
reflects the dynamics of vehicle sales across the
country and Tegma´s delivery mix. The average distance of exports trips was 6.5% lower [-0.2% in
1S19] than in the annual comparison, due to the drop in deliveries directly to Mercosur by road. The
average consolidated distance grew 7.9% in 2Q19 [8.3% in 1S19] in the annual comparison, mainly
due to the decrease in the share of exports in total vehicles transported.
Total distance in 2Q19 was 15.9% [13.0% in 1S19]
higher year-over-year mainly due to the growth in the
number of vehicles transported to the domestic
market.
Total export distance decreased by 35.3% [-37.1% in
1S19] in the annual comparison and currently
corresponds to 2% of the total distance traveled by
Tegma.
Chg % vs
2Q19 1S19 2Q18 1Q19 1S18
Vehicles transported 208.2 387.5 7.4% 16.1% 4.4%
Domestic 181.6 336.8 16.8% 16.9% 15.9%
Exportations 26.6 50.7 -30.8% 10.8% -37.0%
Market share %* 25.9% 25.9% 1.5 p.p. - 1.4 p.p.
Average km per vehicle transported 1,057.8 1,055.3 7.9% 0.5% 8.3%
Domestic 1,186.6 1,184.8 1.0% 0.3% -0.5%
Exportations 179.5 194.5 -6.5% -15.0% -0.2%
Total km 220.2 409.0 15.9% 16.7% 13.0%
Domestic total km 215.4 399.1 18.0% 17.3% 15.3%
Exportations total km 4.8 9.9 -35.3% -5.8% -37.1%
Source: ANFAVEA and BACEN (in thousand, except average km and total km in million)
* Considering the denominator the wholesale sales on the previous page.
* Due to the lack of updating of the Central Bank file (in Portuguese) about the number of vehicles imported by Brazil since December 2018, we had
temporarily replaced this information with number of licensed imported vehicles. In July this information was updated and is in the financial historical file.
With this change, the market share of 4Q18 was 0.2 p.p. lower and the 1Q19 did not change.
100
180
260
340
300
550
800
1.050
1.300
Consolidated Domestic Exportation
20%
23%
26%
30%
0
100
200
300
Vehicles transported Market share Tegma
Chart 2 – Tegma´s trips average distance (in km)
Av
era
ge
km
ex
po
rt
Chart 1 - Wholesale sales (in thous) and Tegma
market share

7 Tegma Gestão Logística S.A | Earnings release | 2Q19 | in R$ million
Results – Automotive Logistics Division
The improvement trend of the Automotive Logistics
Division results is a consequence of a better economic
scenario in the country, which was reflected in the
vehicles sale improvement and in its regional distribution.
The gross revenues of automotive logistics division
increased 14.5% in 2Q19 [15.6% in 1S19] in the annual
comparison, a variation that is explained: i) by the 7.4%
increase in 2Q19 [4.4% in 1S19] in the number of
transported vehicles, ii) by the 7.9% increase in the
average km per vehicle in the 2Q19 [8.3% in 1S19] vs. the
previous year, iii) by the price adjustment carried out in
May, 2019 and iv) by the significant increase in revenues
from other services, such as storage, PDI and mainly from
yards management.
The 2Q19 division gross margin was 22.1% [22.0% in 1S19]. Disregarding the IFRS 16, as shown on the next
page, and on Annex I, the 2Q19 margin would have been
21.8% [21.7% in 1S19], 210 bps and 190 bps higher over
the annual comparison, a consequence of the increase of
transported vehicles and of the average distance.
The division’s 2Q19 and 1S19 EBITDA margin as well the
fixed cost control were both 16.5%. Disregarding the IFRS
16, they would have been 15.1% in 2Q19 [14.8% in 1S19],
stable and 210 bps higher, respectively in the annual
comparison, as seen on the following page. The margin
stability in 2Q19 vs 2Q18 was mainly due to the increase
in expenses related to the settlement of long-term
bonuses for part of the Executive Officers and the
unexpected expenses associated with the establishment
of Joint Venture GDL.
Chg % vs
Automotive logistics division 2Q19 1S19 2Q18 1Q19 1S18
Gross revenue 360.9 682.6 14.5% 12.2% 15.6%
Taxes and deductions (66.7) (129.5) 12.6% 6.3% 15.8%
Net revenue 294.1 553.0 14.9% 13.6% 15.6%
Cost of services (229.1) (431.5) 11.5% 13.2% 12.5%
Gross profit 65.0 121.5 28.8% 15.0% 28.2%
Gross Margin 22.1% 22.0% 2.4 p.p. 0.3 p.p. 2.2 p.p.
Expenses (23.9) (46.4) 30.1% 6.5% 5.6%
Operating income 41.1 75.1 28.1% 20.6% 47.7%
Operating Margin% 14.0% 13.6% 1.4 p.p. 0.8 p.p. 3.0 p.p.
(+) Depreciation 7.6 16.0 22.8% -10.0% 60.5%
EBITDA 48.7 91.1 27.2% 14.5% 49.8%
EBITDA Margin% 16.5% 16.5% 1.6 p.p. 0.1 p.p. 3.8 p.p.
To access this spreadsheets in Excel, Click here.
0%
12%
24%
0
14
28
42
56
70
84
Adj EBITDA Adj EBITDA mg
0%
15%
30%
45%
0
150
300
450
Auto Gross Reve YoY Cgh%
Chart 3 – Gross revenue consolidated (in R$ mi)
Chart 4 – Automotive adjusted EBITDA (in R$ mi)
Ex-IFRS16 Ex-IFRS16

8 Tegma Gestão Logística S.A | Earnings release | 2Q19 | in R$ million
Chg % vs
Automotive logistics division
Ex-IFRS16 2019 2Q19' 1S19' 2Q18 1Q19 1S18
Gross revenue 360.9 682.6 14.5% 12.2% 15.6%
Taxes and deductions (66.7) (129.5) 12.6% 6.3% 15.8%
Net revenue 294.1 553.0 14.9% 13.6% 15.6%
Cost of services (230.0) (433.1) 11.9% 13.3% 12.9%
Gross profit 64.1 119.9 27.0% 14.8% 26.5%
Gross Margin 21.8% 21.7% 2.1 p.p. 0.2 p.p. 1.9 p.p.
Expenses (23.7) (46.0) 29.1% 6.7% 4.6%
Operating income 40.3 73.9 25.9% 20.2% 45.3%
Operating Margin% 13.7% 13.4% 1.2 p.p. 0.8 p.p. 2.7 p.p.
(+) Depreciation 3.9 7.9 -36.7% -1.0% -21.2%
EBITDA 44.3 81.8 15.7% 18.0% 34.4%
EBITDA Margin% 15.1% 14.8% 0.1 p.p. 0.6 p.p. 2.1 p.p.
[The rest of the page was left intentionally blank]

9 Tegma Gestão Logística S.A | Earnings release | 2Q19 | in R$ million
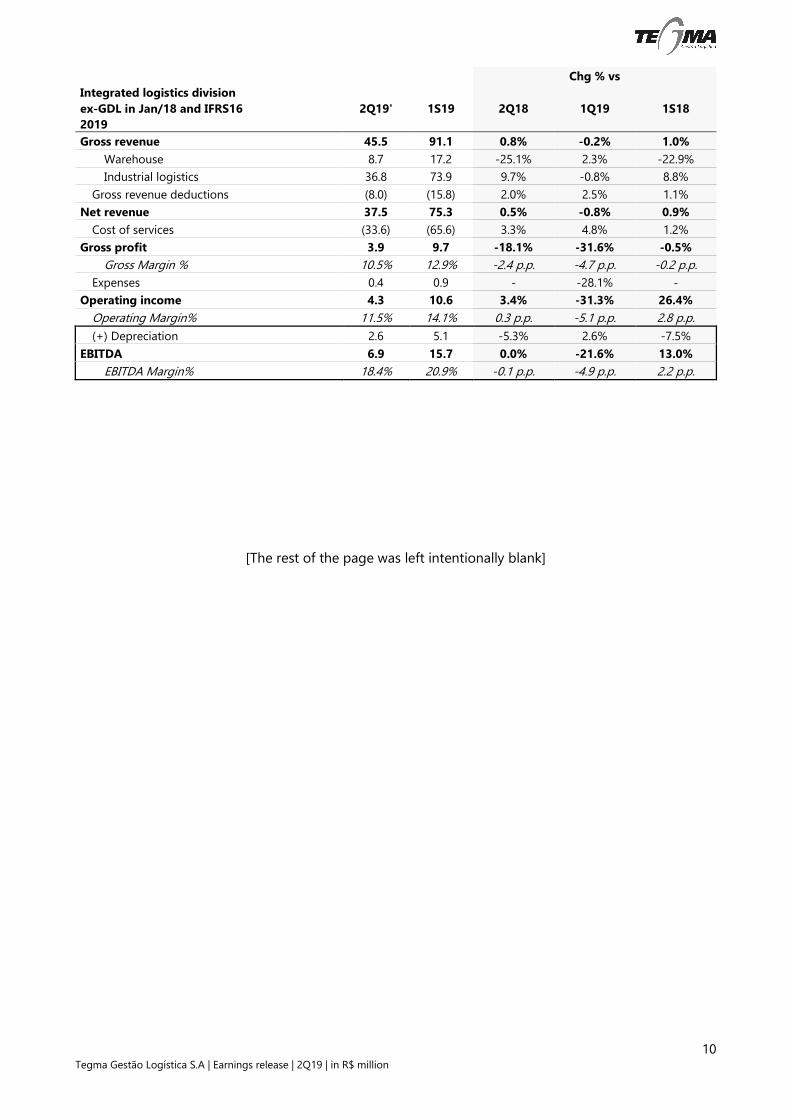
Results – Integrated logistics division
The upward trend in operating results of the integrated
logistics division reflects the restructuring of the
warehousing operation and the improved revenues from
the industrial logistics operation, combined with cost
control.
The 2Q19 gross revenues of warehouse operations
decreased 25.1% [-31.3% in 1S19; -22.9% in 1S19 without
GDL] in the annual comparison this variation is explained
by the loss of a client in January 2019 in the Rio de
Janeiro warehouse. The gross revenue from the industrial
logistics operation in the 2Q19 grew 9.7% [+8.8% in 1S19]
in the annual comparison due to the increase in the
transported and stored volume in chemicals operation
and to the increased number of trips of home appliances
operation.
The division’s 2Q19 gross margin was 11.6% [13.8% in
1S19]. Disregarding the IFRS 16 and GDL in Jan/18 the
margin would be 10.5% in 2Q19 [12.9% in 1S19], 240
bps and 20 bps lower, respectively in the annual
comparison as shown on the next page. The main effects
that hindered the evolution of margins in 1S19 were the
loss of a warehouse client and higher transportation costs
in industrial logistics operation for home appliances.
The division’s 2Q19 EBITDA margin was 28.8% [32.3% in
1S19]. Disregarding the IFRS 16, as shown in Annex I and
on the next page, the margin was 18.4% [20.9% in 1S19],
10 bps lower and 220 bps higher, respectively in the
annual comparison.
Chg % vs
Integrated logistics division 2Q19 1S19 2Q18 1Q19 1S18
Gross revenue 45.5 91.1 0.8% -0.2% -2.0%
Warehouse 8.7 17.2 -25.1% 2.3% -31.3%
Industrial logistics 36.8 73.9 9.7% -0.8% 8.8%
Gross revenue deductions (8.0) (15.8) 2.0% 2.5% -1.4%
Net revenue 37.5 75.3 0.5% -0.8% -2.1%
Cost of services (33.1) (64.9) 2.0% 4.3% -4.0%
Gross profit 4.4 10.4 -9.2% -27.7% 11.8%
Gross Margin % 11.6% 13.8% -1.2 p.p. -4.3 p.p. 1.7 p.p.
Expenses 0.4 0.9 - -28.1% -
Operating income 4.8 11.3 13.7% -27.7% 43.0%
Operating Margin% 12.7% 15.1% 1.5 p.p. -4.7 p.p. 4.7 p.p.
(+) Depreciation 6.0 13.0 122.1% -13.1% 123.3%
EBITDA 10.8 24.3 56.4% -20.2% 77.0%
EBITDA Margin% 28.8% 32.3% 10.3 p.p. -7.0 p.p. 14.4 p.p.
To access this spreadsheets in Excel, Click here.
0%
12%
24%
36%
48%
0
7
14
Adj EBITDA Adj EBITDA mg
0
12
24
36
48
Gross revenues
Chart 5 – Gross Revenue Integrated Logistics (in R$
mi)
Chart 6 – Adjusted EBITDA Integrated Logistics (in
R$ mi)
** 2017 and jan/18 proforma ex-GDL
** 2017 and jan/18 proforma ex-GDL
Ex-IFRS16 Ex-IFRS16
10 Tegma Gestão Logística S.A | Earnings release | 2Q19 | in R$ million
Chg % vs
Integrated logistics division
ex-GDL in Jan/18 and IFRS16
2019
2Q19' 1S19 2Q18 1Q19 1S18
Gross revenue 45.5 91.1 0.8% -0.2% 1.0%
Warehouse 8.7 17.2 -25.1% 2.3% -22.9%
Industrial logistics 36.8 73.9 9.7% -0.8% 8.8%
Gross revenue deductions (8.0) (15.8) 2.0% 2.5% 1.1%
Net revenue 37.5 75.3 0.5% -0.8% 0.9%
Cost of services (33.6) (65.6) 3.3% 4.8% 1.2%
Gross profit 3.9 9.7 -18.1% -31.6% -0.5%
Gross Margin % 10.5% 12.9% -2.4 p.p. -4.7 p.p. -0.2 p.p.
Expenses 0.4 0.9 - -28.1% -
Operating income 4.3 10.6 3.4% -31.3% 26.4%
Operating Margin% 11.5% 14.1% 0.3 p.p. -5.1 p.p. 2.8 p.p.
(+) Depreciation 2.6 5.1 -5.3% 2.6% -7.5%
EBITDA 6.9 15.7 0.0% -21.6% 13.0%
EBITDA Margin% 18.4% 20.9% -0.1 p.p. -4.9 p.p. 2.2 p.p.
[The rest of the page was left intentionally blank]

11 Tegma Gestão Logística S.A | Earnings release | 2Q19 | in R$ million
Results - Consolidated
The 2Q19 gross revenue 12.7% growth [13.2% in 1S19]
in the annual comparison is mainly due to the increase in
the number of vehicles transported in the period.
The 2Q19 gross margin was 20.9% [21.0% in 1S19].
Disregarding the IFRS 16 and GDL in Jan/18 it would be
20.5% [20.6% in 1S19], a 170 bps gain in the annual
comparison in both periods as shown in Annex I or on the
next page. This reflected the revenue growth and the
costs control mainly in the Automotive Logistics Division.
The expenses in 2Q19 (without GDL and ex-IFRS16) were
22.8% higher [stable in 1S19] in the annual comparison.
The 2Q19 growth mainly due to the increase in expenses
related to the settlement of long-term bonuses for part
of the Executive Officers and the unexpected expenses
associated with the establishment of Joint Venture GDL.
The 2Q19 EBITDA margin were 17.9% [18.4% in 1S19].
Disregarding the IFRS 16, as shown in Annex I and on the
next page, the EBITDA margin were 15.4% [15.5% in
1S19], stable vs. 2Q18 and 200 bps higher vs. 1S18. The
quarter margin stability was mainly due to higher
expenses.
Chg % vs
Consolidated 2Q19 1S19 2Q18 1Q19 1S18
Gross revenue 406.3 773.6 12.7% 10.6% 13.2%
Automotive Logistics 360.9 682.6 14.5% 12.2% 15.6%
Integrated Logistics 45.5 91.1 0.8% -0.2% -2.0%
Gross revenue deductions (74.7) (145.3) 11.4% 5.9% 13.6%
Net revenue 331.6 628.3 13.1% 11.8% 13.1%
Cost of services (262.3) (496.4) 10.2% 12.0% 10.0%
Personel (33.0) (61.1) 14.7% 17.1% 10.2%
Freight (211.1) (397.9) 12.2% 13.0% 12.5%
Others (41.0) (80.5) -1.3% 3.9% -0.1%
PIS and COFINS credit 22.9 43.1 11.4% 12.8% 12.0%
Gross profit 69.3 131.9 25.5% 10.8% 26.7%
Gross Margin % 20.9% 21.0% 2.1 p.p. -0.2 p.p. 2.2 p.p.
Expenses (23.5) (45.4) 23.8% 7.3% 0.3%
Operating income 45.8 86.4 26.4% 12.7% 47.0%
Operating Margin% 13.8% 13.8% 1.5 p.p. 0.1 p.p. 3.2 p.p.
(+) Depreciation 13.6 29.0 53.1% -11.4% 83.6%
EBITDA 59.4 115.5 31.7% 6.1% 54.8%
EBITDA Margin% 17.9% 18.4% 2.5 p.p. -1.0 p.p. 4.9 p.p.
To access those spreadsheets in Excel, Click here.
0%
12%
24%
0
14
28
42
56
70
84
Adj EBITDA Adj EBITDA mg
0%
11%
22%
33%
0
110
220
330
440
550
Gross revenues Chg% YoY
Chart 7 – Gross revenue consolidated (in R$ mi)
** 2017 and jan/18 proforma ex-GDL
Chart 8 – Consolidated adjusted EBITDA (in R$ mi)
** 2017 and jan/18 proforma ex-GDL Ex-IFRS16 Ex-IFRS16

12 Tegma Gestão Logística S.A | Earnings release | 2Q19 | in R$ million
Chg % vs
Consolidated ex-GDL
in Jan/18 and IFRS16
in 2019
2Q19 1S19 2Q18 1Q19 1S18
Gross revenue 406.3 773.6 12.7% 10.6% 13.7%
Automotive Logistics 360.9 682.6 14.5% 12.2% 15.6%
Integrated Logistics 45.5 91.1 0.8% -0.2% 1.0%
Gross revenue deductions (74.7) (145.3) 11.4% 5.9% 14.0%
Net revenue 331.6 628.3 13.1% 11.8% 13.6%
Cost of services (263.6) (498.7) 10.7% 12.1% 11.2%
Personel (33.0) (61.1) 14.7% 17.1% 12.4%
Freight (211.1) (397.9) 12.2% 13.0% 12.5%
Others (42.3) (82.8) 1.9% 4.6% 5.1%
PIS and COFINS credit 22.9 43.1 11.4% 12.8% 12.3%
Gross profit 68.0 129.6 23.1% 10.5% 24.0%
Gross Margin % 20.5% 20.6% 1.7 p.p. -0.2 p.p. 1.7 p.p.
Expenses (23.3) (45.0) 22.8% 7.5% -0.5%
Operating income 44.7 84.5 23.3% 12.1% 42.6%
Operating Margin% 13.5% 13.5% 1.1 p.p. - 2.7 p.p.
(+) Depreciation 6.5 13.0 -27.1% -57.8% -16.4%
EBITDA 51.2 97.5 13.3% -7.4% 30.4%
EBITDA Margin% 15.4% 15.5% - -3.2 p.p. 2.0 p.p.
[The rest of the page was left intentionally blank]

13 Tegma Gestão Logística S.A | Earnings release | 2Q19 | in R$ million
Results – Consolidated ….continuation
The 24.7% decrease in interest expenses, net of revenue from financial investments for 2Q19 [-17.2% in 1S19]
in the annual comparison is mainly due to the reduction of gross debt and its spread over the period.
Chg % vs
2Q19 1S19 2Q18 1Q19 1S18
Revenue from financial investments 1.9 3.2 0.5% 34.4% -25.2%
Interest expenses (2.7) (5.2) -9.0% 5.6% -22.3%
Interest expenses, net of revenue
from financial investments (0.8) (2.0) -24.7% -28.3% -17.2%
Interest on leasing (1.6) (2.0) - - -
Other financial revenues (expenses) (0.2) 0.4 - - -
Financial result (2.7) (4.6) 225.4% 41.6% 68.9%
Equity, which corresponds to the operation of GDL (50% of
bonded and general warehousing in Espirito Santo and 49% of
Catlog), was positive by R$ 0.3 million in 2Q19 [-R$ 0.2 million in
1S19]. In the table beside we can see the 100% GDL result with a
2Q19 revenue growth versus 2Q18 and a significant
improvement in operating and net results.
The effective income tax rate for 2Q19 was -25.1% mainly due
to the exclusion of the income from the ICMS tax credit from the tax base and the payment of interest on
equity in May 2019 considering 2018 results.
Chg % vs
2Q19 1S19 2Q18 1Q19 1S18
Income before tax 43.4 81.6 23.5% 13.7% 47.3%
Real tax rate -34.0% -34.0% - - -
Income tax and social contribution
at the nominal rates (14.8) (27.8) 23.5% 13.7% 47.3%
Presumed ICMS tax credit 1.5 3.2 23.6% -10.3% 39.2%
Interest on own capital 2.4 2.4 -38.4% - -38.4%
Permanent differences, equity equivalence and others (0.1) (0.3) -60.0% -75.5% -43.6%
Income tax (10.9) (22.5) 56.1% -5.6% 70.0%
Effective tax Rate -25.1% -27.6% -5.3 p.p. 5.2 p.p. -3.7 p.p.
2Q19 net income was 15.4% higher [+40.2% in 1S19] in the annual comparison, mainly due to operational
improvements, the reduction of net financial expenses and the reduction of the effective income tax rate.
Chg % vs
Consolidated 2Q19 1S19 2Q18 1Q19 1S18
Operating income 45.8 86.4 26.4% 12.7% 47.0%
Financial result (2.7) (4.6) 225.7% 41.6% 68.9%
Equity 0.3 (0.2) - - -68.3%
Income before tax 43.4 81.6 23.5% 13.7% 47.3%
Income tax (10.9) (22.5) 56.1% -5.6% 70.0%
Net income 32.5 59.1 15.4% 22.1% 40.2%
Chg % vs
GDL (100%) 2Q19 1S19 2Q18
Net Revenue 16.3 32.0 28.5%
EBIT 2.9 1.6 -
EBIT Margin% 17.9% 5.1% 21.2 p.p.
Net
income/(loss) 1.0 0.2 -
Net margin % 6.4% 0.6% 6.5 p.p.

14 Tegma Gestão Logística S.A | Earnings release | 2Q19 | in R$ million
Cash flow
2Q19 free cash flow was R$ 36.6 million [R$ 82.9 million
in 1S19]. If we disregard the effect of IFRS 16, it would
have been R$ 30.1 million in 2Q19 [+R$ 70.8 million in
1S19]. In 2Q19, we received R$ 12.3 million from the
lawsuit which Tegma requested to be exempted from
contributing to FUNDAF regarding a tax on revenue from
customs bonded services at its operation in Cariacica-ES.
The company´s cash to cash cycle has been at a higher
level, as shown in Chart 9, due to the negotiation of
payments terms of important clients alongside with new
services rendered and with postponements of contracts.
The 2Q19 maintenance of the cash to cash cycle vs. 1Q19
was due to a two-day drop in both “days receivable” and “days payable”.
CAPEX for 2Q19 was R$ 14.6 million [R$ 21.2 million in
1S19], according to the segregation shown in the
following table. The most relevant investment in the
quarter was the acquisition of transportation equipment
for i) the operation of vehicles logistics for the trucks own
fleet renewal aiming modernization in the amount of R$
5.2 million and ii) the chemicals operation due to
contract renewal with the main client that demanded
more silo carriers, in the amount of R$ 3.1 million.
Net cash generated by investing activities for 2Q19 was negative by R$ 38.2 million due
to: i) payment of dividends and IOC of 2018 in the amount of 28.3 million, ii) debt principal settlement
payment of R$ 3.3 million and iii) IFRS 16 lease payment in the amount of R$ 6.5 million. In 1S19 the line was
negative in R$60.4 million due to debt settlement, net of funding of R$ 20.0 million, lease payment (IFRS 16)
of R$ 12.1 million and dividends/IOC.
2Q19 2Q18 1S19 1S18
A - Cash at beginning of period 108.0 125.5 83.5 148.7
Operating cash flow (1) 51.4 11.9 107.0 59.2
(-) Capital expenditures "cash" (2) (14.8) (3.8) (24.1) (6.9)
B - Free cash flow (1 + 2) 36.6 8.1 82.9 52.3
C - Net cash generated by investing
activities (ex CAPEX) 0.3 0.6 0.7 (0.1)
D - Net cash from financing activities (38.2) (43.5) (60.4) (110.3)
(=) Cash at end of period (A + B + C + D) 106.8 90.7 106.8 90.7
(consolidated)
CAPEX 2Q19 2Q18 1S19 1S18
Land improvements 1.6 0.2 5.0 0.2
New operations 0.1 1.4 0.3 1.4
Maintenance 3.0 1.6 3.5 3.1
General improvements 0.7 0.5 1.3 0.5
Transport equipment 5.2 - 5.4 -
IT 0.8 1.1 2.6 2.1
Contract renewal 3.1 - 3.2 -
Total 14.6 4.7 21.2 7.2
1127
11
44
8 18 2
4637
25 24 26
3035
3234
37 37
-5
5
15
25
35
45
0
20
40
60
Free cash flow Cash to cash cycle
Chart 9 – Free cash flow (in R$ mi) and cash to cash
cycle (in days) consolidated
Cash to cash cycle: days to receive - days to pay (Suppliers and freight /
daily COGS)
(consolidated)
)
15 Tegma Gestão Logística S.A | Earnings release | 2Q19 | in R$ million
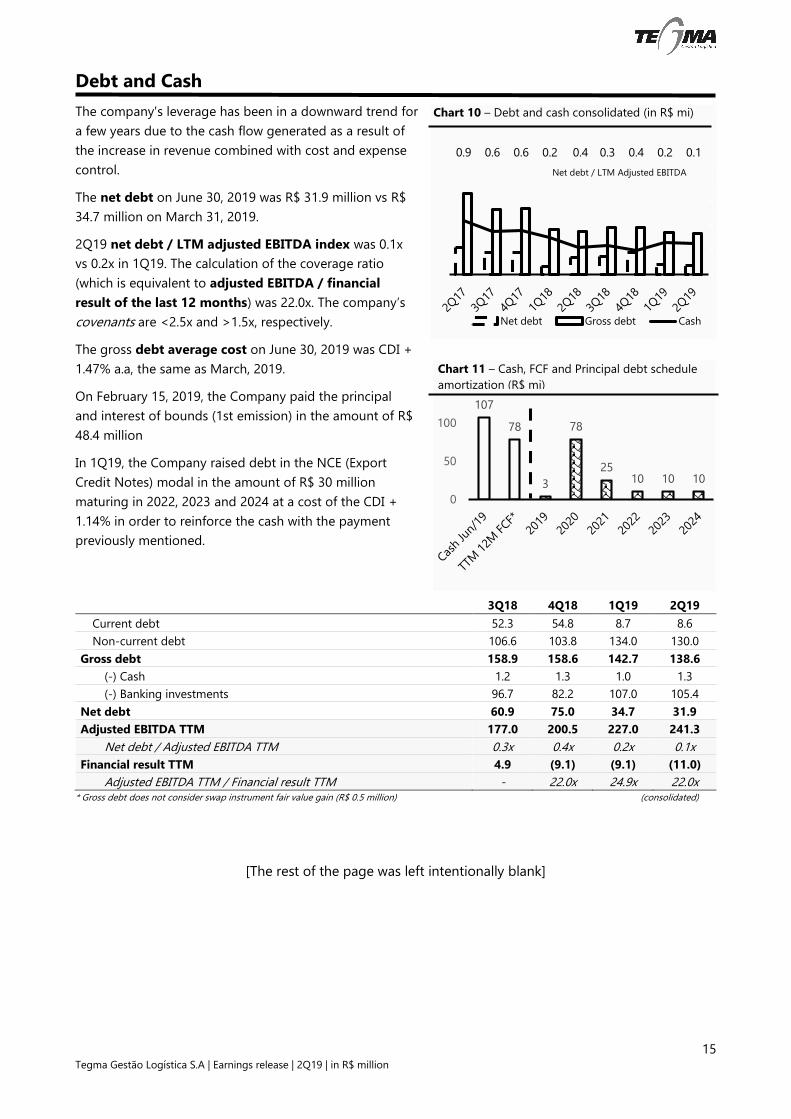
Debt and Cash
The company's leverage has been in a downward trend for
a few years due to the cash flow generated as a result of
the increase in revenue combined with cost and expense
control.
The net debt on June 30, 2019 was R$ 31.9 million vs R$
34.7 million on March 31, 2019.
2Q19 net debt / LTM adjusted EBITDA index was 0.1x
vs 0.2x in 1Q19. The calculation of the coverage ratio
(which is equivalent to adjusted EBITDA / financial
result of the last 12 months) was 22.0x. The company’s
covenants are <2.5x and >1.5x, respectively.
The gross debt average cost on June 30, 2019 was CDI +
1.47% a.a, the same as March, 2019.
On February 15, 2019, the Company paid the principal
and interest of bounds (1st emission) in the amount of R$
48.4 million
In 1Q19, the Company raised debt in the NCE (Export
Credit Notes) modal in the amount of R$ 30 million
maturing in 2022, 2023 and 2024 at a cost of the CDI +
1.14% in order to reinforce the cash with the payment
previously mentioned.
3Q18 4Q18 1Q19 2Q19
Current debt 52.3 54.8 8.7 8.6
Non-current debt 106.6 103.8 134.0 130.0
Gross debt 158.9 158.6 142.7 138.6
(-) Cash 1.2 1.3 1.0 1.3
(-) Banking investments 96.7 82.2 107.0 105.4
Net debt 60.9 75.0 34.7 31.9
Adjusted EBITDA TTM 177.0 200.5 227.0 241.3
Net debt / Adjusted EBITDA TTM 0.3x 0.4x 0.2x 0.1x
Financial result TTM 4.9 (9.1) (9.1) (11.0)
Adjusted EBITDA TTM / Financial result TTM - 22.0x 24.9x 22.0x * Gross debt does not consider swap instrument fair value gain (R$ 0.5 million) (consolidated)
[The rest of the page was left intentionally blank]
107
78
3
78
2510 10 10
0
50
100
0.9 0.6 0.6 0.2 0.4 0.3 0.4 0.2 0.1
-1000,0
-800,0
-600,0
-400,0
-200,0
0,0
200,0
0
150
300
450
Net debt Gross debt Cash
Chart 11 – Cash, FCF and Principal debt schedule
amortization (R$ mi)
Net debt / LTM Adjusted EBITDA
Chart 10 – Debt and cash consolidated (in R$ mi)
16 Tegma Gestão Logística S.A | Earnings release | 2Q19 | in R$ million
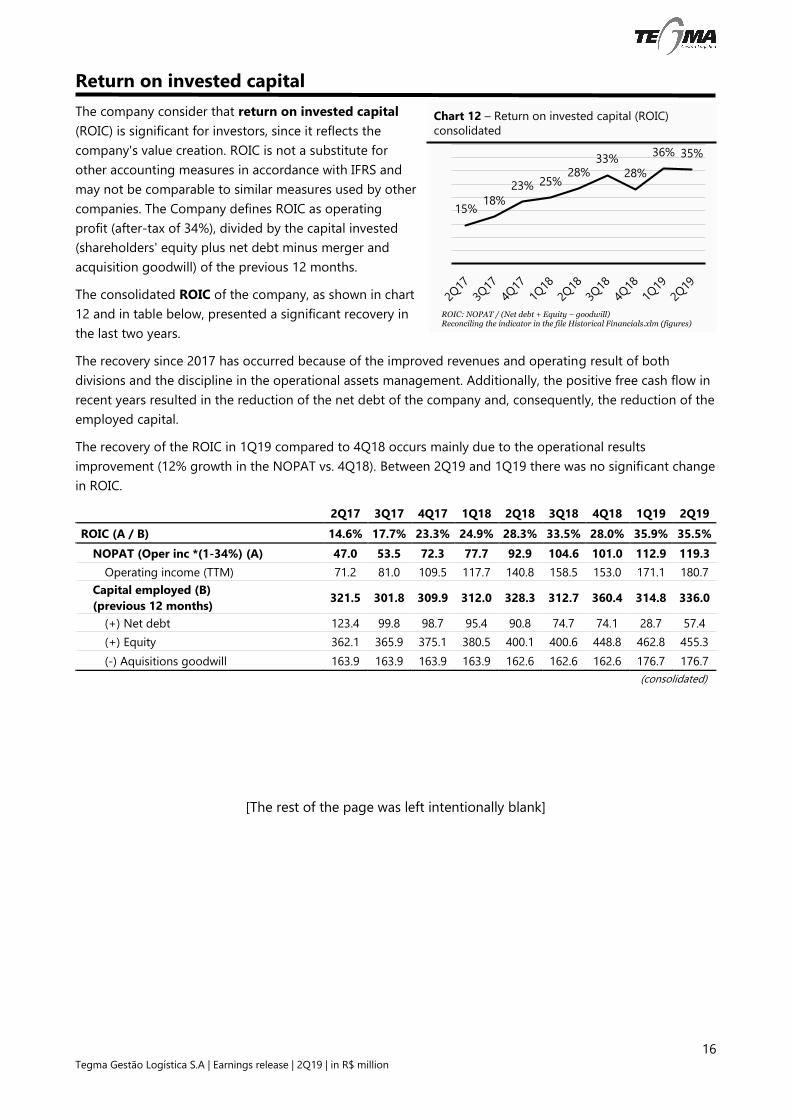
Return on invested capital
The company consider that return on invested capital
(ROIC) is significant for investors, since it reflects the
company's value creation. ROIC is not a substitute for
other accounting measures in accordance with IFRS and
may not be comparable to similar measures used by other
companies. The Company defines ROIC as operating
profit (after-tax of 34%), divided by the capital invested
(shareholders' equity plus net debt minus merger and
acquisition goodwill) of the previous 12 months.
The consolidated ROIC of the company, as shown in chart
12 and in table below, presented a significant recovery in
the last two years.
The recovery since 2017 has occurred because of the improved revenues and operating result of both
divisions and the discipline in the operational assets management. Additionally, the positive free cash flow in
recent years resulted in the reduction of the net debt of the company and, consequently, the reduction of the
employed capital.
The recovery of the ROIC in 1Q19 compared to 4Q18 occurs mainly due to the operational results
improvement (12% growth in the NOPAT vs. 4Q18). Between 2Q19 and 1Q19 there was no significant change
in ROIC.
2Q17 3Q17 4Q17 1Q18 2Q18 3Q18 4Q18 1Q19 2Q19
ROIC (A / B) 14.6% 17.7% 23.3% 24.9% 28.3% 33.5% 28.0% 35.9% 35.5%
NOPAT (Oper inc *(1-34%) (A) 47.0 53.5 72.3 77.7 92.9 104.6 101.0 112.9 119.3
Operating income (TTM) 71.2 81.0 109.5 117.7 140.8 158.5 153.0 171.1 180.7
Capital employed (B)
(previous 12 months) 321.5 301.8 309.9 312.0 328.3 312.7 360.4 314.8 336.0
(+) Net debt 123.4 99.8 98.7 95.4 90.8 74.7 74.1 28.7 57.4
(+) Equity 362.1 365.9 375.1 380.5 400.1 400.6 448.8 462.8 455.3
(-) Aquisitions goodwill 163.9 163.9 163.9 163.9 162.6 162.6 162.6 176.7 176.7
(consolidated)
[The rest of the page was left intentionally blank]
15%18%
23% 25%28%
33%
28%
36% 35%
0
0
0
0
0
0
0
0
0
0
Chart 12 – Return on invested capital (ROIC)
consolidated
ROIC: NOPAT / (Net debt + Equity – goodwill) Reconciling the indicator in the file Historical Financials.xlm (figures)

17 Tegma Gestão Logística S.A | Earnings release | 2Q19 | in R$ million
Annex I – Income statement ex-GDL in Jan/18 and ex-IFRS
Automotive logistics 2Q18 2Q19 IFRS16 2Q19' 2Q19' Vs
2Q18
Gross revenue´ 315.3 360.9 - 360.9 14.5%
Deductions from gross revenue´ (59.3) (66.7) - (66.7) 12.6%
Net Revenue´ 256.0 294.1 - 294.1 14.9%
(-) Cost of services provided´ (205.6) (229.1) (0.9) (230.0) 11.9%
Gross profit´ 50.4 65.0 (0.9) 64.1 27.0%
Gross mg %´ 19.7% 22.1% (0.3) 21.8% 2.1 p.p
Expenses´ (18.4) (23.9) 0.2 (23.7) 29.1%
Operating profit´ 32.1 41.1 (0.7) 40.3 25.9%
Operating mg %´ 12.5% 14.0% (0.2) 13.7% 1.2 p.p
(+) Depreciation´ (6.2) (7.6) 3.7 (3.9) -36.7%
EBITDA´ 38.2 48.7 (4.4) 44.3 15.7%
EBITDA mg%´ 14.9% 16.5% (1.5) 15.1% 0.1 p.p
Integrated logistics 2Q18 2Q19 IFRS16 2Q19' 2Q19' Vs
2Q18
Gross revenue´ 45.1 45.5 - 45.5 0.8%
Warehouses´ 11.6 8.7 - 8.7 -25.1%
Industrial logistics´ 33.5 36.8 - 36.8 9.7%
Deductions from gross revenue´ (7.8) (8.0) - (8.0) 2.0%
Net Revenue´ 37.3 37.5 - 37.5 0.5%
(-) Cost of services provided´ (32.5) (33.1) (0.4) (33.6) 3.3%
Gross profit´ 4.8 4.4 (0.4) 3.9 -18.1%
Gross mg %´ 12.9% 11.6% (1.1) 10.5% -2.4 p.p
Expenses´ (0.6) 0.4 - 0.4 -
Operating profit´ 4.2 4.8 (0.4) 4.3 3.4%
Operating mg %´ 11.2% 12.7% (1.1) 11.5% 0.3 p.p
(+) Depreciation´ (2.7) (6.0) 3.5 (2.6) -5.3%
EBITDA´ 6.9 10.8 (3.9) 6.9 0.0%
EBITDA mg%´ 18.5% 28.8% (10.4) 18.4% -0.1 p.p
Consolidated 2Q18 2Q19 IFRS16 2Q19' 2Q19' Vs
2Q18
Gross revenue´ 360.4 406.3 - 406.3 12.7%
Deductions from gross revenue´ (67.1) (74.7) - (74.7) 11.4%
Net Revenue´ 293.3 331.6 - 331.6 13.1%
(-) Cost of services provided´ (238.0) (262.3) (1.3) (263.6) 10.7%
Gross profit´ 55.2 69.3 (1.3) 68.0 23.1%
Gross mg %´ 18.8% 20.9% (0.4) 20.5% 1.7 p.p
Expenses´ (19.0) (23.5) 0.2 (23.3) 22.8%
Operating profit´ 36.2 45.8 (1.1) 44.7 23.3%
Operating mg %´ 12.4% 13.8% (0.3) 13.5% 1.1 p.p
(+) Depreciation´ (8.9) (13.6) 7.1 (6.5) -27.1%
EBITDA´ 45.1 59.4 (8.3) 51.2 13.3%
EBITDA mg%´ 15.4% 17.9% (2.5) 15.4% -
Operating profit´ 36.2 45.8 (1.1) 44.7 23.3%
Financial result´ (0.8) (2.7) 1.6 (1.1) 29.8%
Equity´ (0.2) 0.3 - 0.3 -
Profit before IR and CS´ 35.2 43.4 0.5 43.9 24.8%
Income tax and social contribution´ (7.0) (10.9) - (10.9) 56.1%
Net profit/loss´ 28.2 32.5 0.5 33.0 17.1%
* To access this spreadsheets in Excel, Click here.

18 Tegma Gestão Logística S.A | Earnings release | 2Q19 | in R$ million
Automotive logistics 1S18 1S19 IFRS16 1S19' 1S19' Vs
1S18
Gross revenue´ 590.3 682.6 - 682.6 15.6%
Deductions from gross revenue´ (111.9) (129.5) - (129.5) 15.8%
Net Revenue´ 478.5 553.0 - 553.0 15.6%
(-) Cost of services provided´ (383.7) (431.5) (1.6) (433.1) 12.9%
Gross profit´ 94.8 121.5 (1.6) 119.9 26.5%
Gross mg %´ 19.8% 22.0% (0.3) 21.7% 1.9 p.p
Expenses´ (43.9) (46.4) 0.4 (46.0) 4.6%
Operating profit´ 50.9 75.1 (1.2) 73.9 45.3%
Operating mg %´ 10.6% 13.6% (0.2) 13.4% 2.7 p.p
(+) Depreciation´ (10.0) (16.0) 8.2 (7.9) -21.2%
EBITDA´ 60.9 91.1 (9.4) 81.8 34.4%
EBITDA mg%´ 12.7% 16.5% (1.7) 14.8% 2.1 p.p
Integrated logistics ex GDL 1S18 1S19 IFRS16 1S19' 1S19' Vs
1S18
Gross revenue´ 90.2 91.1 - 91.1 1.0%
Warehouses´ 22.3 17.2 - 17.2 -22.9%
Industrial logistics´ 67.9 73.9 - 73.9 8.8%
Deductions from gross revenue´ (15.6) (15.8) - (15.8) 1.1%
Net Revenue´ 74.6 75.3 - 75.3 0.9%
(-) Cost of services provided´ (64.8) (64.9) (0.7) (65.6) 1.2%
Gross profit´ 9.7 10.4 (0.7) 9.7 -0.5%
Gross mg %´ 13.1% 13.8% (0.9) 12.9% -0.2 p.p
Expenses´ (1.3) 0.9 - 0.9 -
Operating profit´ 8.4 11.3 (0.7) 10.6 26.4%
Operating mg %´ 11.3% 15.1% (0.9) 14.1% 2.8 p.p
(+) Depreciation´ (5.5) (13.0) 7.9 (5.1) -7.5%
EBITDA´ 13.9 24.3 (8.6) 15.7 13.0%
EBITDA mg%´ 18.7% 32.3% (11.4) 20.9% 2.2 p.p
Consolidated ex GDL 1S18 1S19 IFRS16 1S19' 1S19' Vs
1S18
Gross revenue´ 680.5 773.6 - 773.6 13.7%
Deductions from gross revenue´ (127.5) (145.3) - (145.3) 14.0%
Net Revenue´ 553.0 628.3 - 628.3 13.6%
(-) Cost of services provided´ (448.5) (496.4) (2.3) (498.7) 11.2%
Gross profit´ 104.5 131.9 (2.3) 129.6 24.0%
Gross mg %´ 18.9% 21.0% (0.4) 20.6% 1.7 p.p
Expenses´ (45.3) (45.4) 0.4 (45.0) -0.5%
Operating profit´ 59.3 86.4 (1.9) 84.5 42.6%
Operating mg %´ 10.7% 13.8% (0.3) 13.5% 2.7 p.p
(+) Depreciation´ (15.5) (29.0) 16.1 (13.0) -16.4%
EBITDA´ 74.8 115.5 (18.0) 97.5 30.4%
EBITDA mg%´ 13.5% 18.4% (2.9) 15.5% 2.0 p.p
Operating profit´ 58.8 86.4 (1.9) 84.5 43.8%
Financial result´ (2.7) (4.6) 2.9 (1.7) -38.7%
Equity´ (0.7) (0.2) - (0.2) -68.3%
Profit before IR and CS´ 55.4 81.6 1.0 82.7 49.2%
Income tax and social contribution´ (13.2) (22.5) - (22.5) 70.0%
Net profit/loss´ 42.2 59.1 1.0 60.2 42.6%
To access this spreadsheets in Excel, Click here.

19 Tegma Gestão Logística S.A | Earnings release | 2Q19 | in R$ million
Capital Markets TGMA3
- At the beginning of 2019, Tegma shares had a lower
performance than the market due to uncertainties
related to the transportation sector, freight prices table
and the economy recovery, despite the good results in
the period. Recently, with the approval of the pension
reform, the share was equal to the market. The
company's market cap today stands at around R$ 2.1
billion (R$ 33 per share).
8
- The daily liquidity of Tegma shares in 1S19 was R$
6.7 million traded daily (USD 1.7 million). TGMA3's
tradability index vs IBX-100 has been slightly lower in
2019 compared to 2018. One reason for the drop in
the index would be the concentration of Tegma shares
in some of our investors.
- The dividends and interest on capital of the last two
years corresponded to 60% of payout and a dividend
yield between 4-5%.
- Tegma stocks has been traded at multiples PE and
EV/EBITDA 2019 of 14.0x and 8.2x in 3Q19
Payout % Div Yld %
LTM
Dividend
per share (R$)
2018 60% 4.3% 1.0
2017 60% 4.9% 0.9
2016 61% 1.0% 0.1
2015 53% 1.4% 0.1
2014 - - 0.0
2013 100% 3.4% 0.7
2012 81% 3.2% 1.0
2011 71% 4.2% 1.0
7,86,9 6,9
7,88,8
8,0 8,2
15,1
12,9 12,713,8
15,5
13,314,0
1Q18 2Q18 3Q18 4Q18 1Q19 2Q19 2Q19
EV EBITDA 2019 PE 2019
0,000%
0,005%
0,010%
0,015%
0,020%
0,025%
0,030%
0
2
4
6
8
10
12
14
Feb-18 Jun-18 Oct-18 Feb-19 Jun-19
ADTV (R$ million)
Tradability index %
-27
-17
-7
3
13
23
JAN-19 MAR-19 MAI-19 JUL-19
IBOV TGMA3
Chart 13 – TGMA3 and IBOV Base zero
(Jan/02/2019)
Chart 14 –TGMA3 ADTV
Table 3 – Dividends and Payout
Chart 15 – Multiples TGMA3
Average sell side estimates (2019)
Nominal stock prices.

20 Tegma Gestão Logística S.A | Earnings release | 2Q19 | in R$ million
Shareholder composition
Shareholder # stocks TGMA3 ON % Total
Mopia Participações e Empreendimentos Ltda. 15,396,481 23.3%
Cabana Empreendimentos e Participações Ltda. 4,817,704 7.3%
Coimex Empreendimentos e Participações Ltda. 13,207,034 20.0%
Other controlling shareholders (non institutional) 509,473 0.8%
Directors and administration board 201 0.0%
Treasury 65,143 0.1%
Controllers, administrators e treasury 33,996,036 51.5%
Free float 32,006,879 48.5%
Total stocks 66,002,915 100.0%
[The rest of the page was left intentionally blank]

21 Tegma Gestão Logística S.A | Earnings release | 2Q19 | in R$ million
Tegma Gestão Logística SA and subsidiaries
Income statement
(in R$ million)
Income statement 2Q19 2Q18 Chg % vs
2Q18 1S19 1S18
Chg % vs
1S18
Gross revenue 406.3 360.4 12.7% 773.6 683.2 13.2%
Taxes and deductions (74.7) (67.1) 11.4% (145.3) (127.9) 13.6%
Net revenue 331.6 293.3 13.1% 628.3 555.3 13.1%
(-) Cost of services (262.3) (238.0) 10.2% (496.4) (451.3) 10.0%
Personnel (33.0) (28.8) 14.7% (61.1) (55.5) 10.2%
Freight (211.1) (188.2) 12.2% (397.9) (353.7) 12.5%
Others (41.0) (41.6) -1.3% (80.5) (80.6) -0.1%
Taxes credit (PIS and COFINS) 22.9 20.5 11.4% 43.1 38.5 12.0%
Gross profit 69.3 55.2 25.5% 131.9 104.1 26.7%
General and administrative expenses (20.3) (16.2) 25.4% (39.1) (36.8) 6.3%
Other expenses and revenues (3.2) (2.8) 14.8% (6.3) (8.5) -25.7%
Operating income 45.8 36.2 26.4% 86.4 58.8 47.0%
(+) Depreciation 13.6 8.9 53.1% 29.0 15.8 83.6%
= EBITDA 59.4 45.1 31.7% 115.5 74.6 54.8%
Mg% EBITDA 17.9% 15.4% 2.5 p.p. 18.4% 13.4% 4.9 p.p.
Financial result (2.7) (0.8) -69.3% (4.6) (2.7) 68.9%
Equity 0.3 (0.2) - (0.2) (0.7) -68.3%
Income before tax 43.4 35.2 23.5% 81.6 55.4 47.3%
Income tax (10.9) (7.0) 56.1% (22.5) (13.2) 70.0%
Net income 32.5 28.2 15.4% 59.1 42.2 40.2%
Net margin % 9.8% 9.6% 0.2 p.p. 9.4% 7.6% 1.8 p.p.
[The rest of the page was left intentionally blank]

22 Tegma Gestão Logística S.A | Earnings release | 2Q19 | in R$ million
Tegma Gestão Logística SA and subsidiaries
Balance sheet
(in R$ million)
Dec-18 Mar-19 Jun-19
Current assets 337.5 338.4 350.7
Cash 1.3 1.0 1.3
Banking investments 82.2 107.0 105.4
Accounts receivable 226.2 202.6 215.9
Related parties 4.1 2.6 3.0
Inventories 0.2 0.2 0.2
Income tax and social contribution 3.3 3.5 3.3
Taxes to recover 12.0 12.3 12.6
Other receivables 6.8 6.2 5.5
Dividends receivable - 0.1 -
Prepaid expenses 1.3 2.9 3.4
Non-current assets 471.9 537.6 549.2
Taxes to recover 9.4 9.5 9.6
Other receivables 6.7 6.7 7.2
Deferred taxes 16.1 15.7 15.7
Related parties 15.6 16.0 3.4
Judicial deposits 11.9 11.6 1.9
Derivative financial instruments 1.6 2.7 12.0
Investments 19.3 18.6 18.8
Property, plant and equipment 202.2 201.7 210.3
Intangible assets 189.1 189.3 188.7
Right of use assets - 65.8 81.6
Total assets 809.4 876.0 899.9
Dec-18 Mar-19 Jun-19
Current liabilities 170.6 134.7 143.6
Loans and financing 6.7 7.6 8.5
Bonds 48.1 1.2 0.1
Lease liabilities - 27.2 29.1
Suppliers and freights payable 36.9 32.1 30.7
Taxes payable 15.1 15.9 14.8
Refinanced taxes 24.3 20.6 24.3
Salaries and social charges 30.9 22.6 25.3
Other accounts payable 2.3 0.1 1.0
Related parties 6.4 7.4 9.9
Non-current liabilities 154.4 230.3 240.4
Loans and financing 55.4 86.7 81.9
Related parties 2.0 2.1 2.4
Bonds 50.0 50.0 50.0
Lease liabilities - 42.6 57.1
Deferred taxes 2.6 5.8 6.1
Provision for contingencies and other liabilities 44.4 43.2 42.8
Shareholders equity 484.4 511.0 515.8
Capital stock 144.5 144.5 144.5
Capital reserve 174.1 174.1 174.1
Profit reserve 138.2 138.2 138.2
Retained earnings - 26.6 59.1
Treasury shares (0.3) (0.3) (0.3)
Assets valuation adjustment (0.3) (0.3) 0.3
Additional proposed dividend 28.3 28.3 -
Total liabilities and shareholders' equity 809.4 876.0 899.9

23 Tegma Gestão Logística S.A | Earnings release | 2Q19 | in R$ million
Tegma Gestão Logística SA and subsidiaries
Cash flow statement
(in R$ million)
2Q19 2Q18 1S19 1S18
Income before income and social contribution taxes 43.4 35.2 81.6 55.4
Depreciation and amortization 6.5 8.9 13.0 15.8
Right of use assets amortization 7.1 - 16.1 -
Interest and exchange variation on unpaid loans and debentures 1.0 3.0 4.6 6.7
(Reversal of) provision for contingencies 4.6 2.1 9.0 12.4
Interest on leasing 1.6 - 2.9 -
Loss in goodwill withdraw - - - 2.5
Fair value in investment transfer - - - (1.8)
Swap result 1.7 - 0.6 -
Equity (0.3) 0.2 0.2 0.7
Loss (gains) on disposal of assets (0.0) 0.0 0.0 0.4
Allowance for (reversal of) doubtful accounts (1.5) (1.0) (1.4) (0.9)
Expenses (revenues) not affecting cash flows 20.7 13.3 45.0 35.8
Accounts receivable (11.8) (25.4) 11.8 (7.0)
Taxes recoverable (0.9) 5.0 (1.6) 18.5
Judicial deposits (0.7) (0.7) (1.2) (1.1)
Other assets (0.3) (0.7) (1.4) (7.6)
Suppliers and freight payable (1.2) (5.0) (3.3) (7.5)
Salaries and related charges 3.7 1.6 0.0 (1.1)
Increase (decrease) in related parties 13.5 0.1 12.6 (0.5)
Other liabilities 1.6 0.6 (6.2) (2.8)
Changes in assets and liabilities 3.9 (24.6) 10.7 (9.1)
Interest on loans, financing and swap (0.4) (1.3) (0.4) (2.2)
Interest on debentures (2.1) (3.1) (3.8) (7.8)
Interest on leasing (1.6) - (2.4) -
Lawsuits paid (4.7) (2.9) (9.3) (7.5)
Income and social contribution taxes paid (7.8) (4.6) (14.5) (5.3)
(A) Net cash generated by (used in) operating activities 51.4 11.9 107.0 59.2
Dividends received 0.3 0.2 0.3 0.2
Acquisition of intangible assets (0.8) (0.6) (2.5) (1.8)
Acquisition of property and equipment and intangible assets (13.9) (3.2) (21.6) (5.2)
Proceeds from sale of assets 0.0 0.4 0.4 0.4
Cash from Tegma Logistica Integrada S.A. - - - (0.7)
(B) Net cash generated by (used in) investing activities (14.5) (3.2) (23.4) (7.0)
Dividend paid (28.3) (38.9) (28.3) (38.9)
New loans - - 30.0 -
Payment of debentures (3.3) (4.6) (50.0) (71.4)
Payment of leasing (6.5) - (12.1) -
(C) Net cash generated by (used in) financial activities (38.2) (43.5) (60.4) (110.3)
Changes in cash (A + B + C) (1.2) (34.8) 23.2 (58.0)
Cash at beginning of period 108.0 125.5 83.5 148.7
Cash at end of year 106.8 90.7 106.8 90.7

24 Tegma Gestão Logística S.A | Earnings release | 2Q19 | in R$ million
Tegma Gestão Logística SA and subsidiaries
Statements of change in equity
(in R$ million)
Cap
ital
Cap
ital re
serv
e
Leg
al re
serv
e
Reta
ined
pro
fit
Ad
dic
ion
al d
ivid
en
d
pro
po
sed
Tre
asu
ry s
tock
Eq
uit
y a
dju
stm
en
t
Reta
ined
earn
ing
s
(acc
um
ula
ted
lo
sses)
To
tal eq
uit
y
Balance on January 1, 2018 144.5 174.1 28.9 66.0 35.7 (0.3) - - 448.8
Net income for the period - - - - - - - 42.2 42.2
Dividends and interest on capital - - - - (35.7) - - - (35.7)
Balance on June 30, 2018 144.5 174.1 28.9 66.0 - (0.3) - 42.2 455.3
Balance on April 1, 2018 144.5 174.1 28.9 66.0 35.7 (0.3) - 14.0 462.8
Net income for the period - - - - - - - 28.2 28.2
Dividends and interest on capital - - - - (35.7) - - - (35.7)
Balance on June 30, 2018 144.5 174.1 28.9 66.0 - (0.3) - 42.2 455.3
Balance on January 1, 2019 144.5 174.1 28.9 109.3 28.3 (0.3) (0.3) - 484.4
Net income for the period - - - - - - - 59.1 59.1
Net result with financial instruments
designated as Hedge Accounting - - - - - - 0.639 - 0.639
Dividends and interest on capital - - - - (28.3) - - - (28.3)
Balance on June 30, 2019 144.5 174.1 28.9 109.3 - (0.3) 0.3 59.1 515.8
Balance on April 1, 2019 144.5 174.1 28.9 109.3 28.3 (0.3) (0.3) 26.6 511.0
Net income for the period - - - - - - - 32.5 32.5
Net result with financial instruments
designated as Hedge Accounting - - - - - - 0.627 - 0.627
Dividends and interest on capital - - - - (28.3) - - - (28.3)
Balance on June 30, 2019 144.5 174.1 28.9 109.3 - (0.3) 0.3 59.1 515.8
[The rest of the page was left intentionally blank]

25 Tegma Gestão Logística S.A | Earnings release | 2Q19 | in R$ million
Tegma Gestão Logística SA and subsidiaries
Statements of value added
(in R$ million)
2Q19 2Q18 Chg % vs
2Q18 1S19 1S18
Chg % vs
1S18
Gross sale of services 386.0 341.7 13.0% 734.7 647.1 13.5%
Other income 0.7 0.7 3.7% 2.1 8.3 -74.5%
(Reversal of) allowance for doubtful accounts 1.5 1.0 49.1% 1.4 0.9 51.0%
Income 388.2 343.3 13.1% 738.2 656.3 12.5%
Cost of services provided (211.1) (188.3) 12.2% (397.9) (353.7) 12.5%
Materials, energy, third-party services and
other operating expenses (37.4) (34.9) 7.0% (72.0) (79.8) -9.9%
Input products acquired from third parties (248.5) (223.2) 11.3% (469.9) (433.6) 8.4%
Net value added produced by the Company 139.7 120.1 16.3% 268.4 222.8 20.5%
Depreciation and amortization (6.5) (8.9) -27.0% (13.0) (15.8) -18.0%
Right of use assets amortization (7.1) - - (16.1) - -
Gross value added 126.0 111.2 13.3% 239.3 206.9 15.7%
Equity pickup 0.3 (0.2) - (0.2) (0.7) -68.2%
Financial income (3.0) 3.0 - 5.2 5.7 -9.2%
Total value added to be distributed 123.3 114.0 8.2% 244.3 212.0 15.3%
- - -
Personnel and related charges 40.3 32.7 23.0% 73.9 65.6 12.6%
Direct compensation 31.0 26.8 15.7% 56.1 52.2 7.5%
Benefits 7.2 6.1 17.1% 13.8 12.0 14.8%
FGTS 2.1 (0.2) - 3.9 1.4 179.8%
Taxes, charges and contributions 48.2 40.2 20.1% 97.0 77.2 25.7%
Federal 28.0 23.4 19.8% 55.0 45.0 22.3%
State 18.9 15.4 22.7% 39.4 29.5 33.7%
Local 1.4 1.4 -2.0% 2.7 2.8 -3.8%
Financing agents 34.8 41.1 -15.4% 73.4 69.2 6.1%
Interest and exchange variations (0.4) 3.8 - 9.7 8.4 16.1%
Rent 2.6 9.1 -70.9% 4.5 18.6 -75.7%
Retained profits (losses) 32.5 28.2 15.4% 59.1 42.2 40.2%
Value added distributed 123.3 114.0 8.2% 244.3 212.0 15.3%
[The rest of the page was left intentionally blank]