tektronix: technical brief > testing transmitted signals
TRANSCRIPT

Introduction
The 802.11a standard, approved in early 1999, presents many new
challenges to those who design, manufacture and support network
elements. It operates with more channels at higher frequencies using
a new modulation scheme and spreading techniques that are not
backward compatible with any of the previous IEEE WLAN standards.
This technical brief describes some of the key measurements for
802.11a Physical Layer (PHY) RF signals using the Tektronix WCA11A
Signal Analysis Software and WCA380 Wireless Communication
Analyzer. The objective is to help establish a uniform testing approach
that will improve design reliability and instill confidence between sup-
pliers and customers.
A Measurement Strategy for IEEE802.11a Transmitted Signals
The combination of the WCA11A running on a PC and the WCA380
analyzer provides a comprehensive automated strategy to measure
the most important parameters of IEEE 802.11a transmitted signals.
Table 1 lists the key measurements. Note that some of the measure-
ments have not yet been standardized, so they are listed as charac-
teristic tests.
Testing TransmittedSignals forCompliance withIEEE 802.11a WLANStandards
A Test Scenario for the Emerging WLAN StandardAmong the new and emerging wireless Local Area Networking (WLAN) standards, IEEE 802.11a, also referred
to as WiFi5, promises to have the most significant impact on the technology of enterprise-class networks. The
standard provides avoidance of interference and substantial improvements in speed over previous methods.
1
Technical Brief
www.tektronix.com/mobile
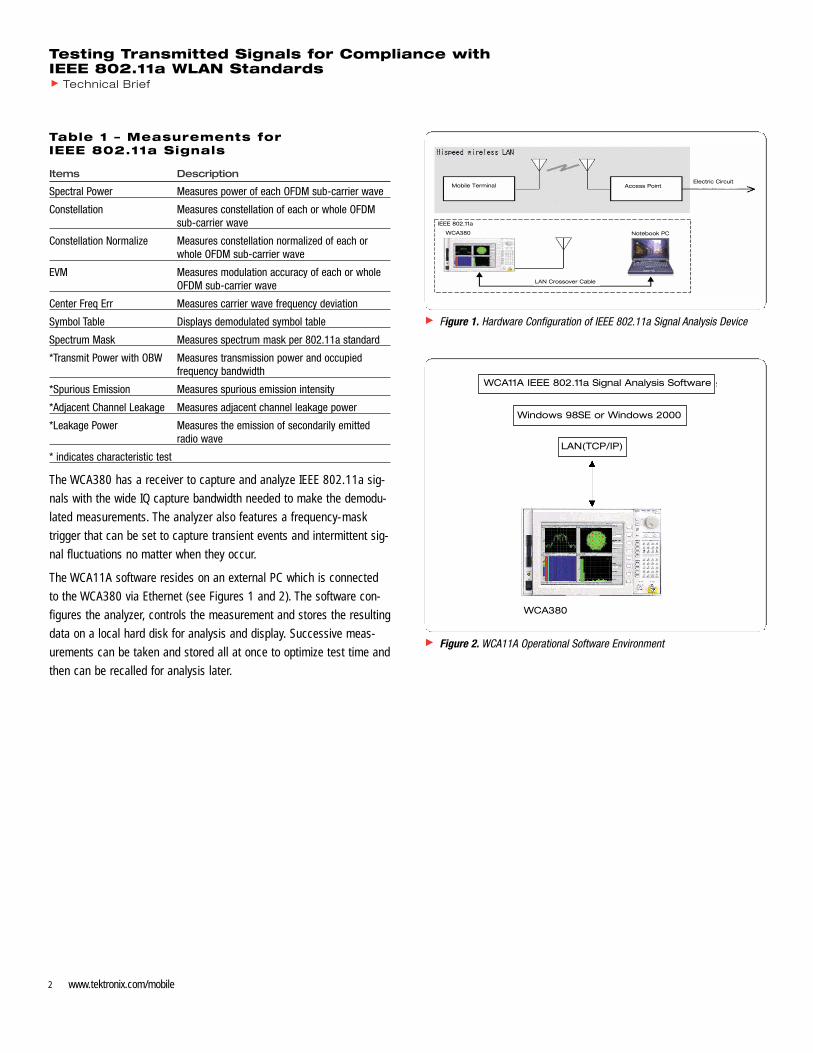
Table 1 – Measurements for IEEE 802.11a Signals
Items Description
Spectral Power Measures power of each OFDM sub-carrier wave
Constellation Measures constellation of each or whole OFDM sub-carrier wave
Constellation Normalize Measures constellation normalized of each or whole OFDM sub-carrier wave
EVM Measures modulation accuracy of each or whole OFDM sub-carrier wave
Center Freq Err Measures carrier wave frequency deviation
Symbol Table Displays demodulated symbol table
Spectrum Mask Measures spectrum mask per 802.11a standard
*Transmit Power with OBW Measures transmission power and occupied frequency bandwidth
*Spurious Emission Measures spurious emission intensity
*Adjacent Channel Leakage Measures adjacent channel leakage power
*Leakage Power Measures the emission of secondarily emitted radio wave
* indicates characteristic test
The WCA380 has a receiver to capture and analyze IEEE 802.11a sig-
nals with the wide IQ capture bandwidth needed to make the demodu-
lated measurements. The analyzer also features a frequency-mask
trigger that can be set to capture transient events and intermittent sig-
nal fluctuations no matter when they occur.
The WCA11A software resides on an external PC which is connected
to the WCA380 via Ethernet (see Figures 1 and 2). The software con-
figures the analyzer, controls the measurement and stores the resulting
data on a local hard disk for analysis and display. Successive meas-
urements can be taken and stored all at once to optimize test time and
then can be recalled for analysis later.
Testing Transmitted Signals for Compliance with IEEE 802.11a WLAN Standards
Technical Brief
2 www.tektronix.com/mobile
Figure 1. Hardware Configuration of IEEE 802.11a Signal Analysis Device
Figure 2. WCA11A Operational Software Environment
WCA11A IEEE 802.11a Signal Analysis Software
Windows 98SE or Windows 2000
LAN(TCP/IP)
WCA380
LAN Crossover Cable
Access PointMobile TerminalElectric Circuit
Notebook PCWCA380
IEEE 802.11a

Setting up to Take Measurements
Proper instrument settings are critical to measurement accuracy, and
setting up to take WLAN signal measurements can be a real challenge
with the large number of parameters that must be configured. The WCA11A
software provides simple menu selections for overall signal and analysis
types – the setup program does the rest. The software automatically
controls the WCA380 to evaluate transmission characteristics of IEEE
802.11a RF signals precisely as defined in the standard or (where the
standards do not apply) to pre-configured compliance criteria, ensuring
conformance. Figure 3 shows a typical setup menu.
Table 2 – Data Transmission Speed andModulation Methods for IEEE 802.11aStandard
Data Rate Modulation Method Encoding Rate
6 Mbps BPSK 1/2
9 Mbps BPSK 3/4
12 Mbps QPSK 1/2
18 Mbps QPSK 3/4
24 Mbps 16QAM 1/2
36 Mbps 16QAM 3/4
48 Mbps 64QAM 2/3
54 Mbps 64QAM 3/4
Table 3 – Channel Numbers andFrequencies
Country Channel Number Carrier Frequency [GHz]
Japan 1 5.170
2 5.190
3 5.210
4 5.230
North America 36 5.180
40 5.200
44 5.220
48 5.240
52 5.260
56 5.280
60 5.300
64 5.320
149 5.745
153 5.765
157 5.785
161 5.805
Europe 36 5.180
40 5.200
44 5.220
48 5.240
52 5.260
56 5.280
60 5.300
64 5.320
100 5.500
104 5.520
108 5.540
112 5.560
116 5.580
120 5.600
124 5.620
128 5.640
132 5.660
136 5.680
140 5.700
Center Frequency None 60 MHz, 2.75 GHz, 3.45 GHz,3.55 GHz, 5.75 GHz, 7.95 GHz
and numeric input
IQ
Testing Transmitted Signals for Compliance with IEEE 802.11a WLAN Standards
Technical Brief
3www.tektronix.com/mobile
Menu Label Entries/Choices DescriptionStandard IEEE 802.11a Analysis per IEEE 802.11a
specificationsCOMPLIANCE Analysis of power
measurements
Channel List Japan North America Selection of the channel listEurope by country (See Table 3)Center Frequency Allows direct entry of any
center frequency
Channel List Selection Selection of the channelnumber and carrier frequency(See Table 3)
Data Rate List Selection Selection of the datatransmission speed of thewireless LAN system to beanalyzed. Data transmissionspeeds for IEEE 802.11astandard are shown in Table 2.
Select the measurement specified in high-speed wireless LANstandard (IEEE 802.11a)
Spectral Power Center Freq ErrorConstellation Symbol TableConstellation Normalize Spectrum MaskEVM
Select from compliance measurementsTransmit Power with OBW Adjacent Channel LeakageSpurious Emission Leakage Power
Figure 3. SETUP Menu
Test Notebook: Measurements of IEEE 802.11a Signals with theWCA11A/WCA380 System
1.0 Spectral Power
Spectral Power Graphs, Power vs. Sub-Carrier Number, Power vs.
Time, and Flatness measurements are made with the following proce-
dure.
Analyzing results:
1.1 Download test data to the analysis program from the WCA380
via the Ethernet or recall a previously saved analysis result file
from the File ➞ Load menu. (You can also read this information
over Ethernet directly from the WCA, and this is the most
common method of use.)
1.2 Select ANALYSIS Spectral Power in the SetUp Tab.
1.3 Select FORMAT Power vs. SC_No (or Power vs. Time, Flatness)
in the View Tab.
The resulting display presents the power in each sub-carrier of the
OFDM symbol designated with the Symbol Select in the VIEW menu.
The bar graph in Figure 4 shows Power (dBm) on the vertical axis and
sub-carrier number (-32 to +32) on the horizontal axis.
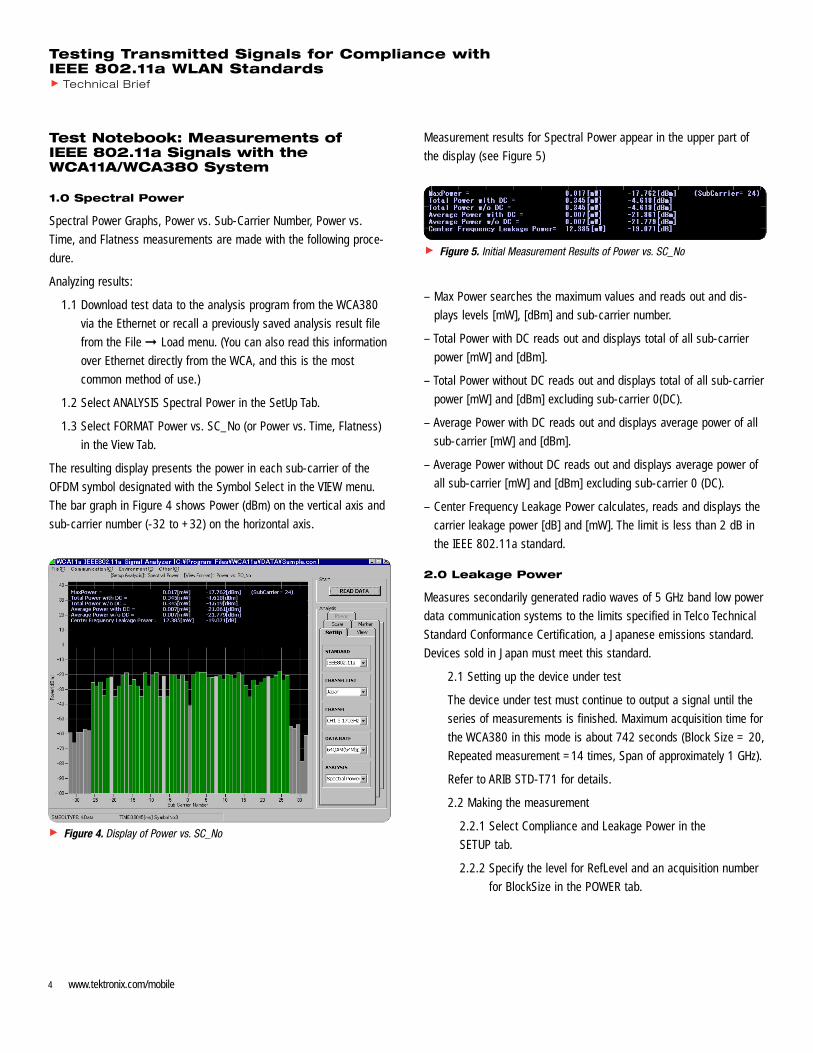
Measurement results for Spectral Power appear in the upper part of
the display (see Figure 5)
– Max Power searches the maximum values and reads out and dis-
plays levels [mW], [dBm] and sub-carrier number.
– Total Power with DC reads out and displays total of all sub-carrier
power [mW] and [dBm].
– Total Power without DC reads out and displays total of all sub-carrier
power [mW] and [dBm] excluding sub-carrier 0(DC).
– Average Power with DC reads out and displays average power of all
sub-carrier [mW] and [dBm].
– Average Power without DC reads out and displays average power of
all sub-carrier [mW] and [dBm] excluding sub-carrier 0 (DC).
– Center Frequency Leakage Power calculates, reads and displays the
carrier leakage power [dB] and [mW]. The limit is less than 2 dB in
the IEEE 802.11a standard.
2.0 Leakage Power
Measures secondarily generated radio waves of 5 GHz band low power
data communication systems to the limits specified in Telco Technical
Standard Conformance Certification, a Japanese emissions standard.
Devices sold in Japan must meet this standard.
2.1 Setting up the device under test
The device under test must continue to output a signal until the
series of measurements is finished. Maximum acquisition time for
the WCA380 in this mode is about 742 seconds (Block Size = 20,
Repeated measurement =14 times, Span of approximately 1 GHz).
Refer to ARIB STD-T71 for details.
2.2 Making the measurement
2.2.1 Select Compliance and Leakage Power in the
SETUP tab.
2.2.2 Specify the level for RefLevel and an acquisition number
for BlockSize in the POWER tab.
Testing Transmitted Signals for Compliance with IEEE 802.11a WLAN Standards
Technical Brief
4 www.tektronix.com/mobile
Figure 4. Display of Power vs. SC_No
Figure 5. Initial Measurement Results of Power vs. SC_No
2.2.3 Create the waveform graph
2.2.3.1 From live measurements: Click the AutoAcquisition
START button to start measurement. The instrument
will automatically perform the measurement over the
established range, and create a resultant waveform
graph on the PC. (Figure 6). This result can now be
stored as a graphic for later recall or insertion into test
reports.
2.2.3.2 From stored results: Load analysis result file from the
File -> Load menu, and create a waveform graph from
the measurement result file.
The resulting power versus frequency number graph shows the levels
of spurious emissions at each specified frequency (Figure 6). Data val-
ues are listed in the upper part of the screen. The red line overlay
describes the limits specified in the standard.
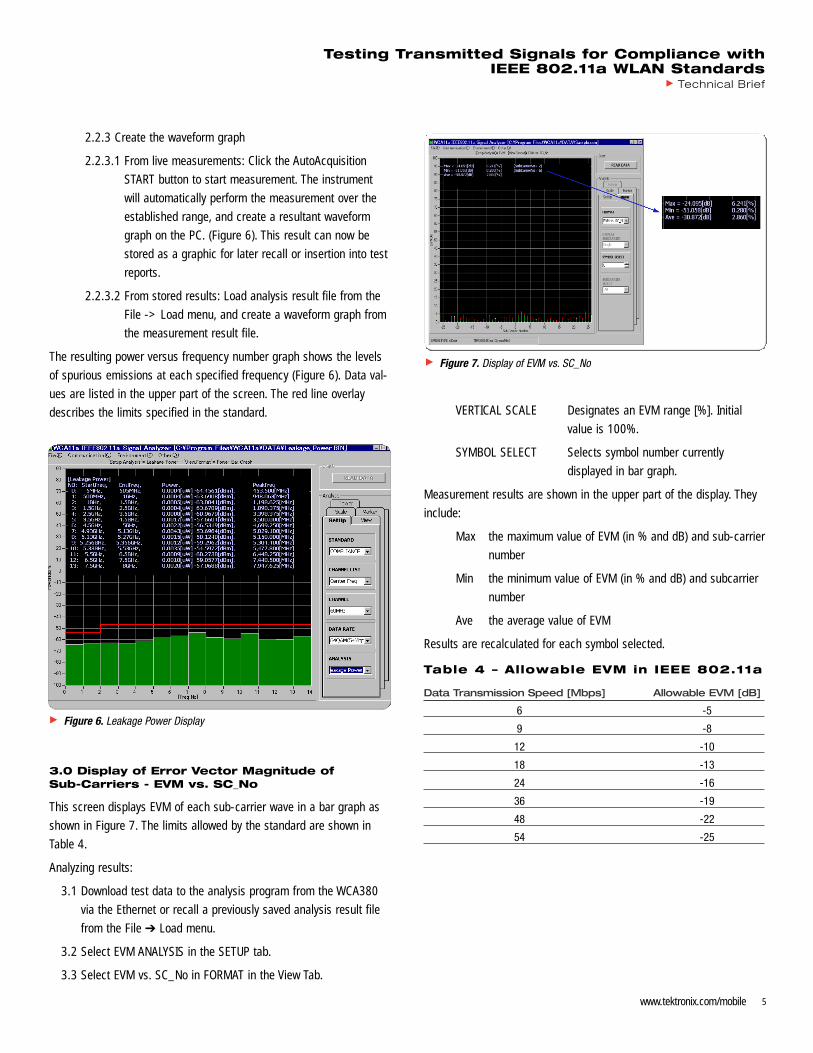
3.0 Display of Error Vector Magnitude of Sub-Carriers - EVM vs. SC_No
This screen displays EVM of each sub-carrier wave in a bar graph as
shown in Figure 7. The limits allowed by the standard are shown in
Table 4.
Analyzing results:
3.1 Download test data to the analysis program from the WCA380
via the Ethernet or recall a previously saved analysis result file
from the File ➔ Load menu.
3.2 Select EVM ANALYSIS in the SETUP tab.
3.3 Select EVM vs. SC_No in FORMAT in the View Tab.
VERTICAL SCALE Designates an EVM range [%]. Initial
value is 100%.
SYMBOL SELECT Selects symbol number currently
displayed in bar graph.
Measurement results are shown in the upper part of the display. They
include:
Max the maximum value of EVM (in % and dB) and sub-carrier
number
Min the minimum value of EVM (in % and dB) and subcarrier
number
Ave the average value of EVM
Results are recalculated for each symbol selected.
Table 4 – Allowable EVM in IEEE 802.11a
Data Transmission Speed [Mbps] Allowable EVM [dB]
6 -5
9 -8
12 -10
18 -13
24 -16
36 -19
48 -22
54 -25
Testing Transmitted Signals for Compliance with IEEE 802.11a WLAN Standards
Technical Brief
5www.tektronix.com/mobile
Figure 6. Leakage Power Display
Figure 7. Display of EVM vs. SC_No

4.0 Center Frequency Error
Figure 8 displays the center frequency error over time in a line graph.
The vertical axis is frequency error [kHz], and the horizontal axis is
time [ms].
Analyzing Results:
4.1 Download test data to the analysis program from the WCA380
via the Ethernet or recall a previously saved analysis result file
from the File ➔ Load menu.
4.2 Select CenterFreqErr ANALYSIS in the SETUP tab.
4.3 Select CenterFreqErr FORMAT in the VIEW tab.
HORIZONTAL SCALE Specifies time range. Initial value is the
time range of the data.
VERTICAL SCALE Specifies Frequency Error range [kHz].
Recalculation for each symbol is performed in this display.
Measurement results are shown in the upper part of the display.
MaxError — the maximum frequency error, the time it occurred
and its symbol number
MinError — the minimum frequency error, the time it occurred
and its symbol number
AverageError — the average frequency error
TotalSymbolCount — total number of symbols
5.0 Adjacent Channel Leakage
Measures the adjacent channel leakage power and out of bandwidth
leakage power of 5 GHz band low power data communication systems
in order to gain telco technical standard conformance certification.
5.1 Setting up the device under test
The device under test must continue to output a signal until the
series of measurements is finished. Maximum acquisition time for
the WCA380 in this mode is about 58 seconds (Block Size = 40,
Repeated measurement =13 times, Span of approximately
100 MHz). Refer to ARIB STD-T71 for details.
5.2 Making the measurement
5.2.1 Select COMPLIANCE for STANDARD and Adjacent Channel
Leakage for ANALYSIS in the SETUP tab.
5.2.2 Select CHANNEL in the SetUp Tab
5.2.3 Specify the level for RefLevel and an acquisition number for
BlockSize in the POWER tab.
5.2.4 Click the AutoAcquisition START button to start the meas-
urement.
5.3 Analyzing the results
5.3.1 Select COMPLIANCE for STANDARD and Adjacent Channel
Leakage for ANALYSIS in the SETUP tab.
5.3.2 Load analysis result file from the File -> Load menu, and
create a waveform graph from the measurement result file.
Testing Transmitted Signals for Compliance with IEEE 802.11a WLAN Standards
Technical Brief
6 www.tektronix.com/mobile
Figure 8. Center Frequency Error Display Figure 9. Adjacent Channel Leakage Display
Measurement results are shown in the upper part of the display, listing
the frequency number and adjacent channel leakage in microwatts and
dB. The red line overlay describes the limits specified in the standard.
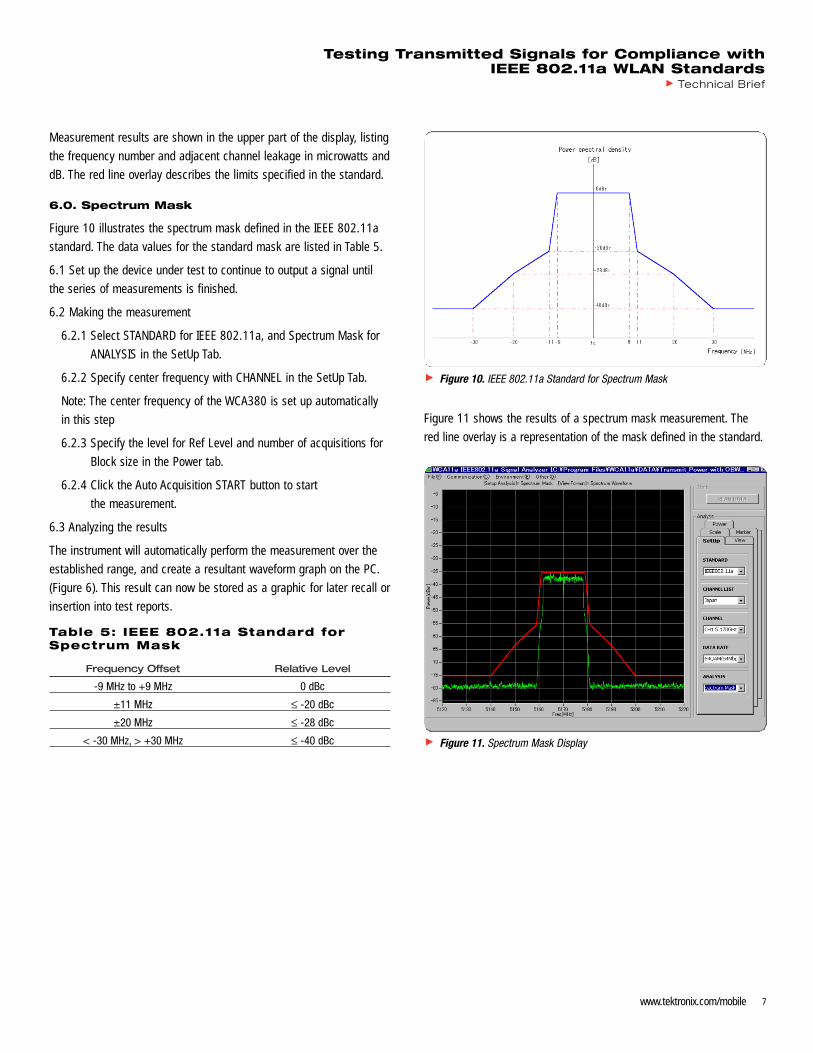
6.0. Spectrum Mask
Figure 10 illustrates the spectrum mask defined in the IEEE 802.11a
standard. The data values for the standard mask are listed in Table 5.
6.1 Set up the device under test to continue to output a signal until
the series of measurements is finished.
6.2 Making the measurement
6.2.1 Select STANDARD for IEEE 802.11a, and Spectrum Mask for
ANALYSIS in the SetUp Tab.
6.2.2 Specify center frequency with CHANNEL in the SetUp Tab.
Note: The center frequency of the WCA380 is set up automatically
in this step
6.2.3 Specify the level for Ref Level and number of acquisitions for
Block size in the Power tab.
6.2.4 Click the Auto Acquisition START button to start
the measurement.
6.3 Analyzing the results
The instrument will automatically perform the measurement over the
established range, and create a resultant waveform graph on the PC.
(Figure 6). This result can now be stored as a graphic for later recall or
insertion into test reports.
Table 5: IEEE 802.11a Standard forSpectrum Mask
Frequency Offset Relative Level
-9 MHz to +9 MHz 0 dBc
±11 MHz ≤ -20 dBc
±20 MHz ≤ -28 dBc
< -30 MHz, > +30 MHz ≤ -40 dBc
Figure 11 shows the results of a spectrum mask measurement. The
red line overlay is a representation of the mask defined in the standard.
Testing Transmitted Signals for Compliance with IEEE 802.11a WLAN Standards
Technical Brief
7www.tektronix.com/mobile
Figure 10. IEEE 802.11a Standard for Spectrum Mask
Figure 11. Spectrum Mask Display

Evolution of IEEE 802.11 - the manyphases of WLAN standards
The purpose of IEEE 802.11 WLAN standards is to specify wireless
connectivity for fixed, portable, and moving stations within a local
area in an environment that can accommodate multiple types of cod-
ing, frequencies, data rates and applications. As technology has
improved and the use of wireless LANs has become widespread, the
standards have evolved in phases to provide a growing number of
protocols and performance options.
All of the 802.11 standards have their roots in the familiar "Ethernet"
wired LAN environments (as specified in IEEE 802.3, 802.4 and
802.5). They are multi-user Time Division Duplex (TDD) systems that
transmit data as frames of independent packets over defined chan-
nels in a modulated carrier. Each station listens for transmissions
using a Carrier Sense Multiple Access / Collision Avoidance
(CSMA/CA) method where all stations are treated equally – continu-
ous transmission connections are not allowed. The WLAN standards
also address specific wireless environment issues such as power
management, interference and security.
Each of the standards defines protocols in support of a wireless
Basic Service Set (BSS) – a group of two or more wireless stations
within a cell coverage area that have recognized each other and
established communications. The BSS can be made up entirely of
peer wireless stations (or nodes) that "meet" temporarily in an
ad hoc network to exchange data directly. More commonly, each
BSS also contains a fixed access point (AP) node that forms a bridge
between the wireless stations and a wireline LAN. In this "infrastruc-
ture” mode, stations within the BSS communicate with each other
through the AP and are able to access stations outside the coverage
area via the LAN through their APs (in this mode, the AP is analogous
to the Base Station in a mobile phone network).
Performance Choices in the Physical Layer
Typically, a radio card in the station (or AP) provides the RF and data
management functions of the 802.11 standard. Data is packed and
unpacked between the Medium Access (MAC) layer (data link to the
digital station or network) or and Physical (PHY) layer using the
Physical Layer Convergence Protocol (PLCP). The PHY layer builds
the data packets and performs the scrambling, spreading and modu-
lation functions for wireless transmission and reverses the process for
reception. The PLCP is a key enabler of evolution and choices in the
WLAN, allowing the introduction of new wireless RF performance in
the PHY while minimizing changes to the MAC (or the underlying
station/network).
Testing Transmitted Signals for Compliance with IEEE 802.11a WLAN Standards
Technical Brief
8 www.tektronix.com/mobile
Physical Layer
Infrared (IR)
Frequency Hopping Spread Spectrum2.4 GHz (FHSS)
Direct Sequence Spread Spectrum2.4 GHz (DSSS)
Orthogonal Frequency Division Multiplexing5 GHz (OFDM)
802.11 IR1 / 2 Mbps
802.11 FHSS1 / 2 Mbps
802.11 DSSS1 / 2 Mbps
802.11b1 / 2 / 5.5 / 11 Mbps
802.11a6 / 12 / 24 Mbps
opt. 9 / 18 / 36 / 54 Mbps
Figure S1. Evolution of IEEE WLAN standards Physical Layers
7 - Application Layer
6 - Presentation Layer
5 - Session Layer
4 - Transport Layer
3 - Network Layer
2 - MAC Layer
1 - Physical (PHY) Layer
7 - Application Layer
6 - Presentation Layer
5 - Session Layer
4 - Transport Layer
3 - Network Layer
2 - MAC Layer
1 - Physical (PHY) Layer
Network
PeerCommunications
Device A Device BVirtual Data Flow
PLCP PLCP
Figure S2. Simplified diagram of protocol layers in a WLAN

802.11
The initial 802.11 standard was released in 1997, defining MAC and
PHY functionality in both the infrared and RF domains. Two variations
of RF technology are specified – Direct Sequence Spread Spectrum
(DSSS) and Frequency Hopped Spread Spectrum (FHSS) – both
designed to operate in the 2.4 GHz unlicensed Industrial, Scientific
and Medical (ISM) band. The DSSS system supports data rates of
1 Mbps and 2 Mbps, using Digital Binary Phase Shift Keying (DBPSK)
and Digital Quadrature Phase Shift Keying (DQPSK), respectively.
802.11b
In 1999, the 802.11b standard (also known as WiFi) introduced new
spreading and modulation techniques to increase data rates to
5.5 Mbps and 11 Mbps on up to three simultaneous channels in the
same 2.4 GHz band. It is backwards compatible with 802.11 DSSS
technology and continues to support the same techniques for 1 Mbps
and 2 Mbps data rates.
802.11b uses DBPSK and DQPSK for the lower data rates and
Complementary Code Keying (CCK) for the 5.5 Mbps and 11 Mbps
rates. An alternative method for the higher data rates, Packet Binary
Convolutional Coding (PBCC), is permitted by the standard, but not
required.
802.11a
Also introduced in 1999, 802.11a supports data rates from 6 Mbps
up to 54 Mbps on up to eight simultaneous channels in the 5 GHz
Unlicensed National Information Infrastructure (UIII) band - substan-
tial improvements over previous standards. The standard (also known
as WiFi5) is not directly compatible with other IEEE WLAN standards
(including 802.11b and its pending enhancement, 802.11g), however
it can coexist because it uses the identical 802.11 MAC layer to
access the network.
802.11a uses a completely different spreading and modulation
method in its Physical Layer at the higher data rates – Orthogonal
Frequency Division Multiplexing (OFDM). While the 802.11a PHY is
very similar to the ETSI HiperLAN/2 standard used in Europe, however,
differences in their MAC layers and contention with European military
channels will need to be reconciled in future revisions to allow them
to coexist.
802.11g
At this writing, 802.11g has not yet been approved. The most recent
revision would support data rates of up to 54 Mbps on up to three
simultaneous channels in the 2.4 GHz band. It would be compatible
with 802.11b – radio cards from one standard would interface
directly with those from the other. 802.11g uses OFDM spreading
and modulation to achieve the higher data rates.
Trends
802.11b has become the most popular system for business and
institutional wireless LAN’s. It is accepted worldwide and is repre-
sented in a steady stream of products and a growing installed base
of networks. The introduction of 802.11g products to 802.11b net-
works would be a straightforward upgrade path to higher data rates.
However, the 2.4 GHz band is becoming more crowded and is subject
to interference from other networking technologies (such as
Bluetooth), cordless phones and microwave ovens. The three channel
capacity of 802.11b/g can become an issue in dense BSS environ-
ments, imposing limits on the power and range as stations compete
for access.
802.11a is gaining favor as products are introduced. The appeal of
the 5 GHz band with its broader spectrum and lack of interference
from traditional sources is a strong incentive for some users. The
large number of channels and higher data capacity also enhance its
acceptance; however, the non-compatibility issue continues to be a
strong deterrent.
The trend to multiple or multi-mode radio interfaces is the most likely
near-term compromise for interoperability and coexistence. Radio
cards that support both 802.11a and 802.11b to bridge the two
technologies have already begun to appear on the market.
Testing Transmitted Signals for Compliance with IEEE 802.11a WLAN Standards
Technical Brief
9www.tektronix.com/mobile

Conclusion
By all indications, IEEE 802.11a will have a significant impact on the
technology of enterprise-class networks. The standard presents many
new measurement challenges to those who design, manufacture and
support network elements. The Tektronix WCA11A Signal Analysis
Software and WCA380 Wireless Communication Analyzer offer an inte-
grated, comprehensive measurement strategy with a library of auto-
mated measurements and extensive analysis capabilities that will
address those challenges today, and in the future, as WLAN standards
continue to evolve. The objective is to help establish a uniform testing
approach that will improve design reliability and instill confidence
between suppliers and customers.
References
1. Resources
WECA and Wi-Fi:
2. Standards
Get IEEE 802™ at http://standards.ieee.org/getieee802/
3. Websites
a. Wireless Ethernet Compatibility Alliance (WECA)
http://www.wi-fi.org/
b. IEEE 802.11 Workgroup http://grouper.ieee.org/groups/802/11/
c. Wireless LAN news http://www.80211-planet.com/
d. IEEE 802.11b News http://weblogger.com/
Testing Transmitted Signals for Compliance with IEEE 802.11a WLAN Standards
Technical Brief
10 www.tektronix.com/mobile

Testing Transmitted Signals for Compliance with IEEE 802.11a WLAN Standards
Technical Brief
11www.tektronix.com/mobile
Copyright © 2002, Tektronix, Inc. All rights reserved. Tektronix products are covered by U.S. and foreign patents, issued and pending. Information in this publication supersedes that in all previously published material. Specification and price change privileges reserved. TEKTRONIX andTEK are registered trademarks of Tektronix, Inc. All other trade names referenced are the servicemarks, trademarks or registered trademarks of their respective companies.08/02 FL5622/XBS 2EW-16081-0
For Further InformationTektronix maintains a comprehensive, constantly expanding collec-tion of application notes, technical briefs and other resources to helpengineers working on the cutting edge of technology. Please visitwww.tektronix.com/mobile
12 www.tektronix.com/mobile
Contact Tektronix:
ASEAN / Australasia / Pakistan (65) 6356 3900
Austria +43 2236 8092 262
Belgium +32 (2) 715 89 70
Brazil & South America 55 (11) 3741-8360
Canada 1 (800) 661-5625
Central Europe & Greece +43 2236 8092 301
Denmark +45 44 850 700
Finland +358 (9) 4783 400
France & North Africa +33 (0) 1 69 86 80 34
Germany +49 (221) 94 77 400
Hong Kong (852) 2585-6688
India (91) 80-2275577
Italy +39 (02) 25086 1
Japan 81 (3) 3448-3111
Mexico, Central America & Caribbean 52 (55) 56666-333
The Netherlands +31 (0) 23 569 5555
Norway +47 22 07 07 00
People’s Republic of China 86 (10) 6235 1230
Poland +48 (0) 22 521 53 40
Republic of Korea 82 (2) 528-5299
Russia, CIS & The Baltics +358 (9) 4783 400
South Africa +27 11 254 8360
Spain +34 (91) 372 6055
Sweden +46 8 477 6503/4
Taiwan 886 (2) 2722-9622
United Kingdom & Eire +44 (0) 1344 392400
USA 1 (800) 426-2200
USA (Export Sales) 1 (503) 627-1916
For other areas contact Tektronix, Inc. at: 1 (503) 627-7111
Updated 17 June 2002