tel: civitas web - civitas: institute for the study of civil … is financed from a variety of...
TRANSCRIPT

Frank Field and Andrew Forsey
CIVITAS£8.00
CIVITAS Institute for the Study of Civil Society
55 Tufton Street, London, SW1P 3QL Tel: 020 7799 6677
Email: [email protected] Web: www.civitas.org.uk
ISBN 978-1-906837-76-1 Cover design: lukejefford.com
The thorny issue of benefit dependency has bedevilled the welfare state
since the 1970s, and has increased in importance with each successive
decade. Welfare-to-work strategies since 1997 have begun to make
inroads into the problem of long-term out-of-work claimants, which once seemed
intractable. But, as Frank Field and Andrew Forsey highlight in this forensic
examination of the welfare landscape, challenges remain.
First, the success story needs to be extended to certain groups – such as the
disabled and the over-50s – who too often continue to be excluded from the jobs
market. Second, much more needs to be done to ensure that those who are in
work are able to progress up the pay ladder and out of poverty: too many people
are in jobs which are so low paid that their incomes are only brought up to acceptable
levels by the wage subsidy better known as tax credits. Effectively, the bill to tax-
payers has been switched from out-of-work benefits to in-work benefits.
Tackling this will require an increase in productivity without an increase in
unemployment. Only by raising output per worker – and ensuring that the rewards
are fairly shared – can real living standards rise over time. This productivity challenge
moves the welfare reform agenda into new territory, requiring engagement
from beyond the Department for Work and Pensions as it links up with wider
economic and political considerations.
Field and Forsey argue that by building on the foundations of the new National
Living Wage, raising productivity and boosting the wages of the lower paid, the
government can reduce benefits dependency still further and make significant
additional savings from the tax credit bill.
Fran
k Field
and
A
nd
rew F
orsey
CIV
ITA
SF
ixin
g B
roke
n B
ritain
?
Fixing Broken Britain?An audit of working-age welfare reform since 2010

Fixing Broken Britain?
Fixing Britain Layout.qxp_Layout 1 11/12/2015 11:31 Page i

Fixing Britain Layout.qxp_Layout 1 11/12/2015 11:31 Page ii

Fixing Broken Britain?
An audit of working-age welfare reform since 2010
Frank Field and Andrew Forsey
CIVITAS
Fixing Britain Layout.qxp_Layout 1 11/12/2015 11:31 Page iii

First Published January 2016
© Civitas 201655 Tufton Street
London SW1P 3QL
email: [email protected]
All rights reserved
ISBN 978-1-906837-76-1
Independence: Civitas: Institute for the Study of CivilSociety is a registered educational charity (No. 1085494)and a company limited by guarantee (No. 04023541).Civitas is financed from a variety of private sources to avoid over-reliance on any single or small group of donors.
All publications are independently refereed. All theInstitute’s publications seek to further its objective ofpromoting the advancement of learning. The viewsexpressed are those of the authors, not of the Institute,as is responsibility for data and content.
Designed and typeset bylukejefford.com
Printed in Great Britain by4edge Limited, Essex
Fixing Britain Layout.qxp_Layout 1 11/12/2015 11:31 Page iv

ContentsAuthors viii
Introduction 1
i. A second and third front in welfare reform 1
ii. The outline 5
1. ‘Broken Britain’: Relieving poverty by entrenching it 7
i. The Centre for Social Justice blueprint 7
ii. What the Conservative and Liberal Democratmanifestos said in 2010 9
iii. The Coalition’s programme for government 11
2. Has the government managed to ‘Get BritainWorking’ again? 13
i. Work and welfare 13
ii. A single welfare-to-work programme 14
iii. How effective has the single welfare-to-workprogramme been? 16
iv. How do the costs compare with previousprogrammes? 24
v. Youth unemployment 25
vi. Conclusion 29
v
Fixing Britain Layout.qxp_Layout 1 11/12/2015 11:31 Page v

vi
3. Swinging the pendulum of conditionality:making work the easier option 31
i. Phases of conditionality 31
ii. Conclusion 43
4. Raising the bar to making work pay 45
i. Cutting the subsidy to low pay 45
ii. Cutting the subsidy to high rents 50
iii. Cutting Council Tax Benefit 59
iv. Conclusion 60
5. Work as the best route out of poverty? 62
i. The success of Welfare Reform Mark one 62
ii. The prevalence of poverty 63
iii. The wage scene 67
iv. Conclusion 71
6. Universal Credit: ‘Welfare That Works’? 73
i. The changing profile of claimant dependency 73
ii. Claimants’ marginal tax rates 75
iii. The costs and implementation of Universal Credit 79
iv. Much pain and not much gain 84
v. Conclusion 86
CoNTENTS
Fixing Britain Layout.qxp_Layout 1 11/12/2015 11:31 Page vi
vii
7. Dividing the sheep and the goats? 87
i. Reforming Incapacity Benefit 87
ii. Replacing Disability Living Allowance withPersonal Independence Payment 93
8. Big successes 98
i. Success in cutting overall welfare expenditure 98
ii. Rebuilding families 102
Conclusion: An overall audit 105
i. Has the government managed to ‘Get Britain Working’ again? 107
ii. Has the government enshrined work as the best route out of poverty? 111
iii. Has the government delivered ‘Welfare That Works’? 112
iv. Has the government succeeded in reformingincapacity and disability benefits? 117
v. In what areas has the government been most successful? 119
vi. Lessons for welfare reformers 119
Postscript 121
Notes 127
CoNTENTS
Fixing Britain Layout.qxp_Layout 1 11/12/2015 11:31 Page vii

viii
Authors
Frank Field has served as Member of Parliament forBirkenhead since 1979. In 1990 he took up thechairmanship of the Social Security Select Committeeand continued in this role up to 1997. In that year heaccepted the position of Minister for Welfare Reform inTony Blair’s first government. He then served as amember of the Public Accounts Committee between2002 and 2005. In 2010 he was appointed by DavidCameron to lead the Independent Review on Povertyand Life Chances. Frank co-chaired last year’s All-PartyParliamentary Inquiry into Hunger in the UnitedKingdom and he currently chairs the Work andPensions Select Committee.
Andrew Forsey is head of Frank Field’s parliamentaryoffice, having joined in 2013. In 2014 he served asSecretary to the All-Party Parliamentary Inquiry intoHunger in the United Kingdom. Andrew then wrote theinquiry’s two follow-up reports in 2015, focusing on theextent and causes of hunger in this country.
Fixing Britain Layout.qxp_Layout 1 11/12/2015 11:31 Page viii

Introduction
i. A second and third front in welfare reform
There is an urgent need to open up simultaneously botha second and third front in welfare reform. The thornyissue of dependency on benefits has bedevilled thewelfare state since the 1970s and it has grown inimportance in each of the past five decades. But thedebate on dependency has been narrowly pitched interms of the numbers of working-age claimants (agedbetween 16 and 64) drawing benefit for very longperiods of time. No adequate distinction has beendrawn between those in and out of work who dependon benefit. Nor has sufficient consideration been givento the dependency of employers and landlords whohave drawn wage and rent subsidies from taxpayersthat have grown exponentially.
The welfare-to-work strategy of successivegovernments since 1997 has begun to crack thedependency on out-of-work benefits that had appearedto be an almost intractable problem. We refer to thisstrategy as ‘Welfare Reform Mark one’. Its success canbe seen in the number of households with nobody inwork falling in 2014 to its lowest level since 1996. Verylarge numbers of single mothers and long-termunemployed have moved into work. In 1996, almost52% of households headed by a single parent were
1
Fixing Britain Layout.qxp_Layout 1 11/12/2015 11:31 Page 1

workless; in 2014 the figure stood at 33%.1 An activewelfare-to-work strategy has also ensured that otherclaimants moving on to the welfare rolls for the firsttime have drawn benefit for only a short period. Theaverage duration of a Jobseeker’s Allowance claim in1996 never fell below 30 weeks. When the Labourgovernment left office in 2010 this had been cut to 19weeks. In october 2014, four and a half years into theConservative-Liberal Democrat Coalition government,the average duration stood at 21 weeks. Moreover, onthe eve of Labour’s election victory in 1997, 54% ofclaimants drew benefit for more than six months.Thirteen years later this had fallen to 40% and, despitethe fallout from the great recession, this figure since2010 has not risen back above 50%.
The Coalition government’s welfare-to-workprogramme, maintained by the majority Conservativegovernment which prevailed at the 2015 generalelection, has continued the success of the previousLabour government in overall terms, albeit at half thecost. However, this success is not evenly matchedamong different groups of claimants. Claimants withdisabilities and those aged over 50, for example, faceparticular difficulties in landing a job and the currentwelfare-to-work programme does little to equalise theirjob opportunities with others on the welfare rolls.
While much of the heavy lifting in helping claimantsback into work has been accomplished, further work isnecessary and the task now requires different skills froma traditional welfare reformer. A range of nicheprogrammes needs to be developed for those who stillface too high a barrier to entering work. The aim mustbe to extend the success that is already registering inwelfare-to-work policies to those claimants with special
FIxING BRoKEN BRITAIN?
2
Fixing Britain Layout.qxp_Layout 1 11/12/2015 11:31 Page 2
difficulties that hinder their chances of successfullymaking this transition into work. Developing theseprogrammes we have entitled ‘Welfare Reform Mark Two’. Although refining the welfare-to-workprogramme in favour of the least advantaged remainsof great importance, such a refining is now only a partof the agenda for welfare reformers.
The efforts of welfare reformers also need to befocused on a welfare-to-work strategy that not onlymoves claimants off out-of-work benefit, but moreimportantly helps them move up the pay ladder and outof poverty. This is the third welfare reform front, or‘Welfare Reform Mark Three’, which needs to be openedup in the welfare-to-work strategy and robustly put intooperation. This takes welfare reform into new territoryand will require the best reformers’ talents in theDepartment for Business, Innovation and Skills, as wellas those civil servants at the Department for Work andPensions – both in Whitehall as well as at a local officelevel – who have shown the skills necessary to developwelfare reform programmes. For the reverse side of thesuccess in moving claimants from out-of-work benefitinto work has been to switch the bill taxpayers meetfrom, say, Jobseeker’s Allowance payments to footingthe bill for tax credits.2 Too many people on low benefitincomes have been encouraged into low-paid jobswhose rewards are only brought up to a moreacceptable income level by the wage subsidy that sailsunder the colours of tax credits. At its peak in 2011 thebill for this wage subsidy – consisting of Working andChild Tax Credits – had reached £30 billion.
Welfare Reform Mark Three therefore must begin aprogramme of so helping raise productivity in lowerpaying firms that higher wages become affordable
INTRoDUCTIoN
3
Fixing Britain Layout.qxp_Layout 1 11/12/2015 11:31 Page 3

without creating unemployment. Such a programmebecomes doubly necessary as employers move towardspaying the government’s new National Living Wageand then onto a more substantial voluntary livingwage.3 The first moves on how this could be achievedover the life of this parliament are outlined in theconcluding section of this audit. What needs to be notedhere, however, is that this strategy links Welfare ReformMark Three into the key wider economic and politicaldebate that now needs to engross the country moregenerally on raising productivity in British industry. Itis only by productivity increases that real livingstandards can rise generally over the longer term for thewhole population, although of course productivityincreases on their own won’t necessarily ensure thatthese rewards are fairly shared.
Previous recessions have always been followed byrecoveries that signalled the rise in output per hourworked or, for short, increases in productivity. Thatproductivity increase has failed to materialise since thegreat recession of 2008-09, although it is possible thatthe very first signs of the old order re-establishing itselfare becoming visible. Why productivity has stalled isnot the easiest question to answer. Part of that answer,however, must surely be that, for the first time, theBritish economy is being fed by what appears to be analmost never-ending stream of cheap labour,particularly from eastern Europe.4
Employers, faced with a new, eager to work pool ofrecruits, have appeared to settle on adding labour unitsto the existing capital stock, rather than using labour asa scarce resource and raising the capital mix so thatoutput would rise without commensurate increases in employment.
FIxING BRoKEN BRITAIN?
4
Fixing Britain Layout.qxp_Layout 1 11/12/2015 11:31 Page 4

With the wages of the low paid becalmed by this verysignificant increase in labour supply we suggest herethat Welfare Reform Mark Three should open up a newfront to ensure that those workers parked in low-payingoccupations are able to increase their productivity andthereby move wage rates generally up towards thegovernment’s new National Living Wage and then ontoa higher, substantial and sustainable living wage level.
It is noticeable that since the introduction of thestatutory National Minimum Wage5 the bunching ofwages at and just a little above this base level wouldsuggest that employers are viewing it not only as aminimum floor but an acceptable ceiling for their lower-paid employees’ pay. our belief is that by resolutelybuilding on its introduction of a National Living Wagethe government would not only cut significantly stillfurther the tax credit bill, but could simultaneouslykick-start the macro strategy of more generally raisingthe productivity of British industry.
ii. The outline
This audit of welfare reform for working-age claimantssince 2010 begins in Chapter 1 with a review of theimpact the Centre for Social Justice has had in shapingpart of the first front in welfare reform – incentivisingwork as the best route out of poverty.
Chapter 2 audits the outcome since 2010 of thegovernment nailing its colours to a strategy of gettingBritain back to work, before Chapter 3 audits thegovernment’s greater emphasis on making welfareconditional on claimants fulfilling certain duties toprepare themselves for the world of work.
How some of the government’s policies made moredifficult the task of enshrining work as the best route
INTRoDUCTIoN
5
Fixing Britain Layout.qxp_Layout 1 11/12/2015 11:31 Page 5
out of poverty is examined in Chapter 4, when the auditlooks at those moves that have raised the bar to makingwork preferable to a life on benefit.
Auditing the numbers of working poor is the subjectof Chapter 5, while Chapter 6 examines the progress thegovernment has made in what was originally billed asthe key welfare reform in fixing ‘broken Britain’ –Universal Credit.
The discussion in Chapter 7 then moves onto auditinghow effective the government has been in reformingIncapacity Benefit and replacing Disability LivingAllowance with Personal Independence Payment.
In bringing this audit to a conclusion we consider inChapter 8 what we regard as the two clear successes ofthe government’s welfare reform strategy since 2010.The first has been to achieve what no other governmentin the post-war period has ever achieved; namely, a cutin the working-age welfare budget (including taxcredits), not simply as a proportion of total nationalincome, but in real terms. Accompanying this successhas been the emphasis – hardly spoken about andalmost never reported upon – on strengthening families.
The audit closes with a stock-taking exercise, settingout what progress the government has made so far andhow much is left to achieve, and pointing the way to thefuture of welfare reform during the 2015 parliament.
FIxING BRoKEN BRITAIN?
6
Fixing Britain Layout.qxp_Layout 1 11/12/2015 11:31 Page 6
1
‘Broken Britain’:Relieving poverty by entrenching it
i. The Centre for Social Justice blueprint
The ideas and programmes developed by the Centre forSocial Justice (CSJ) after it was set up by Iain DuncanSmith in 2004 are crucial to understanding thegovernment’s welfare reform programme since 2010.When Duncan Smith was appointed work and pensionssecretary in the Coalition he took with him intogovernment not only the CSJ’s executive director,Philippa Stroud, as his new special adviser, but also thethink tank’s assumptions and policy ideas about‘broken Britain’. These were laid out in a series ofreports, beginning in 2006 with ‘Breakdown Britain’ andending in 2009 with ‘Breakthrough Britain’, which setout how the welfare state was relieving poverty only byentrenching it.
In its 2009 report the CSJ proclaimed in the firstsentence on the first page that ‘our benefits system isbroken’.1 While the welfare state ‘alleviates’ financialhardship, ‘it does so at a price’. This first page of thereport then set out what the CSJ believed that price tobe, namely, the ‘high benefit withdrawal rates [that] trapmillions in worklessness and dependency… often over
7
Fixing Britain Layout.qxp_Layout 1 11/12/2015 11:31 Page 7

several generations’. The CSJ diagnosis was that therates at which benefits were clawed back as householdseither found work, or put in more hours, were enoughto repel people on benefit from striving for their keep.
‘Breakthrough Britain’ was equally clear on how to put‘broken Britain’ back together again. To address Britain’sunacceptable levels of poverty and social exclusion, ‘weneed to redesign the benefits system and boostemployment and earnings over the long term’.2
Reinforcing this central assumption, the report added,‘this will require a new approach: one that recogniseshow claimants respond to withdrawal rates [of benefits]’.The prescription offered by the CSJ was to replace thecurrent medley of means-tested benefits with a singlemeans-tested benefit, called Universal Credit.
A note of warning needs to be sounded at the outset onUniversal Credit, the mechanism through which the CSJand Duncan Smith saw their welfare revolutionoperating.3 The test of Universal Credit’s success couldn’tbe more clearly defined by its architects: low rates ofbenefit withdrawal to incentivise work. We should notfall though for some of the propaganda surrounding thehesitant launch of Universal Credit. At the outset therewas the obligatory reference to the reforms being themost significant since William Beveridge’s plan for acomprehensive system of National Insurance andNational Assistance. Such claims are regularly made bygovernments introducing their welfare reformprogramme. It was Tony Blair’s claim for the 1997 Labourgovernment’s first green paper on welfare reform.4 Butthe comparison is false; the rollout of Beveridge’s plansand Universal Credit differ fundamentally.
The Beveridge scheme was put into operation throughtwo acts of parliament, the 1946 National Insurance Act
FIxING BRoKEN BRITAIN?
8
Fixing Britain Layout.qxp_Layout 1 11/12/2015 11:31 Page 8
and the 1948 National Assistance Act, both of which werebrought into operation on a single day. While Beveridge’sscheme built on the existing structure of benefits to adegree that was perhaps not that well appreciated at thetime, a totally new scheme came into operation on thevesting day listed in each piece of legislation.
Not so with Universal Credit. A totally new schemebegan very tentatively in 2013, but the whole of theexisting structure of benefits about which the CSJ is sorightly critical, continues to operate today. The principlesunderlying the CSJ’s welfare reform programme werehowever not confined to Universal Credit. They were tobe progressively applied to the existing welfare state. Wetherefore need to examine how well this welfare reformprogramme interlinks with existing schemes across thewhole domain of benefits for families and individualsbelow retirement age. This is distinct from the success orotherwise of Universal Credit.
We also pose the crucial question in this audit of howwell the government’s welfare reform programme isachieving the objective of ensuring claimants are alwaysbetter off in work than on out-of-work benefit, billed asthe be-all and end-all of the reform agenda. But first, howwere the commitments to welfare reform for working-age claimants fashioned in the manifestos of the twoparties that set off down this path in 2010 and how didthe making of the government’s programme affect whatwas to become an agreed welfare reform strategy?
ii. What the Conservative and LiberalDemocrat manifestos said in 2010
The CSJ’s analysis and its prescription, UniversalCredit, were not reflected in the Conservative Party’s2010 manifesto. The manifesto, in its single page
9
‘BRoKEN BRITAIN’: RELIEVING PoVERTY BY ENTRENCHING IT
Fixing Britain Layout.qxp_Layout 1 11/12/2015 11:31 Page 9

covering welfare reform, pledged to reduce the tidalwave of workless households, and with it the ratio ofone in six children living in workless households – thehighest in Europe – by getting people back into work.The prospect of ‘ensuring everyone benefits fromeconomic growth’ was central to the party’s means ofachieving Labour’s pledge of eliminating child povertyby 2020.
A promise was made to scrap Labour’s ‘failing’ welfare-to-work schemes and so open the way to a singlewelfare-to-work programme. The manifesto then pledgedsupport for small businesses, improvements to skills anda strengthening of higher education. only in its sectiontitled ‘Make Britain The Most Family Friendly Country inEurope’ did the Conservatives make any specific pledgeson reforming the tax and benefit system. The manifestowas clear about ending the marriage penalty, wherebycurrent rules ensure that couples on welfare who split upbecome financially better off. Significantly, the manifestowent on to pledge support for the tax credit system whilewithdrawing help from higher-income households.5
There was no hint, let alone a specific pledge, to introducethe welfare reform programme that sails under the bannerof Universal Credit.
The manifesto highlighted, in its section ‘Get BritainWorking Again’, that a future Conservative governmentwould aim to ‘reduce youth unemployment and reducethe number of children in workless households’.
The Liberal Democrats’ manifesto commitments wereeven briefer and centred on tax credits, which would berestricted. Scant details were provided of other benefitreforms and there was certainly no mention of anyattempt to abolish much of the existing system byintroducing Universal Credit.
FIxING BRoKEN BRITAIN?
10
Fixing Britain Layout.qxp_Layout 1 11/12/2015 11:31 Page 10

iii. The Coalition’s programme forgovernment
When the 2010 election resulted in a hung parliamentour most senior civil servants arranged for coalitionnegotiations to take place behind closed doors. In aneutering of the doctrine of the mandate (wherebyvoters decide the main activities of a winning party’sagenda) it was the negotiators who decided what wasto become the winning side’s manifesto. Voters wereexcluded from any knowledge of what bargains werebeing struck.6 The first the public knew of what was leftof the contents of the manifesto of the party for whomthey voted was when ‘The Coalition: our programmefor government’ was published 14 days after the generalelection. What did this document make of the welfarereforms the Conservatives and Liberal Democrats had explicitly pledged themselves to in each of theirelection manifestos?
The answer is very little. While more detail was givenof reforms to Labour’s welfare-to-work programmes,there was still no mention of what would later beclaimed as the welfare revolution of Universal Credit.There was, however, one cryptic phrase at the very endof the ‘Jobs and Welfare’ section of the document, as ifit was an afterthought, to the effect that the governmentwould ‘investigate how to simplify the benefit systemin order to improve incentives to work’.7 Manifestowatchers should have been on their guard. Labour hadused a similar Delphic phrase in its manifesto for the1997 election, heralding the tax credit system bypledging to ‘examine the interaction of the tax andbenefits systems so that they can be streamlined and modernised, so as to fulfil our objectives of
11
‘BRoKEN BRITAIN’: RELIEVING PoVERTY BY ENTRENCHING IT
Fixing Britain Layout.qxp_Layout 1 11/12/2015 11:31 Page 11
promoting work incentives, reducing poverty andwelfare dependency’.8
How these proposals for Universal Credit became thecornerstone of the government’s welfare reformprogramme is a story that others will tell when therecord of the 2010 parliament is written. our aim isdifferent. It is to conduct an audit of the consequencesof the government’s welfare revolution and its impacton reducing poverty and welfare dependency amongstclaimants of working age, particularly by improving theincentive to work.
FIxING BRoKEN BRITAIN?
12
Fixing Britain Layout.qxp_Layout 1 11/12/2015 11:31 Page 12

2
Has the governmentmanaged to ‘Get Britain
Working’ again?
i. Work and welfare
Brief as the jobs and welfare section was in ‘TheCoalition: our programme for government’, what wasprinted was highly significant. Eleven of the 12proposals listed were built around the belief that jobsare the only effective route out of poverty and thatgovernment programmes should have this as theiroverriding objective. In the order they were listed, thegovernment promised:
• A single welfare-to-work programme would replaceLabour’s spread of welfare-to-work initiatives;
• Claimants facing the most significant barriers towork would go onto the single welfare-to-workprogramme immediately;
• All claimants aged under 25 would be put on thewelfare-to-work programme after a maximum of sixmonths;
• Those organisations contracted to deliver thewelfare-to-work programme would be paid on thebasis of helping claimants into work;
13
Fixing Britain Layout.qxp_Layout 1 11/12/2015 11:31 Page 13

• Welfare-to-work programme fees would be greaterthe longer the claimant remained in work;
• The receipt of benefit would be made more conditionalso that those able to work would gain benefit onlyhaving demonstrated their willingness to work;
• The National Minimum Wage would be viewed asa protection for low-paid workers as well as anincentive for them to take work;
• All Incapacity Benefit claimants would be reviewed,with those fully capable of work being transferredonto Jobseeker’s Allowance;
• Entrepreneurs would be supported to work forthemselves;
• A range of service academies would offer pre-employment training and work placements; and
• A spread of work clubs would help develop andexchange the skills of claimants while offeringmutual support.
How successful was the government in reducing thevast and growing working-age welfare bill – which hadgrown in real terms from £64 billion in 1997 to £96billion in 2010 – by ensuring those claimants able towork were helped to do so?
ii. A single welfare-to-work programme
The heavy lifting of ensuring that claimants moved intowork was assigned to the new single welfare-to-workprogramme, known simply as the Work Programme,although it was not yet named as such in the Coalition’sprogramme for government. The government committeditself to sweeping away ‘all existing welfare-to-workprogrammes [to] create a single welfare-to-work
FIxING BRoKEN BRITAIN?
14
Fixing Britain Layout.qxp_Layout 1 11/12/2015 11:31 Page 14

programme so as to help all unemployed people to getback into work’.
While a criticism of the Work Programme as it turnedout could be that it was designed to be a one-size-fits-all model, its importance has been in its innovatorypayment system, based not simply on placing theunemployed into work but weighting payments moreheavily towards help for those most difficult to place ina job. The Work Programme had commitments on thisscore which were to create a payment-by-results systemso that the income of those organisations contracted todeliver the programme would reflect more closely theirsuccess in getting all groups of claimants into work.Further reform of the funding formula was promised sothat providers were more generously rewarded thelonger they helped claimants remain in work.
The government made clear at the outset thatJobseeker’s Allowance claimants who faced the mostsignificant barriers to work were to be referred to thenew welfare-to-work programme immediately, and notafter 12 months on benefit, as was the case underLabour’s main programme, the Flexible New Deal.Furthermore, Jobseeker’s Allowance claimants agedunder 25 would be referred to the Work Programmeafter a maximum of six months on benefit.
Events showed that it was more challenging to meetthe commitments which had been expressed so simplyand clearly at the outset. once operational, and onlymonths after signing the Coalition commitment onwelfare reform, the government began backtracking. Itannounced changes to the Work Programme so thatthose aged 18-24 would join only after nine months onJobseeker’s Allowance, rather than after six months ashad been promised.
15
‘GET BRITAIN WoRKING’ AGAIN?
Fixing Britain Layout.qxp_Layout 1 11/12/2015 11:31 Page 15

Claimants referred to the Work Programme were to beassigned to contractors, whose job was to help them intowork by providing help with CVs, job applications andwith more substantial barriers such as drug and alcoholproblems. These contractors were paid on the basis oftheir record in moving claimants into work and keepingthem there. Although it replaced Labour’s Flexible NewDeal, the Work Programme continued Labour’sapproach of giving contractors from the private andvoluntary sectors the freedom to operate, guided onlyby the understanding that they would be paid solely onthe basis of their results.
iii. How effective has the single welfare-to-work programme been?
Despite some notable similarities, the cleanest break fromLabour’s welfare-to-work programmes came with thegovernment’s policy of rewarding contractors only onceindividuals participating on the programme had foundand kept a job for at least six months (although this wasreduced to three months for claimants with disabilities).
For most of its time in office Labour had measured theeffectiveness of its programmes only upon how manyparticipants had started a job. Its introduction in 2009 ofthe Flexible New Deal, however, began weighting therewards towards how many people finding work wereable to keep their job. But the bar was set at three months.
Contractors delivering the Work Programme werealso given a two-year period to help all claimants findwork, with payments made retrospectively once theyhad succeeded on this front, whereas the Flexible NewDeal allotted one year per participant and offeredcontractors a lump sum up front with which they wereexpected to achieve their objectives.
FIxING BRoKEN BRITAIN?
16
Fixing Britain Layout.qxp_Layout 1 11/12/2015 11:31 Page 16

What, then, have been the outcomes of thegovernment’s programme? 1.72 million people werereferred to the Work Programme between June 2011 andMarch 2015. of those, 432,610 (25%) achieved a ‘joboutcome’ on the Work Programme – for most claimantsthis entailed finding and keeping a job for at least sixmonths but, as we have said, the bar was lowered tothree months for claimants with disabilities.
The Work Programme has been marginally moresuccessful than its Labour predecessor, and at half thecost. It seems to have been more able to keep people inwork for a longer period of time of at least six months.Table 1 gives an overall picture for each programme.
The Coalition’s programme also broke new ground inopening its doors to Employment and Support
17
‘GET BRITAIN WoRKING’ AGAIN?
Table 1: Job outcomes of the Flexible New Deal, October 2009 to May 2011, and Work Programme,June 2011 to March 2015
Flexible New Deal
Work Programme
407,690
1,720,000
75,250 (18.4%)
28,130 (1.5%)
49,740 (12.2%)
404,480 (23.5%)
Number of
claimants
referred
Number of
claimants who
found jobs
lasting up to
six months
Number of
claimants who
found jobs
lasting six
months or more
Source: DWP statistical releases
Allowance claimants – generally comprising those whohave been unable to work due to illness or disability –as well as those who were moved off Incapacity Benefiton the basis that they were fit for work. But the WorkProgramme’s successes so far have been unevenly
Fixing Britain Layout.qxp_Layout 1 11/12/2015 11:31 Page 17

distributed amongst different claimant groups andbetween different parts of the country.
As we can see from Table 2, between June 2011 andMarch 2015, 34.1% of people aged under 25 andclaiming Jobseeker’s Allowance found a job through theWork Programme. According to the National Auditoffice (NAo) they also had a far greater chance ofkeeping a job than had they taken part in Labour’swelfare-to-work programmes.1
FIxING BRoKEN BRITAIN?
18
Table 2: Work Programme outcomes, June 2011 toMarch 2015
298,710
734,110
383,210
112,260
199,440
1,727,730
101,870
207,120
95,490
14,740
13,390
432,610
34.1%
28.2%
24.9%
13.1%
6.7%
25.0%
Aged 18-24, claiming JSA(entered after 9 months)
Aged over 25, claiming JSA(entered after 12 months)
Early Entrants, claiming JSA
New ESA claimants
Other ESA claimants
TOTAL
Number of
claimants
referred to
the Work
Programme
Claimant Type Number of
claimants who
found jobs
Proportion of
claimants who
found jobs
Source: DWP statistical releases
Far less impressive is the record of people claimingEmployment and Support Allowance being able to findand keep a job through the Work Programme. Thegovernment originally set a target for contractors ofachieving a ‘job outcome’ for at least 22% of suchclaimants, although halfway through the lastparliament it was forced to downgrade this expectation
Fixing Britain Layout.qxp_Layout 1 11/12/2015 11:31 Page 18

to 13%. Neither target had been met by the end of the parliament.
Likewise the Work Programme has performedrelatively poorly for participants aged 50 and over. ofthe 311,780 over-50s who were referred to the WorkProgramme between June 2011 and March 2015, 51,430(16.5%) found and kept a job for at least three months.Data covering the period to December 2014 shows theywere ten percentage points less likely to achieve a joboutcome than participants aged between 25 and 49, and18 percentage points less likely than those aged between18 and 24.2
on these two fronts the government’s record does notshow any significant improvement on what wentbefore. Although the previous Labour government didnot oblige claimants with disabilities to join its mainemployment programmes, it did establish two separatevoluntary initiatives: the New Deal for Disabled Peoplewhich ran nationally between 2001 and 2006, andPathways To Work from 2007 onwards.3 Between 2001and 2006, the New Deal for Disabled People acceptedon a voluntary basis 260,330 people claiming incapacitybenefits, of whom 110,950 (43%) found work. 59,080 ofthese jobs lasted at least three months.4 The programmecost an estimated £204 million.5
How can we explain the New Deal for DisabledPeople’s relatively healthy success rate? We need lookno further than the government’s own evaluation,which states:
Participants were more likely to be male, younger,on benefits for a shorter period of time, less likelyto have a mental health condition, but more likelyto have musculoskeletal problems, more likely tostate their health was fair, or [very] good and less
19
‘GET BRITAIN WoRKING’ AGAIN?
Fixing Britain Layout.qxp_Layout 1 11/12/2015 11:31 Page 19

likely to say it was [very] bad, and more likely tohave an educational qualification than theincapacity-related benefit population as a whole.6
The programme was therefore sailing with the tide andhad, by its closure, largely succeeded in helping backinto work those whose claims were short-term and whocould be classed as closest to the labour market.
Labour’s second employment programme forclaimants with disabilities, Pathways To Work, sailed inchoppier waters. It delivered a ‘job outcome’ rate of15%, more akin to its successor, the Work Programme.Here lies the brick wall that Welfare Reform Mark Twowill have to surmount. Claimants participating inPathways To Work reported themselves as having
mental health conditions, musculoskeletal andcardiovascular conditions, and… other conditions.However, it was common for people to describe…more than one kind of condition which affectedtheir daily activities. Pain, fatigue and depressionwere common aspects of the lives of many peopletaking part, and medication to control symptomsoften had further effect on memory orconcentration, or caused people to sleep duringparts of the day.7
The authors of the government’s evaluation state laterin the same report that, ‘in retrospect, looking back overthe year since initial contact with [Pathways To Work],the most important influence for many was theirperception of their health’.8
Those tasked with evaluating the Work Programmeidentified similar difficulties facing claimants withdisabilities who ‘often described complex healthconditions, and did not yet feel ready to make progress
FIxING BRoKEN BRITAIN?
20
Fixing Britain Layout.qxp_Layout 1 11/12/2015 11:31 Page 20

towards work. In these situations, they often indicatedthat there was little their adviser would be able to doabout their health conditions in any case, perceiving thiswas the remit of their medical practitioner’.9
It would seem, therefore, that despite the moregenerous payments on offer to contractors to focus theirefforts on claimants with disabilities, the tale betweenLabour’s and Iain Duncan Smith’s main employmentprogrammes was one of continuity; job outcomes forthis group of claimants will not exceed 15% unless thesupport offered is tailored to the health conditions thathinder claimants’ abilities to perform some sort of work.
If the government is intent on opening up this secondwelfare reform front it need not look much further for aworkable policy than its existing stock of programmes,for it launched in october 2010 an initiative called WorkChoice which has enjoyed some success in helpingpeople with disabilities into work, albeit on a limitedscale. Claimants with long-term health conditions orillnesses join Work Choice voluntarily – the same basison which they would have joined Labour’s employmentprogrammes for people with disabilities – and supportis not limited to people claiming any particular benefit.Contractors are paid 70% of their fees upfront to deliverthe programme so they are relatively well equipped totry and support claimants back into a position wherethey can find and keep work.
The official data suggests this strategy has reapedmodest rewards. of the 85,960 claimants who have takenpart in Work Choice, 35,120 found work. 14,390 of thisgroup were able to stay in work for at least six months.10
The government imposed a cap on the number ofclaimants who could take part in Work Choice. Itspreferred route for most claimants was the Work
21
‘GET BRITAIN WoRKING’ AGAIN?
Fixing Britain Layout.qxp_Layout 1 11/12/2015 11:31 Page 21

Programme. A cap was set also on the length of timeclaimants could take part in Work Choice without findingwork.11 We believe the lifting of both caps could help thegovernment build on the programme’s early success.
A separate voluntary employment programme mayalso boost the job prospects of claimants aged 50 andover. Following a trial run in october 1999, Labour inApril 2000 rolled out a voluntary New Deal programmefor the over-50s. Between 2003 and its closure in 2011,the period for which the government recorded data,almost all those enrolled (109,340 out of 115,840) on theNew Deal 50+ started a job, and the programme costaround £80 million a year.12 The data doesn’t allow usto compare directly the New Deal 50+ with the WorkProgramme, as it doesn’t show how many of the over-50s referred to each programme may have started workand left soon after. Yet while the outcomes of Labour’sprogramme represent only a small number of additionaljobs each year, and no data is held on the duration ofthese jobs, such a staggeringly high ‘success rate’becomes that much more remarkable following ourbrief examination of the Work Programme’s record.
How can these different ‘success rates’ for the WorkProgramme be explained and thereby understood? Theold concerns around the mega private contractorscreaming off the ‘easier to help’ claimants have yet to beanswered. Despite the early fanfare from the Departmentfor Work and Pensions, differential pricing has failed tohave much impact so far on the likelihood of contractorstaking an easy win by focusing their efforts on claimantsrequiring relatively little help to find work.
Contractors could earn themselves up to £13,120 foreach Employment and Support Allowance claimantthey place into work. This compares handsomely with
FIxING BRoKEN BRITAIN?
22
Fixing Britain Layout.qxp_Layout 1 11/12/2015 11:31 Page 22

the £3,410 on offer to find jobs for the youngunemployed. Yet just 6.7% of longer-term Employmentand Support Allowance claimants referred to the WorkProgramme have found and kept a job, despite thepayments being weighted towards this group ofclaimants starting work. The department’s ownevaluation published in December 2014, found that‘payment groups have not significantly influenced thesupport being received by participants’, and that only‘a minority of providers did try to target in respect ofdifferential pricing’.13 Most providers understandablydived for those claimants who they could most easilyget into work. More worryingly, the report found lessthan 10% of Work Programme subcontractors madedecisions based on payment fees. Between the 18 primecontractors paid to deliver the Work Programme, thereare 858 subcontractors.
Differential pricing was just one of the means throughwhich the Work Programme was designed to improveupon Labour’s employment programmes. But what ofits overall effectiveness? While evidence from IainDuncan Smith’s first five years suggests that both heand Labour met some measure of success, the WorkProgramme so far has delivered only patchyimprovements on what had gone before, but at half thecost, and well over 60% of unemployed claimantstaking part in welfare-to-work programmes have beenleft ‘parked’ on benefit under both governments.
Most telling in this respect is the Work Programme’sperformance among Jobseeker’s Allowance claimantsaged 25 and over – the largest cohort to participate inthe programme. Contractors expected at the outset tofind work for 42% of claimants in this group, while thedepartment set a lower bar of 39%. Its bare minimum
23
‘GET BRITAIN WoRKING’ AGAIN?
Fixing Britain Layout.qxp_Layout 1 11/12/2015 11:31 Page 23

expectation was 33%. Yet for those claimants whocompleted two years on the programme it failed to liveup to any of these expectations, delivering a success rateof 27% and, with it, only a one percentage pointimprovement on Labour’s Flexible New Deal.
While the long-term unemployed who joined theWork Programme more recently seem to have faredbetter, time will tell whether this has been due toimprovements in the programme itself or moregenerally in the availability of jobs in the economy. TheNational Audit office predicts that 38% of thoseparticipants whose placement continued beyond April2014 had found and kept a job for at least six months,compared with 34% whose Flexible New Dealplacement lasted the same length of time.14
The most notable breakthrough that came with theWork Programme has been to help successful jobseekersremain in work for longer. Yet if the Work Programmeis to become an all-out success the government willneed to reform it in such a way that it is able to delivermuch improved outcomes for people with disabilitiesand those aged over 50, while ensuring those gettingand keeping a job are able subsequently to increase theirearnings. We return to these themes in our postscript.
iv. How do the costs compare withprevious programmes?
The cost of Labour’s Flexible New Deal came in at £770million over two years to october 2011. Just over £1billion had been spent on the Work Programme in itsfirst two years to September 2013, and the governmentestimated the total cost to the taxpayer of the WorkProgramme would be between £3 billion and £5 billionover the six years to 2017. Looking only at the cost of
FIxING BRoKEN BRITAIN?
24
Fixing Britain Layout.qxp_Layout 1 11/12/2015 11:31 Page 24

both programmes per Jobseeker’s Allowance claimant,the National Audit office puts them neck and neck at£1,500 apiece.15 Yet overall the Centre for Economic andSocial Inclusion and the National Institute of AdultContinuing Education, in evidence submitted to theWork and Pensions Committee at the beginning of the2015 parliament, estimated that the Work Programmehad achieved ‘outcomes that are comparable with theprogrammes that it replaced… at a much lower unit cost(perhaps around half the cost, on a per participant basis,than the programmes it replaced)’.16
Again we are presented with a picture of incrementalimprovement, rather than one of revolutionary changeunder Iain Duncan Smith, whereby a steady stream ofclaimants enrolled on welfare-to-work programmes areindeed helped into work, but many others remaindependent on out-of-work benefit.
v. Youth unemployment
The 2010 Conservative manifesto specifically mentionedthe plight of the young unemployed under Labour,suggesting that ‘we are at risk of creating a lostgeneration of young people without the skills toparticipate in the workforce, without hope for thefuture’.17 The two main programmes initiated by theprevious Labour government in an attempt to tackleyouth unemployment were the New Deal for YoungPeople and the Future Jobs Fund.
The New Deal for Young People was introduced in1998. Receipt of Jobseeker’s Allowance for young peopleaged 24 and under was made conditional after sixmonths on taking part in the New Deal for Young People(which is not to be confused with Franklin D. Roosevelt’sjob creation scheme of the 1930s). At the six month stage
25
‘GET BRITAIN WoRKING’ AGAIN?
Fixing Britain Layout.qxp_Layout 1 11/12/2015 11:31 Page 25

of their claim the young unemployed were givenadditional support to apply for jobs, combined with theoffer of training or work experience. Between 1998 and2005, 1,292,890 young people joined the New Deal forYoung People, of whom 446,490 (34.5%) found and kepthold of a job for at least three months. Total expenditureover these seven years came to £2.71 billion.
Although it was judged at the time to have beenbroadly successful, the National Audit office cautionedthat the New Deal for Young People did not necessarilycreate new jobs for claimants. Its success was in beingable to place young people into a labour market which,at the time, was creating jobs aplenty.18 Concerns wereraised, too, around the worryingly large number offamiliar faces who remained out of work and werebeing recycled through the programme. Even if theyfound work, for one reason or another participantsstruggled to keep a job for more than three months andwere destined all too often to be back on benefit.
The programme could be classed, therefore, as aqualified success. It met the Labour government’sobjectives of placing 250,000 young people into work,but was aided in its quest by an extraordinarily benigneconomic environment. The programme was foundwanting when it came to keeping young people in workfor a sustained period of time.
Labour had inherited a youth unemployment rate of14.3% (656,000 young unemployed workers), and at theend of its first term this reached a trough of 11.7%(527,000 young unemployed workers). Yet after adecade of Labour in power and continuous economicgrowth the rate had climbed to 14.7% and the numberto 711,000.
FIxING BRoKEN BRITAIN?
26
Fixing Britain Layout.qxp_Layout 1 11/12/2015 11:31 Page 26

Arguably Labour’s most successful welfare-to-workinitiative, and the programme which broke new ground,came in 2009 when the government was tasked withtrying to handle the economic crisis. The then chancellorof the exchequer, Alistair Darling, set aside £1 billion fora new programme, the Future Jobs Fund, which offeredsubsidies to employers to create paid jobs for youngpeople at risk of becoming long-term unemployed.19
Those on the scheme received at least the NationalMinimum Wage for their work, and were given basichelp in how to present themselves to a future employer,looking for more permanent jobs and a supplementtoward travel costs.
Its impact on youth unemployment was immediate.The Future Jobs Fund created its first job in September2009, following a year in which 160,000 more youngpeople found themselves on the dole and the youthunemployment rate had increased by 4.2 percentagepoints. The Future Jobs Fund within its first threemonths had cut the rate by 0.5 percentage points andthe number by 33,000.20
Why, then, was it scrapped by the Coalitiongovernment? The Future Jobs Fund was a notablevictim of the cuts programme set out by David Laws,the then Liberal Democrat chief secretary to theTreasury, within a month of the Coalition’s advent. Hesought to justify the programme’s closure by claimingit was not providing value for money. Clearly it was tooearly to draw such conclusions. Long after thegovernment moved to close the scheme, it was foundthat the Future Jobs Fund had created jobs for more than100,000 young people during the deepest troughs of therecession, and delivered net benefits of £7,750 perparticipant to society.21
27
‘GET BRITAIN WoRKING’ AGAIN?
Fixing Britain Layout.qxp_Layout 1 11/12/2015 11:31 Page 27

How does the Future Jobs Fund compare to the YouthContract, a similar initiative launched specifically inApril 2012 by the then deputy prime minister, NickClegg, to counter youth unemployment? Although nomention was made of setting up the Youth Contract in‘The Coalition: our programme for government’, thiswas a specific response from the government to highand rising levels of youth unemployment during its firsttwo years in office. The government set the YouthContract the objective of helping low-skilled NEETs(young people defined as ‘Not in Education,Employment or Training’), care-leavers and youngoffenders into work or training. Despite the Departmentfor Work and Pensions initially estimating that therewere 70,000 such individuals who would be helped intowork by providing employers with a wage incentive of£2,275 – barely more than a third of the subsidy offeredunder the Future Jobs Fund – it later revised thisforecast to less than half of the total client group of70,000 starting a paid work placement before thescheme would end in March 2016.22 By November 2014,two and a half years into the scheme, just 16,540 youngpeople participating in the Youth Contract hadcompleted a work placement of six months. £1 billionwas set aside by the Coalition to see through the YouthContract, but by the end of 2013-14 its true cost hadcome to £296 million.
The Youth Contract could best be described as awatered down version of the Future Jobs Fund, inrespect of its funding, provision and outcomes. In justa year and a half covering the deepest recession thecountry has ever experienced the Future Jobs Fundcreated jobs for 100,000 young people. Its successor, the Youth Contract, is on course to create a third of
FIxING BRoKEN BRITAIN?
28
Fixing Britain Layout.qxp_Layout 1 11/12/2015 11:31 Page 28

these jobs over a four-year period spanning a rapideconomic recovery.
The overall level of youth unemployment under thegovernment has fluctuated with the fortunes of thewider economy, as well as the general performance ofthe Work Programme for young Jobseeker’s Allowanceclaimants. It inherited 939,000 young unemployed, anda rate of 20.1%.
Youth unemployment peaked at the halfway stage ofthe 2010 parliament, at 1.05 million and 22.5%respectively. Thanks largely to the upturn in the economyand the improved performance of the Work Programmethe government went into the 2015 election having cutyouth unemployment to 738,000 and a rate of 16%.
vi. Conclusion
We have shown here how the welfare-to-work toolswith which the government has sought to prod peopleinto work have achieved mixed results. The governmenthas been:
• Slightly more successful than Labour in getting thelong-term unemployed into work
• Seemingly23 much more successful than Labour inkeeping them in work for a longer period of time,and at half the cost
• Not very successful in finding work for claimantswith disabilities and those aged over 50
• Wrong to scrap Labour’s Future Jobs Fund beforeevidence had emerged of its success or failure, butthe Work Programme was relatively successful inplacing young people into the jobs aplenty beingcreated during the economic recovery spanning thesecond half of the parliament.
29
‘GET BRITAIN WoRKING’ AGAIN?
Fixing Britain Layout.qxp_Layout 1 11/12/2015 11:31 Page 29

What of the other means through which work was to beincentivised? We pick up on this theme in the followingsection on the conditions attached to drawing benefit.
FIxING BRoKEN BRITAIN?
30
Fixing Britain Layout.qxp_Layout 1 11/12/2015 11:31 Page 30

3
Swinging the pendulumof conditionality:making work the
easier option
i. Phases of conditionality
There have been five phases in which the debate onconditionality shifted in the post-war period. ClementAttlee would have thought that the sun would cease torise if strict rules of conditionality had not applied tothe drawing of benefit. Because most social security inthe immediate post-war period was National Insurance-based, and the ability to continue drawing benefit wasbased strictly on the payment of contributions in whatwere called the relevant contributory years, Attlee’smoral order needed little safeguarding.
Beatrice Webb, a midwife to Fabianism, the LabourParty, its early policy, and much else besides, thoughtthat given the current state of human nature, awardingbenefits unconditionally was simply ‘madness’.1
William Beveridge was clear that the receipt of benefithad to be conditional, both in respect of contributionsand of conduct while claiming benefit. Yet Beveridge’sconditionality was later to be undermined.
31
Fixing Britain Layout.qxp_Layout 1 11/12/2015 11:31 Page 31
A second front opened up in the conditionality debatein the 1960s when the argument was launched thatwelfare should be made far less conditional. This wasat a time when welfare’s National Insurance base wasbeing undermined by the failure to maintain the realvalue of contributory benefits against average earnings,and politicians were opting increasingly for thedistribution of welfare based on the means-test. Thegreat intellectual driving force in arguing for a less andless conditionally-based welfare state was RichardTitmuss, whose influence on the welfare debate in this country is still to be fully judged. Titmuss’s beliefwas that the West was about to enter into an age ofeconomic abundance. The task in the future would notbe one of how to limit benefits, but how to increase thescope and the take-up of such benefits in an age ofunknown abundance.2
That age of abundance did not arrive. Indeed theopposite occurred only too soon with the beginnings inthe 1970s of the oil crisis which led to a quadrupling ofoil prices in the space of a single year and a markeddownturn in the world economy. only three decadeslater did the global economy appear to recover.3 Yet theage of scarcity remained in the political subconsciouswith too many politicians being bitten with the idea ofunconditional welfare.
The political beginnings of a backlash to the Titmussline began very tentatively under Margaret Thatcherwhen the most elementary requirements in drawingUnemployment Benefit were reintroduced. She hadinitially broken the link between signing on for work andthe payment of benefits under some bizarre advice fromSir Derek Rayner, who advised Mrs Thatcher on improvinggovernment efficiency, for saving public expenditure!
FIxING BRoKEN BRITAIN?
32
Fixing Britain Layout.qxp_Layout 1 11/12/2015 11:31 Page 32

A first step back towards conditionality was taken inJuly 1986 when the then employment secretary, LordYoung, rolled out the Restart initiative. This programmeentailed job centre staff asking all those who had beenunemployed for a year or more to enrol on an activitydesigned to help them back into work. It wascompulsory for claimants to undertake this activity ifthey wished to continue drawing benefit and avoidhaving a sanction imposed upon their claim.
Tony Blair’s government continued this gentle tip-toeing onto a new position on conditionality. Labour leftuntouched for a decade the circumstances job centrestaff should take into account when deciding whetheror not to apply a sanction, the level and duration ofsanctions, procedures for challenging sanctiondecisions, and hardship provision for claimants subjectto sanctions. It did, however, widen the net ofconditionality so that the obligations to prepare forwork were applied to new claimant groups, such as loneparents and the sick or disabled. This increased thenumber of claimants to whom benefit sanctions couldbe applied.
The following period we refer to as one of hesitantconditionality – both Labour and the Tories remainedsurprisingly reluctant to grasp the nettle for which theywould have had so much public support and which wascrucial if public opinion was to maintain its confidencein the welfare system. Throughout this period, from2008 until the birth of the Coalition government in 2010, incremental steps were taken to deepen theobligations on lone parents to undertake at least someactivity to prepare themselves for work. From April2008 lone parents with children aged 12 and under wererequired twice a year to attend a ‘work-focused
33
MAKING WoRK THE EASIER oPTIoN
Fixing Britain Layout.qxp_Layout 1 11/12/2015 11:31 Page 33

interview’ with Jobcentre Plus, and from November ofthe same year all lone parents whose youngest childwas aged over 12 were moved from Income Support toJobseeker’s Allowance.
A fifth era in the march back to conditionality wasclearly marked in the ‘Jobs and Welfare’ section of theCoalition’s programme for government: ‘We will ensurethat receipt of benefits for those able to work isconditional on their willingness to work.’ This was aphrase that politicians had used before in their attemptto quell voter unrest at what was perceived to be theease of drawing benefit, and for which the workingpopulation was called upon to pay. But the governmentmoved beyond words and into action. So began the onereform that will have a more long-term and lastingimpact on welfare as we have known it than all theother reforms the government has introduced. In 19words the government gave notice that welfare forworking-age claimants would cease to beunconditional, bringing down the final curtain on theideology of unconditional welfare that had somysteriously captured the thinking of politicians in theearly 1960s.4 Action followed.
How has the intent of abolishing welfare as we haveknown it fared in practice? As so often in respect ofmajor structural reforms, and even more so in culturallydriven ones, the pendulum is pushed so far in theopposite direction that different and equally disturbinginjustices occur in place of the ones with which thereform set out to deal. Hence the need for constantvigilance on how a major reform is working out inpractice. A willingness to modify is not a sign ofweakness but of exercising real statecraft. In ourjudgment such statecraft was lacking in respect of the
FIxING BRoKEN BRITAIN?
34
Fixing Britain Layout.qxp_Layout 1 11/12/2015 11:31 Page 34
government’s sanctions policy which became thecentral agent of this new approach to conditionality.
The claimant contract setting out one’s duties whiledrawing benefit was first introduced in 1996 as theJobseeker’s Agreement and then appeared in its currentform, the Claimant Commitment, in 2013. We welcomethe idea of a claimant contract for it necessarilydevelops the idea of a contract-based society wherecitizens are aware of what their duties are and howthose duties need to be performed before rights areearned. our concern with the current ClaimantCommitment is that the duties, while clearly spelledout, are not buttressed by a counterbalancing series ofsafeguards or rights. Indeed, the words ‘safeguards’ and‘rights’ are missing completely from the contract. Wenevertheless accept that, in moving to a contract-basedsociety, a first step has to be taken, and we welcome theClaimant Commitment as that first step. But we dobelieve, based on what evidence the Department forWork and Pensions has published, that it is now inurgent need of rebalancing. The contract is sodominated by phrases such as ‘you must’ that it readsas though it has fallen from a prison manual. It is on thisbasis of a ‘you must’ culture, unbuttressed by ‘we will’,that the sanctions policy has been built.
Until october 2012 sanctions could be applied toJobseeker’s Allowance claimants if they failed to meetone of the key conditions outlined in the claimantcontract without ‘good cause’. Sanctions were for fixedperiods or of a variable length.
Fixed length sanctions of one, two, four or 26 weekswere imposed for a failure without good cause to attendor participate in an interview or welfare-to-workprogramme, or carry out a specific instruction from a
35
MAKING WoRK THE EASIER oPTIoN
Fixing Britain Layout.qxp_Layout 1 11/12/2015 11:31 Page 35

Jobcentre Plus adviser. Importantly, payment of benefitcontinued in full pending a decision on the impositionof a sanction. Although the government’s conditionalityreforms leave this regulation in place, a furtherlongstanding regulation allows Jobcentre Plus to‘suspend’ a claim if doubts arise as to whether aclaimant has undertaken the necessary activities toprepare themselves for work. If suspicion on this frontleads Jobcentre Plus to suspend a claim, payment ofbenefit ceases immediately. The government does notpublish data on the number of claimants whose moneyhas been docked in this way.
Varied length sanctions of between one and 26 weekswere imposed under the previous regime for failures tocomply with basic requirements, such as refusingemployment without good cause, or losing employmentthrough misconduct. The actual period of suspension ineach case was at the discretion of the ‘decision maker’– a member of staff who decides on benefit claims anddoes not deal face to face with claimants.
Three main changes were introduced in 2012 by thegovernment:
• three categories of sanction became operative anddepended on the nature of the ‘offence’;
• different fixed durations of sanction now exist forfirst, second and third offences;
• the new sanction period now begins on the first dayof the week in which the offence occurred, or thefirst day of the week following the date the claimantlast received Jobseeker’s Allowance.
The ‘independence’ of the decision-making continues inthe new regime, although the fairness of the system asit works out in practice is open for debate.
FIxING BRoKEN BRITAIN?
36
Fixing Britain Layout.qxp_Layout 1 11/12/2015 11:31 Page 36

Lower level sanctions are applied to claimants who,for example, fail to attend an interview with theirJobcentre Plus adviser. These sanctions lead to claimantslosing all of their Jobseeker’s Allowance for a fixedperiod of four weeks for the first failure and any furtherfailures within the next two weeks, followed by 13weeks for subsequent failures within the next year.
Intermediate level sanctions are applied to those who,for example, make themselves unavailable for work.They apply likewise for four weeks following a firstfailure and any repeat failure within two weeks, risingto 13 weeks for subsequent failures in the following year.
Higher level sanctions are applied for those leaving ajob voluntarily or failing to take up the offer of workexperience, for example. Claimants lose all of theirJobseeker’s Allowance for a fixed period of 13 weeks fora first offence and any further offence committed withinthe following two weeks, 26 weeks for a second offencewithin the next year and 156 weeks for a third andsubsequent offence.
This dramatic change in the role conditionality now plays in welfare has clearly put strains onDepartment for Work and Pensions staff in carrying outtheir duties in an effective but humane way. Thenumbers of staff have been progressively reduced and,although the claimant count is down, the scope forofficers deciding upon the sanctions has been verysignificantly increased.
The sanctions policy as initiated by Iain Duncan Smithappears from the reports published by voluntaryorganisations, to whom some might refer as the BigSociety, to be causing havoc and despair amongst agrowing number of claimants.5 Judgment is at theessence here. Clearly a tougher sanctions regime is
37
MAKING WoRK THE EASIER oPTIoN
Fixing Britain Layout.qxp_Layout 1 11/12/2015 11:31 Page 37
required to be applied against those who have grownaccustomed to swinging the lead at taxpayers’ expense.But for others, sometimes confused, often frightened,and for others who have difficulty understandingformal procedures, and others still just simply worndown by the circumstances of their lot, these sanctionssentences cut incomes to a far higher degree than anymagistrates court is empowered to do, and then canonly do after exercising its independent judgment basedon the ‘facts’ presented in open court.
Worse still, the sanctions policy has moved so fast inthe direction against claimants that many of them areunsure of what the ‘charge’ is they are expected torefute, let alone know how to dispute that ‘charge’.6
We believe the sanctions regime as it stands has becometoo rigid, too complex, too harsh, and is applied underconditions that appear to be unfavourable to claimants.All too many claimants appear to be subjected to adisproportionately arbitrary punishment for a simpleand genuine mistake, or a piece of sheer misfortunesuch as their bus arriving late to take them to theirJobcentre Plus appointment.7
The data show that between 2010 and 2015, 3.54million sanction decisions led to a claimant losing theirJobseeker’s Allowance for a set period. Detailedstatistics are published only for the period betweenoctober 2012 and March 2015, during which 1.81million sanctions were applied.8 There is therefore nopossibility of comparing the sanctions policy with thatoperating up to 2012, let alone 2010. The headline figurefor this 2012-15 period is clear; benefit was withdrawnfrom 971,348 Jobseeker’s Allowance claimants.9 Manyof these claimants suffered a series of sanctions beingapplied against them:
FIxING BRoKEN BRITAIN?
38
Fixing Britain Layout.qxp_Layout 1 11/12/2015 11:31 Page 38

• one sanction was applied in 861,055 cases.
• Two sanctions were applied in 188,119 cases.
• Three or more sanctions were applied in 121,089 cases.
Yet this data throws up a slight mismatch between thenumbers sanctioned (971,348), the numbers thegovernment claims were sanctioned on one, two, threeor more occasions (1.17 million) and the number ofsanctions applied (1.81 million). We would welcomeclarification from the Department for Work andPensions on how many claimants are sanctioned once,twice, three times or more.
A similar mismatch arises in the data releasedseparately by the Department for Work and Pensions,which tells us:10
• Decisions to apply a low- or intermediate-levelsanction – which entails a loss of benefit for eitherfour or 13 weeks – were made on 1,026,769 occasions.
• Decisions to apply a high-level sanction – whichentails loss of benefit for either 13 weeks, six monthsor three years – were made on 137,627 occasions.
We are at a loss to state with any certainty how manyclaimants actually lost their benefit for certain periodsof time as some claimants could, of course, have beensanctioned once, twice, or three times. Again we wouldwelcome clarification on this score.
Although the department does not collect data on theimpact of its sanctions policy, it is clear frominformation and research that has been published thata number of claimants – we know not how large anumber – are being pushed permanently outside thebenefits system, leading to some being totallydisconnected from both work and welfare. This groupis left to the protection of their parents, often elderly,
39
MAKING WoRK THE EASIER oPTIoN
Fixing Britain Layout.qxp_Layout 1 11/12/2015 11:31 Page 39
and often poor themselves, or to the charity of friends,should such friends exist, and should they be able tohelp. Such a state of affairs has not been seen since theabolition of the Poor Law in 1948. Before the 2015general election the government admitted in evidenceto the then Work and Pensions Committee that it didnot know where a third of people ended up after theyhad been sanctioned.11 The number of sanctions washalved in the year leading up to the 2015 election, but itstill remained at 506,502. Sanctions are therefore beingapplied at a scale unknown since the Second World War,and the operation of sanctions on this scale makes forthe most significant change in the social security systemas it has existed in the post-war period. our mainrecommendation to the government is that it forthwithinitiates a follow-up survey to see what happens tothose claimants losing benefit.
In an independent review of the previous Labourgovernment’s conditionality policy, Paul Gregg arguedthat the use of sanctions is effective in changingbehaviour as long as the employment programmes ontowhich people are placed are effective.12 He believedsanctions had to be present within the system, tounderpin the obligations and take on the role of abackstop for those failing to fulfil their duties. But healso emphasised how this must be a last resort. Hetherefore concluded that risks to claimants from aconditionality policy must be buttressed by a propersense of fair play and safeguards implemented whensanctions are applied to particularly vulnerable groups.
An indicator that the current sanctions policy may notbe working properly is the number of people, hungry,who resort to food banks after being sanctioned. We estimate that in 2014 between a sixth and a quarter
FIxING BRoKEN BRITAIN?
40
Fixing Britain Layout.qxp_Layout 1 11/12/2015 11:31 Page 40

of food bank referrals took place following a sanction.13
of course, some of those sanctioned will have brokenthe rules and may have refused job offers or failed toturn up for interviews. However, given the impact ofjust a four-week sanction on an individual and theirfamily, let alone one for a whole year or more, thedecision to place sanctions should not be taken withoutfair and clearly understood warnings, with sanctionsonly following the claimant’s failure to complete the responsibilities they clearly understand as part oftheir contract.
We therefore welcome Iain Duncan Smith’s decision topilot a ‘Yellow Card’ warning system – as recommendedby the All-Party Parliamentary Inquiry into Hunger inthe United Kingdom – whereby claimants are given awarning of the government’s intention to apply asanction, and a 14-day period to provide a justifiablereason for failing to meet the terms of their ClaimantCommitment, before the decision to sanction is made.The Department for Work and Pensions will then reviewthis information before deciding whether a sanctionremains appropriate. We very much welcome thisdevelopment and we expect the department to publishthe results of this trial early in 2017.
We believe it is those claimants who should be able toprove with ease that they have a justifiable reason formissing an appointment at Jobcentre Plus, for example,who are most likely to be protected by the introductionof a Yellow Card warning system.
Should the Yellow Card fail to prevent injustices fromoccurring, the government might wish to supplementthis policy with the option for Jobcentre Plus staff ofissuing a non-financial sanction for a claimant’s firstfailure to meet the terms of their Claimant Commitment.
41
MAKING WoRK THE EASIER oPTIoN
Fixing Britain Layout.qxp_Layout 1 11/12/2015 11:31 Page 41

A most worrying sign remains the government’s lackof knowledge on a claimant’s next move after they’vebeen sanctioned. The best estimates suggest around 20%of those leaving benefit following a sanction reportfinding work; but the fate of the remaining 80% isanybody’s guess.14 As is the total amount of benefitexpenditure withdrawn through the application ofsanctions. How are we to judge the effectiveness orotherwise of a policy if its impact on poverty,employment and public expenditure remains amystery? Moreover, as the CSJ notes:
The performance measure that [Jobcentre Plus]uses, the so-called ‘off-flow rate’ which measuresthe number of people who cease to receive theirparticular benefit, is misleading and can be counter-productive … this current measure does notprovide a complete picture of the performance of[Jobcentre Plus]… 15
The government’s policy in respect of the welfare rollwas made clear in its 2011 Performance ManagementFramework, ‘with the clear and shared objective ofmoving customers off benefits as rapidly as possible’.16
The authors behind the official evaluation of this policystated that, ‘one possible negative externality that couldbe related to the [Performance MeasurementFramework] flows from not currently having the “intoemployment” element in the data at the time of thefieldwork’.17 The authors were also concerned that ‘oneway of producing off-flows from benefit is throughsanctioning jobseekers’.18
What then of people not claiming benefit but also notin work?19 Worryingly, the number of people ceasing toclaim Jobseeker’s Allowance whose destination is
FIxING BRoKEN BRITAIN?
42
Fixing Britain Layout.qxp_Layout 1 11/12/2015 11:31 Page 42

unknown almost doubled under Labour, from 1.02million (32% of claimants leaving Jobseeker’sAllowance) in 1998 to 1.96 million (50%) in 2010. Whilethe overall number since then has fallen to 1.51 million,the proportion has increased again to 52%.20
ii. Conclusion
We believe it must be one’s duty while drawingJobseeker’s Allowance to look for work: conditionalityis part of a contract which entails benefit payments beingdependent on satisfying this duty. But this principle hasnow been so applied to an ever greater number ofworking-age recipients, and in what appears to be anindustrial scale operation to remove them from thewelfare rolls, that mass injustices could be occurring andgenuine claimants risk being exposed to destitution.
Widespread concern has been expressed on the justiceinherent in the mass application of sanctions. Thegovernment announced in February 2015 that it wasabout to begin trialling the threat of sanctions againstpeople in low-paid work, should they fail to increasetheir earnings through more hours or a higher hourlywage. By the time of the 2015 election the names of thesepilots had not been disclosed.
We comment in the postscript on the next stage inerecting a sanctions system that is both effective andknows the impact on individuals who have beenproperly warned about the potential consequences ofnot fulfilling their Claimant Commitment. And werepeat our major recommendation that the governmentcommissions an independent body to trace a sample ofclaimants sanctioned, to report on their wellbeing, andfor this report to be published.
43
MAKING WoRK THE EASIER oPTIoN
Fixing Britain Layout.qxp_Layout 1 11/12/2015 11:31 Page 43

It is beyond doubt, for now, that the government’sconditionality policy makes life in work that much morepreferable to being on benefit, but this policy has comewith a social cost – the size of which remains unknown– of people being pushed outside the worlds of bothwork and welfare.
We turn our attention now to the impact of thegovernment’s reforms to Working and Child TaxCredits, Housing Benefit and Council Tax Benefit on its overall objective of making work the best route outof poverty.
FIxING BRoKEN BRITAIN?
44
Fixing Britain Layout.qxp_Layout 1 11/12/2015 11:31 Page 44

4
Raising the bar tomaking work pay
i. Cutting the subsidy to low pay
The British economy has long been characterised by theissue of low pay. Back in 1971 the then Conservativegovernment reverted to a Speenhamland system ofsubsidising low wages, so that workers’ pay could bebrought up to a more acceptable minimum.1 Since thenwage subsidies have grown like no other part of thewelfare state:
• In 1971 the Family Income Supplement wasintroduced which soon had 71,000 claims being met,at a cost in today’s money of £42 million.
• 17 years later in 1988 another Conservativegovernment changed Family Income Supplementinto what was then called Family Credit. 261,000low-paid workers in that year claimed thissupplement to their pay at a cost of £826 million intoday’s money.
• This Family Credit total increased again to 1.2million claimants in 1999 before Labour introducedwhat was called the Working Families’ Tax Credit.The value of the subsidy paid out in that year hadalready reached £3.4 billion in today’s money.
45
Fixing Britain Layout.qxp_Layout 1 11/12/2015 11:31 Page 45

• In 2003, the final year of Working Families’ TaxCredit, 1.4 million low-paid workers in Britainclaimed the subsidy at a cost in today’s money of£8.5 billion.
• Its successors, Working and Child Tax Credits, werebeing claimed by 4.9 million low-paid workersacross the UK in 2011, the peak year of payments.The bill that taxpayers met for this subsidy in thatyear came to £30.5 billion in today’s money.
The government since 2010 has sought to grapple withthis growing taxpayer subsidy to low wages, not by apolicy of attempting to increase real wages, and thereforemaking families less eligible for the wage supplement,but only by restricting eligibility to tax credits.
The severity of the means-test, by which a percentageof benefits are withdrawn as income rises, was increasedbarely a month following the Coalition government’sadvent in 2010. This percentage, or what feels toclaimants like a marginal tax rate, was raised from 39%to 41%. This is estimated to have saved the governmentaround £700 million a year. A more aggressivewithdrawal of benefit from households in which bothpeople work came in the reduction from 2012 of thesecond income threshold; by an extraordinary amount,from £40,000 to £15,860. In practice this meant thatwhereas the marginal tax rate of 41% previously wouldhave applied only to families earning at least £40,000,from 2012 it was extended to all those earning £15,860and above. Yet this move against two-wage earnerhouseholds saved the government only a modestestimated £130 million a year.
The removal of the Baby Element of tax credits, asupplement that could be claimed by families with achild aged under one, saved around £275 million a year,
FIxING BRoKEN BRITAIN?
46
Fixing Britain Layout.qxp_Layout 1 11/12/2015 11:31 Page 46

and the reduction in the backdating period for newclaims and changes of circumstances, from three monthsto one, saved around £350 million a year. Alongside thisthe percentage of childcare costs payable from taxcredits was reduced from 80% to 70% from April 2011,saving £270 million in 2011-12 and around £690 millionin each subsequent year.
A second front in the Coalition’s attempt to cut or atleast contain tax credit costs opened in April 2012:
• Couples with children were required to work acombined total of at least 24 hours per week tobecome eligible for tax credits, up from 16 hours perweek. This move alone cut the tax credit bill byaround £500 million a year.
• The basic rate paid to all claimants, and theadditional rate of up to £810 each year paid toclaimants working 30 hours a week, were frozen incash terms for three years (saving £270 million in thefirst year and rising to £750 million in 2013-14, and£975 million in 2014-15).
• The 50-plus return-to-work bonus was abolished,saving around £30 million a year.
The effect on household incomes of the 2012 reformswas far from modest. The Institute for Fiscal Studiesestimates that lone parents earning £15,600 were madeup to £868 a year worse off.2 The eligibility restrictionsresulted in 1.6 million fewer claims from workinghouseholds being made by April 2014, and the totalwage subsidy fell in real terms by £1.6 billion from itspeak in 2011 to April 2015.3
Behind the opening of this reform front was therecognition that tax credits have played a part insubsidising the creation of part-time jobs offering shorthours at the National Minimum Wage. Earnings
47
RAISING THE BAR To MAKING WoRK PAY
Fixing Britain Layout.qxp_Layout 1 11/12/2015 11:31 Page 47

accrued from such jobs alone could never guarantee alife free from poverty. Hence the dependency of somany workers, and the employers offering these jobs,on tax credits. Having set out to curtail the cost of thissubsidy to low-paying employers, the government islooking now to Universal Credit to set a minimumworking week of 35 hours at the National Living Wagefor those aged 25 and over. Such a commitment to helpincrease the living standards of people entering work islaudable. However, as we outline later in this audit, anumber of obstacles to this commitment have beenerected elsewhere within the government’s plans forUniversal Credit. Their net effect will be to make thiscommitment almost impossible to fulfil. Reformerslooking to maximise household incomes byencouraging people into work, and helping themadvance once there, will face an uphill struggle underthe government’s current plans.
Reformers were left contemplating a further series ofobstacles being strewn across their uphill climb towardsthe summit of fixing ‘broken Britain’, following theopening of a third tax credit reform front in the 2015Summer Budget, under which:
• Child Tax Credit would be limited to two childrenfor new claimants from April 2017.
• The amount by which a claimant’s income canincrease before their award changes would bereduced from £5,000 to £2,500 in April 2016.
• The Family Element would no longer be awardedfrom April 2017 when a first child is born.
• The rate at which tax credits are clawed back fromclaimants would increase from 41% to 48% fromApril 2016.
FIxING BRoKEN BRITAIN?
48
Fixing Britain Layout.qxp_Layout 1 11/12/2015 11:31 Page 48
• The level of earnings at which tax credits begin to beclawed back would be lowered from £6,420 to £3,850from April 2016.
It became all too clear following the Summer Budgetthat the latter two measures alone would cut £4.35billion from the tax credit bill in April 2016. Incombination they would have formed the biggest singlecut ever imposed on tax credit claimants, with 3.2million working households losing an average of £1,350.Their effect would have been to levy on low-paidworkers an effective tax increase of seven pence in the pound.
Hence the collective sigh of relief heaved by thisgroup of grafters when the chancellor announced in his2015 Autumn Statement, following an almighty cross-party campaign in both Houses of Parliament, that hewas abandoning these two measures.
Taking into consideration the overall package of taxcredit reforms enacted since 2010, it should come as nosurprise that the government has not only prevented thetax credit bill growing at what had been the underlyinggrowth rate, but it has actually made some inroads intothe total bill. The cost has been borne, though, both bynew and existing claimants and, because the systemdoes not allow one to remove eligibility from higherearners without impacting on all claimants, those withhigher incomes as well as many others in low-paidwork have shared the losses.
A further cut of £4.35 billion would have been onecut too far to the living standards of low-paid workers– that very group of voters the chancellor was so keen to court before, during and since the last general election.
49
RAISING THE BAR To MAKING WoRK PAY
Fixing Britain Layout.qxp_Layout 1 11/12/2015 11:31 Page 49

ii. Cutting the subsidy to high rents
Coupled with the low wages paid by many of the newjobs created since 2010, a topic to which we return in thefollowing chapter, there has been a startling reversal infortunes in Britain’s housing market which has helpedpush up the Housing Benefit bill both before and sincethe government took office.
Under the previous Labour government real termsexpenditure on Housing Benefit grew from £16.9 billionin 1996-97 to £22.2 billion in 2009-10. Despiteintroducing a raft of measures to try to contain thisexpenditure, it has continued to grow since 2010, by10.4% in real terms, up to £24.5 billion in 2014-15.
What are the drivers behind this £8.6 billion increase,under successive governments, in the landlord subsidy?According to the House of Commons Library we canattribute 42% of the increase in Housing Benefitexpenditure over the past two decades to the growingnumber of people paying soaring rents in the privatesector. 1.62 million private tenants were drawingHousing Benefit in the year leading up to the 2015election – 588,000 more than when Labour came topower in 1997, and 300,000 more than when Labour leftoffice in 2010. Private tenants’ average weekly claimincreased in real terms between 1997 and 2015 from£92.76 to £108.10, although it had peaked in Labour’slast year in office at £121.44, which gives someindication of the success of the government’s assault onthe costs of Housing Benefit. The office for BudgetResponsibility found in its analysis of Housing Benefitexpenditure that in 2012-13 the number of privaterenters exceeded the number of social renters for thefirst time in almost 50 years (i.e. since the post-war
FIxING BRoKEN BRITAIN?
50
Fixing Britain Layout.qxp_Layout 1 11/12/2015 11:31 Page 50
boom in public housebuilding), and, as private rents areon average higher than social rents, this shift was aprime culprit for the upward pressure on HousingBenefit expenditure.4
Under the Library’s calculations, the remaining 58%of the upward pressure on expenditure is accounted forby developments in the social rented sector. Here thereduction in the number of claimants – from 3.55 millionin 1997 to 3.31 million in 2015 – relieved around 13% ofthe pressure on the Housing Benefit budget, but thiswas more than offset by the higher real-terms rentscharged by housing associations to tenants remainingin the social rented sector. The average weekly claimfrom social housing tenants increased in real terms mostunder Labour from £60.63 to £81.45, but then againsince 2010 to £87.96.
The net effect of the past decade’s rent increases ontenants, renting privately or with a housing association,was to increase the proportion of household incomerequired to cover net rent from 12.9% in 2002-3 (the firstyear for which consistent data is available) to 17.1% in2010, and again to 18.9% in 2013.5 Hence the growingneed for support from taxpayers to minimise thechances of being served with an eviction order.
Politicians of all stripes agree that a main cause ofhigher prices and rents is the shortage of homes – eitherfor owner-occupation, in social ownership, or forprivate renting. In contrast with Harold Macmillan’spledge to build over 300,000 homes a year, recentgovernments have failed to build anything like thenumber of homes Britain needs to keep up with changesin the population.
During the post-war period the number of newdwellings peaked in 1968 at 352,000, of which 149,220
51
RAISING THE BAR To MAKING WoRK PAY
Fixing Britain Layout.qxp_Layout 1 11/12/2015 11:31 Page 51

were new social dwellings. In 2010 just 106,720 newdwellings were built – the lowest number of new homesbuilt in any year since 1946 – of which a mere 23,440were new social dwellings. Since then the overallnumber of new homes increased slightly in 2011 to113,350, and again in 2012 to 115,340, before decliningonce more in 2013 to 109,640.
The net effect of these trends in housebuilding hasbeen to increase the difficulties for ordinary workingfamilies to buy a home:
• The average price paid by first-time buyersincreased, in real terms, from £198,000 in 2009,Labour’s final year in office, to £202,000 in 2014.
• The ratio of house prices to earnings for first-timebuyers rose from 4.4 when Labour left office in 2010to 5.1 at the time of the 2015 election.
• The average age of first-time buyers rose by one yearunder the Coalition, from 29 to 30.
Not surprisingly given these longer-term trends, a lookat the number of renters claiming Housing Benefitshows an important change in the composition ofgroups claiming benefit. Pensioners as a group arebecoming less and less dependent on drawing HousingBenefit – a sign of success in tackling pensioner poverty.The overall numbers claiming Housing Benefit fell by257,000 under Labour in the decade prior to therecession. But this fall was accounted for entirely bypensioners, as the number of working-age claimantsremained static.
Moreover the forecast growth of 1.31 million in thenumbers of working-age claimants (from 2.62 million to3.93 million) over the decade to 2018-19 will more thanoffset the continuing decline by 0.3 million in the
FIxING BRoKEN BRITAIN?
52
Fixing Britain Layout.qxp_Layout 1 11/12/2015 11:31 Page 52
number of pensioner claimants (from 1.54 million to1.24 million). The total number of claimants is thereforeforecast to rise by just over 1 million in a decade.
As of 2015, more than halfway through this forecastperiod, there are 3.5 million households of working-agerelying on Housing Benefit, out of a total caseload of 5 million households. By the end of the decade these successive figures are forecast by the Departmentfor Work and Pensions to reach 3.9 million and 5.1million respectively.
A significant source of upward pressure on theworking-age Housing Benefit caseload and expendituresince 2010 has been the growing number of people inwork whose wages are not high enough to cover rent.The proportion of Housing Benefit claims made bypeople in work increased by more than nine percentagepoints, from 13.7% (650,551) in May 2010 to 22.8%(1,103,100) in May 2015. The office for BudgetResponsibility puts this down to the weakness ofaverage wage growth relative to rent inflation.6
How then has the government attempted to rein inexpenditure on Housing Benefit for working-ageclaimants while subsequently incentivising work? Weexamine here its three chosen measures: the Benefit Cap,Local Housing Allowance reforms, and the Bedroom Tax.
The Benefit CapDespite there being no mention nor any hint of such aproposal in ‘The Coalition: our programme forgovernment’, since April 2013 a household benefit caphas applied to households claiming Housing Benefit orUniversal Credit. Its prime objective is to ensure nofamily out of work can receive a higher income than theaverage family in work. of all the reforms introduced
53
RAISING THE BAR To MAKING WoRK PAY
Fixing Britain Layout.qxp_Layout 1 11/12/2015 11:31 Page 53

by the government, this is the one which has had themost immediate effect on work incentives.
The cap applies either to Universal Credit or totalincome from Housing Benefit, Income Support,Jobseeker’s Allowance, and Employment and SupportAllowance. Households in receipt of Working TaxCredit, Personal Independence Payment or DisabilityLiving Allowance are exempt from the cap. The cap wasset in 2013 at £350 a week for childless single claimants,and £500 a week for lone parents or members of couples– the latter being equivalent to gross annual earnings of£35,000, and £26,000 net. It has largely affected familieswith large numbers of children and/or high rental costs.
of the 58,700 households subject to the cap betweenApril 2013 and February 2015, 14,400 (24.5%) respondedby finding work and, as a result, gained exemption fromthe cap.7 That’s almost the same success rate as the WorkProgramme. Moving even into part-time work can havea most dramatic impact on family income. A singleparent with five children in Wirral had the cap appliedto her. When she was helped to find a job by theTroubled Families programme,8 her income increasedsubstantially back to its previous level. Moreimportantly she reported her two eldest children sayinghow proud they were of her for having a job and mademuch of her achievement amongst their peers.Although it currently produces headline savings of‘only’ £185 million a year – a mere 0.09% total welfarespending – its symbolic importance is very significant.
Two further measures were introduced to controlexpenditure; one affecting private tenants and the othersocial tenants.
FIxING BRoKEN BRITAIN?
54
Fixing Britain Layout.qxp_Layout 1 11/12/2015 11:31 Page 54

Local Housing AllowanceThe government introduced in April 2011 a series ofreforms to the Housing Benefit supplement, known asLocal Housing Allowance, paid to private tenants livingin areas where rents are particularly high:
• The Local Housing Allowance was capped in April2011 at the 30th percentile of local private sectorrents, as opposed to the 50th (median) percentile.
• The entitlement to up to £15 per week over andabove rent that claimants were entitled to if theirrent was less than their Local Housing Allowancerate was removed.
• National caps on rates were set at £250, £290, £340and £400 per week for the one-bedroom, two-bedroom, three-bedroom and four-bedroom ratesrespectively.
In January 2012, the shared accommodation rule underwhich rates for claimants aged under 25 are capped atthe level of a single room in a shared property, regardlessof their actual living situation, was extended to includemost single adults without dependent children up to theage of 34, even if they are not living in sharedaccommodation. All Local Housing Allowance rates arenow increased in line with the Consumer Price Index,rather than in line with local rents.
The government expected this package of reforms tosave £420 million in 2011-12, £890 million in 2012-13,and £1 billion a year thereafter.9 Although a totalsavings figure has yet to be published, an officialevaluation concluded that, ‘if the reforms had not beenintroduced, and if [Local Housing Allowance] rates hadcontinued to be linked to median private rents, then
55
RAISING THE BAR To MAKING WoRK PAY
Fixing Britain Layout.qxp_Layout 1 11/12/2015 11:31 Page 55

overall government expenditure on Housing Benefitover the whole period would have been higher’.10
939,220 households were expected to lose an averageof £12 a week in Housing Benefit. Although a quarter ofaffected claimants reported looking for work to try tomake up the shortfall in rent money, the officialevaluation does not attribute any employment effects tothe reforms.11
The Bedroom TaxThe one aspect of the government’s welfare reformprogramme that has attracted most criticism was itsdecision to dock Housing Benefit from social tenantsdeemed to be under-occupying their property. Thereduction incurred under this penalty is 14% of HousingBenefit for one extra bedroom and 25% for two or more.
Quite why this policy was introduced is a mystery, forit visits onto today’s tenants the ‘sins’ or misjudgementsof previous local authorities and their planners, i.e. notenough single bedroom accommodation was built, orthe need for it properly anticipated once the surge forsingle bedroom units was clearly apparent. The firstpolicy objective set out in the impact assessment,carried the government’s stated aim: ‘The policy isintended to contain Housing Benefit expenditure in thesocial rented sector’. The impact assessment states thatthis reform, widely known as the ‘bedroom tax’, butwhat the government calls the Spare Room Subsidy,would be expected to deliver savings of £480 million in2013-14 and £500 million in 2014-15.12 Yet once itemerged that the policy would miss its target for thefirst year by £110 million, Esther McVey, the thenminister for employment, claimed it was ‘never allabout saving money’ and that it was ‘about using the
FIxING BRoKEN BRITAIN?
56
Fixing Britain Layout.qxp_Layout 1 11/12/2015 11:31 Page 56

stock, the housing much better’.13 Even on this front, thebedroom tax failed to deliver. An official evaluationpublished in July 2014 found that just 5.6% of tenantshit by the bedroom tax downsized; the rest needed topay the additional monies from their limitedresources.14 The evaluation reported that:
• 57% of affected claimants cut back on what theydeemed household essentials.
• 35% cut back on non-essentials in order to pay theirshortfall.
• 26% said they had had to borrow money.
Ipsos MoRI found in further research that 32% ofaffected claimants reported having to cut back on food,and 26% on gas and electricity.15
Around 550,000 social tenants were affected by thebedroom tax. While the evaluation states that 18% ofaffected claimants reported either looking for work orseeking to increase their hours, it admits that manystruggled to do so, and Ipsos MoRI’s research suggestsjust 6% of affected claimants sought work as a directresult of the bedroom tax. Worse still, landlordsreported a 16% increase in rent arrears even within thefirst six months of the bedroom tax coming into force.16
A clear lesson here is that the bedroom tax could onlyever be workable, or seen to be fair, if there are enoughsuitable homes to which people can downsize. Withoutsuch an option, claimants have been left between a rockand a hard place.
How might expenditure be reduced in a fairer way? While we address in later chapters the need to boostwages at the bottom, and thereby reduce at least someof the pressure on the Housing Benefit budget, we make
57
RAISING THE BAR To MAKING WoRK PAY
Fixing Britain Layout.qxp_Layout 1 11/12/2015 11:31 Page 57

a plea here for a proper housebuilding programme tobe set in train.
England’s public housebuilding budget fell sharplyafter 2010. It was cut in real terms by £3.6 billion, from£8.8 billion in 2009-10 to £5.2 billion in 2012-13. Despitethese cuts the government has delivered minorimprovements in the number of new affordable homestarts, from 22,000 in 2009-10 to 27,000 in 2013-14. Yet themeaning of affordable housing was changed. Thedefinition of ‘affordable’ was set at an unprecedentedfigure of 80% of local private rents. (What we can’t reportis to what extent this increase in the numbers of affordablehomes being built is due to this change in definition.)
The lack of a serious housebuilding programme,together with a rapid increase in the population, hasmeant that private landlords are able to take advantageof a growing shortage of housing. So while HousingBenefit payments have been cut for 900,000 tenants inthe private sector, tenants were left to pick up 90% of the bill.17 The impact of the cuts, therefore, must have been to widen the gap between renters’ incomesand outgoings.
Even if the political will was mustered for a serioushousebuilding programme – one that extended beyondbrownfield sites and into the scrubbier areas of thesacred green belt – Britain’s skills shortage, as thingsstand, would scupper such a programme. Researchfrom the Local Government Association highlights twoalarming trends confronting the government: 10,000fewer construction qualifications were awarded eachyear in Britain, while the number of bricklayers requiredto meet existing, let alone future demand increased by15,600 between 2013 and 2015.18
FIxING BRoKEN BRITAIN?
58
Fixing Britain Layout.qxp_Layout 1 11/12/2015 11:31 Page 58
We propose in our postscript some reforms to sustainthe housebuilding programme that Britain so badlyneeds. We have shown here how vital this will be to anyserious attempt at reining in the Housing Benefitbudget, in a way which doesn’t disadvantage thepoorest claimants, including many of those working forlow wages.
iii. Cutting Council Tax Benefit
The government decided in its 2010 Spending Reviewthat local authorities were to administer Council TaxBenefit, but that it would cut the overall budget by10% (£471 million). And in a sign that this was to be‘localism-lite’, the government stipulated to localauthorities that pensioners, accounting for 38% ofclaimants, must retain their full entitlement to benefit.So local authorities effectively had to decide howmany of the 3.1 million existing working-age claimantson low incomes were to receive a smaller entitlement,or no benefit at all to help cover the costs of Council Tax.
The outcome, not surprisingly, was grim. The ChildPoverty Action Group and the Zacchaeus 2000 Trustfound that 2.3 million people on low incomes were onaverage £167 a year worse off because of this particularcut.19 Council Tax arrears became one of the fastestgrowing debt problems encountered by debt charityStepChange – second only to payday loans. In 2010, just10% of StepChange clients had arrears on their CouncilTax bills. In 2014, this had grown to 28%. StepChangereported that ‘not only are more of them in arrears, theyowe more. our clients owe an average of £832 inCouncil Tax arrears – up from £675 in 2010’.20
59
RAISING THE BAR To MAKING WoRK PAY
Fixing Britain Layout.qxp_Layout 1 11/12/2015 11:31 Page 59

Local authorities, too, found themselves in animpossible position. In March 2014, a year after theintroduction of the policy, the total amount of CouncilTax outstanding in England reached £2.52 billion; anincrease of £152 million on a year earlier.
The total saving to the government from this policy of£471 million, therefore, was yielded not by theDepartment for Work and Pensions, nor localauthorities themselves, but by the Department forCommunities and Local Government. As a result, theyfell outside the ‘welfare savings’ bracket, and came withno progress whatsoever towards improving claimants’incentive to work. The government’s impact assessmentfor the policy stated only that ‘local authorities maywish to preserve as far as possible the incentive to enterwork or to increase earnings’.21
iv. Conclusion
of the three main reforms the government hasintroduced to Housing Benefit, therefore, the only onethat shows any promise for mending ‘broken Britain’ isthe Benefit Cap, for it is the only one of the three to haveshown evidence of improving the incentive forclaimants to work. While the bedroom tax and LocalHousing Allowance reforms delivered savings to thegovernment, they did so at great cost to respectivetenants in the social and private rented sectors and without addressing the real drivers of HousingBenefit expenditure.
one such driver, as we have seen, was the growingnumbers of low-paid workers relying on HousingBenefit to top-up their wages to an acceptable minimumthat could absorb rent. We have seen also in this chapter
FIxING BRoKEN BRITAIN?
60
Fixing Britain Layout.qxp_Layout 1 11/12/2015 11:31 Page 60

how the government restricted some low-incomehouseholds’ entitlement to tax credits and supporttowards Council Tax bills. It is to the widerdevelopments since 2010, in terms of the numbers andliving standards of low-paid workers, that we now turn.In doing so we pose the question: does work providethe best route out of poverty?
The policies we have outlined in this chapter overallwill have made this task much more difficult.
61
RAISING THE BAR To MAKING WoRK PAY
Fixing Britain Layout.qxp_Layout 1 11/12/2015 11:31 Page 61

5
Work as the best routeout of poverty?
i. The success of Welfare Reform Mark One
The government’s overall objective for welfare reformhas been to make work pay a higher income than onecould expect to receive on benefit, thereby curtailing thewelfare dependency of ‘broken Britain’. Has thisobjective been borne out by the data on employmentand earnings since 2010?
The government can claim considerable credit foradding to the numbers of people in work. Here is a real success for its welfare-to-work strategy (i.e.Welfare Reform Mark one) and conditionality policies,as well as its cutting of company taxation and the returnof a growing economy, but it is important not tooverlook the basic instinct of most people who see workas their duty.
Yet, in these favourable circumstances, have thegovernment’s policies made work pay a sufficientincome? For it is in the success of moving claimants intowork that we begin to see the next major challenge to arolling programme of welfare reform. In a study ofthose leaving out-of-work benefits between February
62
Fixing Britain Layout.qxp_Layout 1 11/12/2015 11:31 Page 62

and March 2011, the Department for Work and Pensionsfound that 55% of those moving on from Jobseeker’sAllowance to work for an employer were employed oneither a fixed-term or temporary/casual basis, withrespective average earnings of £15,200 and £12,400, andthat 25% were back on benefit within seven months.1
And it is to this group, many of whom are justmanaging to hold on to their jobs, that the governmentis proposing to apply sanctions to encourage them towork longer, or to seek jobs with higher pay. Theirprospects look grim.
The major challenge, therefore, is how to ensureclaimants who were on a low income on benefit arepositively helped up the pay scale rather than beingparked in low-paying jobs or tipped back onto benefitbefore they can secure a permanent place in theworkforce, or sanctioned for failing to be moresuccessful in finding better paid work.
ii. The prevalence of poverty
The previous Labour government’s assault onpensioner poverty, although expensive, was broadlysuccessful. The poverty rate among pensioners fell from29.1% in 1996–97 to 18.1% in 2007–08; a fall of 11percentage points bringing the number of poorpensioners down from 2.9 million to 2 million.
There were no similar signs of success amongst theworking-age population. The number of poor childlessadults of working age increased under Labour from 3.5million to 4.2 million, while the number of poorworking-age parents remained static at 3.3 million.2
Little has happened to disturb this dismal record thatthe government inherited in 2010. Indeed, looking at the
63
WoRK AS THE BEST RoUTE oUT oF PoVERTY?
Fixing Britain Layout.qxp_Layout 1 11/12/2015 11:31 Page 63

data on the numbers of working-age poor, it is difficultto see when or if a general election was held leading toa change in government. 21% of working-age adultswere deemed poor in six out of seven years, spanningtwo of Labour’s final three years and each of itssuccessor’s first four years in office.3
But what of the impact on the poverty data from thegovernment’s reform programme since 2010, and inparticular its effect on people in low-paid work? TheInstitute for Fiscal Studies notes over the period betweenMay 2010 and May 2015 that within each income decile,workless households were hit more than three times ashard as equivalent families in work by the government’scuts programme.4 This will undoubtedly have madework a more attractive proposition to life on benefit.
A notable sign of this strategy bearing fruit is a fall inthe total number of people claiming the main out-of-work benefits. This total now stands at its lowest since1999, down by 975,050 since May 2010 to a total of 3.85million in November 2014. The number of people livingin workless households fell by over 650,000 between2010 and 2014, and is now the lowest since recordsbegan in 1996.5 With the fall in the overall number ofpeople on benefit so too has there been a fall in thenumber of children living in households where no oneworks, down by 388,000 from 1.9 million in May 2010to 1.5 million in May 2014. However, many of thoseentering the labour market since 2010 have done so bytaking low-paid work.
How successful, therefore, has the government’soverall strategy been in ensuring that work is the bestroute out of poverty? or have yesterday’s workless poor become today’s working poor? The government’sstrategy can be deemed successful on two fronts.
FIxING BRoKEN BRITAIN?
64
Fixing Britain Layout.qxp_Layout 1 11/12/2015 11:31 Page 64
First, the risk of poverty remains much higher inworkless households than in families where at least oneperson is in work. In 2013-14 63% of working-agehouseholds in which no adults worked were poor. Bycontrast only 9% of households in which all adultsworked were poor, and likewise 29% of households inwhich at least one adult was in work.6 An individualremains much more likely to be poor, therefore, if theyare drawing out-of-work benefit. Getting a job cutsdramatically the risk of being poor. The government’swelfare reform programme has reinforced this outcome.
Second, the government has increased the gapbetween the income one could expect to earn from beingin work and what they would receive from out-of-workbenefit. In the absence of the government’s reforms, andhad the previous raft of policies remained unchanged,income received through out-of-work benefit wouldhave caught up slightly with earnings. Under thisscenario the Institute for Fiscal Studies calculates thatbenefit income would have increased by 1.7 percentagepoints, from 55.3% of earned income to 57%, relative towhat an individual could expect to receive fromwork.7But the overall impact of the government’sreform package so far has been to widen by 2.7percentage points the gap, termed the ‘replacementrate’, between what an individual could expect to earnin work and receive in benefit.
The government’s reforms therefore have made gettinga job an overall more attractive alternative to life onbenefit, albeit marginally so. As Table 3 demonstrates, thisimpact has been particularly pronounced for one-earnercouples with no children and single-person households;their replacement rates have been cut respectively by 6.4percentage points and 2.4 percentage points.
65
WoRK AS THE BEST RoUTE oUT oF PoVERTY?
Fixing Britain Layout.qxp_Layout 1 11/12/2015 11:31 Page 65

Table 3: Impact of the Coalition’s reforms on replacement rates
Single, no children
Lone parent
Partner not working,
no children
Partner not working,
children
Partner working,
children
Partner working,
no children
All households
38.7%
70.6%
58.6%
70%
65.6%
55%
55.3%
36.3%
70.4%
52.2%
65.6%
65.8%
54.8%
53.6%
41.5%
72.3%
59.8%
71.8%
67.3%
56%
57.0%
Replacement
rate in 2010
Group Replacement rate
in 2015 following
Coalition reforms
Replacement rate
in 2015 without
Coalition reforms
Source: Institute for Fiscal Studies, 2013
While this data demonstrates the government’scommitment to ensuring people in work are better offthan others on out-of-work benefit, it does not tell uswhether this income from work is high enough toprovide failsafe protection against poverty.
In fact, the shifting composition of the poor since 2010would suggest that getting a job is not enough, in itself,to fend off poverty. Worryingly from all points of view,working households formed a larger share of theworking-age poor in 2014 than they did in 2010; anincrease over this period of four percentage points, from60% in 2009-10 to 64% in 2013-14.8 How do we accountfor this growing proportion of working householdsamong Britain’s poor?
Here we see the conflict that can arise between theobjective of making work pay a sufficient income while
FIxING BRoKEN BRITAIN?
66
Fixing Britain Layout.qxp_Layout 1 11/12/2015 11:31 Page 66

at the same time achieving cuts in the welfare budget aspart of the government’s overall deficit reductionprogramme, when such a significant part of that welfarebudget to be cut has been given over to subsidising lowpay – or making work pay a more adequate minimum.
While the increase in the personal tax allowance hasincentivised work by reducing the tax burden on thelowest paid, this measure was more than cancelled outby the rest of the government’s tax and benefit reforms,including most notably cuts to benefits made availableto low-paid workers, such as tax credits and HousingBenefit. The overall impact of the government’s reformpackage on working households has made:9
• Single adults fractionally worse off by less than 1%;
• Lone parents 6% worse off;
• one-earner couples with children just under 5%worse off; and
• Two-earner couples with children 2% worse off.
This is hardly a record that shows a discrimination infavour of working families. Real wages also fell, therebyblunting the prospects of making work a more attractiveand prosperous alternative to a life on out-of-workbenefit. The Institute for Fiscal Studies stated prior tothe 2015 general election that falling real wages hadhalved the impact of the government’s reforms to makepeople in work better off than those on benefit.10 Wagegrowth at the bottom, therefore, has been a vital missingpart of the government’s welfare reform puzzle.
iii. The wage scene
If we use an absolute threshold for low pay, defined astwo thirds of the 2014 median adjusted for Consumer
67
WoRK AS THE BEST RoUTE oUT oF PoVERTY?
Fixing Britain Layout.qxp_Layout 1 11/12/2015 11:31 Page 67
Price Index (CPI), the proportion of jobs paying lowwages halved over the decade leading up to thefinancial crisis, from 30% (7.59 million) in 1999 to 15%(4.12 million) in 2009. But after 2010 this trend went intoreverse, as both the number and proportion increasedto 6.08 million and 21% respectively.
The reason why work under the government has notprovided failsafe protection against poverty is the verysignificant growth in the numbers of people in verylow-paid jobs, even though many do not now pay taxon their earnings. By 2014, 4.47 million people in workearned less than £10,000, the level to which the personaltax allowance had been raised, compared with 3.83million in 2010; an increase of just over 640,000 people.
The new earnings profile shows that in 2014,compared with 2010, there were:
• 239,673 more workers earning less than £5,000 a year(in 2014 terms);
• 402,383 more earning between £5,000 and £10,000;
• 457,084 more earning between £10,000 and £15,000;
• 455,675 more earning between £15,000 and £20,000.
This changing shape of the earnings pattern isexplained, in part, by the addition of 253,000 jobs in low-paying occupations in 2013-14.
There are, of course, two factors comprising these lowearnings. Aside from the rates of hourly pay – the realvalue of the National Minimum Wage increased in eachyear prior to 2007 and has fallen a great deal thereafter– a key driver behind the growth in the numbers ofworkers on low incomes is the restriction many of themface on the number of hours they are able to work. The proportion of part-time workers who, in 2015, saidthey work part-time because they cannot get more
FIxING BRoKEN BRITAIN?
68
Fixing Britain Layout.qxp_Layout 1 11/12/2015 11:31 Page 68

hours stood at 1.31 million; an increase of 240,000 since2010. Similarly, the number of workers employed onzero-hours contracts – contracts that do not guaranteea minimum number of hours from week to week –ballooned under the Coalition to 744,000. Meanwhilethe numbers of workers in temporary jobs because theycould not find full-time work stood at 589,000 in 2015;76,000 higher than in 2010. If current rates ofemployment patterns continue the Trade UnionCongress suggests this level of ‘under-employment’ willnot return to its pre-crisis level until at least 2023 –halfway through the next parliament.11
Low pay can, for many, all too often become a lifetimecurse. The Resolution Foundation looked at thepersistence of low pay in 2013.12 They found that ofpeople who were in low-paid work in April 2002:
• 18% escaped low pay over the next decade (these arethe people who were in work and earning above the
69
WoRK AS THE BEST RoUTE oUT oF PoVERTY?
Figure 1: Changes in the distribution of real earnings between 2010 and 2014
4.0
3.5
3.0
2.5
2.0
1.5
1.0
0.5
0
Nu
mb
ers
of
ind
ivid
ua
ls (
millio
ns)
Real earnings (£ thousands, 2014 prices)
0-5 5-10 10-15 15-20 21-25 25-30 30-35 35-40 40-45 45+
2010
2014
Source: office for Budget Responsibility, 2014
Fixing Britain Layout.qxp_Layout 1 11/12/2015 11:31 Page 69

low pay threshold in April 2010, April 2011 andApril 2012);
• 27% were stuck in low pay and unemployment overthe next decade (these are the people who only everheld low-paid jobs in the Aprils between 2003 and2012, including those who moved betweenunemployment/inactivity and low-paid work);
• 46% cycled out of and into low pay over the nextdecade (these are the people who escaped low payat some point during the decade, but did not escapeout of low pay for good, as they were not in higher-paid work for April 2010, April 2011 and April 2012).
But looking only at employees would leave us with anincomplete picture, such has been the growth in self-employment since 2010. Recent developments in thenumbers of people classing themselves as self-employed have sparked some debate as to whether ourlabour market has begun delivering entrepreneur afterentrepreneur, or that there is a troubling tide ofinsecurity at the bottom. In short, there is some truth inboth accounts.
The number of people classing themselves as self-employed reached a record high in 2014, growing byhalf a million since 2010 to 4.52 million. Moreover, thenumber of self-employed identifying themselves asmanagers and directors increased from 502,000 in thelast year of the previous Labour government to 739,000in 2014. Likewise the number of self-employed workersin other ‘professional occupations’ rose from 627,000 inLabour’s final year in office to 748,000 in 2014. Almostone in six workers now class themselves as self-employed. If this growth persists at the rate it has since2008, the number of self-employed people will outstripthose working in public sector jobs by 2018.13
FIxING BRoKEN BRITAIN?
70
Fixing Britain Layout.qxp_Layout 1 11/12/2015 11:31 Page 70

Why, therefore, did self-employed workers’ medianincomes shrink in real terms by £29 a week in 2012-13,having already declined by £65 a week between 2007-08 and 2011-12? We believe the answer is to befound in the rapid increase in the number of self-employed workers in lower-paying industries. For thenumber of workers identifying themselves as self-employed in care, leisure and other service occupationsincreased by almost a third under the Coalitiongovernment, from 243,000 to 311,000, as did those insales and other customer service jobs, from 81,000 to105,000, and elementary occupations, from 206,000 to286,000.14 These trends might help to explain whyaround a third of the self-employed report incomesbelow the personal allowance.15
iv. Conclusion
Real wage growth at the bottom has been the missingpiece of the government’s welfare reform puzzle. Whilework remains preferable to a life on benefit and bringswith it a dramatic reduction in the risk of being poor,and the government’s efforts have reinforced thisoutcome, it does not provide complete protectionagainst poverty. As we have seen, in previous chaptersas well as this one, the explanation for the government’sfailure to enshrine work as a failsafe means of guardingagainst poverty is twofold. First, there has been asignificant increase in the number of people movingfrom low benefit income into low-paid jobs and beingparked there; second, cuts have been imposed uponbenefits and tax credits claimed by this same group oflow-paid workers.
At a time of falling real wages and the growth of low-paid work, therefore, the onus would fall upon the
71
WoRK AS THE BEST RoUTE oUT oF PoVERTY?
Fixing Britain Layout.qxp_Layout 1 11/12/2015 11:31 Page 71

government’s flagship welfare reform, Universal Credit, to fix ‘broken Britain’ by enshrining work as thebest route out of poverty. It is to this task we now turnour attention.
FIxING BRoKEN BRITAIN?
72
Fixing Britain Layout.qxp_Layout 1 11/12/2015 11:31 Page 72

6
Universal Credit:‘Welfare That Works’?
i. The changing profile of claimantdependency
Central to the Centre for Social Justice’s analysis of‘broken Britain’ was what it saw as a benefits systemthat discriminated against work. To mend ‘brokenBritain’ required a transformation of the benefit systemby way of the introduction of Universal Credit. Thepolitical historians may be interested in how aprogramme, so full of risk and potentially at such greatcost, came to be the Coalition’s flagship welfare reformpolicy with so little public and maybe cabinet debate.our concern again here is in the record of itsimplementation, coverage and cost.
Universal Credit was unveiled in a 2010 White Paperentitled ‘Welfare That Works’. All too soon the governmenttrumpeted it as the means through which benefits wouldbe simplified and work made more attractive. A thirdpromise was that it would help bring benefit expenditureunder control. Yet the early findings from UniversalCredit’s glacial rollout suggest that each of these threegoals face considerable difficulties in being achieved.
The assumptions underpinning Universal Credit werelaid out in a series of CSJ reports beginning with
73
Fixing Britain Layout.qxp_Layout 1 11/12/2015 11:31 Page 73
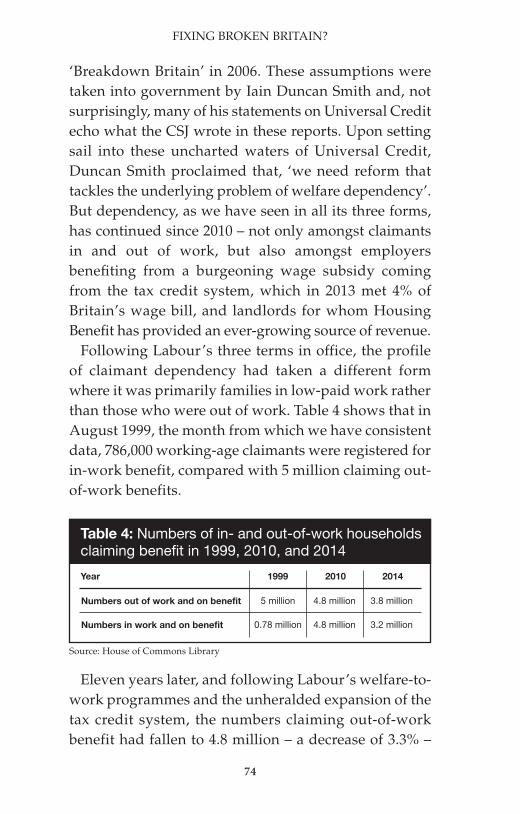
Table 4: Numbers of in- and out-of-work householdsclaiming benefit in 1999, 2010, and 2014
Numbers out of work and on benefit
Numbers in work and on benefit
5 million
0.78 million
4.8 million
4.8 million
3.8 million
3.2 million
1999Year 2010 2014
Source: House of Commons Library
‘Breakdown Britain’ in 2006. These assumptions weretaken into government by Iain Duncan Smith and, notsurprisingly, many of his statements on Universal Creditecho what the CSJ wrote in these reports. Upon settingsail into these uncharted waters of Universal Credit,Duncan Smith proclaimed that, ‘we need reform thattackles the underlying problem of welfare dependency’.But dependency, as we have seen in all its three forms,has continued since 2010 – not only amongst claimantsin and out of work, but also amongst employersbenefiting from a burgeoning wage subsidy comingfrom the tax credit system, which in 2013 met 4% ofBritain’s wage bill, and landlords for whom HousingBenefit has provided an ever-growing source of revenue.
Following Labour’s three terms in office, the profileof claimant dependency had taken a different formwhere it was primarily families in low-paid work ratherthan those who were out of work. Table 4 shows that inAugust 1999, the month from which we have consistentdata, 786,000 working-age claimants were registered forin-work benefit, compared with 5 million claiming out-of-work benefits.
FIxING BRoKEN BRITAIN?
74
Eleven years later, and following Labour’s welfare-to-work programmes and the unheralded expansion of thetax credit system, the numbers claiming out-of-workbenefit had fallen to 4.8 million – a decrease of 3.3% –
Fixing Britain Layout.qxp_Layout 1 11/12/2015 11:31 Page 74

but this total in 2010 was matched by the numbers oflow-paid workers claiming benefit, the army of whomhad increased in size by 515% to 4.8 million. Thegovernment’s reform programme by the end of 2014had reduced both counts respectively, to 3.8 million and3.2 million, leaving in place a smaller but nonethelesssubstantial army of in- and out-of-work claimants.
ii. Claimants’ marginal tax rates
How then does this army fare under the current tax andbenefit system, as it stands in 2015? We have seen howthe government reinforced the gap between what onecould expect to receive from work and on benefit. Butwhat of the transition into work and the prospects ofimproving one’s income once in work? We cansummarise the existing system as follows:
• People receiving tax credits, but paying no IncomeTax or National Insurance, pay a marginal tax rateof 41p in the pound.
• People receiving tax credits, and paying Income Taxand National Insurance, pay a marginal tax rate of73p in the pound.
• People receiving Housing Benefit and tax credits,but paying no Income Tax or National Insurance,pay a marginal tax rate of 79p in the pound.
• People receiving Housing Benefit and tax credits,and paying Income Tax and National Insurance, paya marginal tax rate of 91p in the pound; this increasesto 96p once Council Tax support is factored in.
And what of their fortunes under Universal Credit? Theheadline figure suggests a marginal improvementunder Universal Credit where many claimants enteringwork would see their benefit withdrawn not at 73p or
UNIVERSAL CREDIT: ‘WELFARE THAT WoRKS’?
75
Fixing Britain Layout.qxp_Layout 1 11/12/2015 11:31 Page 75

more in the pound under the current medley of means-tested benefits, but at a rate at least 8p lower, at 65p inthe pound.1
The full picture, however, is much more complex. Thenew single benefit withdrawal rate of 65p in the poundwill lead to higher marginal tax rates for someclaimants, and lower for others, depending on thecombination of benefits and tax credits in play:
• People receiving tax credits, but paying no IncomeTax or National Insurance, are likely to besubstantially worse off to the tune of 24p in thepound under Universal Credit.
• People receiving tax credits, and paying Income Taxand National Insurance, are likely to be worse off by3p in the pound.
• People receiving Housing Benefit and tax credits,but paying no Income Tax or National Insurance, arelikely to be better off under Universal Credit, by 14pin the pound.
• People receiving Housing Benefit and tax credits,and paying Income Tax and National Insurance, arelikely to be at least 26p in the pound better off underUniversal Credit.
The government summarised in its impact assessmentthe effect of Universal Credit on these marginal tax rates:2
• There would now be virtually no households payingmarginal tax rates above 80p in the pound.
• 1.3 million fewer claimants would pay marginal taxrates of 70p or more in the pound.
• Although these ginormous rates are all but abolished,600,000 more people would see their overall marginaltax rates increase rather than decrease.
FIxING BRoKEN BRITAIN?
76
Fixing Britain Layout.qxp_Layout 1 11/12/2015 11:31 Page 76
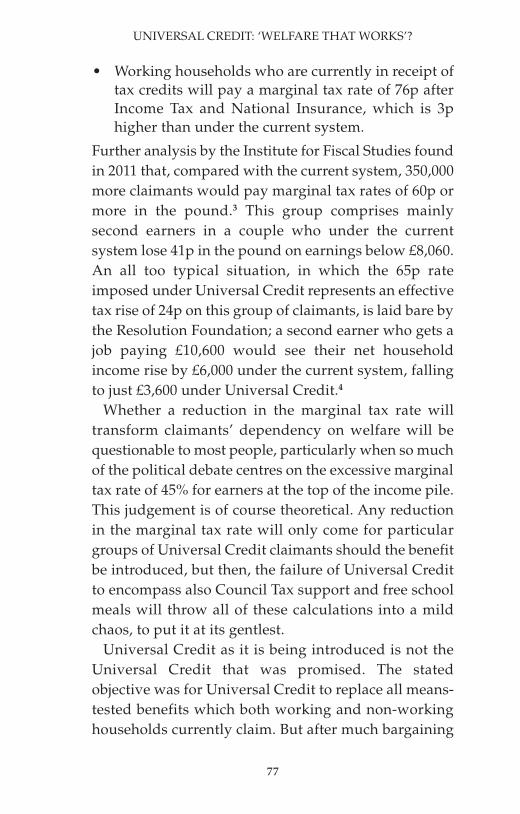
• Working households who are currently in receipt oftax credits will pay a marginal tax rate of 76p afterIncome Tax and National Insurance, which is 3phigher than under the current system.
Further analysis by the Institute for Fiscal Studies foundin 2011 that, compared with the current system, 350,000more claimants would pay marginal tax rates of 60p ormore in the pound.3 This group comprises mainlysecond earners in a couple who under the currentsystem lose 41p in the pound on earnings below £8,060.An all too typical situation, in which the 65p rateimposed under Universal Credit represents an effectivetax rise of 24p on this group of claimants, is laid bare bythe Resolution Foundation; a second earner who gets ajob paying £10,600 would see their net householdincome rise by £6,000 under the current system, fallingto just £3,600 under Universal Credit.4
Whether a reduction in the marginal tax rate willtransform claimants’ dependency on welfare will bequestionable to most people, particularly when so muchof the political debate centres on the excessive marginaltax rate of 45% for earners at the top of the income pile.This judgement is of course theoretical. Any reductionin the marginal tax rate will only come for particulargroups of Universal Credit claimants should the benefitbe introduced, but then, the failure of Universal Creditto encompass also Council Tax support and free schoolmeals will throw all of these calculations into a mildchaos, to put it at its gentlest.
Universal Credit as it is being introduced is not theUniversal Credit that was promised. The statedobjective was for Universal Credit to replace all means-tested benefits which both working and non-workinghouseholds currently claim. But after much bargaining
UNIVERSAL CREDIT: ‘WELFARE THAT WoRKS’?
77
Fixing Britain Layout.qxp_Layout 1 11/12/2015 11:31 Page 77
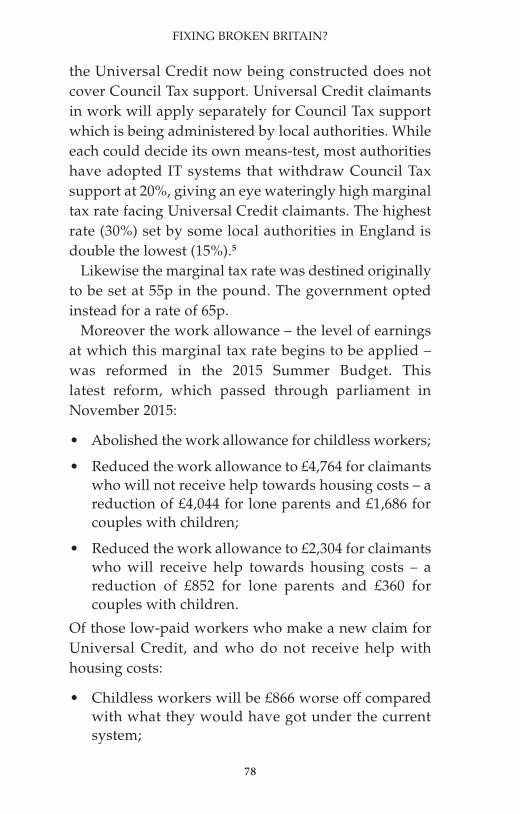
the Universal Credit now being constructed does notcover Council Tax support. Universal Credit claimantsin work will apply separately for Council Tax supportwhich is being administered by local authorities. Whileeach could decide its own means-test, most authoritieshave adopted IT systems that withdraw Council Taxsupport at 20%, giving an eye wateringly high marginaltax rate facing Universal Credit claimants. The highestrate (30%) set by some local authorities in England isdouble the lowest (15%).5
Likewise the marginal tax rate was destined originallyto be set at 55p in the pound. The government optedinstead for a rate of 65p.
Moreover the work allowance – the level of earningsat which this marginal tax rate begins to be applied –was reformed in the 2015 Summer Budget. This latest reform, which passed through parliament inNovember 2015:
• Abolished the work allowance for childless workers;
• Reduced the work allowance to £4,764 for claimantswho will not receive help towards housing costs – areduction of £4,044 for lone parents and £1,686 forcouples with children;
• Reduced the work allowance to £2,304 for claimantswho will receive help towards housing costs – areduction of £852 for lone parents and £360 forcouples with children.
of those low-paid workers who make a new claim forUniversal Credit, and who do not receive help withhousing costs:
• Childless workers will be £866 worse off comparedwith what they would have got under the currentsystem;
FIxING BRoKEN BRITAIN?
78
Fixing Britain Layout.qxp_Layout 1 11/12/2015 11:31 Page 78

• Lone parents will be £2,629 worse off;
• Couples with children will be £1,084 worse off.
of those low-paid workers who receive help withhousing costs under Universal Credit:
• Childless workers will be £866 worse off comparedwith what they would have got under the currentsystem;
• Lone parents will be £554 worse off;
• Couples with children will be £234 worse off.
The overarching goal of Universal Credit – of reducingthe marginal tax rate for the working poor – has notbeen met. ‘Broken Britain’ will not be mended by theintroduction of this benefit. Furthermore, UniversalCredit was built on the faulted assumption that anyincrease in income, no matter how small, wouldrevolutionise work incentives for claimants who havecome to view their unearned benefit as a pension. Workfor this group has to show a very substantial increase intheir income if they are freely to seek work.
iii. The costs and implementation ofUniversal Credit
So what of the costs and rollout of Universal Credit? TheJune 2010 Spending Review allocated £2 billion overfour years, both to set up Universal Credit and to ensureclaimants would not be worse off once they startedclaiming, with a view to all claimants on existingbenefits being migrated to the new benefit by 2017. Toachieve this target, let alone secure the target of thetransformation to a new system, it was important tostop recruiting at some stage new claimants onto thoseexisting benefits that Universal Credit is intended to
UNIVERSAL CREDIT: ‘WELFARE THAT WoRKS’?
79
Fixing Britain Layout.qxp_Layout 1 11/12/2015 11:31 Page 79
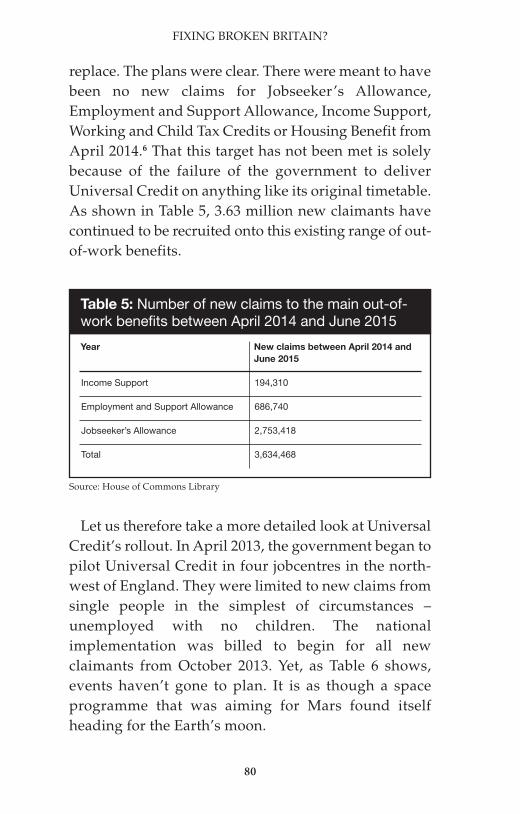
replace. The plans were clear. There were meant to havebeen no new claims for Jobseeker’s Allowance,Employment and Support Allowance, Income Support,Working and Child Tax Credits or Housing Benefit fromApril 2014.6 That this target has not been met is solelybecause of the failure of the government to deliverUniversal Credit on anything like its original timetable.As shown in Table 5, 3.63 million new claimants havecontinued to be recruited onto this existing range of out-of-work benefits.
FIxING BRoKEN BRITAIN?
80
Let us therefore take a more detailed look at UniversalCredit’s rollout. In April 2013, the government began topilot Universal Credit in four jobcentres in the north-west of England. They were limited to new claims fromsingle people in the simplest of circumstances –unemployed with no children. The nationalimplementation was billed to begin for all newclaimants from october 2013. Yet, as Table 6 shows,events haven’t gone to plan. It is as though a spaceprogramme that was aiming for Mars found itselfheading for the Earth’s moon.
Table 5: Number of new claims to the main out-of-work benefits between April 2014 and June 2015
Income Support
Employment and Support Allowance
Jobseeker’s Allowance
Total
Year
194,310
686,740
2,753,418
3,634,468
New claims between April 2014 and
June 2015
Source: House of Commons Library
Fixing Britain Layout.qxp_Layout 1 11/12/2015 11:31 Page 80
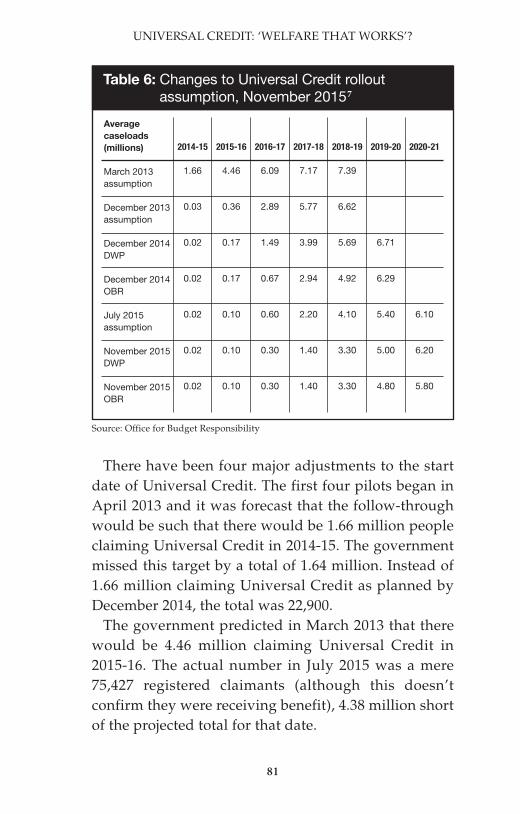
Table 6: Changes to Universal Credit rollout assumption, November 20157
Average
caseloads
(millions)
March 2013 assumption
December 2013 assumption
December 2014 DWP
December 2014 OBR
July 2015 assumption
November 2015 DWP
November 2015 OBR
2014-15
1.66
0.03
0.02
0.02
0.02
0.02
0.02
2015-16
4.46
0.36
0.17
0.17
0.10
0.10
0.10
2016-17
6.09
2.89
1.49
0.67
0.60
0.30
0.30
2017-18
7.17
5.77
3.99
2.94
2.20
1.40
1.40
2018-19
7.39
6.62
5.69
4.92
4.10
3.30
3.30
2019-20
6.71
6.29
5.40
5.00
4.80
2020-21
6.10
6.20
5.80
Source: office for Budget Responsibility
There have been four major adjustments to the startdate of Universal Credit. The first four pilots began inApril 2013 and it was forecast that the follow-throughwould be such that there would be 1.66 million peopleclaiming Universal Credit in 2014-15. The governmentmissed this target by a total of 1.64 million. Instead of1.66 million claiming Universal Credit as planned byDecember 2014, the total was 22,900.
The government predicted in March 2013 that therewould be 4.46 million claiming Universal Credit in2015-16. The actual number in July 2015 was a mere75,427 registered claimants (although this doesn’tconfirm they were receiving benefit), 4.38 million shortof the projected total for that date.
UNIVERSAL CREDIT: ‘WELFARE THAT WoRKS’?
81
Fixing Britain Layout.qxp_Layout 1 11/12/2015 11:31 Page 81

But Iain Duncan Smith remains confident that at somestage and at some unnamed date in the future, thepromises of Universal Credit will be fulfilled. A savinggrace has been a reduction in the costs of introducingthe scheme – not surprisingly. of the £2 billion set asideby the chancellor in 2010 to cover the costs of rolling outUniversal Credit, more than two thirds remainedunspent by the end of 2014.
Missing the deadlines by miles for the number ofclaimants who should be receiving Universal Credithasn’t dented the government’s enthusiasm for settingequally ambitious targets for the future. The latestguesstimates for the transfer of existing claimants ontothe new Universal Credit is ‘after 2017’. How much after2017 the government doesn’t wish to divulge. Nor doesit disclose how many will have been transferred beforethen. It is equally vague about by when the bulk ofclaimants will have been transferred. It looks, however,as though it will be quite some time after 2017. Theoffice for Budget Responsibility, which considers theintroduction of Universal Credit as it impacts uponfuture social security costs, has stated that it expects taxcredit claims to continue in their current form until2018-19.8 It wisely does not speculate how much longerbeyond that date it might take to transfer all those thenin receipt of tax credits to Universal Credit.
For the scheme to deliver its claimed potential it isnecessary not only for it to be rolled out. Universal Creditdepends crucially on this month’s benefit being linked tolast month’s earnings. For this to be achieved UniversalCredit relies on the real-time information (RTI) systembeing supplied by a very considerable number ofemployers to Her Majesty’s Revenue and Customs(HMRC). This information is then transferred to the
FIxING BRoKEN BRITAIN?
82
Fixing Britain Layout.qxp_Layout 1 11/12/2015 11:31 Page 82

Department for Work and Pensions to calculate UniversalCredit. This information is central to the departmentbeing able accurately to pay a claimant their monthlyentitlement. A big attraction of Universal Credit has beenbilled that current payments will be varied according tothe income registered during the previous month.Without this automatic link to the immediate period ofearnings claimants will begin to be paid incorrect sumsin Universal Credit. These over- and under-paymentswill then land Universal Credit into the same mire thatmany tax credit claimants find themselves with all toooften having large overpayments being presented tothem for repayment. This is not a minor issue. By 2013the total outstanding amount owed to HMRC in taxcredit overpayments had reached £5.6 billion. The debtwas shared among 4.7 million families.9
So far the RTI system hasn’t fully lived up to its billingon this front either. We’ve encountered not insubstantialconcerns among small businesses about whether theirsystems will be able to cope with RTI and itsaccompanying requirements. The National Audit officeinformed us in February 2014 that while the vastmajority of British industry was signed up to RTI, 2,952small and medium enterprises and 156,000 ‘micro-businesses’ employing fewer than 10 employees werenot yet using the system. This group of micro-businesses was granted an opt-out period until April2016. What’s more, the Department for Work andPensions did not yet know how many small businesses,those that employ between 10 and 49 workers, hadtaken up the option of its temporary RTI opting-outperiod, which had been in place since April 2013.
Many smaller businesses make frequent paymentsand payroll adjustments over the course of an average
UNIVERSAL CREDIT: ‘WELFARE THAT WoRKS’?
83
Fixing Britain Layout.qxp_Layout 1 11/12/2015 11:31 Page 83

month, and each of these triggers the need to report toHMRC any changes in circumstances. Indeed mostpeople on low incomes will be much more familiar withreceiving their wages on a weekly basis than at the endof each month, even if the pattern is changing. Anyburden from Universal Credit might be expected to begreater on those businesses that lack the infrastructureof larger companies.
The problems of Universal Credit do not end here,however. other government departments havehighlighted problems in respect of the Department forWork and Pensions’ flagship policy. officials at HMRCare said to have identified claimants who areunderreporting their actual earnings, and are nowlooking at introducing six-monthly reporting to preventthe potential for employers and employees colluding tomaximise their benefit payment.10 So much for the claimmade in 2010 that Universal Credit would remove theincentive to defraud the taxpayer.11
Another of the government’s great hopes forUniversal Credit – that it would bring greater simplicityand clarity to the maze of means-tests – is in danger ofbeing undermined by what has not been includedunder the Universal Credit banner.
iv. Much pain and not much gain
The government’s failure to set out whether childrenliving in households in receipt of Universal Creditwould be entitled to free school meals has muddied thewaters still further in respect of work incentives andremains to the detriment of poor children. Under thecurrent system, even following the introduction ofuniversal free school meals for under-8s, 1.6 million
FIxING BRoKEN BRITAIN?
84
Fixing Britain Layout.qxp_Layout 1 11/12/2015 11:31 Page 84
children from poorer families are disqualified fromreceiving free school meals because their parents are inwork, even though they are on low income. If theirparents were to receive the same level of income (below£16,190 a year) but were not in work, their family wouldsave £400 a year thanks to the free school meal schemefor families on out-of-work benefits. But, as thingsstand, these children will continue to lose out, and theirparents will be penalised for working for their poverty,as the government has repeatedly failed to clarifywhether Universal Credit would bring with it automaticentitlement to free school meals.
Likewise, the government took simplification to thepoint of absurdity by abolishing Council Tax Benefitand devolving responsibility to local authorities forcompensating households on low income with theirCouncil Tax bills. Life is ‘made simpler’ for theUniversal Credit applications and calculations certainly,but only at the price the claimant pays in the loss ofincome. As we have seen each local authority is free toset its own criteria and taper rates for Council Taxsupport. But with less money being given to them thanwhat the projected Council Tax Benefit budget entailed,most local authorities short of overall funds have hadto restrict eligibility for, and not exempt any householdincome when deciding the level of, Council Tax support.It has been estimated that this move alone will increasethe marginal tax rate facing people claiming UniversalCredit, on average, by 7p in the pound.12 This wouldbring the true marginal deduction rate to 72%. The CSJproposed in 2009 that support for Council Tax bills bekept within the Universal Credit tent. Duncan Smithtook this proposal into office, but it was in fact vetoedin the 2010 Spending Review.
UNIVERSAL CREDIT: ‘WELFARE THAT WoRKS’?
85
Fixing Britain Layout.qxp_Layout 1 11/12/2015 11:31 Page 85
one issue has, however, been settled in favour of someUniversal Credit claimants – should they ever findthemselves able to register. The government announcedthat from April 2016 it would increase childcare supportwithin Universal Credit to better incentivise work andensure that it is worthwhile for low- and middle-incomeparents to work up to full-time hours. An additional£200 million of support for childcare will be provided,and it is hoped that this sum will cover 85% of childcarecosts for all households should they qualify for theUniversal Credit childcare element.
v. Conclusion
Universal Credit has failed the test set for it by thereformers within the government of fixing ‘brokenBritain’ by ‘making welfare work’. As things stand, taxcredits look set to remain the major wage subsidy.
one consequence of the government’s failure todeliver Universal Credit, and the substantial savings itwas meant to have released, was to make that muchmore significant the need for reform elsewhere withinthe existing stock of benefits. This reform would benecessary for the government to achieve its plannedcutbacks in the working-age welfare budget, encourageclaimants into work, and thereby fix ‘broken Britain’.Hence the urgency with which it set about reformingIncapacity Benefit, and it is to this effort we now turn.
FIxING BRoKEN BRITAIN?
86
Fixing Britain Layout.qxp_Layout 1 11/12/2015 11:31 Page 86
7
Dividing the sheep andthe goats?
i. Reforming Incapacity Benefit
For well over three decades successive governmentshave wrestled to control the growing costs of IncapacityBenefit. ‘To ease the passing’1 of the loss of largely male,moderately well-paid jobs became the government’sstrategy to maintain social peace when negotiating arapid rundown of Britain’s heavy industries. Asredundancies in these industries moved from a trickleto a flood, peace was bought by the offer of moregenerous Incapacity Benefit payments (then calledInvalidity Benefit) over the value of UnemploymentBenefit (as Jobseeker’s Allowance was then called).Invalidity Benefit had an additional advantage over thepayment of means-tested Unemployment Benefit; it waspaid irrespective of a partner’s earnings, therebyenhancing the possibility of increasing a household’soverall income.
This social peace strategy came with a price tag,however, and a growing one at that. The numbers ofwhat were initially redundant workers claimingIncapacity Benefit rose substantially; more than treblingfrom 796,000 in 1983 to a staggering 2.49 million by1996. The annual costs rose accordingly, ballooning
87
Fixing Britain Layout.qxp_Layout 1 11/12/2015 11:31 Page 87

from £5.1 billion in 1983 to £11.4 billion in real terms by 1996.
once the fear of disorder that might have followedthese mass redundancies had abated, successivegovernments changed direction. Government effortsmoved to curtailing entitlement and thereby cutting thecost of Incapacity Benefit. These efforts centred onmaking new claimants’ access to benefit that much moredifficult by raising the eligibility bar.
This process of making the gateways to benefit thatmuch more difficult to negotiate began under theprevious Labour government. In 2008 Labourintroduced Employment and Support Allowance,thereby heralding the replacement of Incapacity Benefitand Income Support for claimants with disabilities. Thetest for Employment and Support Allowance became aWork Capability Assessment which diverted thosefound capable of some form of work to Jobseeker’sAllowance, and those who might one day be helpedinto this position to the Work Related Activity Group ofEmployment and Support Allowance. others whosehealth prevented them from any form of working wereplaced into the Support Group of Employment andSupport Allowance. Existing claimants of IncapacityBenefit under Labour’s plans were due to be movedonto Employment and Support Allowance betweenoctober 2010 and April 2014. This was the programmethat Iain Duncan Smith inherited.
The Labour government became frustrated in itsattempts to reduce the number of claimants by its WorkCapability Assessment and it did not take long for theCoalition to share this response. Progress was painfullyslow with the number of people claiming Employmentand Support Allowance or Incapacity Benefit falling
FIxING BRoKEN BRITAIN?
88
Fixing Britain Layout.qxp_Layout 1 11/12/2015 11:31 Page 88

only from 2.42 million in 2009-10 to 2.38 million in 2014-15. of the 1.38 million Incapacity Benefit claims that hadbeen reassessed between october 2010 and March 2014,only 253,560 had been found fit for work andtransferred to Jobseeker’s Allowance. The figureforecast for 2015-16 in the June 2010 Budget for thenumber of working-age claimants of incapacity benefitswas put at 2.17 million. Yet in the 2014 AutumnStatement, the government was forecasting that therewould be 2.52 million such claimants in 2015-16 – up bya third of a million claimants.
Not surprisingly the expected savings of around £1billion from reassessing Incapacity Benefit claimants by2014-15 that had been forecast back in 2010 had to becut by almost three quarters – down to £281 million.2
Worse news in respect of the benefit savings target wasto come. The office for Budget Responsibility in June2015 revised upwards the forecast for Employment andSupport Allowance/Incapacity Benefit expenditure onthe grounds that even fewer claimants than the radicallyrevised total would be expected to be found fit forwork.3 The reason why these savings have not beenforthcoming can be found in the falling number ofIncapacity Benefit claimants found fit for some kind of work.
In 2009, the first year in which claimants wereassessed for their capability to look for work, and thefinal full year of the previous Labour government, 63%of people first assessed were found fit for work with26% asked to undertake some work-related activity.only 10% were found entitled to unconditional support.The latest figures show just how dramatically theestimated savings had to be revised. By 2013 just 34%were found fit for work and 47% were given
89
DIVIDING THE SHEEP AND THE GoATS?
Fixing Britain Layout.qxp_Layout 1 11/12/2015 11:31 Page 89

unconditional support. The remainder – some 19% –were assessed as having limited capability to undertakesome work-related activities, such as an occasionalinterview with a Jobcentre Plus official.
FIxING BRoKEN BRITAIN?
90
A further source of frustration for the government wasthe delayed timetable for reassessing the remainder ofcurrent Incapacity Benefit claims. The process ofmoving people off Incapacity Benefit and ontoEmployment and Support Allowance or Jobseeker’sAllowance was meant to have been completed by April2014. But just a month prior to this date 102,000claimants were still awaiting reassessment. TheDepartment for Work and Pensions forecast eightmonths later, in December 2014, that 85,000 peoplewould still be on Incapacity Benefit in 2015-16 – up totwo years after the shutters were to come down onpayments to anyone claiming Incapacity Benefit.
The government focused its frustration over thefailure to close Incapacity Benefit to new claimants atAtos, the private contractor entrusted by the Labourgovernment with the reassessment process. The boilingover of the government’s frustration was plain for all tosee when Atos was sacked in 2015.4 Mike Penning, the
Table 7: Outcomes for claimants tested for Employment and Support Allowance
2009
2013
63%
34%
26%
19%
10%
47%
Proportion of
claimants found
as being capable
of work
Proportion of
claimants found as
being capable of some
work-related activity
Proportion of
claimants found
incapable of work
Year
Source: DWP Statistical Releases
Fixing Britain Layout.qxp_Layout 1 11/12/2015 11:31 Page 90

then minister overseeing the migration to the newbenefit, said, upon terminating the contract, that thereports produced by Atos contained ‘significant qualityfailures’, adding with some considerable glee that ‘Atoswill not receive a single penny of compensation fromthe taxpayer for the early termination of their contract.’Comfort, no doubt, in dispensing with Atos’s work. Nosuch comfort on the benefit costs front, however.
We can see from this brief overview why the office forBudget Responsibility decided to rank spending onIncapacity Benefit and Employment and SupportAllowance as the most significant risk affecting itsforecast for future welfare expenditure, the others beingPersonal Independence Payment and Universal Credit,outlined in Table 8.
91
DIVIDING THE SHEEP AND THE GoATS?
Table 8: Risks to welfare expenditure forecasts, identified in June 2015 by the Office forBudget Responsibility
Incapacity Benefit/Employment and Support Allowance
Disability Living Allowance/Personal Independence Payment
Universal Credit
Benefit
• Backlog of Work Capability Assessments for existing Incapacity Benefit claimants
• Higher than expected proportion of claimantsfound entitled to unconditional support
• Slower than planned transition from DLA to PIP• Higher than expected proportion of claimants
found entitled to PIP
• Repeatedly delayed rollout
Risk factor
Source: office for Budget Responsibility, Welfare Trends Report, June 2015
The government had set about implementingLabour’s proposed reassessment programme so it couldbegin making inroads into the working-age welfarebudget. Neither Labour nor the Coalition since 2010 can
Fixing Britain Layout.qxp_Layout 1 11/12/2015 11:31 Page 91
be faulted for their efforts on this front. But the manydifficulties arising from its implementation, and thesubsequent changes the government introduced to tryto repair some of these faults in the process, haveblunted such prospects.
To what extent, though, could this frustration beattributed to the actual design of the reassessmentprocess? Is a one-off Work Capability Assessment themost appropriate means through which an individual’sreadiness, or otherwise, for work can be determined?With so much riding on this single event, and with oftencomplex physical and mental health issues in play,decisions have always been open to dispute.
How might the government, therefore, moreeffectively help claimants into a position where they feelable to prepare themselves for some sort of work? onesuch remedy might be to reform the Work CapabilityAssessment into a longer-term process, thereby leavingbehind what could be described as an unreliable andunsympathetic examination under the current system.A more gradual test could determine benefit eligibilitythrough a regular set of appointments, in which thoseconducting the reassessment can get a better idea of thefactors that may enhance or limit a claimant’s ability tolook for some sort of work.
Resulting from this process could be an ‘improvingyour life’ contract, bestowing upon claimants somebasic duties they have a realistic chance of being able tofulfil. Listed alongside these duties would be the helpthey can draw upon to fulfil them. This help mightconsist of frequent meetings with a specialist healthadviser, for example.
But whatever help is deemed appropriate for anindividual claimant, it would be provided on the basis
FIxING BRoKEN BRITAIN?
92
Fixing Britain Layout.qxp_Layout 1 11/12/2015 11:31 Page 92

that it should support their efforts to find some sort of work.
ii. Replacing Disability Living Allowancewith Personal Independence Payment
Whereas reducing the number of Incapacity Benefitclaims was a shared endeavour of both Labour and thecurrent government, the move to reduce the cost ofDisability Living Allowance claims arose solely after2010. Disability Living Allowance is a tax-free benefitdesigned to help disabled people with mobility and care costs.
When Labour took office in 1997 there were 1.84million people claiming Disability Living Allowance.Disability Living Allowance found itself exempt fromreform throughout Labour’s time in office. The numbersclaiming the unreformed Disability Living Allowanceclimbed to 3.13 million in 2010, with the costs over thisperiod increasing similarly in real terms from £6.69billion in 1996-97 to £12.73 billion in 2009-10.
Reforming Disability Living Allowance had neverbefore made it onto the political agenda. Prior to 2010the growth in spending on Disability Living Allowance,as well as the numbers of people claiming, was largelyabsent from the political debate on welfare reform. Theprospect of reforming Disability Living Allowance wastotally absent from each of the main parties’ 2010manifestos. Hence the surprise which greeted thegovernment’s decision in 2011 to completely replaceDisability Living Allowance for new claimants fromApril 2013 with a new Personal Independence Payment.
Personal Independence Payment is similar instructure to Disability Living Allowance, comprising a
93
DIVIDING THE SHEEP AND THE GoATS?
Fixing Britain Layout.qxp_Layout 1 11/12/2015 11:31 Page 93

daily living component and a mobility component.Claimants qualify by filling in a self-assessment form.However, under Personal Independence Payment,unlike Disability Living Allowance, a claimant’seligibility then is dependent on their disability beingassessed at a medical. But it is a medical with adifference. And here is the second significant change.The disability test for Personal Independence Paymentinvolves an assessment of the ability of an individual to‘participate fully in society’ rather than of the severityof their impairment. This means that, unlike inDisability Living Allowance, there are no medicalconditions that will lead to an automatic entitlement toPersonal Independence Payment; it is, however, amedical test that determines eligibility and the value ofPersonal Independence Payment. While thegovernment did not set out what it means to ‘participatefully’, the daily living component of PersonalIndependence Payment is available to claimants whohave difficulty eating, washing, dressing andundressing, reading and communicating, managingmedicines and treatment, making financial decisions,and meeting new people.
Second, the mobility component is allocated on thebasis of a claimant’s ability to plan and follow a journey,rather than a simple assessment of their ability to walkunaided. Personal Independence Payment also involvesan objective and continuing assessment of claimants’needs. And, just as there are no medical conditions thatwill lead to an automatic enrolment, there are nolifetime awards either. Each claim is assessed andrequires renewal after a set period of time. Theassumption is that the Personal Independence Paymentwill be awarded for a fixed term of between a year and
FIxING BRoKEN BRITAIN?
94
Fixing Britain Layout.qxp_Layout 1 11/12/2015 11:31 Page 94

ten years, rather than being awarded for life. Claimantswill automatically be reassessed at the end of this term,as well as during that term if circumstances change. Inorder to make a claim, an individual is required tosubmit a form detailing the effect their disability has ontheir day-to-day life, along with documentation and/orreferences from medical professionals and carers.
By April 2015 a total of 950,700 applications had beenmade for Personal Independence Payment and decisionshad been made on 810,500 of these claims, leaving140,200 claims outstanding.5 Within the total number ofapplications there were 136,700 reassessments ofexisting Disability Living Allowance claimants; 814,000were new claims. 77% of existing Disability LivingAllowance claimants were found eligible for PersonalIndependence Payment, as were 50% of new claimants.
People being moved from Disability Living Allowancecontinue to receive their existing payments until adecision has been made on their entitlement to PersonalIndependence Payment. A first Personal IndependencePayment is meant to arrive 28 days after this decision,although the Department for Work and Pensions isunable to tell us whether this works out in practice.
Mystery also shrouds the financial position of newPersonal Independence Payment applicants who weren’tpreviously claiming Disability Living Allowance. Thedepartment again holds no data on new claimants’sources of income while their application is beingprocessed. This process takes weeks, and often months.
Disability Living Allowance remains open to newclaims and the numbers of people claiming the benefit rose slightly in the last parliament, from 3.13million in 2009-10 to 3.34 million in 2013-14.Expenditure rose likewise in real terms from £12.73
95
DIVIDING THE SHEEP AND THE GoATS?
Fixing Britain Layout.qxp_Layout 1 11/12/2015 11:31 Page 95
billion to £14.09 billion, which led the office for Budget Responsibility to conclude in June 2015 thatexpenditure on disability benefits in 2014-15 would be£600 million higher than expected.6 Eventually themove to Personal Independence Payment and thesmaller caseload is expected to reduce spending by £2.4billion a year by 2019-20. Time will tell whether thisestimate is any more accurate than it has been forexpenditure on other benefits.
The government forecast in 2010 that introducingassessments under the new Personal IndependencePayment regime would save £360 million in 2013-14,rising to around £1 billion in 2014-15. The office forBudget Responsibility stated in october 2014 that it didnot expect any of these savings to arrive before the 2015 election.7
Why, therefore, did the substitution of PersonalIndependence Payment for Disability Living Allowancefail to deliver these savings? our answer is simple; therewere fewer people claiming Personal IndependencePayment, and more claiming Disability LivingAllowance, which it was supposed to have replaced bythe end of the last parliament. The impact assessmentaccompanying the introduction of PersonalIndependence Payment assumed that there would be 1.7million people of working age claiming PersonalIndependence Payment and nobody receiving DisabilityLiving Allowance in 2015-16.8 The government’s mostrecent estimate in June 2015 suggests there will be just476,000 working-age Personal Independence Paymentclaimants in 2015-16 and a further 1.48 million receivingDisability Living Allowance – bringing the total numberof working-age claimants in receipt of disability benefitsto 1.96 million.9
FIxING BRoKEN BRITAIN?
96
Fixing Britain Layout.qxp_Layout 1 11/12/2015 11:31 Page 96

We welcome the introduction of PersonalIndependence Payment but, again, given its glacialrollout very little has changed on this welfare front.What, then, of the initiatives that have deliveredsuccessfully on the government’s objectives?
97
DIVIDING THE SHEEP AND THE GoATS?
Fixing Britain Layout.qxp_Layout 1 11/12/2015 11:31 Page 97
8
Big successesi. Success in cutting overall welfare
expenditure
The Coalition achieved something that no othergovernment has been able to. The reforms enacted since2010 resulted in a real-terms cut in working-age welfareexpenditure in the last parliament.
The single area where we report success withoutqualification for the government in achieving its welfareobjectives is in delivering its plan to cut the welfare billover and above what it was projected to be. Key to thisdelivery has been the reform to the indexation ofworking-age benefits and tax credits.
In 2011-12 and 2012-13, tax credits and benefits forworking-age claimants (including disability benefits)were indexed to the Consumer Price Index (CPI). CPItends to increase more slowly than both Retail PriceIndex (RPI) and the Rossi index (RPI without housingcosts). The Rossi Index prior to April 2011 was theformula used to uprate means-tested benefits. In termsof savings this seemingly innocuous move reduced thewelfare bill, compared to what it would otherwise havebeen, by £4.3 billion.1 It therefore accounts for the mostsignificant change enacted in the last parliament.Further savings of £1.7 billion were pursued by cappingbenefit increases at 1% for three years from April 2013
98
Fixing Britain Layout.qxp_Layout 1 11/12/2015 11:31 Page 98

(disability benefits are excluded) – although even thismeasure looks likely to have saved £1 billion less thanforecast in the 2013 Budget. Additional savings of £3billion were sought through freezing Child Benefit andWorking Tax Credit. It is important to remember thatthis package comes on top of the not insubstantial cutsto Housing Benefit and Council Tax support. Hencewhy the government’s endeavour to achieve savingslies beyond doubt.
There is a downside, however, in that this policycomes with a cost in terms of cuts in claimants’ realliving standards and also in an increase in child poverty.The government has estimated that its reforms to theindexation of benefits and tax credits will have resultedin around an extra 200,000 children being made poor by2015-16, and the differential rates of inflation faced bypoorer families will have been compounded by cashfreezes and minimal annual increases in benefit income.
The government had hoped that by the end of the lastparliament the package of measures enacted since 2010would have reduced the overall welfare budget in 2015by a net total of £19 billion, compared with what anunreformed system would have cost. According to onerecent calculation by the Institute for Fiscal Studies, thenet effect of the government’s welfare reform programmewas to meet £16.7 billion of this total by 2015-16.2
Explaining the ‘missing’ £2.3 billion of the £19 billiontarget for savings is one of our easier tasks. The firstexplanation lies in the government’s decision to affordprotection to all pensioners, whatever their means, whoas a group have been and will continue to increase as aproportion of the overall population. The office forNational Statistics forecasts a 31% increase in thenumber of pensioners between 2012 and 2037 – almost
99
BIG SUCCESSES
Fixing Britain Layout.qxp_Layout 1 11/12/2015 11:31 Page 99

three times the expected growth in the working-agepopulation (12%).3 Pensioners’ benefits are uprated byeither 2.5%, CPI inflation, or the annual increase inaverage earnings, in a formula known as the ‘triple lock’.
The Institute for Fiscal Studies notes that theconsequences of this protection afforded in the lastparliament by the government resulted in a real termsincrease in the annual pensioners’ welfare bill of 1.2%,while annual real-terms expenditure on working-agewelfare fell by 1.4% each year. Annual spending onpensioner benefits increased by a real-terms average of£300 per pensioner, regardless of their means.4 Here wecan see how the government’s protection policyreinforced a trend apparent under Labour which hasresulted in pensioners’ incomes moving from being 20%behind the rest of the population in 1992, and 5% behindin 2008, to a position where the typical pensioner is nowbetter off than the typical non-pensioner.5
A second part of the answer is that some of the savingspromised in the early days of the Coalition have yet tomaterialise. Time-limiting contributory Employmentand Support Allowance, for example, is only saving halfof what the government claimed for it. The June 2010Spending Review anticipated savings of £2 billion a yearby 2014-15, yet this later was revised downwards to £1billion.6 The House of Commons Library estimates thatthe government spent over £10 billion more on HousingBenefit over the last parliament than it was forecastingin November 2010.7 The government overspent likewiseon incapacity benefits by £8.5 billion and on disabilitybenefits by £1.7 billion. Such overspends necessitatedother measures taken throughout the last parliament –on the indexation of working-age benefits, for example– to rein in expenditure.
FIxING BRoKEN BRITAIN?
100
Fixing Britain Layout.qxp_Layout 1 11/12/2015 11:31 Page 100

A third part of our explanation for the non-delivery ofexpected benefit savings lies in the upward pressureapplied to the working-age welfare budget by the highrents and low wages that have characterised thehousing and labour markets since 2010.
There is a fourth reason why the cuts in the welfarebill have not been achieved as was estimated, and herelies a problem that is going to feature much moreprominently in the 2015 parliament. We are referring tothe government’s failure to implement its two flagshipreforms to the structure of working-age benefits –Universal Credit and Personal Independence Payment.
The reformers’ vision for welfare had relied in a notinsignificant way on the rolling out of Universal Creditand for this to be the great agent incentivising work. Yetit has been beset by delays and, as we record elsewherein this audit, might not even be fully rolled out a decadeafter it was first announced. Universal Credit wasmeant to have been saving money in the working-agewelfare budget – a cool £500 million each and everyyear once fully rolled out. Yet there is currently noUniversal Credit, and so savings are having to be foundfrom elsewhere in the budget.
Likewise the new disability benefit, PersonalIndependence Payment, has taken much longer to rollout than previously intended, turning a proposedsaving of £1.2 billion into an overspend of £1.7 billion.While the government’s original savings projection tookinto account the more generous payments that wouldbe made available under Personal IndependencePayment to those claimants in greatest need, it had alsoforecast in the 2012 Budget that there would be 3.2million disability benefit claimants, including 751,000on Personal Independence Payment, by 2015-16. Yet the
101
BIG SUCCESSES
Fixing Britain Layout.qxp_Layout 1 11/12/2015 11:31 Page 101
government was forced to concede defeat on this frontwhen the data published alongside the 2015 Budgetshowed that there would be 3.5 million people claimingdisability benefits in 2015-16 – and only 527,000 onPersonal Independence Payment – a total of 300,000wide of the mark.
The government’s failure to implement these twomajor structural reforms necessitated the savings madeelsewhere, as we have seen, both to benefit levels andthe numbers of people eligible to claim. The office forBudget Responsibility has found that the largestcontributors to the overall fall in welfare expenditure asa proportion of GDP, from 12.8% in 2009-10 to 11.8% in2014-15, were the reductions in tax credits and IncomeSupport, with fewer people being eligible.8 There werefalls too both in the relative value of these benefits andthe number of people claiming out-of-work benefits,while an increase in the number of people receivingHousing Benefit offset a fall in the value of awards.9
The government has shown itself able, therefore, tocontrol the working-age welfare budget. But its chosenmeans of doing so were not explicitly set out in its 2010programme, nor might they have been quite sonecessary had the promised savings been delivered bythe rollout of Universal Credit or Personal IndependencePayment. In some cases, the policy of compensating forfailure elsewhere in the reform programme has come ata great social cost to those claiming the existing range ofin- and out-of-work benefits.
ii. Rebuilding families
There is evidence aplenty of the CSJ’s influence on thegovernment’s attempts to repair ‘broken Britain’ in a
FIxING BRoKEN BRITAIN?
102
Fixing Britain Layout.qxp_Layout 1 11/12/2015 11:31 Page 102

brief examination of its family policy. Its analysis madeclear that no government could ever dream of repairing‘broken Britain’ without the help of a fully-fledgedUniversal Credit and, equally important, repairing thenation’s fractured families. Its 2010 programme madeclear the government’s belief that ‘strong and stablefamilies of all kinds are the bedrock of a strong andstable society’.10
This was to be achieved by keeping couples together,so that as many children as possible would live withboth their birth parents.
An important first move by the government to achievethis crucial objective was to bring all aspects ofrelationship support into the responsibility of onegovernment department – Iain Duncan Smith’sDepartment for Work and Pensions.
Its 2014 document set out some of the early progress made in achieving ‘social justice’ through itsfamily policy:11
• 250,000 more children are living with both their birthparents.
• The proportion of poor children living with bothparents increased from 45% in 2010-11 to 48% in2011-12.
• Marriage and civil partnerships are to be recognisedin the tax system through transferable taxallowances.
• £30 million has been invested to deliver marriagepreparation, couple counselling and relationshipeducation.
Important steps and all in the right direction. Weapplaud the government for recognising, acting upon,and actively promoting this area of policy as a means of
103
BIG SUCCESSES
Fixing Britain Layout.qxp_Layout 1 11/12/2015 11:31 Page 103

nurturing the nation’s character through safeguardingthe position of children in this way.
Yet more steps might well have been taken hadUniversal Credit not failed so miserably to deliver onits promise. Whereas Working Tax Credit gives exactlythe same level of support to a couple as to a lone parentin otherwise identical circumstances, Universal Creditis designed so that the ‘standard allowance’ for a coupleis worth more than that for a single person withchildren. In addition, the ‘work allowance’ – the amounta family can earn before their Universal Credit beginsto be withdrawn – is higher for couples than for loneparents. The number of families in 2015 feeling thebenefits of this policy remains miniscule.
one step back came in the government’s withdrawalof Child Benefit for households in which one earner’sincome exceeds the higher rate tax threshold. Either loneparents could be put off moving in with a partner or, insome cases, couples might be incentivised to break up.
In the 2015 parliament we suggest the governmentgives much greater emphasis to stronger families andthe role it must play in welfare reform, and to report toparliament and the nation more fully on the details ofwhat will be, hopefully, its continual success.
The government can reflect on some clear signs ofprogress, but has the overall package been fair betweenlow-income groups and the rest of society, and betweenworking-age benefits – where the cuts have been made– and pensioners who have been afforded the securityof the triple lock? These two lines will becomeincreasingly important in the 2015 parliament.
FIxING BRoKEN BRITAIN?
104
Fixing Britain Layout.qxp_Layout 1 11/12/2015 11:31 Page 104

Conclusion
An overall auditIain Duncan Smith took into government an analysis of‘broken Britain’; the welfare state was seen to berelieving poverty only by entrenching it, and at an evergrowing cost to the taxpayer. The major solution wasseen to come from introducing Universal Credit. WithUniversal Credit, so went the analysis, work wouldalways represent the best route out of poverty,dependence on out-of-work benefit would fall, and thecost to the taxpayer of working-age welfare would bebrought under control.
Universal Credit was sold to the chancellor of theexchequer and cabinet colleagues as the game changingreform that would fix ‘broken Britain’. A second plankof Duncan Smith’s programme to cement work as thebest route out of poverty has centred on encouraginginto work those claimants deemed capable of working,but who previously had been unwilling or unable to getand keep a job. The government’s chosen means herehave been a single welfare-to-work programme for alllong-term benefit claimants and the attachment of strictconditions, enforced by the possible withdrawal ofbenefit, to the receipt of Jobseeker’s Allowance.
An important consideration too in the government’sattempts to repair ‘broken Britain’ is the objective of
105
Fixing Britain Layout.qxp_Layout 1 11/12/2015 11:31 Page 105

cutting overall welfare expenditure. Again, its chosenagents were Universal Credit and the welfare-to-workprogramme. other tools chosen for this task were thetransfer of Incapacity Benefit claimants who weredeemed capable of work to Jobseeker’s Allowance, andothers to a new Employment and Support Allowance,the migration of Disability Living Allowance claimantsto a new Personal Independence Payment, reformingeligibility for tax credits, Housing Benefit and supporttowards Council Tax, and cutting the real value ofbenefits paid to working-age claimants.
on this latter objective, the government has beensuccessful. It has cut in real terms the size of theworking-age welfare budget and, in doing so, it hasachieved an objective that had proved elusive even tothe Thatcher governments.
What has worked elsewhere amongst the raft ofchanges to the existing welfare state and the mainwelfare reform of Universal Credit? We judge thesuccess or otherwise of the government’s efforts byassessing their impact on benefit expenditure, thenumber of people dependent on benefit, and the living standards of those people claiming benefit. ourmain criteria of success has been the extent to whicheach welfare reform contributes to mending ‘brokenBritain’, by helping claimants into work, deliveringsavings to the taxpayer, and making those householdsstruggling to survive on a low income better off thanthey were previously.
The task the government set itself in 2010 of achievingall three of these objectives, which together comprise adysfunctional relationship, has proved not surprisinglydifficult to achieve.
FIxING BRoKEN BRITAIN?
106
Fixing Britain Layout.qxp_Layout 1 11/12/2015 11:31 Page 106

i. Has the government managed to ‘GetBritain Working’ again?
Welfare-to-workThe government has delivered a reduction inunemployment, proving amongst other things theappropriateness of paying by results those contractedto deliver its single welfare-to-work programme. TheWork Programme has been as successful as the previousLabour government’s programme in getting claimantsinto work – 432,000 claimants have found work underthe Work Programme – but at half the cost. Moreoverthe government’s system of paying contractors on thebasis of their results has made its welfare-to-workprogramme more successful in a second key area thanany of its predecessors. Based on the available data weconclude that those starting a job under the WorkProgramme are more likely than their counterparts onprevious programmes to remain in work for longerperiods of time once they have found a job.1 We judgethis as the most important success of the government’swelfare-to-work strategy.
The success of this strategy, however, has not beenevenly shared. The programme’s record for claimantswith disabilities is poor. Likewise for those aged over 50.
We believe the payment-by-results system thegovernment introduced now requires a significantrecalibration to give the most disadvantagedparticipants a fighting chance of getting and keeping ajob. As the government draws up its new Work andHealth Programme – the welfare-to-work policyannounced in the 2015 Autumn Statement that willcombine the Work Programme and Work Choice – webelieve each claimant’s strengths and difficulties must
CoNCLUSIoN
107
Fixing Britain Layout.qxp_Layout 1 11/12/2015 11:31 Page 107

FIxING BRoKEN BRITAIN?
108
be identified as near as possible to the start of a benefit claim, and that the payment-by-results systemshould be further weighted in favour of claimantsdeemed to be facing the steepest barriers in their searchfor work. Those claimants requiring the most intensivesupport should be referred as early as possible to theWork and Health Programme, and this early referralprocess should not be limited to claimants of anyparticular benefit.
We also recommend the government builds on theearly success of its voluntary welfare-to-workprogramme for claimants with disabilities, by graduallylifting the cap in 2016 on the numbers who can enrol onthe programme and extending the length of time forwhich claimants can participate.
Youth unemploymentThe government has delivered a reduction in youthunemployment, although things became much worsebefore they got better. Had it not so prematurelyscrapped the previous Labour government’s FutureJobs Fund, the reduction probably would have beeneven greater. The heavy lifting came in the second halfof the last parliament, and has continued into the earlypart of this one, when an improving economy begancreating enough jobs into which some of those youngpeople participating on the main welfare-to-workprogramme could be placed. The government’s YouthContract, designed by the then Liberal Democrat leaderin 2012 specifically to find work for those young peoplefacing the greatest difficulty in doing so, failedcompared with the Future Jobs Fund. Furtherdevelopment of the use of the monies put towards theYouth Contract is urgent.
Fixing Britain Layout.qxp_Layout 1 11/12/2015 11:31 Page 108

A ‘Future Jobs Fund Mark Two’ whose business is tocreate and guarantee jobs for the young unemployed,as did Labour’s Future Jobs Fund, could help thegovernment make further inroads into youthunemployment, and all but abolish long-term youthunemployment.
Similarly, the government should explore whethersuch a model of job creation might enhance theemployment prospects of claimants aged 50 and over.The idea again is that they would enrol on a paid workplacement before they risk becoming long-termunemployed. Crucially for this group of claimants,Jobcentre Plus should find out as early as possiblewhether they are equipped with the minimum set ofcomputer literacy skills that are so crucial when seekingand applying for jobs. Those whose skillsetsdemonstrate a shortfall should be offered immediatehelp within the job centre, with the objective of suchhelp being to improve these claimants’ confidence andabilities on this vital score. Voluntary bodies, mutualand social enterprises should be invited into each jobcentre to provide this support. Such moves could aidthe government in its quest to find further savings fromthe working-age welfare budget.
ConditionalityThe government has followed Labour in the rightdirection towards making the receipt of welfare moreconditional upon certain duties being met by claimants.Its sanctions policy since 2012 has almost certainlymade life in work that much easier than remaining onout-of-work benefit. But this conclusion comes withmore than a hint of qualification.
CoNCLUSIoN
109
Fixing Britain Layout.qxp_Layout 1 11/12/2015 11:31 Page 109

We believe that one of the conditions of drawingbenefit must be the duty to seek and prepare for work –conditionality is part of a contract which entails theright to draw benefit being dependent on satisfyingone’s duty. Yet this principle has now been so appliedto an ever greater number of working-age recipients,and with what appears to be such fervency to removetheir right to draw benefit, that injustices could well beoccurring on a scale unknown; unknown as thegovernment does not collect data, and as a consequencewe believe that genuine claimants could be at risk ofbeing exposed to destitution. While around one in fivesanctioned claimants appear to have found workfollowing the docking of their benefit money, thegovernment seems unable to account for the remainingfour out of five sanctioned claimants.
We recommend, therefore, four urgent reforms to theexisting system rather than its abolition. We welcomethe government’s decision to trial a ‘Yellow Card’warning system in place of an immediate financialsanction for those claimants deemed not to havefulfilled their duty of looking for work. Should theYellow Card fail to prevent injustices from occurring,the government might wish to supplement this policywith the option for Jobcentre Plus staff of issuing a non-financial sanction for a claimant’s first failure to meetthe terms of their Claimant Commitment.
As a further step, we recommend that the Departmentfor Work and Pensions trials a ‘grace period’ forvulnerable claimants of Jobseeker’s Allowance orEmployment and Support Allowance, during which therequirements placed upon them are eased at times oftransition or acute difficulty. It might wish to focus thispilot initially on homeless claimants.
FIxING BRoKEN BRITAIN?
110
Fixing Britain Layout.qxp_Layout 1 11/12/2015 11:31 Page 110

As importantly we propose that the government mustforthwith begin a survey so that they can answer thesimple but crucial question of what happens to the fourout of five claimants expelled from the rolls who appearnot to find work.
The government is either unwilling or unable toinform us how much expenditure is withdrawn bysanctioning claimants. It should therefore begin tocollect these data for obvious reasons.
ii. Has the government enshrined work asthe best route out of poverty?
The prevalence of povertyThe conditionality attached to the receipt of benefit mayhave made work an easier option, but real wage growthat the bottom end of the labour market has been themissing piece of the government’s welfare reformpuzzle. While work remains preferable to a life onbenefit, bringing with it a significant reduction in therisk of being poor, and the government’s efforts havereinforced this outcome, it does not provide completeprotection against poverty. The explanation for thegovernment’s failure to enshrine work as a failsafemeans of guarding against poverty is twofold. First,there have been significant increases both in the extentof low-paid work as well as the number of peoplemoving from low benefit income into low-paid jobs andbeing parked there; second, cuts have been imposedupon benefits and tax credits claimed by this samegroup of low-paid workers.
The wage sceneWe therefore recommend that the government uses itsnew National Living Wage to kick-start a national
CoNCLUSIoN
111
Fixing Britain Layout.qxp_Layout 1 11/12/2015 11:32 Page 111

productivity strategy, beginning in low-payingindustries, so that it is capable of beginning in thelonger run to boost real incomes across the board.
To make this a truly national strategy it should be builtupon a new high-speed rail line that links up the greatcities of the North, and then works its way down to London.
Low-paid workers should also be given help byJobcentre Plus to increase their hours and develop theirskills, either on the job or after their shift, on coursesthat in the longer run will boost their output. Thesemoves, we believe, would enhance their chances ofgaining higher-paid employment.
Likewise if the government were to signal toemployers that they could no longer draw exclusivelyupon an endless supply of eager workers from easternEurope, their minds might instead become focused onimproving their existing machinery and workingpractices to get the best out of their labour stock,thereby opening up space for wage increases.
iii. Has the government delivered‘Welfare That Works’?
Universal CreditWhat, then, of Iain Duncan Smith’s flagship reform tosimplify the benefit system, reduce long-termdependence on welfare and cement work as the bestroute out of poverty, which sails under the banner ofUniversal Credit?
It is in the fate of Universal Credit, and the changesthat have been made to the original ideas, that we seethe collapse of the government’s strategy to make work
FIxING BRoKEN BRITAIN?
112
Fixing Britain Layout.qxp_Layout 1 11/12/2015 11:32 Page 112
the best route out of poverty. This judgement is notbased simply upon the minute number of peopleclaiming Universal Credit – there were barely 75,000claimants by the 2015 general election when 1.7 millionwas the goal – and its minimal impact on welfareexpenditure. Because of Universal Credit’s higher taperrate for many claimants the strategy of fixing ‘brokenBritain’ by offering lower withdrawal rates than thecurrent system lies in ruins. Universal Credit fails toincentivise the work on which the ‘broken Britain’analysis was built. If creating an incentive to work is thegoal the present system for the vast majority ofclaimants meets that goal more effectively.
The existing roster of working-age benefits thegovernment inherited remains largely intact, and worse,the marginal tax rates, particularly for tax credits, havebeen increased. Indeed, the government’s reduction inthe structural budget deficit has been achieved in partby undermining the cornerstone of its welfare reformstrategy of making work pay. The transition from theoriginal design of Universal Credit to the version whichbegan to be rolled out at a glacial pace will reinforce stillfurther the higher marginal tax rates for claimants inlow-paid work.
Tax creditsThe government’s decision to protect all pensionerbenefits has been accompanied by its failure toimplement its flagship Universal Credit reform. Thebenefit savings that were to flow from Universal Creditremain at large. These two developments made it thatmuch more important for the government to implementcuts elsewhere in the working-age welfare budget, inorder to make progress on its deficit reduction targets.
CoNCLUSIoN
113
Fixing Britain Layout.qxp_Layout 1 11/12/2015 11:32 Page 113
A prime target for cuts has been the tax credit bill, whichat its peak represented a £30 billion wage subsidy tolow-paying employers.
The government has enacted a raft of reforms whosenet effect has been to restrict eligibility for tax credits,as well as their generosity. These reforms delivered notinsubstantial savings for the taxpayer and helped, tosome extent, reduce dependency. But in making the cutswithin the existing tax credit system the government,perhaps unintentionally, has hit low-paid workers’living standards. It is nigh on impossible within thecurrent system to limit the entitlements of higherearners without simultaneously clobbering the lowestpaid workers. A much more preferable alternativewould have been to raise real wages and thereby floatpeople off tax credits. At the very least, the governmentshould have ensured that any changes would affect onlynew claimants. By cutting existing claimants’entitlements the government has reneged on its side ofthe contract which guarantees an acceptable minimumto families who do the right thing and go to work.
Thankfully in November 2015 the chancellor called offwhat looked set to be an all-out blitzkrieg raid on thissame group of strivers. He performed a full U-turn onhis proposals to reduce the income of 3.2 million low-paid workers in receipt of tax credits by an average of£1,350 in April 2016. In the longer term, though, andgiven it is here to stay at least for the rest of thisparliament, the government must review the wholemachinery of the tax credit system. It must aim to be in a position whereby cuts can be made towards thetop of the income distribution – those earning, say, twice the level of the new National Living Wage –without necessarily impacting upon those at the very
FIxING BRoKEN BRITAIN?
114
Fixing Britain Layout.qxp_Layout 1 11/12/2015 11:32 Page 114

bottom. We set out one potential reform programme inthe postscript.
Housing BenefitBritain’s longstanding failure to build enough affordablehomes for ownership or rent, coupled with the lowwages paid by many of the jobs created since the greatrecession, has exerted continuous upward pressure onthe Housing Benefit bill. This trend has continued since2010. Despite again introducing a series of reforms torestrict entitlement to, and the generosity of HousingBenefit, the government has overspent on this budget.Aside from the Benefit Cap, none of these reforms seemto have incentivised claimants to seek work.
The longer-term solution to the Housing Benefit crisisis almost too obvious to state. In normal circumstancesit would be difficult to meet the existing demand forhomes; it becomes incredibly difficult to do so if thegovernment operates an open door immigration policywithin the European Union. our population growth isnow being driven almost exclusively by immigration.For a host of reasons, and not simply to meet thehousing demand, a future government must control ourborders. Now, and at that future date, the obviousanswer is relevant, that the only sustainable way toreduce the size of the Housing Benefit budget is toincrease the supply of housing by initiating a nationalhousebuilding programme. We propose that a series ofskills academies should be established to provide thenecessary numbers of bricklayers and otherconstruction workers to sustain such a programme, sothat more houses are built without the need to importskilled building workers from abroad, whilesimultaneously offering skills and jobs to some young
CoNCLUSIoN
115
Fixing Britain Layout.qxp_Layout 1 11/12/2015 11:32 Page 115
people stranded on the welfare rolls. These academiesshould be delivered by scaling up on a mega scale thework of private training providers who are currentlytraining bricklayers, plasterers, carpenters, roofers,electricians and plumbers in 10 weeks who then beginto work. Each group’s first year in work following their10-week course at a skills academy could be deemed an‘improvement year’, in which they are paid at least theNational Minimum Wage and are required to hone andperfect the skills they learned at the skills academy.Government-backed inspectors then would award legalcertification that brings with it the only genuineprospect of being awarded work in future.
Places with the private providers for the 10-weekstarter course should be bought on the basis of theirknown success. Similarly, as bricklayers are unlikelyever to call on the student loans fund, a special fundshould be established so that students from workingand poorer homes can take out loans to cover thetraining costs and their living allowance over this shortperiod of time, just as though they were universityundergraduates. Wage prospects rise quite quickly forworkers trained in this way. Part of this new contracttherefore should be the arrangement of repaying loansformed on the model of student finance within, say, twoyears. Repayment would open the possibility ofacquiring other apprenticeship skills at a later date. Inthis way a whole range of skills can be built up, withone course being the basis on which the next set of skillsis built.
Council TaxAlthough not classed as a ‘welfare saving’, thegovernment cut £471 million from Council Tax Benefit
FIxING BRoKEN BRITAIN?
116
Fixing Britain Layout.qxp_Layout 1 11/12/2015 11:32 Page 116
and passed to local authorities the responsibility fordelivering the benefit. This move alone sabotaged thechances of Universal Credit achieving its objectives,while also impacting upon the living standards ofworking-age claimants on low incomes. Many of themare having to pay large sums towards their Council Taxfor the first time, thanks, in part, to the government’sinsistence on exempting all pensioners from the cut.This exemption should become part of a wider publicconsultation on the justice of continuing a policy thatputs all the welfare savings onto working-age claimants.
iv. Has the government succeeded inreforming incapacity and disability benefits?
Incapacity BenefitThe government has spent a larger sum on incapacitybenefits than that for which it budgeted, as a result ofits failed attempts to reduce dependence on this front.The single test determining whether a claimant withdisabilities is capable of doing some sort of work proveddeeply frustrating, both for claimants and thegovernment. The accumulation of a large backlog ofIncapacity Benefit claimants awaiting this test has jarredthe government’s attempts to find savings in the welfarebudget, with the outcomes of the test often disputed byclaimants; their grievances centred on the inability of aone-off examination to gauge or consider fully thelimiting effects of their health condition. The appealssystem found increasingly in the claimant’s favour. Thegovernment went into the 2015 election having missedby a large margin its targets for reducing expenditureon, and the numbers claiming either Incapacity Benefitor Employment and Support Allowance.
CoNCLUSIoN
117
Fixing Britain Layout.qxp_Layout 1 11/12/2015 11:32 Page 117

We therefore propose a reform of the single WorkCapability Assessment test, so that it becomes a processof learning about each claimant’s strengths as againstthose factors which have limited their efforts to work.An essential part of this process will necessarily involvethe integration of health and employment services. Theoutcome of this would be an ‘improving your life’contract which sets out the opportunities that could beopened to claimants, as well as the duties, buttressed bya set of rights and support, that are bestowed uponclaimants to support them while they search for somekind of work, ideally linked to a budget to gain the helpthey need.
For those claimants found capable of some sort ofwork, however, and who now find themselves onJobseeker’s Allowance, or in the Work Related ActivityGroup of Employment and Support Allowance, reformsare needed to support them more effectively in theirtransition into work where this is possible. This willneed to tie in, of course, with the ‘Welfare Reform MarkTwo’ that we have outlined. But the welfare contractitself between claimants and the government of the dayrequires reform so as to ensure claimants’ newfoundduties in looking for work are properly buttressed withthe individual support to find a job. The kind of supportthat would be most effective should come fromundertaking a series of pilots that claimants could help shape.
Personal Independence PaymentWhile the government has built on Labour’s reforms inthe arenas of welfare-to-work, conditionality andIncapacity Benefit, it has trodden new ground in thesubstitution of Personal Independence Payment for
FIxING BRoKEN BRITAIN?
118
Fixing Britain Layout.qxp_Layout 1 11/12/2015 11:32 Page 118

Disability Living Allowance. This new ground hasproven incredibly difficult to negotiate. All of thegovernment’s targets for Personal IndependencePayment – for claimants to receive greater support, andon savings and numbers claiming – have been missed,while those applying to claim the benefit were often leftwaiting for months and months and months beforefinding out whether their claim was successful.
v. In what areas has the government beenmost successful?
The government has delivered a drastic reduction inunemployment and worklessness. It has also reinforcedthe gap between what one could expect to earn in workand receive on benefit. Moreover, where thegovernment has failed to find the savings it hadexpected from key reforms to incapacity and disabilitybenefits, for example, it gained success many times overwith its policy of making life on benefit that much moredifficult. The decision to uprate working-age benefits inline with CPI, and then to impose a 1% cap on theuprating of benefit amounts each year, widened overallthe gap between what one could expect to earn in workand receive on benefit. This measure yielded ginormoussavings but, in doing so, compounded the differentialimpact of inflation experienced by the pooresthouseholds. Not surprisingly, therefore, this policy wasforecast to have made 200,000 more children poor.
vi. Lessons for welfare reformers
The government’s welfare reform programme forworking-age claimants has produced some real successbut also considerable failures. our hope is that the
CoNCLUSIoN
119
Fixing Britain Layout.qxp_Layout 1 11/12/2015 11:32 Page 119

government will look back to its five-year period incoalition as piloting a series of welfare proposals. Itshould now build on the most successful initiatives wehave highlighted quickly and confidently, while alsoseeking to fill those gaps we have identified in itsreform programme since 2010. It should in particularsee the potentially revolutionary impact of Georgeosborne’s National Living Wage strategy. Greatersuccess on the wage front will lessen considerably thesignificance of its failure on the Universal Credit front.Its most immediate revolutionary impact is to shiftwelfare reformers’ attention away from an exclusiveconcentration on the Department for Work andPensions and its programmes to compensate for the dis-welfare of capitalism, to the Department for Business,Innovation and Skills where the responsibility ofcapitalism to its workforce is being renegotiated. Theopening up here of a national productivity strategy,particularly for lower-paying industries, is crucial fortwo reasons. First, out-of-work benefit claimants, as wehave seen, are moved into low-paid employment, andtheir income needs to be increased in real terms nowthey are in work. Success on this score would thenbegin to crack the central economic question of thisparliament, namely the productivity conundrum thathas engulfed large swathes of the British economy sincethe great recession. If the new government begins to useits campaign to raise low pay successfully by increasingproductivity it would have a strategy to rollout to therest of the economy. The economic benefits that wouldflow from this strategy, if shared fairly, would be reapedby everyone in society. Here then lies the third front inwelfare reform that the government should open withas much enthusiasm as it can muster.
FIxING BRoKEN BRITAIN?
120
Fixing Britain Layout.qxp_Layout 1 11/12/2015 11:32 Page 120

Postscript
The government with its National Living Wage isshaking free of the tram lines of the welfare provisionof the post-war period. Where might this lead thedebate on welfare reform in the next decade?
A key part of the reform agenda will necessarilyinvolve building on the moves taken in the 2010parliament to strengthen families. Just as the past fiveyears saw progress, albeit tempered, on this front, theConservatives since the 2015 general election have takenan early step forward before falling off balance. Theypledged to enable one member in a married couple orcivil partnership to transfer £1,060 of their tax-freeincome to their partner, where the highest earner is abasic rate taxpayer. A welcome move in itself.
Reformers will need to keep a close eye, though, onanother development that is likely to impact upon largenumbers of families lower down the income distribution.The two child limit for tax credits might well represent abrand new couple penalty that incentivises large familiesto split, or lie to the authorities, in order to continuereceiving their full entitlement.
And what of the distribution of income between thoseabove and below retirement age? The Conservativesstood in 2015 on the platform of maintaining theprotection it had afforded in coalition with the LiberalDemocrats to pensioners, but noticeably this was notmatched by safeguards against iniquities among the
121
Fixing Britain Layout.qxp_Layout 1 11/12/2015 11:32 Page 121
working-age population. A key bone of contention inthe run-up to the general election, in fact, was theTories’ failure to outline exactly which groups of theworking-age population would bear the greatest bruntof the £12 billion of cuts coming their way between nowand 2020.
The chancellor in his 2015 Summer Budget – the firstto be delivered by a majority Conservative governmentsince 1996 – revealed with gusto exactly where his axewas to fall. over a third of the chancellor’s cuts – £4.35billion – were to fall on Britain’s 3.2 million lowest paidworkers. Voters instinctively ally themselves with thisgroup of strivers, and their loss, on average of £1,350 inApril 2016, looked set to send shockwaves through theelectorate. Having let down this same group of striversby failing to deliver on the promises of Universal Credit,the government had stumbled into a blitzkrieg raid ontheir living standards.
Following an intense cross-party campaign in bothHouses of Parliament against this raid, Britain’s striversemerged as the winners from the 2015 AutumnStatement. The chancellor, having declared himself tobe in ‘listening mode’ once the scale of oppositionbecame painfully obvious, performed a full U-turn onthese proposed cuts. It was a question of justice thatthey should win such a concession, although thechancellor has a job on his hands to find the £4.35 billionsavings from elsewhere.
Justice also calls for a major survey of what happensto the hundreds of thousands of people thrown off thewelfare rolls each year through the sanctioning process.It is unacceptable, not only for this government but forits predecessor and those who will follow, to take awaybenefit from a mass of people each year and not trouble
FIxING BRoKEN BRITAIN?
122
Fixing Britain Layout.qxp_Layout 1 11/12/2015 11:32 Page 122
themselves with how this army of people survive. Forthat is what is happening under the government’ssanctions policy. The ability to track the wellbeing of thewhole population is now a part of being a grown upgovernment, let alone a ‘one Nation’ government.
For those claimants moving into work, we cannotunderestimate the importance of the new NationalLiving Wage – the centrepiece of the 2015 SummerBudget. 1.9 million people who currently earn less than£7.20 an hour will receive a direct pay rise in April 2016.This initiative has the potential to revolutionise not onlythe welfare reform debate, but also the wider economicquestion of productivity in British industry.
We therefore wish to close this audit by posing achallenge to the government. Welfare Reform Mark onehas largely succeeded in moving into work substantialnumbers of people previously drawing out-of-workbenefit. Welfare Reform Mark Two must widen thisroute where possible to the least advantaged claimants,namely those with disabilities and those aged over 50.
In order to enshrine work as the best route out ofpoverty, Welfare Reform Mark Three must build uponthe National Living Wage to deliver the higherproductivity that can sustain rising real incomes acrossthe board.
Universal Credit alone will not fulfil this task and,judging by the government’s constant chipping away atits generosity for lower-paid workers, strivers withchildren who claim Universal Credit will be worse offnext year by up to £2,629.
The prospect of Universal Credit being rolled out infull by the end of this parliament looks increasinglydoubtful, and its potential to fix ‘broken Britain’ hasbeen diminished beyond recognition. We can safely
PoSTSCRIPT
123
Fixing Britain Layout.qxp_Layout 1 11/12/2015 11:32 Page 123
assume from the snail’s pace rollout of Universal Creditthat tax credits are here to stay at least until 2020.
We therefore hope the chancellor’s ‘listening mode’ ontax credits will continue into 2016, for the whole debatethat has arisen on the role of in-work benefits in hismuch vaunted ‘lower tax, lower welfare, higher wagesociety’ has afforded him an opportunity to become aserious welfare reformer. A thorough review of in-workbenefits, which looks beyond Universal Credit andtakes as its starting point the full protection of lower-paid workers with children, is required.
As a key plank of Welfare Reform Mark Three thechancellor could pause for a year and come up withproposals that, by 2020, will transform the tax creditsystem as we know it. In doing so he would be sendinga clear signal to employers that tax credits will no longerbe a means through which low wages are subsidised.
The introduction of the National Living Wage nowsets the scene for all welfare reform that will followunder this government. We have set out elsewhere someof the initial steps it might wish to take to boostproductivity, and here we outline five tax credit reformproposals that take as the cornerstone a National LivingWage which will reach £9 an hour – £16,000 a year basedon a working week of 35 hours – by 2020.
It is tempting to set out reform proposals that assumewe are in sight of sunnier uplands after dealing with thestructural deficit in the nation’s budget. We make a pleanot to be beguiled by such a prospect. our starting pointis that the proposed tax credit reforms are within thegovernment’s iron envelope of moving Britain to a ‘lowertax, lower welfare, higher wage society’. Politicalearthquakes will be required to shift them from that goal.
By 2020 we suggest as a first reform that childless
FIxING BRoKEN BRITAIN?
124
Fixing Britain Layout.qxp_Layout 1 11/12/2015 11:32 Page 124

couples and single workers without children would nolonger be eligible for support from the tax credit system.
A second reform would protect those workers who arevulnerable, with mental illnesses for example, and whocould not work a full week at present. They should beable to claim Jobseeker’s Allowance or Employmentand Support Allowance if they work up to 24 hours aweek – going beyond the 16 hours they are allowed towork under the current regime before their claim ceases– adding to that as much part-time work as they are ableto command.
The next reform we propose is centring the tax creditsystem on lower-paid workers with children. Wesuggest that entitlement should go to families earningup to twice the level of the National Living Wage. In2020 this would set a ceiling of £32,000. Beyond thatpoint eligibility to tax credits would cease.
The aim of these reforms is not to pull the floor fromunderneath low earners without children. It is insteadto ensure the labour market can provide them with adecent minimum income as well as the prospect of payprogression. A fourth and crucial reform thereforeshould be to revamp Jobcentre Plus, whose staff shouldhave the skills to help tax credit claimants think abouthow, over the next four years, they might increase thehours they work in their current job or increase theirhours of work and pay by moving to a new job.
To make this reform work, claimants must know theywon’t lose large chunks of any additional earnings tothe taxman. Hence a fifth reform during this four-yeartransition stage should be to allow tax credit claimantsto increase their earnings by up to £5,000 in any 18-month period without any clawback of tax creditentitlement. This move would allow some, maybe
PoSTSCRIPT
125
Fixing Britain Layout.qxp_Layout 1 11/12/2015 11:32 Page 125

many, claimants to increase their earnings before anylosses incurred from the tax credit cuts.
These five reforms would be much more effective inprotecting those in work on modest earnings thananything the government is proposing. They buildaround the revolutionary idea the chancellor hasintroduced into British politics, particularly welfarereform, namely of introducing a National Living Wage.This move begins the process of transferring theresponsibility for lower earners’ welfare to employersand the Department for Business, Innovation and Skills,and away from the Department for Work and Pensionsand Her Majesty’s Revenue and Customs. With aNational Living Wage the purpose of welfare incompensating for the ‘dis-welfare’ of the market canbecome a thing of the past.
Here then are the bones of a welfare-to-work strategyfor 2020 and beyond – guaranteeing the prospect of ajob for all and enshrining a job as the best route out ofpoverty, while also delivering savings to the taxpayerand beginning to address the productivity conundrumof the British economy.
Will Universal Credit ever be able to fix ‘brokenBritain’? Success in our three-pronged welfare-to-workstrategy would, for all intents and purposes, make thisquestion redundant. For ‘broken Britain’ would alreadyhave been largely fixed.
FIxING BRoKEN BRITAIN?
126
Fixing Britain Layout.qxp_Layout 1 11/12/2015 11:32 Page 126
Notes
Introduction
1 office for National Statistics, Working and Workless Households,2014- Statistical Bulletin (2014), p.2.
2 Working Tax Credit is a means-tested supplement designed to topup the wages of low-paid workers to an acceptable minimum.Child Tax Credit is a means-tested supplement designed to topup the incomes of families with children.
3 The National Living Wage is to be introduced in April 2016 at arate of £7.20 an hour, rising to £9.00 an hour by 2020. Thevoluntary Living Wage rate in 2015 stood at £9.50 an hour inLondon, and £7.85 an hour across the rest of the United Kingdom.
4 More than 2 million National Insurance numbers have beenissued to eastern European nationals following their accession toan enlarged Europe in 2004. The number of citizens from Poland,Hungary, the Czech Republic, Slovenia, Slovakia, Estonia,Lithuania and Latvia living in this country grew from anestimated 167,000 in 2004 to just over 1 million in 2012. Almostthree-quarters of a million eastern Europeans were working herein 2013.
5 The National Minimum Wage currently stands at £6.70 an hour.
1. ‘Broken Britain’: Relieving poverty by entrenching it
1 Centre for Social Justice, ‘Breakthrough Britain - DynamicBenefits: Towards welfare that works’ (London: Centre for SocialJustice, 2009), p. 14.
2 Ibid.
3 Universal Credit is a means-tested benefit which combinesJobseeker’s Allowance, Income Support, Employment andSupport Allowance, Housing Benefit, and tax credits into onesingle monthly payment.
4 Written by Frank Field while minister for welfare reform at theDepartment of Social Security, ‘New ambitions for our country: anew contract for welfare’ (1998).
127
Fixing Britain Layout.qxp_Layout 1 11/12/2015 11:32 Page 127

5 It is impossible within the current structure to fashion changeswhich protect the lowest earners while simultaneously takinghigher income groups out of Working Tax Credit.
6 Ten MPs, two peers and a special adviser were party tonegotiations: David Laws, Danny Alexander, Chris Huhne,Andrew Stunnell, Lord Mandelson, William Hague, oliverLetwin, George osborne, Ed Llewellyn, Lord Adonis, HarrietHarman, Ed Balls and Ed Miliband.
7 HM Government, ‘The Coalition: our programme forgovernment’ (London: Cabinet office, 2010), p. 23.
8 Accessed via http://www.politicsresources.net/area/uk/man/lab97.htm
2. Has the government managed to ‘Get BritainWorking’ again?
1 National Audit office, ‘The Work Programme’ (London: NationalAudit office, July 2014), p.24.
2 Centre for Economic and Social Inclusion, ‘DWP WorkProgramme: how is it performing?’ (March 2015), available at:http://cesi.org.uk/responses/dwp-work-programme-how-it-performing-4
3 Pathways To Work was mandatory only for new claimants ofIncapacity Benefit.
4 Department for Work and Pensions, ‘New Deal for DisabledPeople: Third synthesis report – key findings from the evaluation’(London: HM Stationery office, 2007), p.1.
5 Edward Beale, ‘Employment and Training Programmes for theUnemployed’ (London: House of Commons Library, 2005), p.71.
6 Department for Work and Pensions, ‘New Deal for DisabledPeople: Third synthesis report – key findings from the evaluation’(London: HM Stationery office, 2007), p.3.
7 Anne Corden and Katherine Nice, ‘Pathways to Work: Findingsfrom the final cohort in a qualitative longitudinal panel ofincapacity benefit recipients’ (London: Department for Work andPensions, 2006), p.7.
8 Ibid.
9 Department for Work and Pensions, ‘Work ProgrammeEvaluation: the participant experience report’ (December 2014),available at:http://www.york.ac.uk/inst/spru/pubs/pdf/rrep892.pdf, p.79.
10 Department for Work and Pensions, ‘Work Choice: officialStatistics – May 2015’, p.11.
FIxING BRoKEN BRITAIN?
128
Fixing Britain Layout.qxp_Layout 1 11/12/2015 11:32 Page 128

11 This cap was set at six months.
12 http://tabulation-tool.dwp.gov.uk/new_deals/nd50plus/live/n50_j_i/i_jobyear/e_jcreg/a_stock_r_i_jobyear_c_e_jcreg_aug11.html
13 Department for Work and Pensions, ‘Work ProgrammeEvaluation: operation of the commissioning model, finance andprogramme delivery – Research report 893’ (December 2014), pp.143-144.
14 National Audit office, (London: National Audit office, July 2014),p.23.
15 National Audit office, ‘The Work Programme’ (London: NationalAudit office, July 2014), p.51.
16 Written evidence from the Centre for Economic and SocialInclusion and NIACE (WTW0041), 7 September 2015, availablehere:http://data.parliament.uk/writtenevidence/committeeevidence.svc/evidencedocument/work-and-pensions-committee/welfare-to-work/written/20087.pdf
17 The Conservative Party, ‘Invitation to Join the Government ofGreat Britain: The Conservative Manifesto 2010’, p.15.
18 National Audit office, ‘The New Deal for Young People’ (London:HM Stationery office, January 2002).
19 Alistair Darling’s programme drew on the efforts to find workprior to World War one. This approach was swept away withLloyd George’s unemployment insurance scheme.
20 office for National Statistics, various editions of ‘Labour MarketStatistics’.
21 DWP, ‘Impacts and Costs and Benefits of the Future Jobs Fund’(2012).
22 House of Commons Committee of Public Accounts, ‘16- to 18-year-old participation in education and training’ (HM Stationeryoffice, January 2015): p.9.
23 There is no definite source of data with which to make directcomparisons.
3. Swinging the pendulum of conditionality: makingwork the easier option
1 Deacon, A.J. (2002) Perspectives on welfare: ideas, ideologies andpolicy debates. open University Press.
2 Deacon, A.J. (2002) Perspectives on welfare: ideas, ideologies andpolicy debates. open University Press.
129
NoTES
Fixing Britain Layout.qxp_Layout 1 11/12/2015 11:32 Page 129

3 Real global GDP grew at 5.5% in the decade to 1971, 3.7% in thedecade to 1981, 3.1% in the decade to 1991 and again to 2001, and3.9% in the decade to 2011, according to World Economics:http://www.worldeconomics.com/papers/Global%20Growth%20Monitor_7c66ffca-ff86-4e4c-979d-7c5d7a22ef21.paper
4 For a summary of the conditionality debate in the post-warperiod see Beyond Punishment by Frank Field and Matthewowen, Institute of Community Studies, 1994.
5 See, for example, Church Action on Poverty, the Baptist Union ofGreat Britain, the United Reformed Church, the MethodistChurch, the Church of Scotland, and the Church of Wales, ‘Timeto rethink benefit sanctions’, available here:http://www.methodist.org.uk/news-and-events/news-releases/new-data-more-than-100-people-per-day-with-mental-health-problems-are-having-their-benefits-sanctioned
6 See, for example, Andrew Forsey, ‘An Evidence Review for theAll-Party Parliamentary Inquiry into Hunger in the UnitedKingdom’ (London: The Children’s Society, 2014): p.61.
7 Ibid.
8 Detailed statistics on the number of individuals sanctionedbetween october 2012 and March 2015 are available on theDepartment for Work and Pensions’ Stat-xplore website.
9 https://sw.stat-xplore.dwp.gov.uk/webapi/jsf/tableView/tableView.xhtml#
10 https://www.gov.uk/government/statistics/jobseekers-allowance-and-employment-and-support-allowance-sanctions-decisions-made-to-march-2015
11 House of Commons Work and Pensions Committee, ‘oralevidence: Benefit sanctions policy beyond the oakley Review’,HC 814, (2015): http://data.parliament.uk/writtenevidence/committeeevidence.svc/evidencedocument/work-and-pensions-committee/benefit-sanctions-policy-beyond-the-oakley-review/oral/17970.pdf
12 Paul Gregg, ‘Realising Potential: A Vision for PersonalisedConditionality and Support’, DWP (2008)
13 Andrew Forsey, ‘An Evidence Review for the All-PartyParliamentary Inquiry into Hunger in the United Kingdom’(London: The Children’s Society, 2014): p.59.
14 Rachel Loopstra et al, ‘Do punitive approaches to unemploymentbenefit recipients increase welfare exit and employment? A cross-area analysis of UK sanctioning reforms’, University of oxford,Sociology Work Paper 2015-1 (January 2015).
FIxING BRoKEN BRITAIN?
130
Fixing Britain Layout.qxp_Layout 1 11/12/2015 11:32 Page 130

15 Centre for Social Justice, ‘Up to the job? How reforming JobcentrePlus will help tackle worklessness’ (London: Centre for SocialJustice, 2013) p.4.
16 Dr Alex Nunn and Dr Dave Devins, ‘Process evaluation of theJobcentre Plus Performance Management Framework’ (London:Department for Work and Pensions, 2012), p.21.
17 Ibid, p.30.
18 Ibid, p.30.
19 An analysis conducted by the House of Commons Library of theLabour Force Survey shows that at least 5.6 million worklessindividuals of working age out of a total of 10.9 million claimbenefit. Nobody knows the circumstances of the remaining 5.3million fellow citizens. Many may be fine and living on an incomeindependent of work or welfare. But what of the rest?
20 House of Commons Library calculations.
4. Raising the bar to making work pay
1 Reformers present at Speenhamland’s Pelican Inn just before theturn of the 19th century developed a system of ratepayer-fundedsubsidies with which local authorities could supplement lowwages. This system was soon to become the only welfare reformshow in town, in respect of providing workers with a moreacceptable minimum than their wages would afford them andtheir families.
2 Andrew Hood and David Phillips, ‘Benefit Spending andReforms: The Coalition Government’s Record’ (Institute for FiscalStudies, January 2015).
3 Benefit caseload and expenditure tables published alongsideBudget 2015, available at:https://www.gov.uk/government/statistics/benefit-expenditure-and-caseload-tables-2015
4 office for Budget Responsibility, ‘Welfare trends report’ (oBR,october 2014): p.5.
5 House of Commons Library analysis of the office for NationalStatistics’ ‘Family Spending’ surveys. Net rent refers to rent thatis net of Housing Benefit.
6 office for Budget Responsibility,‘Welfare trends report october2014’, p.43.
7 This includes Universal Credit claimants as well as thosehouseholds claiming existing legacy benefits. The data is availableat: https://www.gov.uk/government/uploads/system/uploads/attachment_data/file/426846/benefit-cap-statistics-to-feb-2015.pdf
131
NoTES
Fixing Britain Layout.qxp_Layout 1 11/12/2015 11:32 Page 131

8 The Troubled Families programme was set up by the Coalition to‘turn around’ the lives of 120,000 families in England who areworkless and deemed most likely to succumb to truancy andantisocial behaviour.
9 ‘Impact Assessment – Housing Benefit: Changes to the LocalHousing Allowance Arrangements’ (November 2010).
10 Department for Work and Pensions, ‘The impact of recent reformsto Local Housing Allowances: Summary of key findings’(London: DWP, July 2014).
11 Department for Work and Pensions, ‘The impact of recent reformsto Local Housing Allowances: Summary of key findings’(London: DWP, July 2014).
12 Department for Work and Pensions, ‘Impact Assessment-Housing Benefit: Under occupation of social housing’ (June 2012):https://www.gov.uk/government/uploads/system/uploads/attachment_data/file/214329/social-sector-housing-under-occupation-wr2011-ia.pdf
13 http://www.newstatesman.com/politics/2014/03/esther-mcvey-flounders-bedroom-tax-failure-becomes-clear
14 Department for Work and Pensions, ‘Evaluation of Removal ofthe Spare Room Subsidy, Interim Report’ (London: DWP, July2014).
15 Ipsos MoRI, ‘one year on: The impact of welfare reforms onhousing association tenants’ (May 2014), available athttps://www.ipsos-mori.com/Assets/Docs/Publications/NHF-Phase2_Tenant-Survey-Report_19.05.14.pdf
16 Ibid.
17 The Institute for Fiscal Studies estimates that rents fell by only10% of these cuts: http://www.ifs.org.uk/uploads/publications/conferences/presentations/PRES0515RJ050315.pdf
18 Local Government Association, ‘Skills to build: Creating thehouses and jobs our communities need’ (August 2015).
19 Sam Ashton, Marc Francis and Megan Jarvie, ‘Too poor to pay:the impact of the second year of localised Council Tax support inLondon’ (London: Child Poverty Action Group and Zacchareus2000, 2015).
20 StepChange Debt Charity, ‘Council tax debts: How to deal withthe growing arrears crisis tipping families into problem debt’(2015), available at: https://www.stepchange.org/Portals/0/documents/media/reports/Council-tax-debt-report-2015.pdf
21 Department for Communities and Local Government, ‘LocalGovernment Finance Bill: Localising support for council tax’(June 2012), available at: https://www.gov.uk/government/
FIxING BRoKEN BRITAIN?
132
Fixing Britain Layout.qxp_Layout 1 11/12/2015 11:32 Page 132

uploads/system/uploads/attachment_data/file/8465/2158675.pdf
5. Work as the best route out of poverty?
1 Lorna Adams et al, ‘Destinations of Jobseeker’s Allowance,Income Support and Employment and Support AllowanceLeavers 2011’ (London: Department for Work and Pensions,2012).
2 Mike Brewer, David Phillips, and Luke Sibieta, ‘Living Standards,Inequality and Poverty: Labour’s Record’ (London: Institute forFiscal Studies, 2010): p.22.
3 Measured in relative terms After Housing Costs, in Table 5a,Estimated percentage of working-age adults in relative/absolutelow income , United Kingdom, ‘Households below averageincome: 1994/1995 to 2013/2014’.
4 James Browne and William Elming, ‘The effect of the coalition’stax and benefit changes on household incomes and workincentives’ (London: Institute for Fiscal Studies, 2015): p.18.
5 office for National Statistics, ‘Working and Workless Households,2014 – Statistical Bulletin’, available at http://www.ons.gov.uk/ons/dcp171778_382704.pdf
6 Measured After Housing Costs in ‘Households Below AverageIncome 1994-95 to 2013-14’, Table 5.7db.
7 Stuart Adam and James Browne, ‘Do the UK Government’swelfare reforms make work pay?’ (London: Institute for FiscalStudies, 2013), p.1.
8 Measured After Housing Costs in ‘Households Below AverageIncome 1994-95 to 2009-10’, Table 5.4db, and in ‘HouseholdsBelow Average Income 1994-95 to 2013-14’, Table 5.4db.
9 James Browne and William Elming, ‘The effects of the coalition’stax and benefit changes on household incomes and workincentives’ (London: Institute for Fiscal Studies, 2015): p.19.1
10 Ibid, p.25.
11 ‘Under-employment won’t return to pre-crisis levels until 2023,says TUC’, January 2015, https://www.tuc.org.uk/economic-issues/labour-market/britain-needs-pay-rise/under-employment-won%E2%80%99t-return-pre-crisis-levels
12 Alex Hurrell, Starting out or getting stuck? An analysis of who getstrapped in low paid work – and who escapes (November 2013),available at: http://www.resolutionfoundation.org/wp-content/uploads/2014/08/Starting-out-or-getting-stuck-FINAL.pdf
133
NoTES
Fixing Britain Layout.qxp_Layout 1 11/12/2015 11:32 Page 133

13 http://www.ft.com/cms/s/0/7a70828e-b36b-11e3-bc21-00144feabdc0.html#axzz3QyW3vaFT
14 office for National Statistics, ‘Self-employed workers in the UK– 2014’, p.7: http://www.ons.gov.uk/ons/dcp171776_374941.pdf
15 office for Budget Responsibility, ‘Welfare trends report’ (oBR,october 2014): p.40.
6. Universal Credit: ‘Welfare That Works’?
1 This rate, which to most claimants feels like an effective tax rate,is applied to post-tax earnings and comprises the loss of out-of-work benefits.
2 https://www.gov.uk/government/uploads/system/uploads/attachment_data/file/220177/universal-credit-wr2011-ia.pdf
3 Mike Brewer, James Brown, and Wenchao Jin, ‘Universal Credit:A preliminary analysis’ (London: Institute for Fiscal Studies,2011).
4 David Finch, Making the most of UC: Final report of the ResolutionFoundation review of Universal Credit (June 2015), available at:http://www.resolutionfoundation.org/wp-content/uploads/2015/06/UC-FINAL-REPoRT1.pdf
5 Brent, Doncaster, Harrow, North Kesteven, and Trafford haveeach set a Council Tax support withdrawal rate of 30%.Brentwood, Mid Sussex and Wiltshire have each set a rate of 15%.
6 Department for Work and Pensions, ‘Universal Credit: welfarethat works’ (Department for Work and Pensions, November2010), p.37.
7 office for Budget Responsibility, ‘Welfare trends report’ (London:HM Stationery office, June 2015) .
8 office for Budget Responsibility, ‘Welfare trends report’ (London:HM Stationery office, october 2014).
9 http://www.independent.co.uk/news/uk/politics/exclusive-we-know-tax-credits-were-overpaid-now-its-revealed-the-figure-is-56bn-9701865.html
10 Paul Treloar, ‘Is Universal Credit working’ in Child Poverty ActionGroup Welfare Rights Bulletin 243 (December 2014).
11 See, for example, Department for Work and Pensions, ‘UniversalCredit: welfare that works’ (November 2010).
12 David Finch, Adam Corlett, and Vidhya Alakeson, ‘UniversalCredit: A policy under review’ (London: Resolution Foundation,August 2014).
FIxING BRoKEN BRITAIN?
134
Fixing Britain Layout.qxp_Layout 1 11/12/2015 11:32 Page 134

7. Dividing the sheep and the goats?
1 The phrase one doctor used to describe his actions when chargedwith killing his elderly patients, in Patrick Devlin, Easing thepassing: The Trial of Doctor John Bodkin Adams (The Bodley Head,1985).
2 Explanatory Memorandum to the Employment and SupportAllowance (Transitional Provisions, Housing Benefit and CouncilTax Benefit) (Existing Awards) Regulations 2010:http://www.legislation.gov.uk/uksi/2010/875/pdfs/uksiem_20100875_en.pdf
3 office for Budget Responsibility, ‘Welfare trends report – June2015’ (London: HM Stationery office, 2015).
4 BBC News, ‘Hundreds of thousands hit by benefits backlog’,http://www.bbc.co.uk/news/uk-27796739
5 https://www.gov.uk/government/uploads/system/uploads/attachment_data/file/434838/pip-stats-apr-2013-apr-2015.pdf
6 http://cdn.budgetresponsibility.independent.gov.uk/49754-oBR-Welfare-Accessible-v0.2.pdf
7 office for Budget Responsibility, ‘Welfare trends report – october2014’, p.113.
8 https://www.gov.uk/government/uploads/system/uploads/attachment_data/file/220176/dla-reform-wr2011-ia.pdf
9 https://www.gov.uk/government/statistics/benefit-expenditure-and-caseload-tables-2015
8. Big successes
1 Andrew Hood and David Phillips, ‘Benefit Spending andReforms: The Coalition Government’s Record’ (London: Institutefor Fiscal Studies, January 2015).
2 Andrew Hood and David Phillips, ‘Benefit Spending andReforms: The Coalition Government’s Record’ (London: Institutefor Fiscal Studies, 2015)
3 office for National Statistics, ‘National Population Projections,2012-based Statistical Bulletin’ (November 2013), p.5.
4 Andrew Hood and David Phillips, ‘Benefit Spending andReforms: The Coalition Government’s Record’ (London: Institutefor Fiscal Studies, 2015), p.6.
5 http://www.telegraph.co.uk/finance/personalfinance/pensions/11430359/Pensioners-are-now-richer-than-the-rest-and-we-should-celebrate-that.html
135
NoTES
Fixing Britain Layout.qxp_Layout 1 11/12/2015 11:32 Page 135

FIxING BRoKEN BRITAIN?
136
6 The Secretary of State for Work and Pensions in May 2014 statedin correspondence to Frank Field that ‘not introducing time-limiting would cost around £1bn in 14/15’.
7 The Library examined benefit expenditure as forecast at the 2010Autumn Statement, compared with how it stood at the 2015Budget.
8 office for Budget Responsibility, ‘Welfare Trends Report –october 2014’.
9 Ruth Lupton et al, ‘The Coalition’s Social Policy Record: Policy,Spending and outcomes 2010-2015’, p.23.
10 HM Government, ‘The Coalition: our programme forgovernment’ (London: Cabinet office, 2010), p.19.
11 HM Government, ‘Social justice: transforming lives – progressreport’ (London, Department for Work and Pensions, November2014).
Conclusion: An overall audit
1 To be fair the Labour government did not attempt to measure thenumbers in work for longer than three months.
Fixing Britain Layout.qxp_Layout 1 11/12/2015 11:32 Page 136

Frank Field and Andrew Forsey
CIVITAS£8.00
CIVITAS Institute for the Study of Civil Society
55 Tufton Street, London, SW1P 3QL Tel: 020 7799 6677
Email: [email protected] Web: www.civitas.org.uk
ISBN 978-1-906837-76-1 Cover design: lukejefford.com
The thorny issue of benefit dependency has bedevilled the welfare state
since the 1970s, and has increased in importance with each successive
decade. Welfare-to-work strategies since 1997 have begun to make
inroads into the problem of long-term out-of-work claimants, which once seemed
intractable. But, as Frank Field and Andrew Forsey highlight in this forensic
examination of the welfare landscape, challenges remain.
First, the success story needs to be extended to certain groups – such as the
disabled and the over-50s – who too often continue to be excluded from the jobs
market. Second, much more needs to be done to ensure that those who are in
work are able to progress up the pay ladder and out of poverty: too many people
are in jobs which are so low paid that their incomes are only brought up to acceptable
levels by the wage subsidy better known as tax credits. Effectively, the bill to tax-
payers has been switched from out-of-work benefits to in-work benefits.
Tackling this will require an increase in productivity without an increase in
unemployment. Only by raising output per worker – and ensuring that the rewards
are fairly shared – can real living standards rise over time. This productivity challenge
moves the welfare reform agenda into new territory, requiring engagement
from beyond the Department for Work and Pensions as it links up with wider
economic and political considerations.
Field and Forsey argue that by building on the foundations of the new National
Living Wage, raising productivity and boosting the wages of the lower paid, the
government can reduce benefits dependency still further and make significant
additional savings from the tax credit bill.
Fran
k Field
and
A
nd
rew F
orsey
CIV
ITA
SF
ixin
g B
roke
n B
ritain
?
Fixing Broken Britain?An audit of working-age welfare reform since 2010