tel india 13 feb 2009 - telenor group – telenor group … in any company within the telenor group....
TRANSCRIPT

1
1
Telenor entering India
Jon Fredrik Baksaas – President and CEO of Telenor Group
Sigve Brekke - EVP and Head of Telenor Asia
13 February 2009
2
Disclaimer
The following presentation is being made only to, and is only directed at, persons to whom such presentation may lawfully be communicated (“relevant persons”).
Any person who is not a relevant person should not act or rely on this presentation or any
of its contents. Information in the following presentation relating to the price at which relevant investments have been bought or sold in the past or the yield on such investments
cannot be relied upon as a guide to the future performance of such investments.
This presentation does not constitute an offering of securities or otherwise constitute an
invitation or inducement to any person to underwrite, subscribe for or otherwise acquire securities in any company within the Telenor Group.
The release, publication or distribution of this presentation in certain jurisdictions may be
restricted by law, and therefore persons in such jurisdictions into which this presentation is released, published or distributed should inform themselves about, and observe, such
restrictions.
The following presentation contains statements regarding the future in connection with Telenor's growth initiatives, profit figures, outlook, strategies and objectives. All statements
regarding the future are subject to inherent risks and uncertainties, and many factors can lead to actual profits and developments deviating substantially from what has been
expressed or implied in such statements.
2
3
Agenda
• Transaction Update
• Investment case
• Financing considerations
4
Telenor entering India
• Attractive growth opportunity
• Contribution to long term industrial development
• Strong fit with communicated strategy
• Re-use of proven concepts

3
5
Telenor taking a 60% stake in Unitech Wireless
• On 28 October 2008, Telenor signed an agreement with Unitech Ltd to acquire a 60% stake in Unitech Wireless via capital injections
• Expected closing of the transaction in Q1
• Following the completion of the transaction, Telenor will get management control and consolidate Unitech Wireless
• Telenor will appoint 4 out of 7 Directors of the Board and also have the right to appoint the Managing Director
• An application for permission for Telenor to own up to 74% of Unitech Wireless will be submitted to the FIPB* upon closing, the approval process is expected to take 2-6 months
*) FIPB = Foreign Investment Promotion Board
6
Telenor to inject INR 61.2 bn (NOK 8.7 bn) of new equity in Unitech Wireless in 2009
*) Cash injections in Q3 are subject to prior FIPB approval
Exchange rate: INR/NOK= 0.14
INR 53.7 bn(USD 1.07 bn)
INR 27.5 bnINR 12.5 bnTotal 4 installments
54.3%-60.0%43.3%25.9%Telenor
ownership
INR 61.2 bn
(NOK 8.7 bn)
Total investment
in 2009
INR 11.2 bn
INR 3.75 bnINR 3.75 bnAdditional**
injections
INR 15.0 bnINR 15.0 bnINR 12.5 bn
upon closing
Telenor cash
injections
Q309*Q209Q109
1 2 3
4
**) To maintain its ownership share when Unitech Ltd converts INR 5.0 bn of its shareholder loan
to equity, Telenor will inject an additional INR 7.5 bn into Unitech Wireless in Q2/Q3 2009
4
7
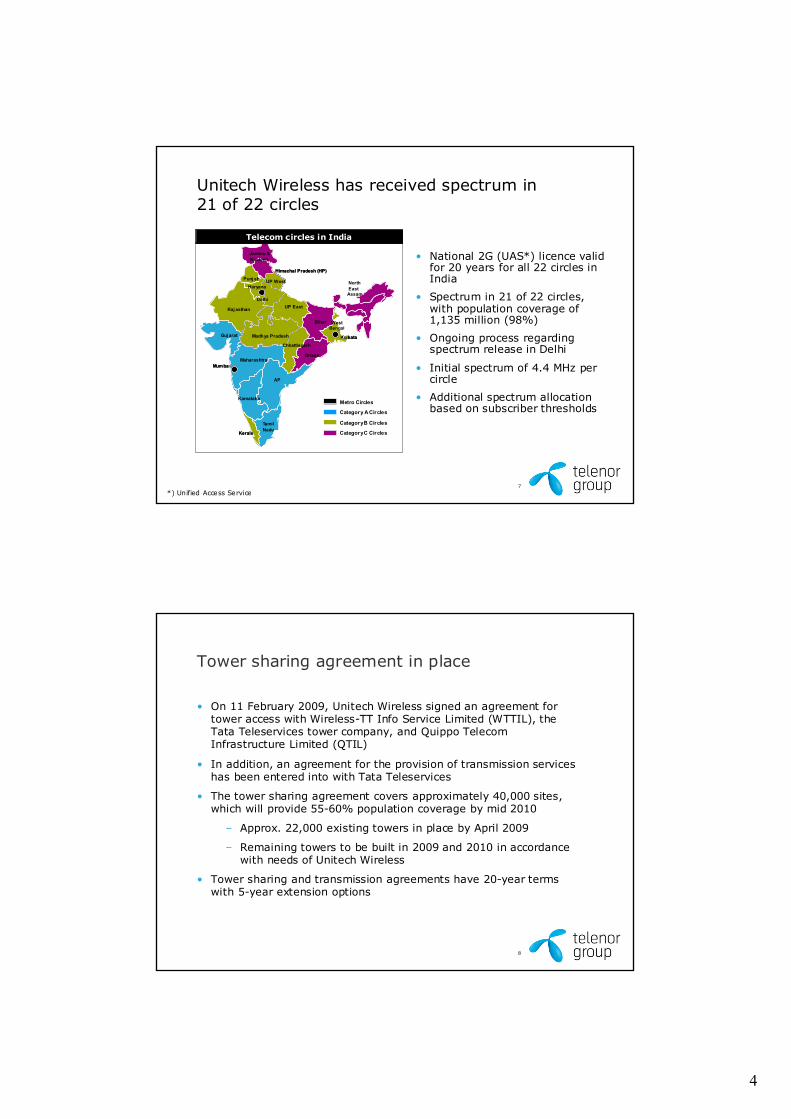
Unitech Wireless has received spectrum in 21 of 22 circles
• National 2G (UAS*) licence valid for 20 years for all 22 circles in India
• Spectrum in 21 of 22 circles, with population coverage of 1,135 million (98%)
• Ongoing process regarding spectrum release in Delhi
• Initial spectrum of 4.4 MHz per circle
• Additional spectrum allocation based on subscriber thresholds
Metro Circles
Category A Circles
Category B Circles
Category C Circles
Delhi
Chennai
Mumba i
Jammu &
Kashmir
Himachal Pradesh (HP)
Punj ab
HaryanaUP West
UP East
Bihar
North
East Assam
West Bengal
KolkataMadhya PradeshGujarat
Maharashtra
Chhattisgarh
Orissa
Tamil
NaduKerala
Kamataka
Raj asthan
AP
Delhi
Chennai
Mumba i
Jammu &
Kashmir
Himachal Pradesh (HP)
Punj ab
HaryanaUP West
UP East
Bihar
North
East Assam
West Bengal
KolkataMadhya PradeshGujarat
Maharashtra
Chhattisgarh
Orissa
Tamil
NaduKerala
Kamataka
Raj asthan
AP
Telecom circles in India
*) Unified Access Service
8
Tower sharing agreement in place
• On 11 February 2009, Unitech Wireless signed an agreement for tower access with Wireless-TT Info Service Limited (WTTIL), the Tata Teleservices tower company, and Quippo Telecom Infrastructure Limited (QTIL)
• In addition, an agreement for the provision of transmission services has been entered into with Tata Teleservices
• The tower sharing agreement covers approximately 40,000 sites, which will provide 55-60% population coverage by mid 2010
– Approx. 22,000 existing towers in place by April 2009
– Remaining towers to be built in 2009 and 2010 in accordance with needs of Unitech Wireless
• Tower sharing and transmission agreements have 20-year terms with 5-year extension options

5
9
Agenda
• Transaction Update
• Investment case
– Indian mobile market
– Market strategy
– Operational strategy
– Outlook
• Financing considerations
10
India – a large and growing economy
Sources: Economist Intelligence Unit (2009)
*) Comparison to forecast in October 2008**) Fiscal years starting April 1st of indicated year
• Population of 1.15 bn expected to grow by 1.4% per year
• GDP forecast to continue to grow, although somewhat slower over next 2-3 years
• GDP per capita expected to increase by ~80% from 2008 to 2013
• India to grow from the world’s
14th largest economy in 2007 to 9th largest in 2015
GDP per capita (USD) and GDP growth*
1 000 1 040
1 170
1 540
1 770
1 330
1 020
9 %
5 % 5 %
7 %
8 % 8 % 8 %
2007 2008 2009 2010 2011 2012 2013
Real GDP per capita (USD), ppp adjusted**
2 740 2 940 3 080 3 260 3 530 3 840 4 180
GDP per capita (USD)**
Real GDP growth*

6
11
620
350270
140 150 90 50
710
800
30
100 5080
100
Not connectedConnected
India is the world’s largest untapped mobile market
Population with and without mobile connections in 2008 (million)
China India USA Indonesia Brazil Pakistan Bangladesh
47% 31% 88% 57% 52% 33%75%
Mobile penetration (SIM)
Sources: CIA Fact Book (Pop. July 2008) and Wireless Intelligence (Connections December 2008)
12
Mobile spend expected to grow to 2.4% of GDP
Source: Telenor estimates
Nominal GDP (INR bn) / Mobile spend of GDP (%)
54 000
66 000
75 000
60 000
85 000
1,8 %
2,1 %2,3 % 2,4 % 2,4 %
2008 2009 2010 2011 2012
7
13
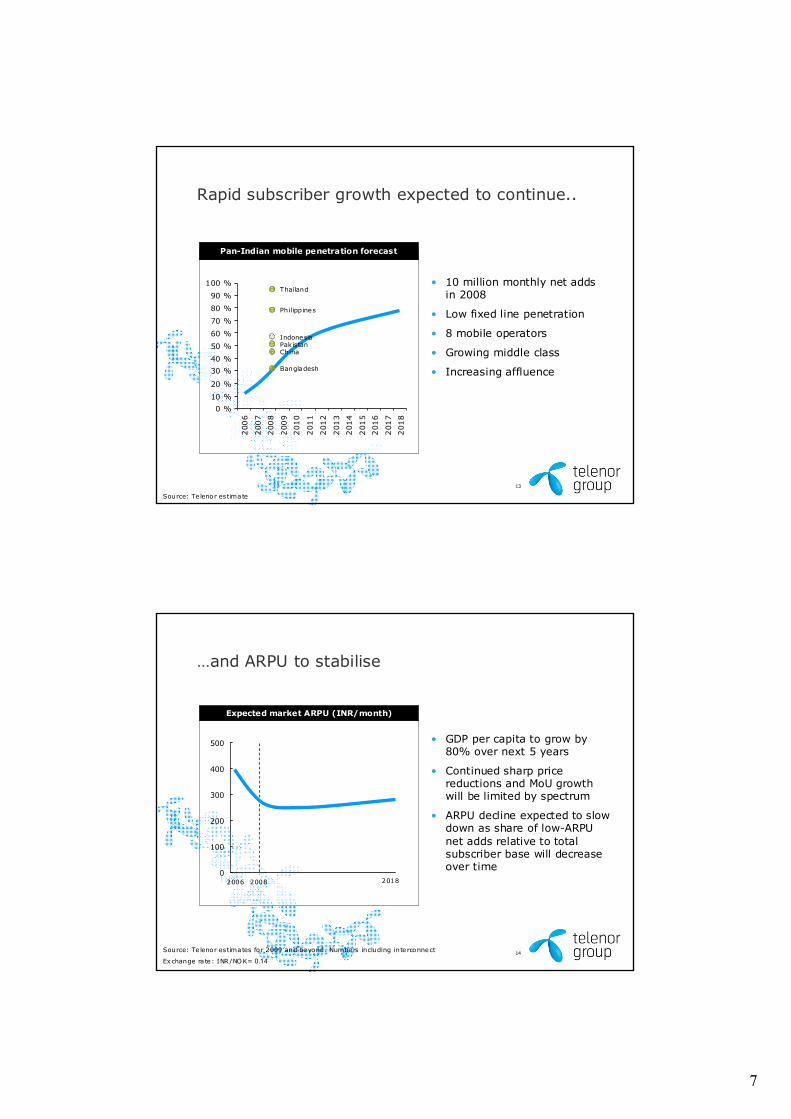
Source: Te lenor estimate
Rapid subscriber growth expected to continue..
Pan-Indian mobile penetration forecast
• 10 million monthly net adds in 2008
• Low fixed line penetration
• 8 mobile operators
• Growing middle class
• Increasing affluence
0 %
10 %
20 %
30 %
40 %
50 %
60 %
70 %
80 %
90 %
100 %
2006
2007
2008
2009
2010
2011
2012
2013
2014
2015
2016
2017
2018
Indonesia
Philippines
Bangladesh
Thailand
Pak istanChina
14
…and ARPU to stabilise
• GDP per capita to grow by 80% over next 5 years
• Continued sharp price reductions and MoU growth will be limited by spectrum
• ARPU decline expected to slow down as share of low-ARPU
net adds relative to total subscriber base will decrease over time
0
100
200
300
400
500
Expected market ARPU (INR/month)
Source: Te lenor estimates for 2009 and beyond. Numbers including inte rconnect
20182006 2008
Exchange ra te: INR/NOK= 0.14

8
15
22 growth opportunities with different market characteristics
Source: Ce llula r Associa tion of India , TRAI and India census 2001 (popula tion figures)
4 578
2 749
3 026
2 357
2 453
1 413
5 582
5 158
4 181
2 348
3 282
1 899
2 166
1 754
4 706
3 639
3 402
3 487
4 936
3 402
3 282
5 180
4 936
GDP /cap
(USD ppp)
17%30Assam
17%40Orissa
13%124Bihar
19%14North East
24%510B Circles
41%20Haryana
37%57Gujara t
35%58Karnataka
38%62RoTN
32%82Andhra Pradesh
30%88Maharashtra
16%226C Circ les
41%7Himachal P radesh
24%11Jammu & Kashm ir
46%28Punjab
41%34Kera la
29%65Rajasthan
18%72West Benga l
22%74U.P. (W)
18%92M.P
18%125U.P . (E)
34%347A Circles
73%74Metro Circles
70%12Chenna i
54%17Kolkata
90%22De lhi
72%23Mumba i
PenetrationPopulation
(mill)
Circle
• Significant scope for penetration growth in B and C circles
• High potential from churn in Metros and A circles
• Inter-circle segments
can be targeted for example by age groups and disposable income
Note: Chenna i and RoTN merged
16
Source: Company reports
No uniform competitive position taken across India
6 %
9 %
10 %
12 %
17 %
19 %
25 %
Market share 2008 Market position in circles Total circles
22156010
4
8
5
6
4
3
<#4
10
15
20
21
22
22
2103
0322
5730
2337
7362
0478
#4#3#2#1
Operator
Other opera tors, constituting a to ta l marke t share o f 2%, include MTNL (1.5%)

9
17
Indian customers are unhappy with the quality of existing offers
Source: TRAI, ART France Yearly Regula tor Survey, Connect Magazine (2007)
High call setup failure rates..
India average
1.46%
0.54%
European average
…and low customer satisfaction
“When people choose their SIM
cards, they check if the network
will be strong in their house ”
Mobile store manager
“Network signal in major cities is
very poor. When I am on the road,
the signal drops several times”
Corporate subscriber
Almost 2 out of 5 users said they
would change service provider if
they could retain their number
Poor market performance…
More than 3 out of 5 users face call
drops 1 - 2 times out of 10
…as well as high call drop rates:
18
0
50
100
150
200
250
300
350
400
450
2008 2009 2010 2011 2012 2013
Churn
Net adds
Customers on the move creates opportunities for new entrants
Gross subscriber potential in India per year (in millions)
Source: Te lenor estimate. Average marke t churn estimated to a round 40% per year
350 480 600 700 770 830
Total subscribers
10
19
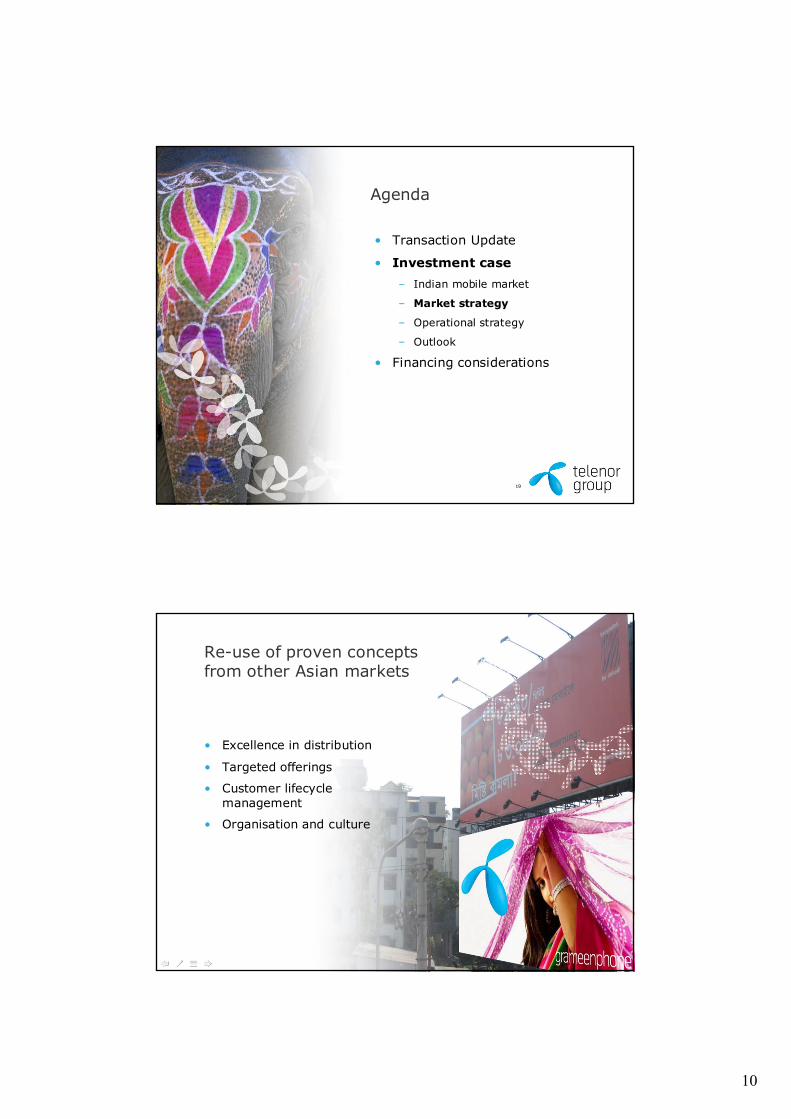
Agenda
• Transaction Update
• Investment case
– Indian mobile market
– Market strategy
– Operational strategy
– Outlook
• Financing considerations
20
• Excellence in distribution
• Targeted offerings
• Customer lifecycle
management
• Organisation and culture
Re-use of proven concepts from other Asian markets
11
21
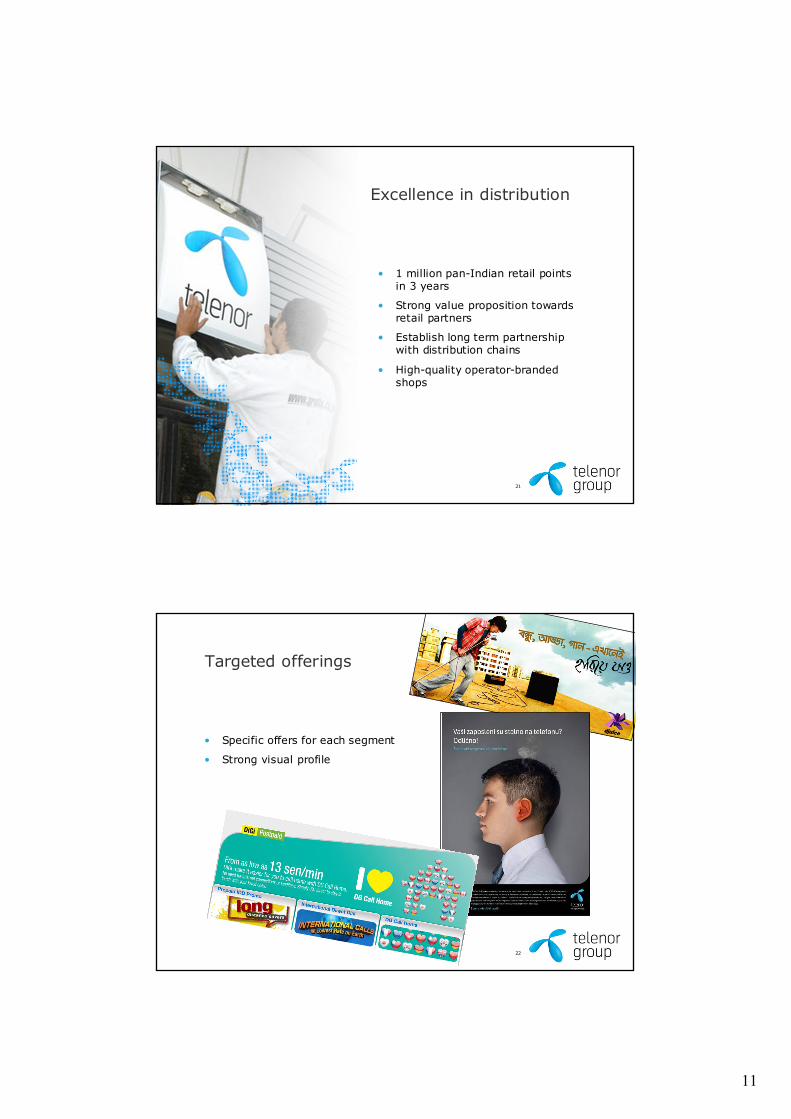
Excellence in distribution
• 1 million pan-Indian retail points in 3 years
• Strong value proposition towards retail partners
• Establish long term partnership with distribution chains
• High-quality operator-branded shops
22
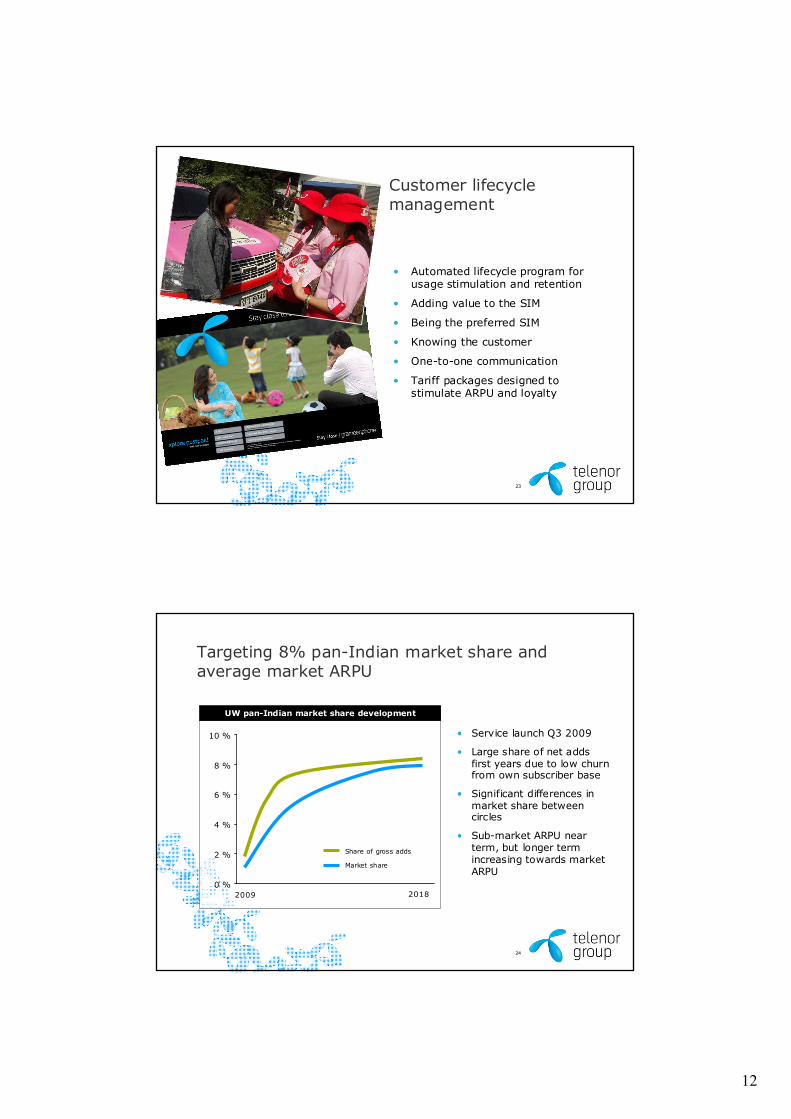
Targeted offerings
• Specific offers for each segment
• Strong visual profile
12
23
Customer lifecycle management
• Automated lifecycle program for usage stimulation and retention
• Adding value to the SIM
• Being the preferred SIM
• Knowing the customer
• One-to-one communication
• Tariff packages designed to stimulate ARPU and loyalty
24
Targeting 8% pan-Indian market share and average market ARPU
UW pan-Indian market share development
0 %
2 %
4 %
6 %
8 %
10 %
Share of gross adds
Market share
• Service launch Q3 2009
• Large share of net adds first years due to low churn from own subscriber base
• Significant differences in market share between circles
• Sub-market ARPU near term, but longer term increasing towards market ARPU
2009 2018
13
25
Agenda
• Transaction Update
• Investment case
– Indian mobile market
– Market strategy
– Operational strategy
– Outlook
• Financing considerations
26
Low cost operational model
• Gradual network build-up
• Infrastructure sharing
• GSM equipment at competitive cost
• Full-scale IT outsourcing
• Long term cost and capex efficiency

14
27
Gradual network build-up to pan-Indian coverage
• Minimum roll-out requirement is 5-6,000 sites to meet licencecoverage obligations
• Launch plan based on attractiveness of the markets
• 60% population coverage targeted 1 year after launch
• Inter-circle roaming secures pan-Indian offering from day one
Number of sites / pop. coverage (%)
~40 000
~20 000
~30 000
~40% ~50% ~60%
Source: Telenor estimate
28
Infrastructure agreement with Tata/Quippo
• Tower sharing agreement with Tata/Quippo provides required coverage at launch and flexibility for further expansion
– 40,000 towers by end 2010, of which 22,000 available by April 2009
• Lower opex in 2009-2010 than previously anticipated
– Tower sharing priced at fixed monthly rate per site, plus payment for actual power consumption
– Transmission between sites at a fixed monthly rate provided by Tata Teleservices
• Unitech Wireless may enter into additional tower rental
agreements, in line with launch strategy and subscriber growth

15
29
Tower sharing improves capex efficiency significantly…
Capex per site (USD)
Own built Rental
-75%
• Tower sharing enables swift and flexible rollout of network
• 75% capex saving per site compared to own build-out
Radio equipment
Tower
~80 000
~20 000
30
….with only limited increase in opex
• Non-rental costs reduced by 60%
• Efficiency gains in construction and operation of towers
• Potential savings from power and diesel consumption based upon shared infrastructure and logistics
• Competitive market for towers securing attractive terms
Site-related opex
Own built Rental
Tower renta l
Other site-re lated cost (land rent,
O&M, security and insurance)
-60%
16
31
GSM equipment at competitive cost
• No technology legacy
• High spectrum capacity utilisation
• Equipment cost lower than in other Telenor Asia operations, due to:
– Large volumes
– Multiple vendors
– Overall industry development
32
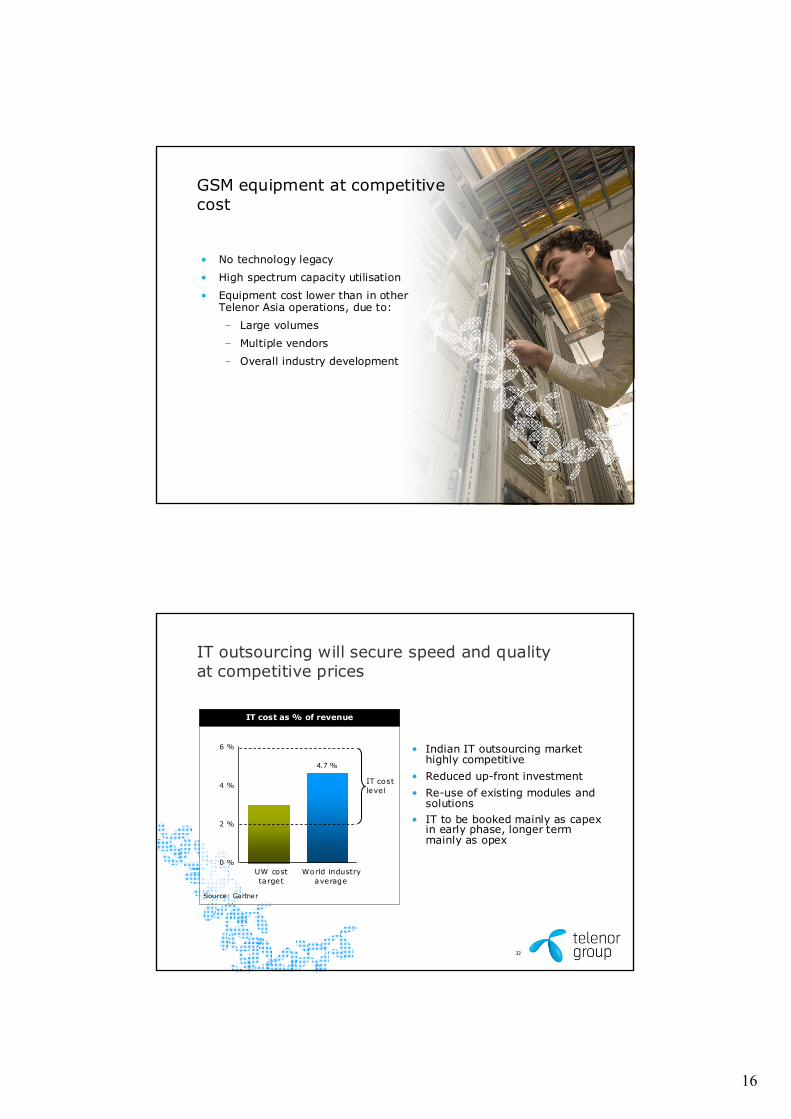
IT outsourcing will secure speed and quality at competitive prices
• Indian IT outsourcing market highly competitive
• Reduced up-front investment
• Re-use of existing modules and solutions
• IT to be booked mainly as capexin early phase, longer term mainly as opex
Source: Gartner
4.7 %
0 %
2 %
4 %
6 %
IT cost
leve l
UW cost
target
World industry
average
IT cost as % of revenue

17
33
Cost drivers and cost levels
Cost component Unit Cost level Cost driver
Customer acquisition cost
Marketing
Admin
Call centre
Interconnect cost
Licencing fee
Tower renta l
Transmission
Electricity & diese l
O&M
Cost/gross add
% of revenues
Cost/site/month
INR 250-300 Gross adds
Revenues
Number of
s ites
Long term 3%
Long term
30%*
~10%
INR~70,000**
*) Short time higher due to more unfavourable interconnect balance
**) Blended cost at 2008 price level
Exchange rate: INR/NOK= 0.14
34
Long term capex efficiency
0 %
10 %
20 %
30 %
40 %
50 %
60 %
70 %
80 %
90 %
100 %
2009
2010
2011
2012
2013
2014
2015
2016
2017
2018
Capex/sales (%) Construction phase:• Building coverage• Main capex driver is number of sites (USD ~30k per site, inclcore and other facilities)
10%long term target Expansion phase:
• Securing capacity• Main capex driver is number of net adds (USD ~20 per net add)
Steady state:• Develop services for existing subscribers
• Main capex driver is number of existing subscribers

18
35
Agenda
• Transaction Update
• Investment case
– Indian mobile market
– Market strategy
– Operational strategy
– Outlook
• Financing considerations
36
Outlook for 2009 and long term ambitions
• Capex of NOK 5.5-6.5 bn and EBITDA loss of 2.0-2.5 bn in 2009
• Accumulated capex of approx. NOK 12 bn first three years
• EBITDA breakeven in approx. three years from launch
• Operating cash flow* breakeven in approx five years from launch
• Long term ambition of 30% EBITDA margin and 20% operating cash flow margin
Outlook for 2009: Current vs previous plan (NOK bn)
EBITDA Capex
Current plan
Previous plan (Oct 2008)
- (2.0-2.5 )
-5.0
5.5-6.5
7.5
Ex change ra te : INR /NO K= 0.14
*) EBITDA-capex
19
37
Agenda
• Transaction Update
• Investment case
• Financing considerations
38
Unitech Wireless financing plan
• Investment case assumes cumulative funding of approx. INR 155 bn (NOK 22 bn) until operating cash flow* breakeven
• Funding requirement to be covered by equity injection, project financing and vendor financing
• Both Telenor and Unitech are contractually committed to provide their pro rata share of the additional equity needed
Ex change ra te : INR /NO K = 0.14
*) De fined as EBITDA-capex

20
39
Summary
• Entry into attractive high growth market
• Unitech Wireless to be controlled and consolidated from the closing of the transaction
• Leverage on strong track record and experience in successfully launching operations in emerging markets
• Tower sharing agreements reducing capex significantly, with only limited increase in opex
40
Appendix
21
41
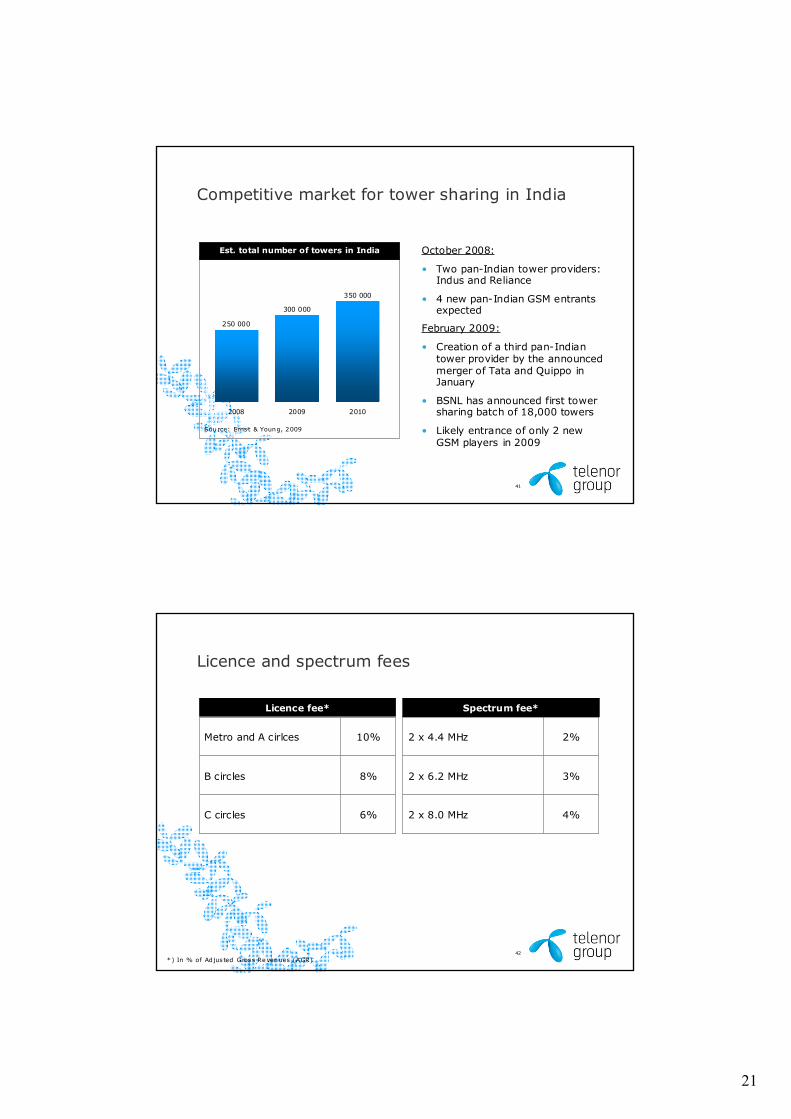
Competitive market for tower sharing in India
October 2008:
• Two pan-Indian tower providers: Indus and Reliance
• 4 new pan-Indian GSM entrants expected
February 2009:
• Creation of a third pan-Indian tower provider by the announced merger of Tata and Quippo in January
• BSNL has announced first tower sharing batch of 18,000 towers
• Likely entrance of only 2 new GSM players in 2009
300 000
350 000
250 000
2008 2009 2010
Est. total number of towers in India
Source: Erns t & Young, 2009
42
Licence and spectrum fees
4%2 x 8.0 MHz
3%2 x 6.2 MHz
2%2 x 4.4 MHz
Licence fee* Spectrum fee*
6%C circles
8%B circles
10%Metro and A cirlces
*) In % of Ad jus ted Gross Re venues (AGR)

22
43
Interconnection and roaming
• Current local mobile termination rates regulated by TRAI at INR 0.30 per minute
• Additional inter circle carriage charge of maximum INR 0.2 per minute for calls terminated in mobile networks
• Long distance carriage charge of maximum INR 0.65 per minute
• Inter-circle roaming maximum prices regulated to
– INR 1.40 for outgoing local calls
– INR 2.40 for outgoing national
long distance (NLD) calls
– INR 1.75 for incoming calls
• Bi-lateral intra-circle roaming permitted
Interconnection Roaming
44
Telenor funding plan
• Previously announced proposal of a NOK 12 bn rights issue has been withdrawn
• Dividend program proposed to be put on hold for next two years
• NOK 8 bn term loan signed in January 2009
• Unitech Wireless to be consolidated in Telenor Group figures from closing of transaction