telenor – second quarter 2006 · revenue figures in 2005 according to thai gaap for trend...
TRANSCRIPT

Telenor – Second Quarter 2006

Group OverviewJon Fredrik Baksaas
President and CEO

3
The following presentations are being made only to, and is only directed at, persons to whom suchpresentation may lawfully be communicated (“relevant persons”).
Any person who is not a relevant person should not act or rely on these presentations or any of itscontents. Information in the following presentations relating to the price at which relevant investmentshave been bought or sold in the past or the yield on such investments cannot be relied upon as a guide to the future performance of such investments.
This presentation does not constitute an offering of securities or otherwise constitute an invitation or inducement to any person to underwrite, subscribe for or otherwise acquire securities in any companywithin the Telenor Group.
The release, publication or distribution of this presentation in certain jurisdictions may be restricted by law, and therefore persons in such jurisdictions into which this presentation is released, published or distributed should inform themselves about, and observe, such restrictions.
The presentation contain statements regarding the future in connection with Telenor's growthinitiatives, profit figures, outlook, strategies and objectives. All statements regarding the future aresubject to inherent risks and uncertainties, and many factors can lead to actual profits and developments deviating substantially from what has been expressed or implied in such statements. These factors include the risk factors relating to Telenor's activities described in Telenor's 2005 AnnualReport on Form 20-F filed with the Securities and Exchange Commission in the USA under the headings “Cautionary Statement Regarding Forward-Looking Statements” and “Risk Factors” (available at www.telenor.com/ir/).
4Subscription figures from consolidated and associated mobile operations
million mobile subscriptions

5
95.8
89.6
2.01.2
1.00.8
0.7 0.4
Q1 0
6
Gra
meenPhone
Vim
pelco
m
Kyiv
star
DTAC
Tele
nor
Pakista
n
DiG
i
Oth
er
Q2 0
6
GrameenPhone Largest Contributor to Subscription Growth
Million mobile subscriptions

6
• Underlying revenue growth of 12%
• EBITDA margin increased from 34% to 35%
• Strong operating cash flow
Revenues (NOKm)/EBITDA %
16 542
22 580
35.1 %34.0 %
Q2 2005 Q2 2006
5 630
7 930
2 923
4 422
Q2 2005 Q2 2006
EBITDA CAPEX
Revenue Growth of 37%

7
GrameenPhone
Record High Subscription Growth
640705
775850
955 997
51 % 47 %57 % 54 %
69 %
49 %
Q1 05 Q2 05 Q3 05 Q4 05 Q1 06 Q2 06
Revenues (NOKm)/EBITDA%
329 334
441 455
659
488496
357
590
1 153
389
516
Q1 05 Q2 05 Q3 05 Q4 05 Q1 06 Q2 06
EBITDA CAPEX
• Revenue growth of 56% in localcurrency
• Strong subscription growthreduces EBITDA margin
• Declining churn due to successfulloyalty programs
• SIM card tax reduced from USD 14 to USD 12

8
• Price decline of 18% in Q2
• Strong increase in uncharged incoming traffic
• Positive progress on interconnection regime
DTAC
Significant Price Erosion in the Market
Revenue figures in 2005 according to Thai GAAP for trend purposes
Revenues (NOKm)/EBITDA%
646 655 630713 719 698
284
418
561
219
605543
Q1 05 Q2 05 Q3 05 Q4 05 Q1 06 Q2 06
EBITDA CAPEX
1 709 1 718 1 6571 872
2 0321 893
38 % 38 % 38 % 38 % 35 % 37 %
Q1 05 Q2 05 Q3 05 Q4 05 Q1 06 Q2 06

9
• 31% revenue growth in local currency
• Increasing revenue market share
• Revised guidance upwards
• High dividend payments
DiGi
Solid Cash Flow
1 0341 161
1 2851 452
1 546 1 544
44 % 43 % 44 % 44 % 45 % 45 %
Q1 05 Q2 05 Q3 05 Q4 05 Q1 06 Q2 06
Revenues (NOKm)/EBITDA%
451499
560632
700 700
108178
310
574
226 199
Q1 05 Q2 05 Q3 05 Q4 05 Q1 06 Q2 06
EBITDA CAPEX
10
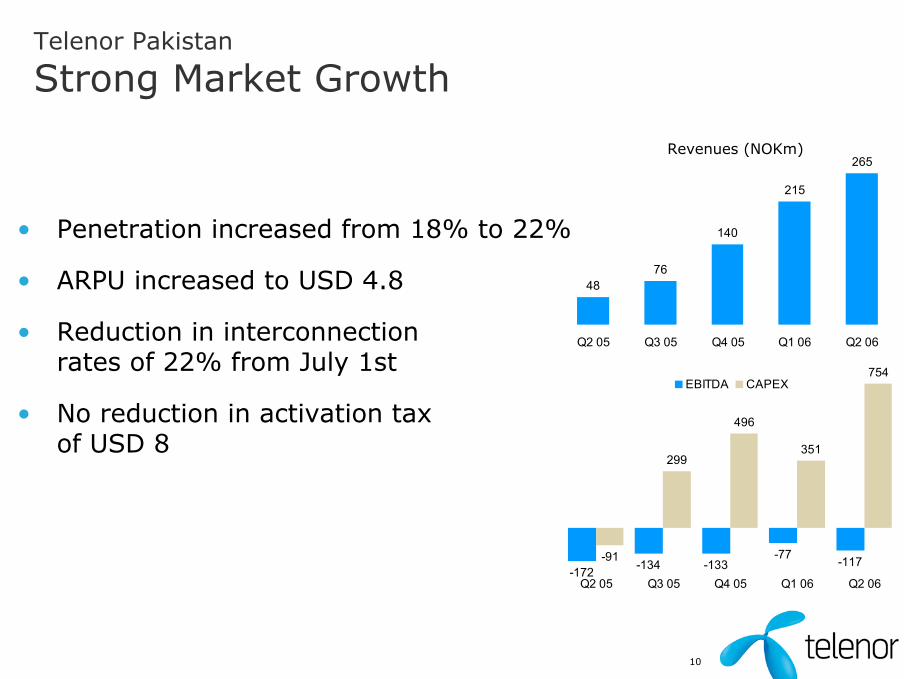
• Penetration increased from 18% to 22%
• ARPU increased to USD 4.8
• Reduction in interconnectionrates of 22% from July 1st
• No reduction in activation taxof USD 8
4876
140
215
265
Q2 05 Q3 05 Q4 05 Q1 06 Q2 06
-172 -134 -133-77 -117-91
299
496
351
754
Q2 05 Q3 05 Q4 05 Q1 06 Q2 06
EBITDA CAPEX
Revenues (NOKm)
Telenor Pakistan
Strong Market GrowthTelenor Pakistan
Strong Market Growth

11
Kyivstar
Increased Revenues and Margin
1 163
1 643
2 0762 390 2 329
2 580
54 % 55 % 55 % 57 %61 % 62 %
Q1 05 Q2 05 Q3 05 Q4 05 Q1 06 Q2 06
Revenues (NOKm)/EBITDA%
632
911
1 4321 596
735919
1 106
830 770
1 148
1 359
890
Q1 05 Q2 05 Q3 05 Q4 05 Q1 06 Q2 06
EBITDA CAPEX
• Revenue growth of 57%
• ARPU increased from Q1 by 10%in local currency
• Stable prices and increased usage
• Improving cash flow
12
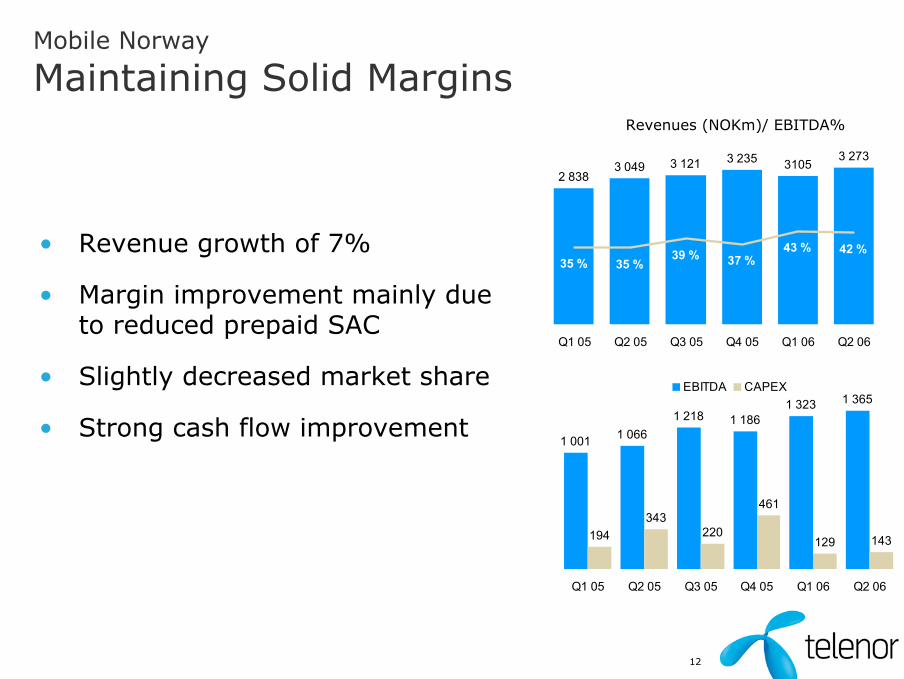
Mobile Norway
Maintaining Solid MarginsRevenues (NOKm)/ EBITDA%
1 001 1 0661 218 1 186
1 323 1 365
194343
220
461
129 143
Q1 05 Q2 05 Q3 05 Q4 05 Q1 06 Q2 06
EBITDA CAPEX
2 8383 049 3 121 3 235 3105
3 273
35 % 35 %39 % 37 %
43 % 42 %
Q1 05 Q2 05 Q3 05 Q4 05 Q1 06 Q2 06
• Revenue growth of 7%
• Margin improvement mainly due to reduced prepaid SAC
• Slightly decreased market share
• Strong cash flow improvement
13
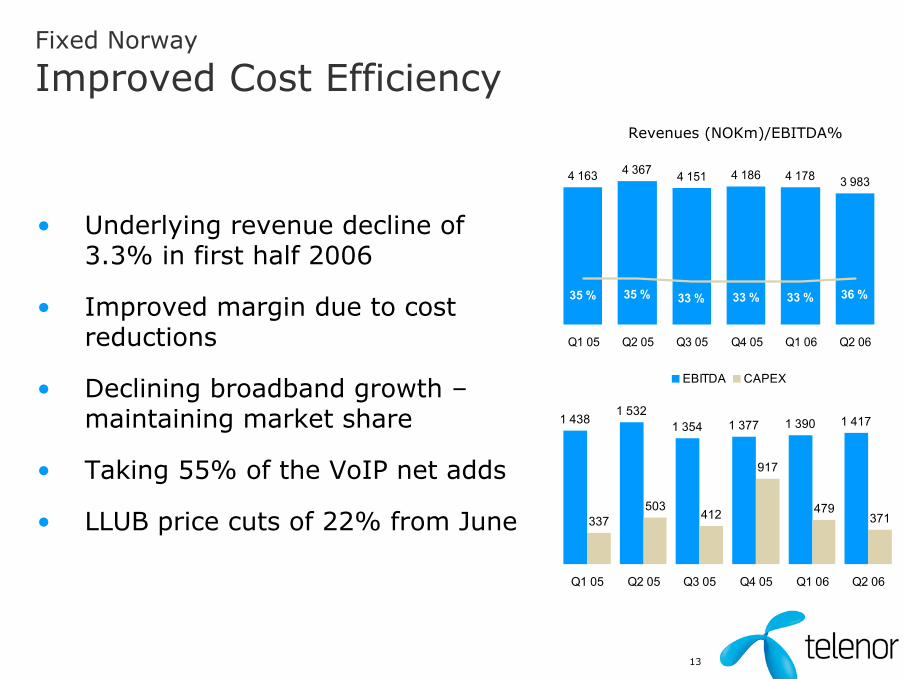
Fixed Norway
Improved Cost Efficiency
• Underlying revenue decline of 3.3% in first half 2006
• Improved margin due to cost reductions
• Declining broadband growth –maintaining market share
• Taking 55% of the VoIP net adds
• LLUB price cuts of 22% from June
4 163 4 367 4 151 4 186 4 178 3 983
35 % 35 % 33 % 33 % 33 % 36 %
Q1 05 Q2 05 Q3 05 Q4 05 Q1 06 Q2 06
1 4381 532
1 354 1 377 1 390 1 417
337503
412
917
479371
Q1 05 Q2 05 Q3 05 Q4 05 Q1 06 Q2 06
EBITDA CAPEX
Revenues (NOKm)/EBITDA%

14
H1 05 POTS Broadband Other H1 06
NOKm
8 530
- 6.8%+ 4.4%
- 0.9%
8 161
- 3.3%
Fixed Norway
Underlying Revenue Trends Continue

15
1 660
20
1 820
3148
90
11
Q2 2005 One-offitems
Sales andCustomerSupport
Productand IS
Operationand
delivery
Other Q2 2006
Fixed Norway
Positive Cost Development

16
Broadcast
To Build and operate DTT Network in Norway
• Annual revenues from DTT of more than NOK 250 m
• Total roll-out CAPEX of NOK 1 bn
• To develop and operate the DTT customer service platform
• Launch Q3 2007 – analogue shut off by end 2009
1 390 1 401 1 3921 466
1 5171 564
27 % 29 % 28 % 23 % 27 % 28 %
Q1 05 Q2 05 Q3 05 Q4 05 Q1 06 Q2 06
Revenues (NOKm)/ EBITDA%
380411 394
331
408437
4796 116 133
92 106
Q1 05 Q2 05 Q3 05 Q4 05 Q1 06 Q2 06
EBITDA CAPEX

FinancialsTrond Westlie
CFO

18
Earnings Per Share Last Twelve Months (NOK)

19
(NOKm)
Q2 2006
Reported P&L
Q2 2006 Q2 2005 2005
Revenues 22 580 16 542 68 927
EBITDA 7 930 5 630 23 836
EBIT 4 299 2 859 11 705
Profit before Tax 3 937 3 325 12 591
Net Income 2 283 2 041 7 646
EPS (NOK) 1.35 1.19 4.47

20
22 58016 542
Q2 0
5
DTAC
Mobile
Sw
eden
Kyiv
star
DiG
i
Gra
meenPhone
Fix
ed
Mobile
Norw
ay
Oth
er
Q2 0
6
36.5%
11.4%8.3% 5.7% 2.3% 1.8% 1.5% 1.4% 4.1%
Q2 2006
Revenue Development
NOKm
21
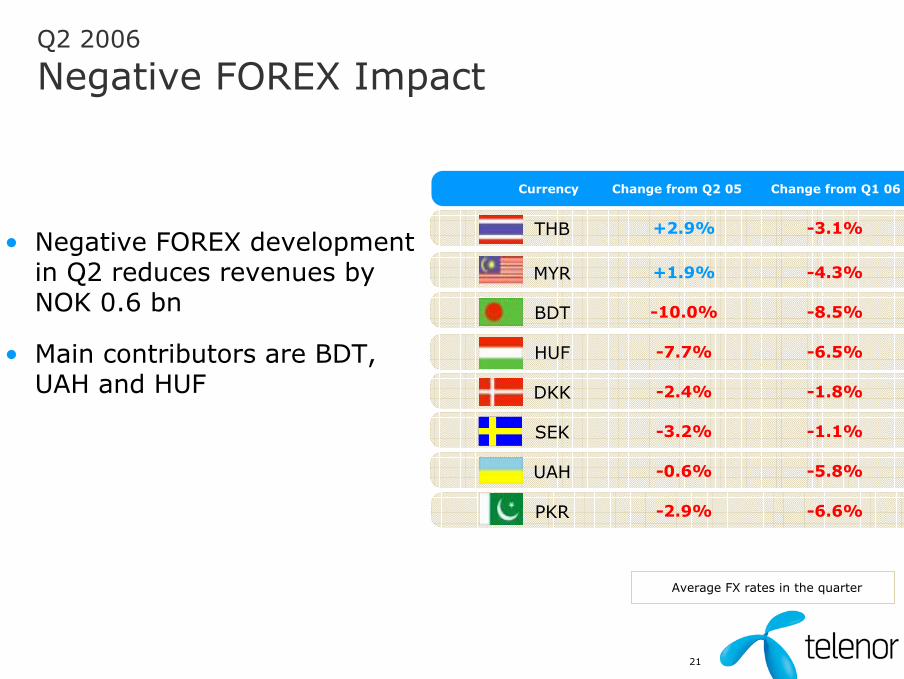
Currency Change from Q2 05 Change from Q1 06
Q2 2006
Negative FOREX Impact
-6.6%-2.9%PKR
-5.8%-0.6%UAH
-1.1%-3.2%SEK
-1.8%-2.4%DKK
-6.5%-7.7%HUF
-8.5%-10.0%BDT
-4.3%+1.9%MYR
-3.1%+2.9%THB• Negative FOREX development
in Q2 reduces revenues by NOK 0.6 bn
• Main contributors are BDT, UAH and HUF
Average FX rates in the quarter
22
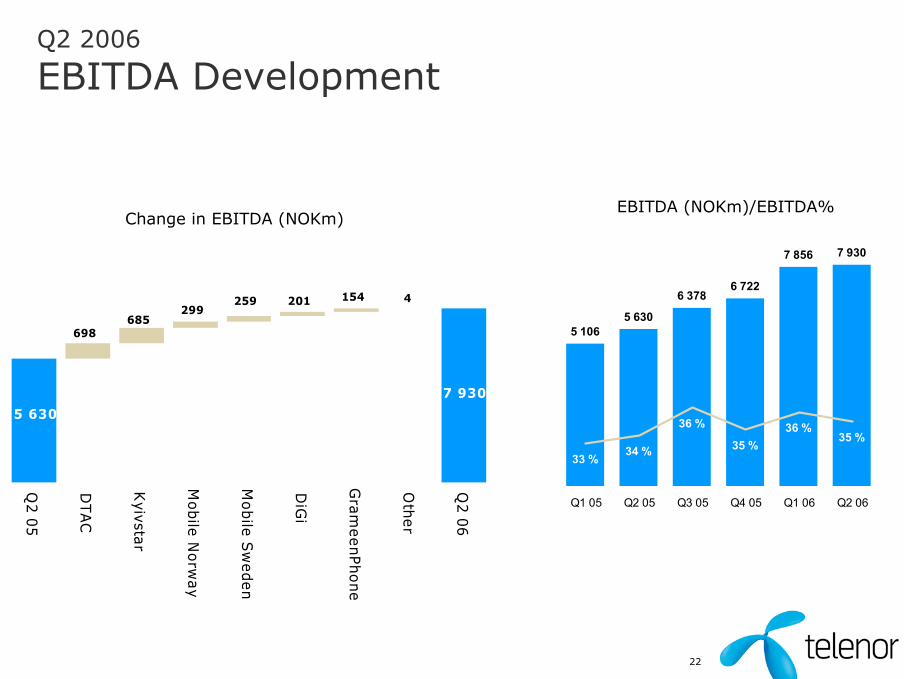
5 630
7 930
4154201259299
685698
Q2 0
5
DTA
C
Kyivsta
r
Mobile
Norw
ay
Mobile
Sw
eden
DiG
i
Gra
meenPhone
Oth
er
Q2 0
6
Q2 2006
EBITDA Development
5 1065 630
6 3786 722
7 856 7 930
33 % 34 %
36 %
35 %36 %
35 %
Q1 05 Q2 05 Q3 05 Q4 05 Q1 06 Q2 06
EBITDA (NOKm)/EBITDA%Change in EBITDA (NOKm)

23
Q2 2006
CAPEX Development
3 3602 923
3 720
6 436
3 703
4 422
22 % 18 % 21 %33 %
17 % 20 %
Q1 05 Q2 05 Q3 05 Q4 05 Q1 06 Q2 06
CAPEX (NOKm) and CAPEX/Sales (%)H1 06
CAPEX of NOK 8,125 m
Kyivstar20 %
DiGi5 %
Other20 %
GrameenPhone11 %
Telenor Pakistan14 %
DTAC14 %
Fixed16 %
24
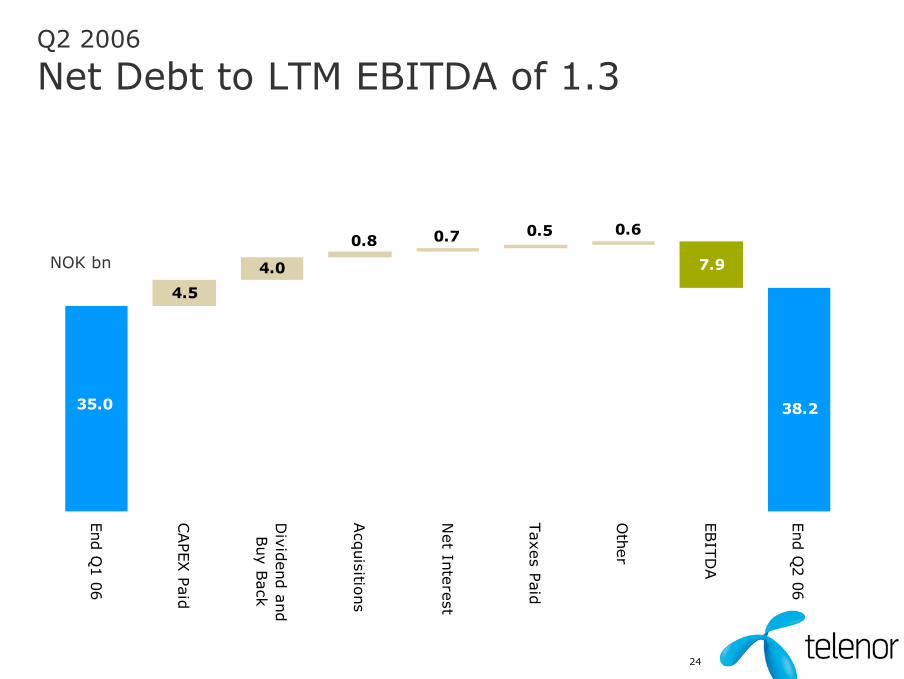
38.235.0
7.9
0.6 0.5 0.7 0.8
4.0
4.5
End Q
1 0
6
CAPEX P
aid
Div
idend a
nd
Buy B
ack
Acq
uisitio
ns
Net In
tere
st
Taxes P
aid
Oth
er
EBIT
DA
End Q
2 0
6
NOK bn
Q2 2006
Net Debt to LTM EBITDA of 1.3

25
Outlook 2006
Expectations Unchanged
• Revenue growth: Around 30%
• EBITDA margin: Above 34%
• CAPEX/Sales: Above 20%
Telenor – Second Quarter 2006

Telenor – Second Quarter 2006Appendix
28
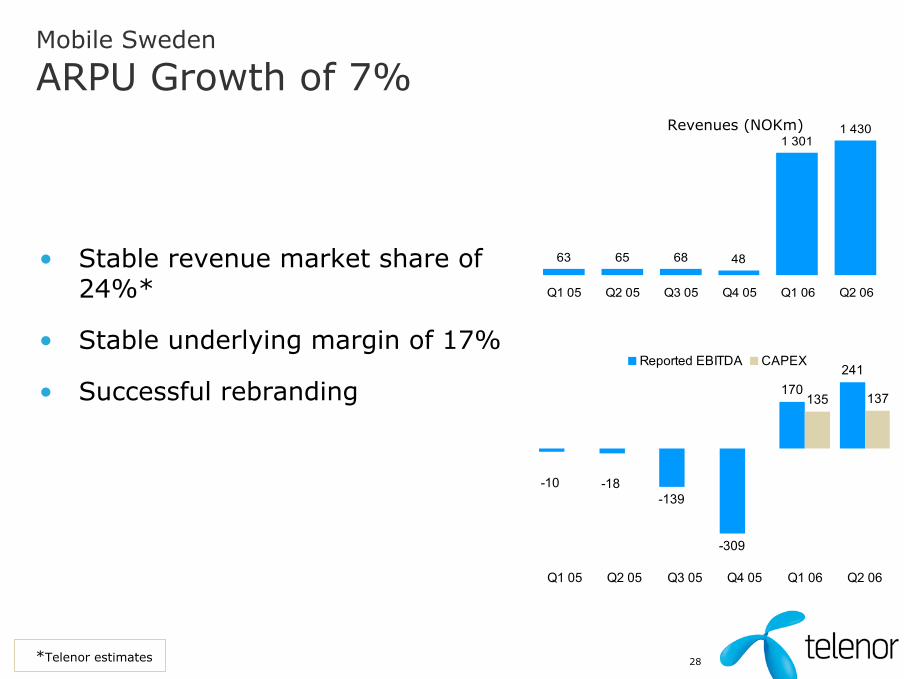
Mobile Sweden
ARPU Growth of 7%Revenues (NOKm)
63 65 68 48
1 3011 430
Q1 05 Q2 05 Q3 05 Q4 05 Q1 06 Q2 06
-139
-309
170241
135 137
-18-10
Q1 05 Q2 05 Q3 05 Q4 05 Q1 06 Q2 06
Reported EBITDA CAPEX
• Stable revenue market share of 24%*
• Stable underlying margin of 17%
• Successful rebranding
*Telenor estimates

29
• Net adds of 11k subscriptions in Q2
• Revenues increased by 6% in local currency
• Stable market share at 27%
• CAPEX primarily related to UMTS roll-out
• Interconnection rates reduced by 11% from May 2006
Sonofon
Stable Development
1 1931 308 1 356 1 334 1 3471 353
21 % 24 % 23 % 23 % 23 % 23 %
Q1 05 Q2 05 Q3 05 Q4 05 Q1 06 Q2 06
Revenues (NOKm)/EBITDA%
253308 307 308 305 307
28140 137
757
109170
Q1 05 Q2 05 Q3 05 Q4 05 Q1 06 Q2 06
EBITDA CAPEX
30
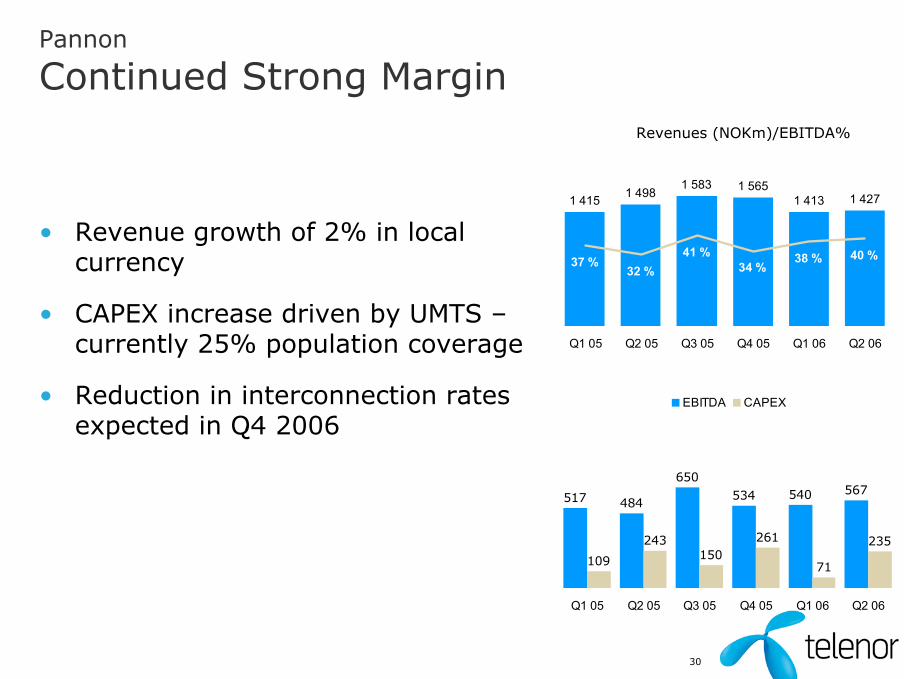
• Revenue growth of 2% in local currency
• CAPEX increase driven by UMTS –currently 25% population coverage
• Reduction in interconnection rates expected in Q4 2006
Pannon
Continued Strong Margin
1 415 1 4981 583 1 565
1 413 1 427
37 %32 %
41 %34 %
38 % 40 %
Q1 05 Q2 05 Q3 05 Q4 05 Q1 06 Q2 06
Revenues (NOKm)/EBITDA%
517 484
650534 540 567
109
243150
261
71
235
Q1 05 Q2 05 Q3 05 Q4 05 Q1 06 Q2 06
EBITDA CAPEX
31
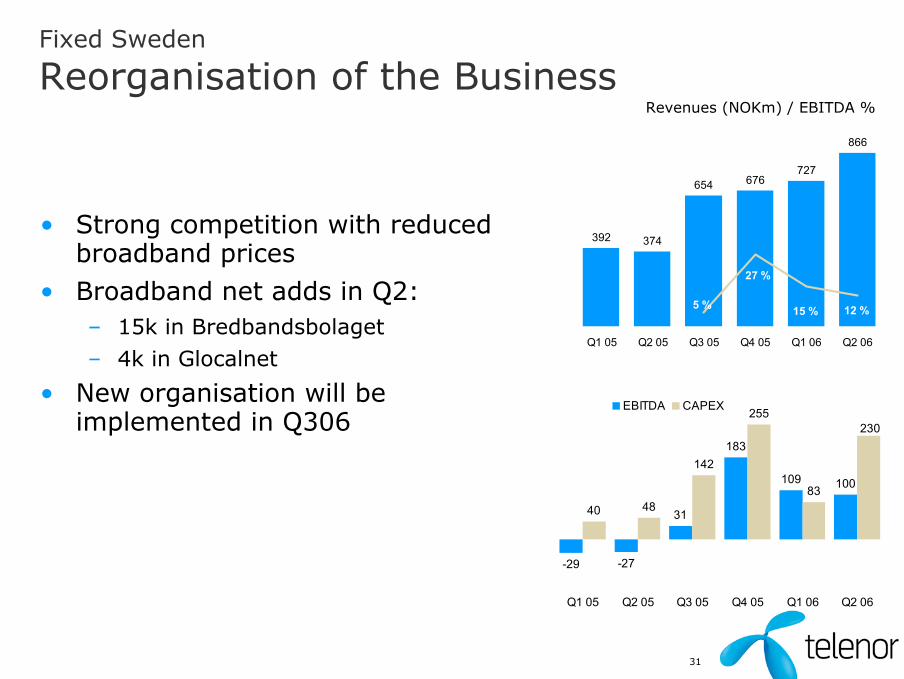
Fixed Sweden
Reorganisation of the Business
-29 -27
31
183
109 100
40 48
142
255
83
230
Q1 05 Q2 05 Q3 05 Q4 05 Q1 06 Q2 06
EBITDA CAPEX
Revenues (NOKm) / EBITDA %
• Strong competition with reduced broadband prices
• Broadband net adds in Q2:– 15k in Bredbandsbolaget– 4k in Glocalnet
• New organisation will be implemented in Q306
392 374
654 676727
866
12 %5 % 15 %
27 %
Q1 05 Q2 05 Q3 05 Q4 05 Q1 06 Q2 06

32
Fixed Denmark
Continued Growth
• Proforma annual revenue growth of 32% in local currency
• xDSL market share of 16%
• 14k net adds broadband subscriptions to 152k in Q206
• VoIP net adds of 4k subscriptions to 41k in Q206
Revenues (NOKm) / EBITDA %
48 4955
59
40
57 55
42
Q3 05 Q4 05 Q1 06 Q2 06
EBITDA CAPEX
142164
174 181
34 % 30 % 32 % 33 %
Q3 05 Q4 05 Q1 06 Q2 06
303230
2522
Q12005
Q22005
Q32005
Q42005
Q12006
Q22006
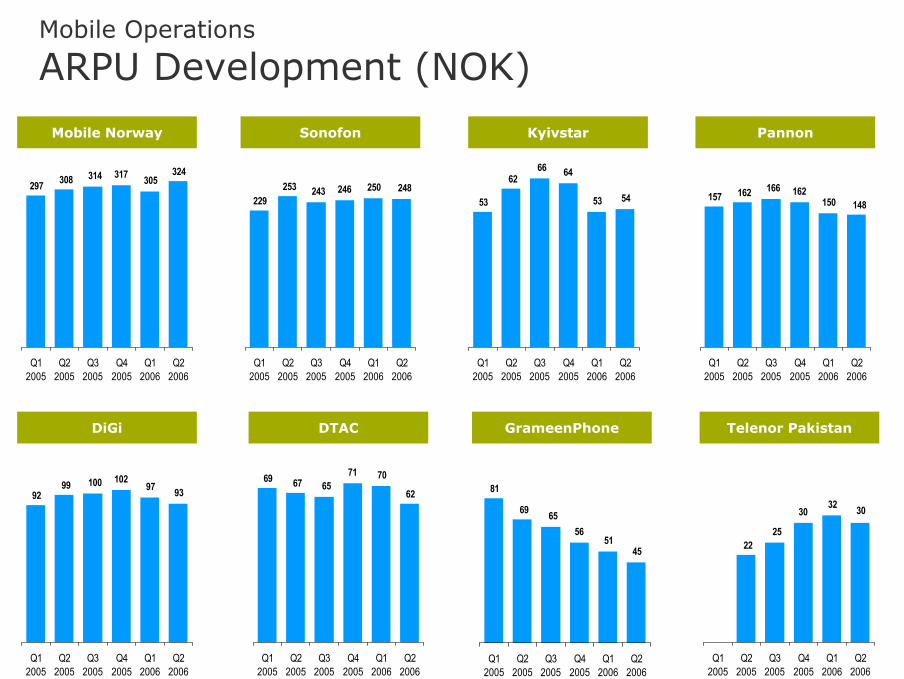
4551
566569
81
Q12005
Q22005
Q32005
Q42005
Q12006
Q22006
62
7071656769
Q12005
Q22005
Q32005
Q42005
Q12006
Q22006
939710210099
92
Q12005
Q22005
Q32005
Q42005
Q12006
Q22006
148150162166162157
Q12005
Q22005
Q32005
Q42005
Q12006
Q22006
5453
646662
53
Q12005
Q22005
Q32005
Q42005
Q12006
Q22006
248250246243253229
Q12005
Q22005
Q32005
Q42005
Q12006
Q22006
324305317314308297
Q12005
Q22005
Q32005
Q42005
Q12006
Q22006
Sonofon KyivstarMobile Norway Pannon
DiGi DTAC GrameenPhone Telenor Pakistan
Mobile Operations
ARPU Development (NOK)

290284271
226203
Q12005
Q22005
Q32005
Q42005
Q12006
Q22006
492516552651690
802
Q12005
Q22005
Q32005
Q42005
Q12006
Q22006
375412
437411422428
Q12005
Q22005
Q32005
Q42005
Q12006
Q22006
5454585859
56
Q12005
Q22005
Q32005
Q42005
Q12006
Q22006
5 0594 8045 1315 2655 116
4 664
Q12005
Q22005
Q32005
Q42005
Q12006
Q22006
4440
49515045
Q12005
Q22005
Q32005
Q42005
Q12006
Q22006
235233232230234
207
Q12005
Q22005
Q32005
Q42005
Q12006
Q22006
324305317314308297
Q12005
Q22005
Q32005
Q42005
Q12006
Q22006
Sonofon (DKK) Kyivstar (UAH)Mobile Norway (NOK) Pannon (HUF)
DiGi (MYR) DTAC (THB) GrameenPhone(BDT)
Telenor Pakistan (PKR)
Mobile Operations
ARPU Development (local currency)
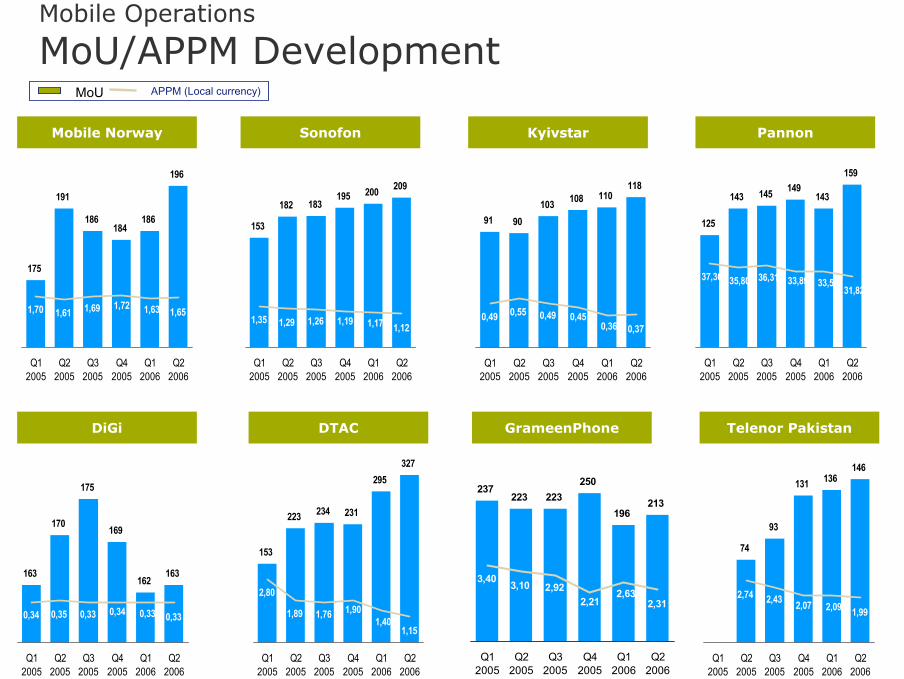
223 213196
250223
237
2,312,63
2,212,923,103,40
Q12005
Q22005
Q32005
Q42005
Q12006
Q22006
223
327295
231234
153
1,151,40
1,901,761,89
2,80
Q12005
Q22005
Q32005
Q42005
Q12006
Q22006
170
163162
169
175
163
0,330,330,340,330,350,34
Q12005
Q22005
Q32005
Q42005
Q12006
Q22006
143
159
143149145
125
31,8233,5933,8936,3135,8037,30
Q12005
Q22005
Q32005
Q42005
Q12006
Q22006
90
118
91103 108 110
0,49 0,55 0,49 0,450,36 0,37
Q12005
Q22005
Q32005
Q42005
Q12006
Q22006
182
209
153
183195 200
1,35 1,29 1,26 1,19 1,17 1,12
Q12005
Q22005
Q32005
Q42005
Q12006
Q22006
191
196
186184
186
175
1,651,631,721,691,611,70
Q12005
Q22005
Q32005
Q42005
Q12006
Q22006
MoU APPM (Local currency)
Sonofon KyivstarMobile Norway Pannon
DiGi DTAC GrameenPhone
74
146136131
93
1,992,092,072,432,74
Q12005
Q22005
Q32005
Q42005
Q12006
Q22006
Telenor Pakistan
Mobile Operations
MoU/APPM Development

36
International Mobile Associates
(100% figures in NOK millions according to local GAAP)
Net debt 3)
%-change %-change %-change2005 2006 2005/2006 2005 2006 2005/2006 2005 2006 2005/2006 2005 2006 2006
Europe
One (Austria) 1 482 1 670 13 % 1 372 1 274 -7 % 398 353 -11 % 48 54 4 835
RussiaVimpelCom 4) 30 748 48 053 56 % 3 989 6 269 57 % 1 906 3 232 70 % 1 791 1 308 12 675
1) Subscription figures based on companies own counting methods2) EBITDA consists of earnings before interest, tax, depreciation and amortization excluding gains/(losses) from sales of fixed assets and operations3) Net debt consists of long term and short term interest-bearing debt minus cash. Closing exchange rates used4) VimpelCom CAPEX excludes acquisitions of new entities. 2004-figures are restated.
Mar 31Mar 31 Mar 31 Mar 31
Subscriptions ('000) 1) CAPEX YTD
Mar 31
Revenues YTD EBITDA YTD 2)
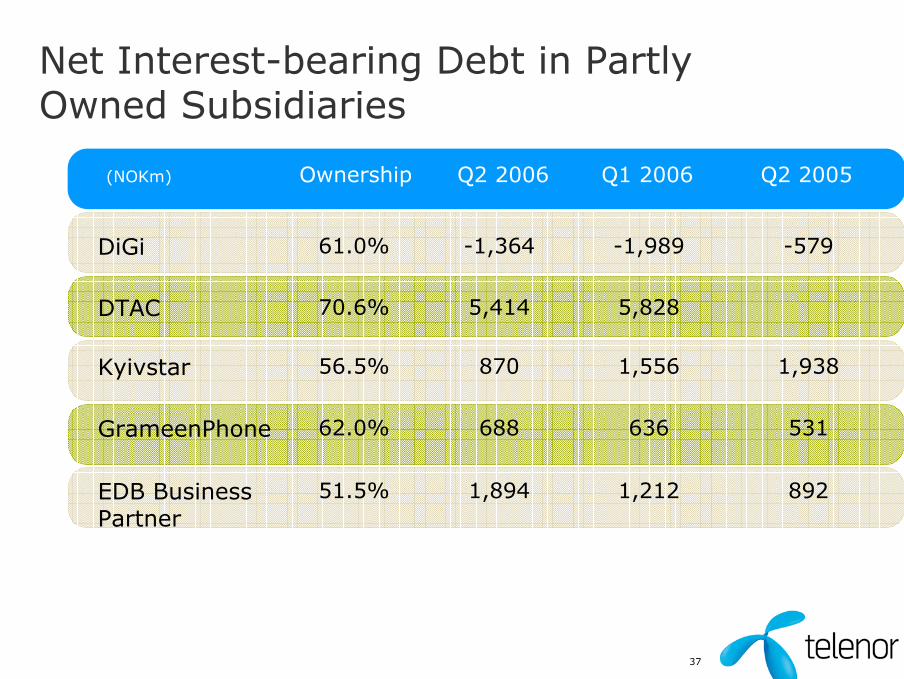
37
Net Interest-bearing Debt in Partly Owned Subsidiaries
8921,2121,89451.5%EDB Business Partner
53163668862.0%GrameenPhone
1,9381,55687056.5%Kyivstar
5,8285,41470.6%DTAC
-579-1,989-1,36461.0%DiGi
(NOKm) Ownership Q2 2006 Q1 2006 Q2 2005