telkom sa soc limited group annual group results ... · group annual results for the year ended 31...
TRANSCRIPT

Group Annual ResultsFor the year ended 31 March
2017
Telkom SA SOC Limited
Group Provisional Annual Resultsfor the year ended 31 March 2017
Telkom SA SOC Limited

www.telkom.co.za
Contents
Overview of our business01 04
Condensed consolidated provisional annual financial statements
04 42
Today’s presentation05 88
Operational data02 24
Financial performance03 28
Telkom SA SOC Limited(Registration number 1991/005476/30)JSE share code: TKG ISIN: ZAE000044897
All statements, other than statements of historical facts, including, among others, statements regarding our convergence and other strategies, future financial position and plans, objectives, capital expenditures, projected costs and anticipated cost savings and financing plans, as well as projected levels of growth in the communications market, are forward-looking statements. Forward-looking statements can generally be identified by the use of terminology such as “may”, “will”, “should”, “expect”, “envisage”, “intend”, “plan”, “project”, “estimate”, “anticipate”, “believe”, “hope”, “can”, “is designed to” or similar phrases, although the absence of such words does not necessarily mean that a statement is not forward looking. These forward-looking statements involve a number of known and unknown risks, uncertainties and other factors that could cause our actual results and outcomes to be materially different from historical results or from any future results expressed or implied by such forward-looking statements. Factors that could cause our actual results or outcomes to differ materially from expectations include, but are not limited to, those risks identified in Telkom’s most recent annual report, which is available on Telkom’s website at www.telkom.co.za/ir.
We caution you not to place undue reliance on these forward-looking statements. All written and verbal forward looking statements attributable to us, or persons acting on our behalf, are qualified in their entirety by these cautionary statements. Moreover, unless we are required by law to update these statements, we will not necessarily update any of these statements after the date of this document, so that they conform either to the actual results or to changes in our expectations.
The information contained in this document is also available on Telkom’s investor relations website www.telkom.co.za/ir.
Telkom SA SOC Limited is listed on the JSE Limited. Information contained on financial market platforms is provided by a third party and is not incorporated by reference herein. Telkom has not approved or verified such information and does not accept any liability for the accuracy of such information.
Special note regarding forward-looking statementsMany of the statements included in this document, as well as verbal statements that may be made by us or by officers, directors or employees acting on our behalf, constitute or are based on forward-looking statements.
Board approval
The condensed consolidated provisional annual financial statements were authorised for issue by the board of directors of Telkom (board) on 1 June 2017.
Auditors’ report
This summarised report is extracted from audited information, but is not itself audited. The annual financial statements were jointly audited by Ernst and Young Inc and Nkonki Inc who expressed an unmodified opinion thereon. The audited annual financial statements and the auditors’ report thereon are available for inspection at the company’s registered office. The directors take full responsibility for the preparation of the preliminary, provisional or abridged report and the financial information has been correctly extracted from the underlying annual financial statements.
Preparer and supervisor of condensed consolidated provisional annual financial statements.
These prepared condensed consolidated provisional annual financial statements were supervised by the group chief financial officer, DJ Fredericks, CA(SA), Bcompt(Hons), ACMA(UK), Honours in Business Management.

Overview of our business 4 Telkom group provisional annual results 2017 5
01 Overviewof our business
Message from group CEO: Sipho Maseko
We made significant strides in a difficult operating environment which was characterised by regulatory uncertainty, increased competition and a weak economic environment.
I am pleased with our solid performance, which was boosted by the integration of BCX and the robust performance of our Mobile business. We accelerated our capital investment to ensure future growth, focusing on fibre roll-out and our Mobile business. We have now created the implementation capability to support our strategic growth areas.
Openserve continues to lead in the fibre market with more than 2.2 million premises passed with fibre. This is underpinned by increased investment, improved operational efficiencies in network roll-out and more streamlined processes. We will continue to focus on upgrading the legacy network to state of the art new technologies.
The Mobile business continued to be the star performer of the group, and delivered service revenue growth of 38.4 percent and EBITDA of R660 million after four years of recording EBITDA losses. This was a result of an expansion in our network, extension of our distribution channels and the launch of innovative products.
BCX remains a key growth platform for the group. The integration of our Enterprise business with BCX is complete and a new brand, “BCX”, was launched. We have a singular sales team and a unified go-to-market strategy. We began to win new customers in the public, retail, banking and financial services sectors against credible competitors as we leveraged off our ability to offerend-to-end solutions. BCX consolidated the basic cloud services and created a single platform to deliver cloud services. BCX strengthened its data centre capabilities to include Oracle and launched Cisco hosted collaboration solutions and SAP HANA Enterprise cloud services.
Customer experience remains important to us and is an ongoing journey. We continued to focus on our systems and processes to improve customer experience. Our improved IT systems contributed in enhancing customer experience by reducing systems response time, increasing self service via mobile apps, and reducing the multiple steps in the approval process for customers. The process redesign enabled us to improve our assurance, fulfilling and billing processes.
To ensure we remain relevant in a continually changing information and communications technology (ICT) environment, we heightened our efforts in talent management. We are investing in our employees at all levels to ensure we have the right sets of skills in the company. We believe our focus on talent management will ensure the sustainability of our business.
Sipho MasekoGroup chief executive officer

Overview of our business 6 Telkom group provisional annual results 2017 7
9.8%
40 970
37 325
Net operating revenue
Keyindicators
1 519
Cash at the end of the year
0.3%40.2%
43.3%
10 941
8 654
10 969
6 040
2 542
R million
20 000
15 000
10 000
5 000
0EBITDA
R million
12 000
9 000
6 000
3 000
0Capital expenditure
R million
4 000
3 000
2 000
1 000
0
2016 2017
38.4%
3 498
12 147
7 554
2 528
11 477
4 430
70.5%5.8%R million
12 000
9 000
6 000
3 000
0Data revenue
R million
800
600
400
200
0Information technology revenueMobile service revenue
R million
4 000
3 000
2 000
1 000
0
Financial capital
Solid performance in a tough environmentKey highlights
Strong revenue growth boosted by BCX and the Mobile businessOperating revenue grew 9.8 percent to R41.0 billion boosted by the full consolidation of BCX in the year, along with the solid performance of our Mobile business. Net revenue growth of 7.9 percent was positively impacted by the reclassification of BCX cost of sales as part of the change of the group accounting policy.
BCX was consolidated for the full year compared to seven months’ revenue in the prior year. The Mobile service revenue accelerated by 38.4 percent driven by a 47.7 percent increase in active customers as the demand for our mobile services heightens.
Cents/share
800
600
400
200
0
1.5%
749.1
731.4
760.2
650.9
12.4%
R million
40 000
30 000
20 000
10 000
0Operatingrevenue
7.9%
31 854
29 521
HEPSBEPS
All commentary, messaging and indicators in this report exclude voluntary early retirement packages (VERPs) and voluntary severance packages (VSPs) of R66 million and the related tax impact of R13 million. The comparative numbers exclude voluntary early retirement and severance packages of R2 193 million and the related tax impact of R517 million.
> Operating revenue up 9.8% to R41.0 billion
> EBITDA flat at R10.9 billion with an
EBITDA margin of 26.7%
> Headline earnings per share (HEPS)
increased 12.4% to 731.4 cents
> Capex increased 43.3% to R8 654 million with capex to revenue of 21.1 percent
> Annual dividend increased 56.3 percent to 422.0 cents per share
> Net revenue up 7.9% to R31.9 billion

Overview of our business 8
Group EBITDA was flat despite a six percent inflation environmentGroup EBITDA was stable at R10.9 billion with an EBITDA margin of 26.7 percent in a six percent inflation environment. We continued to see efficiencies from our service fees and operating lease expenses as a result of cost-saving initiatives from our ongoing business transformation. These savings were partially offset by an increase in selling, general and administration (SG&A) costs relating to outsourcing of our shared services and increased maintenance costs as we accelerate the deployment of our network and improve service levels.
HEPS up on improved operating profitsHEPS grew 12.4 percent to 731.4 cents. Basic earnings per share (BEPS) declined 1.5 percent to 749.1 cents. The main difference between HEPS and BEPS is the gain from propery sales.
Accelerated investment for future growthCapex increased 43.3 percent to R8 654 million with capex to revenue of 21.1 percent, ahead of our guidance but in line with our strategic focus. The largest portion of our capex was deployed to our primary revenue generating areas, which are our fibre deployment zones and supporting the acceleration of our mobile growth.Our unrelenting investment drive for fibre and mobile has now created the required momentum to support our strategic growth areas.
Fibre to the premises remains our key priority. We increased the number of premises passed to over 2.2 million, providing high-speed broadband connectivity using next generation broadband access network. This is an increase of 44.2 percent from the 1.5 million premises recorded in the prior year.Mobile investment was accelerated as we
re-farmed our 1 800 MHz spectrum to expand our LTE services to smartphones. We invested in our mobile network by expanding the number of integrated base stations by 12.1 percent to 2 986 and increased capacity in existing sites to cater for the increase in data traffic growth.
Sufficient cash and cash equivalents Group cash balances at year end declined 40.2 percent to R1.5 billion compared to the prior year as a result of increased cash outflows relating to increased dividend payment, VSPs and VERPs payments, and a significant capital investment.
We have sufficient cash balances and othershort-term investments to fund our annual dividend of 422.0 cents per share in line with our dividend policy of paying 60 percent of annual headline earnings.
Strong balance sheet to fund future growthOur net debt to EBITDA ratio remains low at 0.5 times, below our guidance of one times, providing us with sufficient capacity to invest for future growth.
Financial capital - continued

Overview of our business 10 Telkom group provisional annual results 2017 11
Productive capital
Openserve investing for future growthWe were able to accelerate our investment to modernise the network by covering multiple fibre connection points to homes, businesses, cabinets and base stations to ensure that we maintain and grow our market share in the fibre market.
We made significant inroads in our strategy to modernise our network having passed more than 2.2 million premises with fibre. This was underpinned by an increase in capital investment, improved efficiencies in network roll-out, and more streamlined processes. We continue to lead in the fibre market, providing high speed Next Generation Broadband Access with over 149 000 kilometers of fibre deployed.
Customer experience remains a top priority to us. With our internal big data analytics services, we are able to accurately predict problems and have better access to information that allows us to have a more proactive approach to managing our network. Several initiatives underpin this drive which include the implementation of the digital
technician concept, improving our dispatching methodology and ensuring quality productivity. The aim is to improve customer satisfaction and improve internal efficiencies by driving the first-time right principle. We will continue to improve our fulfilling and assurance processes.
The number of homes passed with fibre increased by 169.7 percent to 219 825 homes as we improved our deployment approach and focusing on gated communities and key suburbs. Of this, 40 627 benefited from our network accelerated refresh programme. This translates to a connectivity rate of 18 percent compared to10.0 percent in the prior year. Our connectivity rate was higher this year, at approximately 23.4 percent reflecting our increased efforts to commercialise our network. This was also supported by an extension of our fibre resellers, which increased to 144.
We increased the number of fibre end-point connections to businesses to 52 755. This allowed us to provide multiple services with high-speed links to all major corporates in South Africa, catering for their major site requirements as well as lower-speed fibre-based Metro-Ethernet links, for the branch connectivity. This sound performance was driven by an increased demand and uptake in fibre solutions as customers increasingly see fibre as a cost-effective, high bandwidth medium that fulfills both their current and future needs.
We increased the number of fibre links to base stations to 5 928, which provide services to mobile players. Our pricing and engagement strategy continues to limit self-provisioning, resulting in an increase in orders from our customers. The strategy stimulates growth in our Megaline circuits and other products that service the requirements of our clients at the base stations.
While we drive the fibre roll-out, we continue to see a market need for using our existing network, enabling access to internet at the required speeds. To this end, we have seen an increase in fibre to the cabinet by 37.2 percent to approximately 2.0 million.

Overview of our business 12 13
The merger of Enterprise and BCX has increased the gross profit and EBITDA margin, as the Enterprise business historically operated at higher margins. EBITDA margins increased from 7 percent in FY2016 (BCX prior to the merger) to 15 percent in FY2017 (combined entity). The Enterprise business contributed approximately R5 billion in revenue to BCX.
BCX consolidated the basic cloud services and created a single platform to deliver cloud services that are syndicated from independent software vendors and hyperscale providers and consume our own from BCX data centres. We strengthened our data centre capabilities to include Oracle and launched Cisco hosted collaboration solutions and SAP HANA Enterprise cloud services. The BCX platform provides cloud solutions that allow the provisioning and billing of infrastructure as a service, platform as a service, and software as a service. BCX believes that the simplicity of how customers can manage their own accounts using this platform allows for quicker adoption and our ability to up-sell and cross-sell.
SUCCESSFUL INTEGRATION OF ENTERPRISE WITH BCX With the integration of Telkom Enterprise and BCX in November 2016, the sales teams and leadership team of both organisations were integrated into a single point of contact for our public and corporate enterprise sector customers.
Opportunities are being identified to cross-sell information technology and connectivity solutions in the new combined customer base. The integrated business has the ability to deliver end-to-end digital solutions to its customers, with unmatched data centre capabilities and a strong network offering. Synergistic benefits of the integration are evident in key deals won recently, mostly in the public, retail, banking and financial services sectors. These deals would normally necessitate striking partnerships with various entities, given the scope of the needs of our customers.

Overview of our business 14 Telkom group provisional annual results 2017 15
Mobile driving growth in Consumer segmentThe Mobile business recorded service revenue growth of 38.4 percent driven by an increase in the active subscriber base as result of an expansion in our network, extension of our distribution channels, increased store footprint and innovative products launched during the year, such as FreeMe (for individuals) and FreeMe Family (for families and small businesses), which are primarily data offerings.
The active subscriber base grew by 47.7 percent to approximately 4 million with a blended average revenue per user (ARPU) stable at R89. Our post-paid subscribers increased 54.5 percent to 1.2 million with an ARPU of R181 supported by FreeMe. This popular product was well received with Tarifica pronouncing FreeMe packages as the top choice for high data and voice users in South Africa. Of our post-paid subscribers, 13 percent use FreeMe, of which 79.0 percent are new customers. On the back of this successful product, we launched FreeMe Family in February 2017, which allows subscribers to share their data bundles with up to nine members of their families or in a small business. FreeMe Family strives to consolidate the mobile telecommunications spend for families, and is a single contract for families or small businesses with easy sharing options on voice and data.
Our mobile broadband led strategy delivered a strong performance with mobile data revenue increasing 49.6 percent to R2.4 billion supported by an increase of 44.6 percent in mobile broadband subscribers to 2.6 million. Following the re-farming of our 1 800 MHz spectrum to extend our LTE offering to smartphones, we observed a good growth of 45.7 percent in our smartphone base to 1.9 million. Our nomadic LTE offering continued to grow mainly driven by our popular “Deals of the Month” smart broadband and the uncapped offerings. Our LTE strategy will continue to offer higher bundles and greater customer value propositions.
The fixed-line business saw good growth in fibre subscribers, which was a combination of both migration from ADSL and new customers. Even though we are still experiencing churn in ADSL, this was offset by an increase in demand for higher speeds and larger uncapped data. The integrated data services (IDS) SIM allows the customer to use a percentage of the SoftCap data from a mobile device.
For the small business unit, we invested in creating capabilities and introducing solutions to improve overall customer experience. During the year, we launched various innovative products with customer needs in mind such as “Voice and Data Failover” and “Smart Virtual Office Solutions”. Voice and Data Failover was developed to provide customers with back-up functionality, if the fixed-line becomes faulty, to ensure no disruptions. Smart Virtual Office Solutions was introduced to help businesses grow their footprint without set-up costs. The solution enables the customer to have various
Productive capital - continued
virtual telephone numbers linked to different local area codes, to effectively market themselves anywhere, and gives peace of mind to customers who feel more comfortable with dealing with a company that has a local presence.
With our focus on customer experience improvements, we simplified our channel interactions with our call centres, stores and online. We implemented account management capabilities for selected customers. Telkom Direct Stores’ answering service functionality was established, resulting in 118 000 calls handled, leaving more time for agents to effectively handle sales in the stores and concentrate on customer experience. We improved our operational issues with the fulfillment of orders, and installation time between customers placing an order and service reduced significantly.

Overview of our business 16 Telkom group provisional annual results 2017 17
Intellectualcapital – IT systems supporting customer experience
We continued to upgrade our IT systems with our focus on customer demands and innovative ICT solutions.
The Telkom Consumer integrated fixed and mobile platform is complete. This will allow customers to view their account for fixed and mobile usage in one statement. In turn, our business units can use customer value management in a more comprehensive and efficient way.
Our IT systems contributed to enhancing customer experience by introducing process efficiencies in our stores, reducing
time to capture customer information, credit vetting, and approvals, among others. We introduced a system called VDox, which reduces paper and contract documentation in our Telkom stores. Our applications are automated and paperless, with an application secured using a signature on the screen.
Investment in our IT systems will continue, to ensure a consistent experience across all customer touchpoints, wherever and whenever our customers engage with us. Work is underway to further automate customer touchpoints and interfaces into the new backend systems to deliver a more seamless and consistent experience.
Humancapital - Focusing on our people
During the year, we focused on talent management,innovative recruitment,succession and performance-based rewards.
We attracted talented senior executives from different backgrounds, the majority of those executives being female.
The conclusion of our 2015 inaugural Bright Young Minds programme led to the placement of seven interns into the business, with effect from 1 March 2017. These interns are structured as an internal consultancy unit to provide innovative thinking and millennial perspective to key strategic projects across the business. The second intake attracted eight interns, who were allocated to key areas in primarily digital and strategic projects.
Through BCX, we partnered with an institution “WeThinkCode” to create a future talent pipeline to address the IT and digital skills gap. Our on going involvement is creating an exciting new pipeline of very young, talented coders to join our business.
Our Female Leadership Development Programme contributes to the improvement of female representation at leadership levels and
forms part of the broader succession planning process. The first group of 42 women will complete the programme in June 2017.
We have made progress on the Performance Pays model. This model, for the bargaining unit, includes a commitment to a new employee incentive scheme which focuses on the impact an individual has on overall customer experience. The scheme affords employees the opportunity to earn an incentive of up to 12 percent of their salary.

Overview of our business 18 19
Social and relationship capital – Generating societal value
The Telkom Foundation’s key focus is education and, in particular, teaching and learning mathematics, science, technology and English through the use of technology via the Telkom Connected Schools programme.
The Telkom Foundation invested R32 million in education initiatives providing supplementary teaching to over 3 900 learners in five provinces and resulted in an average of a 3 to 5 percent improvement in mathematics and science. BCX implemented an IT laboratory in partnership with the League of Friends of the Blind in the Western Cape to allow blind grade 12 learners to write their matric exams with the aid of technology.
Natural capital – Investing in renewable natural resources
Telkom continues to invest in renewable and sustainable forms of natural resources management. Our 3 MW grid-tied solar PV plant became fully operational in July 2016. Since then it has generated in excess of 3.75 MW.
The average daily energy production sufficiently augments Telkom Park’s energy needs during daytime peak electricity demand, with over 4 000 staff, which excludes the data centres.
Our electricity consumption reduced by 9 percent year-on-year, primarily attributable to the implementation of 50 smart meters to measure
FutureMakers programme’s primary objective is to enable the development and growth of qualifying black-owned businesses in the ICT sector by providing financial and non-financial support. We invested R105 million in small and medium enterprise development of these, of which these businesses created 1 102 new jobs. Through our supplier development, we bought back skills from former employees by helping them set up businesses and manage operations. We grew the number of independent field technicians (IFTs) from 3 in the prior year to 40, who employed more than 364 technicians. These IFT companies collectively billed R130 million procurement value. Through our channel development initiative called Future Partner, which is about building sales force capacity through setting up black-owned sales and distribution businesses, 11 black-owned dealers were set up and supported, four black-owned Express stores were built, and 24 internet cafés were set up and are operational. All channel partners sold Telkom products, generating R7.2 million revenue from Telkom.
electricity consumption in key buildings, roll-out of the energy-efficient LED lighting initiative which replaced conventional lighting systems in 900 buildings nationally, and the implementation of a building management system at the head office. This automation system monitors and controls multiple facilities elements including air conditioning, power distribution, lighting and water usage.
At several of our larger sites, water harvesting and recycling plans are well advanced and will enable Telkom to fundamentally lower water consumption in future years.
Going forward, the head office will be able to offer its staff and visitors the use of six electric vehicle charging points, connected to the solar PV plant at no cost. Implementation of air cooled heating, ventilation and air conditioning (HVAC) systems in our head office is underway to reduce the amount of water used for cooling in data centres.
Overview of our business 20 Telkom group provisional annual results 2017 21
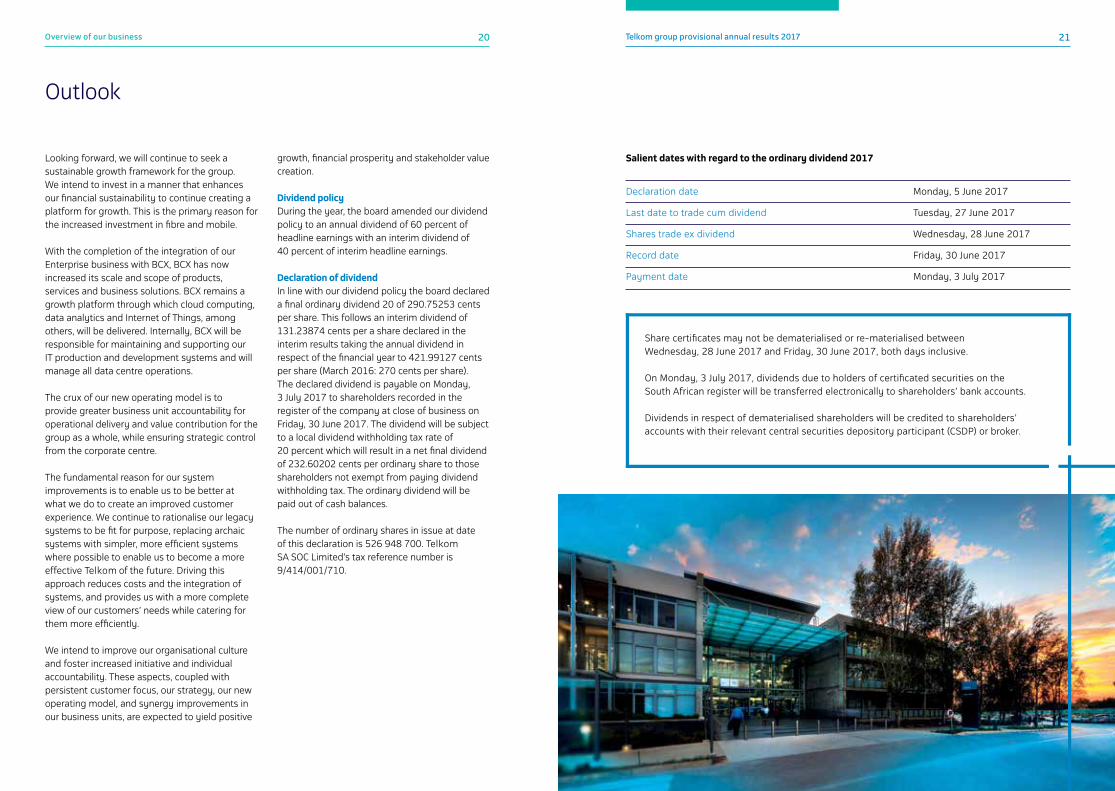
Outlook
growth, financial prosperity and stakeholder value creation.
Dividend policyDuring the year, the board amended our dividend policy to an annual dividend of 60 percent of headline earnings with an interim dividend of 40 percent of interim headline earnings.
Declaration of dividendIn line with our dividend policy the board declared a final ordinary dividend 20 of 290.75253 cents per share. This follows an interim dividend of 131.23874 cents per a share declared in the interim results taking the annual dividend in respect of the financial year to 421.99127 cents per share (March 2016: 270 cents per share). The declared dividend is payable on Monday, 3 July 2017 to shareholders recorded in the register of the company at close of business on Friday, 30 June 2017. The dividend will be subject to a local dividend withholding tax rate of 20 percent which will result in a net final dividend of 232.60202 cents per ordinary share to those shareholders not exempt from paying dividend withholding tax. The ordinary dividend will be paid out of cash balances.
The number of ordinary shares in issue at date of this declaration is 526 948 700. Telkom SA SOC Limited’s tax reference number is 9/414/001/710.
Share certificates may not be dematerialised or re-materialised between Wednesday, 28 June 2017 and Friday, 30 June 2017, both days inclusive.
On Monday, 3 July 2017, dividends due to holders of certificated securities on the South African register will be transferred electronically to shareholders’ bank accounts.
Dividends in respect of dematerialised shareholders will be credited to shareholders’ accounts with their relevant central securities depository participant (CSDP) or broker.
Salient dates with regard to the ordinary dividend 2017
Declaration date Monday, 5 June 2017
Last date to trade cum dividend Tuesday, 27 June 2017
Shares trade ex dividend Wednesday, 28 June 2017
Record date Friday, 30 June 2017
Payment date Monday, 3 July 2017
Looking forward, we will continue to seek a sustainable growth framework for the group. We intend to invest in a manner that enhances our financial sustainability to continue creating a platform for growth. This is the primary reason for the increased investment in fibre and mobile.
With the completion of the integration of our Enterprise business with BCX, BCX has now increased its scale and scope of products, services and business solutions. BCX remains a growth platform through which cloud computing, data analytics and Internet of Things, among others, will be delivered. Internally, BCX will be responsible for maintaining and supporting our IT production and development systems and will manage all data centre operations.
The crux of our new operating model is to provide greater business unit accountability for operational delivery and value contribution for the group as a whole, while ensuring strategic control from the corporate centre.
The fundamental reason for our system improvements is to enable us to be better at what we do to create an improved customer experience. We continue to rationalise our legacy systems to be fit for purpose, replacing archaic systems with simpler, more efficient systems where possible to enable us to become a more effective Telkom of the future. Driving this approach reduces costs and the integration of systems, and provides us with a more complete view of our customers’ needs while catering for them more efficiently.
We intend to improve our organisational culture and foster increased initiative and individual accountability. These aspects, coupled with persistent customer focus, our strategy, our new operating model, and synergy improvements in our business units, are expected to yield positive

Overview of our business 22 Telkom group provisional annual results 2017 23
In order to ensure consistent presentation, the accounting policy for cost of sales was changed to include only expenses directly tied to the sale of goods as cost of sales. The change was implemented across the group and resulted in a reclassification of R2 billion between cost of sales and operating expenses.
Refer to note 2 of the notes to the condensed consolidated provisional annual financial statements for a detailed disclosure on the restatement and reclassification.
The group recorded a reported profit after tax of R3 854 million (March 2016: R2 321 million). This is 66.0 percent higher than the previous year and was mainly as a result of lower VERP and VSP costs of R66 million in the current year compared to R2 193 million in the comparative year.
The comparative information for the year ended 31 March 2016is restated as a result of a prior year correction relating to fraud in Trudon. The impact was a R55 million decline in the profit after tax.
The one-off items above are not part of the results from normal operations for the comparative year under review and have therefore been excluded from the discussion below.
The group recorded a profit after tax excluding VERPs and VSPs of R3 907 million (March 2016: R3 997 million) and a year-on-year flat EBITDA of R10 941 million, resulting in a 12.4 percent increase in headline earnings per share. The increase was mainly driven by a lower tax expense and the inclusion of BCX for a full year.
The financial guidance above has not been reviewed or reported on by our auditors.
* Includes VERP and VSP costs
Revised financial guidance
Reportstructure
Results from continuing operations
Net revenue
Operating revenue
EBITDA margin
Capex to revenue
Net debt to EBITDA
Mobile EBITDA breakeven
Modest growth
23%-25%
15%-18%
≤1x
Achieved
FY2017 FY2017 (Actual) FY2018
+7.9%
26.5%*
21.1%
0.5x
R660 million
n/a
Mid-single digit growth
23%-25%
17%-20%
≤1x
n/a
The group consists of three reportable segments, namely Openserve, Consumer and BCX.
The Openserve segment is Telkom South Africa’s redesigned wholesale and networks division which provides access services.
The Consumer segment provides fixed-line and data communication services through Telkom South Africa, and the Mobile business offers mobile voice services, data services and handset sales through Telkom Mobile.
The BCX segment provides converged infrastructure solutions, information and communication services including cloud, infrastructure, and workspace services; global service integration management; and hardware and network equipment sales in South Africa, seven African countries, the UK and Dubai.
Enterprise business, previously a division of Telkom was integrated with BCX from 1 November 2016 and included in its results accordingly.
The integration enables the Telkom group to offer Enterprise solutions beyond connectivity and is aimed to strengthen Telkom’s leadership in the Enterprise market.
For the period ended 31 March 2016, the Telkom group presented two reportable segments, namely: Telkom and BCX.
For the year under review, the group implemented a more flexible and agile operating and reporting model to manage performance and allocate resources.

Overview of our business 24 Telkom group provisional annual results 2017 25
02 Operational data

Operational data 26 27Telkom group provisional annual results 2017
1. Includes 7 963 (March 2016: 8 258) internal lines.2. Includes Telkom Internet ADSL, ISDN and WiMAX subscribers. 3. Excludes Telkom internal lines.4. Based on a subscriber who has participated in a revenue-generating activity within the last 90 days. 5. Based on number of Telkom company employees, including the impact of the 1 180 Enterprise employees that were moved to BCX, excluding subsidiaries. 6. Includes the 1 180 Enterprise employees that were moved from Telkom company to BCX.
Operational data March 2017
March2016 %
Customers
Broadband subscribers1 1 003 521 1 027 507 (2.3)
Mobile broadband subscribers 2 637 682 1 823 668 44.6
Closer subscribers 791 965 838 258 (5.5)
Internet all access subscribers2 555 112 574 460 (3.4)
Fixed access line (‘000)3 2 954 3 217 (8.2)
Revenue per fixed access line (ZAR) 4 266 4 728 (9.8)
Total fixed-line traffic (millions of minutes) 13 579 14 918 (9.0)
Active mobile subscribers4 3 998 613 2 706 687 47.7
Pre-paid 2 771 804 1 912 415 44.9
Post-paid 1 226 809 794 272 54.5
ARPU (Rand) 89.14 89.44 (0.3)
Pre-paid 49.12 51.46 (4.5)
Post-paid 181.41 181.69 (0.2)
Pre-paid churn % 50.0 55.1 5.1
Post-paid churn % 12.0 11.0 (1.0)
Managed data network sites 46 485 47 492 (2.1)
Group employees 18 847 20 341 (7.3)
Telkom company employees5 10 743 13 766 (22.0)
BCX group employees6 7 460 5 904 26.4
Trudon employees 508 540 (5.9)
Swiftnet employees 136 131 3.8
Network
Ports activated via MSAN access 1 329 450 1 077 939 23.3
Fibre to home 219 825 81 503 169.7
Fibre to cabinet 1 991 449 1 451 986 37.2
Mobile sites integrated 2 986 2 663 12.1
LTE sites integrated 1 677 1 448 15.8

Overview of our business 28 Telkom group provisional annual results 2017 29
03 Financial performance
Financial performance 30 31Telkom group provisional annual results 2017
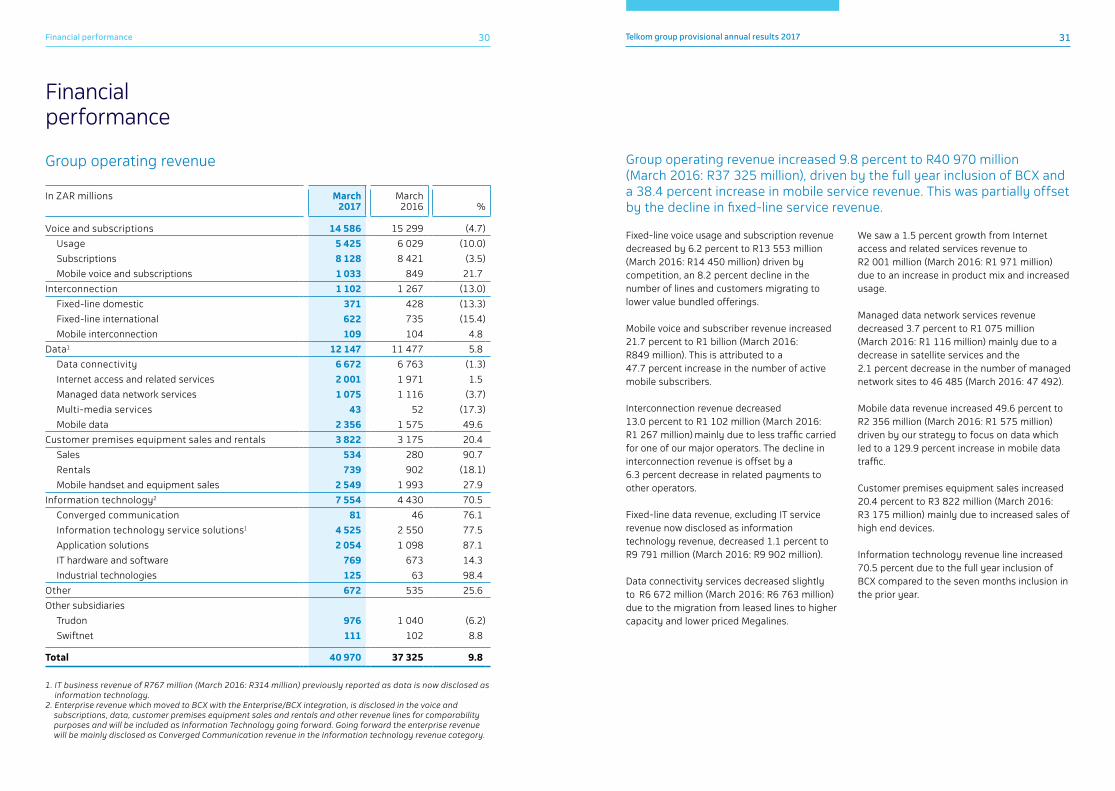
Fixed-line voice usage and subscription revenue decreased by 6.2 percent to R13 553 million (March 2016: R14 450 million) driven by competition, an 8.2 percent decline in the number of lines and customers migrating to lower value bundled offerings.
Mobile voice and subscriber revenue increased 21.7 percent to R1 billion (March 2016: R849 million). This is attributed to a 47.7 percent increase in the number of active mobile subscribers.
Interconnection revenue decreased 13.0 percent to R1 102 million (March 2016: R1 267 million) mainly due to less traffic carried for one of our major operators. The decline in interconnection revenue is offset by a 6.3 percent decrease in related payments to other operators.
Fixed-line data revenue, excluding IT service revenue now disclosed as information technology revenue, decreased 1.1 percent to R9 791 million (March 2016: R9 902 million).
Data connectivity services decreased slightly to R6 672 million (March 2016: R6 763 million) due to the migration from leased lines to higher capacity and lower priced Megalines.
We saw a 1.5 percent growth from Internet access and related services revenue to R2 001 million (March 2016: R1 971 million) due to an increase in product mix and increased usage.
Managed data network services revenue decreased 3.7 percent to R1 075 million (March 2016: R1 116 million) mainly due to a decrease in satellite services and the 2.1 percent decrease in the number of managed network sites to 46 485 (March 2016: 47 492).
Mobile data revenue increased 49.6 percent to R2 356 million (March 2016: R1 575 million) driven by our strategy to focus on data which led to a 129.9 percent increase in mobile data traffic.
Customer premises equipment sales increased 20.4 percent to R3 822 million (March 2016: R3 175 million) mainly due to increased sales of high end devices.
Information technology revenue line increased 70.5 percent due to the full year inclusion of BCX compared to the seven months inclusion in the prior year.
In ZAR millions March 2017
March2016 %
Voice and subscriptions 14 586 15 299 (4.7)
Usage 5 425 6 029 (10.0)
Subscriptions 8 128 8 421 (3.5)
Mobile voice and subscriptions 1 033 849 21.7
Interconnection 1 102 1 267 (13.0)
Fixed-line domestic 371 428 (13.3)
Fixed-line international 622 735 (15.4)
Mobile interconnection 109 104 4.8
Data1 12 147 11 477 5.8
Data connectivity 6 672 6 763 (1.3)
Internet access and related services 2 001 1 971 1.5
Managed data network services 1 075 1 116 (3.7)
Multi-media services 43 52 (17.3)
Mobile data 2 356 1 575 49.6
Customer premises equipment sales and rentals 3 822 3 175 20.4
Sales 534 280 90.7
Rentals 739 902 (18.1)
Mobile handset and equipment sales 2 549 1 993 27.9
Information technology2 7 554 4 430 70.5
Converged communication 81 46 76.1
Information technology service solutions1 4 525 2 550 77.5
Application solutions 2 054 1 098 87.1
IT hardware and software 769 673 14.3
Industrial technologies 125 63 98.4
Other 672 535 25.6
Other subsidiaries
Trudon 976 1 040 (6.2)
Swiftnet 111 102 8.8
Total 40 970 37 325 9.8
1. IT business revenue of R767 million (March 2016: R314 million) previously reported as data is now disclosed as information technology.
2. Enterprise revenue which moved to BCX with the Enterprise/BCX integration, is disclosed in the voice and subscriptions, data, customer premises equipment sales and rentals and other revenue lines for comparability purposes and will be included as Information Technology going forward. Going forward the enterprise revenue will be mainly disclosed as Converged Communication revenue in the Information technology revenue category.
Group operating revenue
Financial performance
Group operating revenue increased 9.8 percent to R40 970 million (March 2016: R37 325 million), driven by the full year inclusion of BCX and a 38.4 percent increase in mobile service revenue. This was partially offset by the decline in fixed-line service revenue.

Financial performance 32 33Telkom group provisional annual results 2017
In ZAR millions March 2017
March2016 %
Telkom 634 1 229 (48.4)
Business Connexion 57 16 256.3
Other
Trudon 41 34 20.6
Swiftnet 2 2 -
Total 734 1 281 (42.7)
In ZAR millions March 2017
March2016 %
Payments to other operators 2 618 2 793 6.3
Direct cost 1 438 965 (49.0)
Cost of sales (excluding direct cost) 5 060 4 046 (25.1)
Total 9 116 7 804 (16.8)
Other income includes profit on the disposal of investments, property, plant and equipment, interest received from debtors and sundry income.
The decrease in other income is mainly attributable to lower gains from the sale of properties of R487 million when compared to the year ended 31 March 2016.
Group direct expenses increased 16.8 percent to R9.1 billion as a result of the full year consolidation of BCX and higher direct costs as a result of an increase in mobile subscribers connected.
Group operating expenses including depreciation, amortisation, impairments and write-offs increased by 7.8 percent to R27 308 million (March 2016: R25 331 million).
Employee expenses increased 5.3 percent to R10 496 million (March 2016: R9 972 million) due to the full year inclusion of BCX. The Telkom group headcount decreased 7.3 percent to 18 847 full-time employees. In Telkom company no increases were granted to bargaining unit and management employees during the year under review. A performance pay structure was implemented for the bargaining unit with an average incentive payment of 5.7 percent.
Group other income
Group direct expenses
In ZAR millions March 2017
March2016 %
Employee expenses 10 496 9 972 (5.3)
Salaries and wages 8 225 7 942 (3.6)
Benefits 2 875 2 491 (15.4)
Employee related expenses capitalised (604) (461) 31.0
Selling, general and administrative expenses 7 237 5 796 (24.9)
Materials and maintenance 3 620 3 050 (18.7)
Marketing 817 824 0.8
Bad debts 463 311 (48.9)
Other* 2 337 1 611 (45.1)
Service fees 2 869 2 965 3.2
Property management 1 842 1 704 (8.1)
Consultants, security and other 1 027 1 261 18.6
Operating leases 1 045 1 100 5.0
Buildings 550 607 9.4
Transmission and data lines 159 17 (835.3)
Equipment 31 50 38.0
Vehicles 305 426 28.4
Depreciation, amortisation, impairments and write-offs 5 661 5 498 (3.0)
Depreciation 4 752 4 448 (6.8)
Amortisation 766 880 13.0
Impairment and write-offs 143 170 15.9
Total 27 308 25 331 (7.8)
Group operating expenses
* Mainly expenses from BCX.

Financial performance 34 35Telkom group provisional annual results 2017
Selling, general and administrative expenses increased 24.9 percent to R7 237 million (March 2016: R5 796 million) mainly due to the full year inclusion of BCX and cost relating to increased outsourcing cost.
Service fees decreased 3.2 percent to R2 869 million (March 2016: R2 965 million) largely due to transformation expenses recorded in the prior year.
Operating leases decreased 5.0 percent to R1 045 million (March 2016: R1 100 million). The 28.4 percent decrease in vehicle leases was mainly attributed to the decrease in the number of vehicles leased.
Depreciation, amortisation, write-offs and impairments increased 3.0 percent to R5 661 million (March 2016: R5 498 million) due to accelerated depreciation as we intensify our roll-out of fibre and LTE as new technologies and higher asset write-offs.
Investment incomeInvestment income consists of interest received on short-term investments and bank accounts. Investment income increased by 7.9 percent to R219 million (March 2016: R203 million) as a result of increased interest received by the group.
Finance charges and fair value movementsFinance charges include interest paid on local and foreign borrowings, amortised discounts on bonds and commercial paper bills, fair value gains and losses on financial instruments, the cell captive and foreign exchange gains and losses on foreign currency denominated transactions and balances.
Foreign exchange and fair value movements increased to a loss of R270 million (March 2016: R101 million loss). This increase was mainly a result of a stronger than anticipated currency market partially offset by a higher fair value gain of R153 million (March 2016: R9 million) on revaluation of the underlying assets held by the cell captive.
TaxationThe reported tax expense increased by 28.4 percent to R691 million (March 2016: R538 million). The higher 2017 expense was mainly as a result of an increase in profits.
The normalised tax expense reduced by33.3 percent to R704 million (March 2016: R1 055 million) and excludes the tax benefit of R13 million (March 2016: R517 million) on the voluntary severance and retrenchment expenses of R66 million (March 2016: R2 193 million).
Consolidated statement of financial positionDespite the increase in net debt, including financial assets and liabilities, to R5 020 million from R1 373 million as at 31 March 2016 our group’s capital structure remains strong with a net debt to EBITDA ratio of 0.5 times.
On 31 March 2017, the group had cash balances, including other financial assets and liabilities, of R1 204 million (March 2016: R3 841 million). Our group cash balances decreased mainly due to higher dividends paid and an increase in capital expenditure in line with our strategy. We remain lowly geared with a comfortable debt maturity profile.
Free cash flow excluding VERPs and VSPs decreased 103.5 percent predominately; due to an increase in capital expenditure as we focus on our fibre and LTE roll-out and higher tax paid.
Group operating expenses - continued Free cash flow
In ZAR millions March 2017
March2016 %
Cash generated from operations before dividends paid 7 713 8 103 (4.8)
Add back: VERP and VSP cost paid 629 1 688 (62.7)
Adjusted cash generated from operations 8 342 9 791 (14.8)
Cash paid for capital expenditure (8 479) (5 891) (43.9)
Free cash flow (137) 3 900 (103.5)

Financial performance 36 37Telkom group provisional annual results 2017
In ZAR millions March 2017
March2016 %
Fibre 2 392 1 310 82.6
Mobile 1 936 660 193.3
OSS/BSS programme 741 544 36.2
Network rehabilitation/sustainment 567 674 (15.9)
Service on demand 1 251 1 540 (18.8)
Core network 962 273 252.4
Other 349 760 (54.1)
Telkom 8 198 5 761 42.3
BCX 366 139 163.3
Other
Acajou 7 - 100.0
Trudon 9 13 (30.8)
Swiftnet 26 26 -
Capital expenditure included in PPE 8 606 5 939 44.9
Capital inventory 48 101 (52.5)
Total 8 654 6 040 43.3
Our capital expenditure programme focuses on the growth areas of our businesses, which include fibre, mobile, LTE and cost and operational efficiencies emanating from network rehabilitation and our business support/operational support systems (OSS/BSS) programme.
Group capital expenditure, which includes spend on intangible assets, increased 43.3 percent to R8 654 million (March 2016: R6 040 million) mainly as a result of an acceleration of our fibre and mobile roll-out and represents 21.1 percent of group operating revenue (March 2016: 16.2 percent).
The fibre expenditure increased 82.6 percent to R2 392 million (March 2016 : R1 310 million) and is in line with our strategy as we continue to focus on fibre as a key priority. The disclosure for 31 March 2016 only included expenditure on access and was changed in the current year to include backbone as well.
Mobile capital expenditure increased 193.3 percent to R1 936 million (March 2016: R660 million), due to the focus on continued LTE deployment, for the provision of fixed wireless access via LTE and mobile LTE products, and is intended to project and grow our customer base. OSS/BSS programme expenditure increased 36.2 percent to R741 million (March 2016: R544 million) and is focused on OSS/BSS to ensure fulfillment assurance and billing requirements relating to our product portfolio. The next generation network OSS/BSS programme will continue to focus on the improvement of operational efficiencies and will support the launch of next generation products.
Network rehabilitation and sustainment category expenditure of R567 million (March 2016: R674 million) was largely linked to the replacement of obsolete or end-of-life network elements and for the rehabilitation of
ageing access network routes. This will improve service levels and reduce the cost to maintain the end-of-life equipment.
Service on Demand (SOD) expenditure decreased 18.8 percent to R1 251 million (March 2016: R1 540 million). Service on Demand provides network “last-mile” connectivity and the related customer premises equipment to fulfill customer orders where the underlying base network is already in place. Each SOD project is individually evaluated to ensure a positive return. Revenue growth would be mainly limited to key data products such as data services, including Metro-Ethernet based products, the virtual private network (VPN) product-suite, Asymmetrical Digital Subscribers Line (ADSL), internet services and wholesale leased lines.
The core network expenditure increased to R962 million (March 2016: R273 million) and is related to the continued roll-out of the next generation network.
The 54.1 percent decrease in other capital expenditure of R349 million (March 2016: R760 million) is mainly attributable to the Centurion campus optimisation expenses incurred in the prior year.
Group capital expenditure

Financial performance 38 39Telkom group provisional annual results 2017
March 2017
March2016
Operating revenue 13 977 4 810
Converged communication 4 808 46
Information technology service solutions 5 515 2 930
Application solutions 2 126 1 098
IT hardware and software 1 403 673
Industrial technologies 125 63
Payments to other operators 48 -
Direct cost 173 -
Cost of sales* 2 563 1 479
Net revenue 11 193 3 331
Other income 57 16
Operating expenses 9 132 2 994
EBITDA 2 118 353
Depreciation, amortisation, impairment and write-off’s 333 140
Operating profit 1 785 213
Profit after tax for the year 1 065 132
Below are the results of BCX for the year ended 31 March 2017 (before inter-group eliminations). The current financial year figures reflect a full year of BCX (before integration) and five months of Telkom Enterprise following the integration of these businesses on 1 November 2016. In the prior year BCX only reported seven months.
The merger with Telkom Enterprise increased gross profit and EBITDA margins, as the Enterprise business historically operated at higher margins. EBITDA margins increased from 7 percent in FY2016 to 15 percent in FY2017. The enterprise integration contributed revenue of approximately R5 billion during the financial year.
BCX was not shielded from the unstable economic environment in South Africa and the rest of Africa where BCX group has a footprint. However we have seen appetite for digitalisation of business processes to improve efficiency and customer service across our customer base and have successfully delivered enterprise integration platform services in the current year, positively impacting our performance. BCX has also delivered phase 1 of a digitalisation project in the health sector, expected to improve service delivery efficiencies to citizens.
In the year under review, BCX increased its Oracle capability and offering, increasing our year-on-year IT service revenue. Application Solutions includes BCX owned IP, such as LARA and Persal. Current year performance has improved due to application implementations at key municipalities.
BCX has seen wins in infrastructure upgrades, distributed networks, asset monitoring and analytics.
IT hardware and software sales has performed well during the financial year due to sale of ancillary products mainly in the Public sector segment.
Converged Communication includes the Enterprise business.
Annexure A
* BCX cost of sales has been reclassified to align with the group.

Telkom group provisional annual results 2017Financial performance 40
Converged communications Converged communication refers to a suite of voice, data, converged bundles, business add-on and tailored deals comprising of existing products and services from the fixed, mobile and cloud portfolios.
IT services IT services refers to the application of business and technical expertise to enable corporate enterprises to create, access, manage, and optimise information technology and IT-focused business processes. This broadly includes cloud services, solutions and enablement; IT managed services; business solutions; and business process outsourcing.
Application solutions Application solutions is inclusive of hosted application development, application management, application consulting and application customisation. Applications can cross Native or Web-based solutions. Given its key importance, security is invariably integrated into solutions, particularly mobile applications.
IT hardware and software The sell-through of hardware and software with no service management, financial management or SLA attached. Hardware can include servers, storage, workstations, PCs, laptops, tablets, printers and other IT equipment.
Industrial technologies Industrial technologies refers to the use of converged connectivity, IT services, IT integration and IT business process automation in order to produce industrial and manufacturing execution systems, IT, IoT/M2M and Plant Automation solutions.
BCX revenue definitions:

Overview of our business 42 Telkom group provisional annual results 2017 43
04 Condensed consolidated provisional annual financial statements
Condensed consolidated provisional annual financial statements 44 45Telkom group provisional annual results 2017
Notes2017
Rm
Restated 2016
Rm
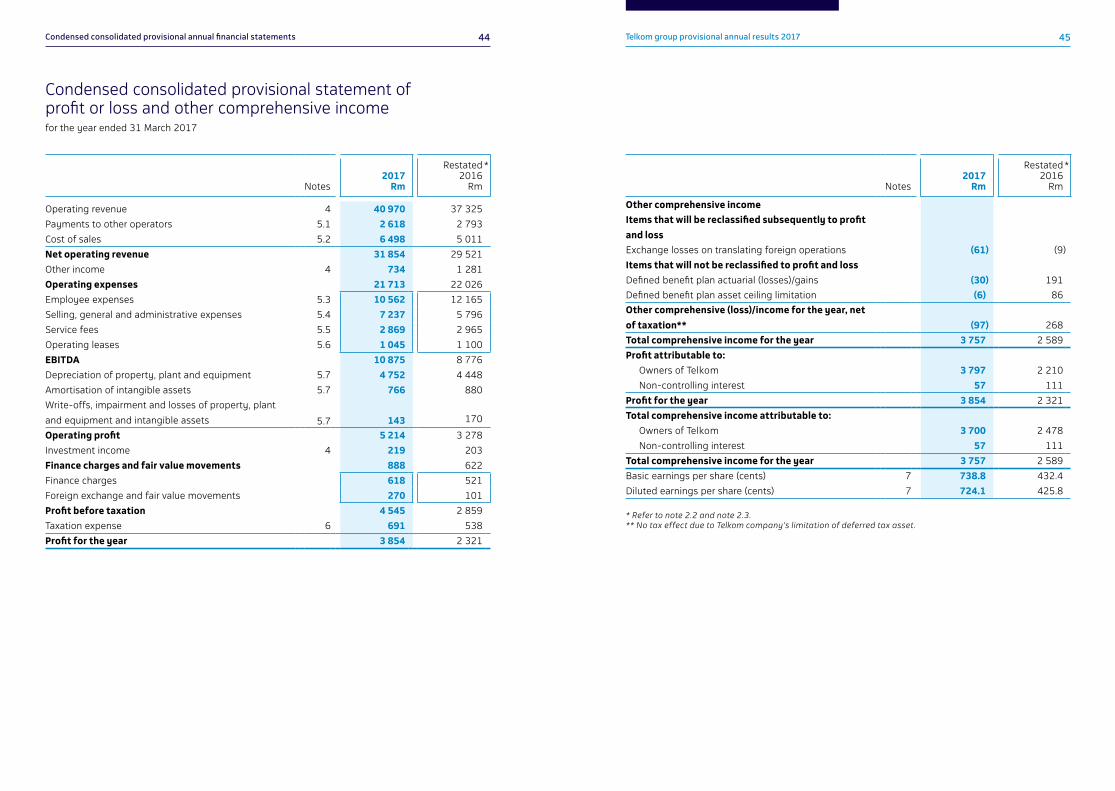
Other comprehensive income
Items that will be reclassified subsequently to profit
and loss
Exchange losses on translating foreign operations (61) (9)
Items that will not be reclassified to profit and loss
Defined benefit plan actuarial (losses)/gains (30) 191
Defined benefit plan asset ceiling limitation (6) 86
Other comprehensive (loss)/income for the year, net
of taxation**
(97) 268
Total comprehensive income for the year 3 757 2 589
Profit attributable to:
Owners of Telkom 3 797 2 210
Non-controlling interest 57 111
Profit for the year 3 854 2 321
Total comprehensive income attributable to:
Owners of Telkom 3 700 2 478
Non-controlling interest 57 111
Total comprehensive income for the year 3 757 2 589
Basic earnings per share (cents) 7 738.8 432.4
Diluted earnings per share (cents) 7 724.1 425.8
* Refer to note 2.2 and note 2.3.** No tax effect due to Telkom company’s limitation of deferred tax asset.
Condensed consolidated provisional statement of profit or loss and other comprehensive income for the year ended 31 March 2017
Notes2017
Rm
Restated 2016
Rm
Operating revenue 4 40 970 37 325
Payments to other operators 5.1 2 618 2 793
Cost of sales 5.2 6 498 5 011
Net operating revenue 31 854 29 521
Other income 4 734 1 281
Operating expenses 21 713 22 026
Employee expenses 5.3 10 562 12 165
Selling, general and administrative expenses 5.4 7 237 5 796
Service fees 5.5 2 869 2 965
Operating leases 5.6 1 045 1 100
EBITDA 10 875 8 776
Depreciation of property, plant and equipment 5.7 4 752 4 448
Amortisation of intangible assets 5.7 766 880
Write-offs, impairment and losses of property, plant
and equipment and intangible assets 5.7 143 170
Operating profit 5 214 3 278
Investment income 4 219 203
Finance charges and fair value movements 888 622
Finance charges 618 521
Foreign exchange and fair value movements 270 101
Profit before taxation 4 545 2 859
Taxation expense 6 691 538
Profit for the year 3 854 2 321
* *

Condensed consolidated provisional annual financial statements 46 47Telkom group provisional annual results 2017
Condensed consolidated provisional statement of financial positionat 31 March 2017
Notes2017
Rm
Restated2016
Rm
Re Restated2015
Rm
Assets
Non-current assets 34 125 33 689 30 695
Property, plant and equipment 8 27 918 25 350 24 471
Intangible assets 8 4 720 4 405 2 830
Other investments 10 40 2 318 2 231
Employee benefits 9 635 846 452
Other financial assets 60 55 28
Finance lease receivables 310 281 413
Deferred taxation 13 442 434 270
Current assets 13 912 12 864 11 100
Inventories 11 1 384 971 638
Income tax receivable 9 43 3
Current portion of finance lease receivables 237 207 200
Trade and other receivables 8 156 7 341 5 369
Current portion of other investments
and other financial assets 10 2 514 1 754 1 247
Cash and cash equivalents 12 1 612 2 548 3 643
Asset of disposal group classified as
held for sale 15 12
Total assets 48 049 46 553 41 795
Equity and liabilities
Equity attributable to owners of the
parent 27 569 25 975 24 741
Share capital 5 208 5 208 5 208
Share-based compensation reserve 452 241 126
Non-distributable reserves 1 376 1 507 1 507
Retained earnings 20 533 19 019 17 900
Non-controlling interest 337 390 299
Total equity 27 906 26 365 25 040
Notes2017
Rm
Restated2016
Rm
Re Restated2015
Rm
Non-current liabilities 7 004 7 104 5 272
Interest-bearing debt 16 4 744 4 566 3 244
Employee related provisions 17 1 536 1 665 1 264
Non-employee related provisions 17 56 66 61
Deferred revenue 529 656 687
Deferred taxation 13 139 151 16
Current liabilities 13 139 13 084 11 483
Trade and other payables 18 7 516 7 134 5 635
Shareholders for dividend 25 22 19
Current portion of interest-bearing debt 16 1 541 703 1 612
Current portion of employee related
provisions 17 1 397 2 231
1 882
Current portion of non-employee
related provisions 17 124 142
303
Current portion of deferred revenue 1 570 1 708 1 502
Income tax payable 433 683 344
Current portion of other financial
liabilities 440 455
185
Credit facilities utilised 12 93 6 1
Total liabilities 20 143 20 188 16 755
Total equity and liabilities 48 049 46 553 41 795
* Refer to note 2.2 and 2.4.
** **

Condensed consolidated provisional annual financial statements 48 49Telkom group provisional annual results 2017
2017 Rm
Restated2016
Rm
Balance at 1 April 26 365 25 227
Restatement (refer to note 2.3) - (187)
Restated balance at 1 April 26 365 25 040
Attributable to owners of Telkom 25 975 24 741
Non-controlling interests 390 299
Total comprehensive income for the year 3 757 2 589
Profit for the year 3 854 2 321
Other comprehensive (losses)/income (97) 268
Exchange losses on translating foreign operations (61) (9)
Net defined benefit plan remeasurements (36) 277
Dividend declared** (2 202) (1 405)
Increase in subsidiaries share-compensation reserve 21 126
Disposal of non-controlling interest (refer to note 15) (3) (100)
Purchase of Telkom shares by subsidiaries (28) –
Increase in share-compensation reserve 201 115
Increase in treasury shares (205) –
Balance at 31 March 27 906 26 365
Attributable to owners of Telkom 27 569 25 975
Non-controlling interests 337 390
* Refer to note 2.2 and 2.3.** Dividend declared includes dividend to the non-controlling interests of the Trudon group and the BCX group.
Condensed consolidated provisional statement of changes in equity
Condensed consolidated provisional statement of cash flows
for the year ended 31 March 2017 for the year ended 31 March 2017
Notes2017
Rm
Re Restated*2016
Rm
Cash flows from operating activities 5 542 6 701
Cash receipts from customers 39 961 37 690
Cash paid to suppliers and employees (31 051) (28 996)
Cash generated from operations 8 910 8 694
Interest received 453 465
Finance charges paid (469) (768)
Taxation paid (1 181) (288)
Cash generated from operations before dividend paid 7 713 8 103
Dividend paid (2 171) (1 402)
Cash flows from investing activities (6 637) (8 215)
Proceeds on disposal of property, plant and equipment
and intangible assets 230 567
Acquisition of subsidiary, net of cash acquired (22) (2 255)
Investments made by FutureMakers – (13)
Acquisition of non-controlling interest by BCX 15.4 – (89)
Additions to assets for capital expansion** 8 (8 479) (5 891)
Increase/(decrease) in repurchase agreements 1 634 (534)
Cash flows from financing activities 69 412
Loans raised 2 431 4 020
Purchase of shares for the Telkom share plan and
subsidiaries long term incentive share scheme (234) –
Loans repaid (1 539) (3 746)
Finance lease repaid (43) (430)
Repayment of net derivatives (673) (62)
Proceeds from net derivatives 127 630
Net decrease in cash and cash equivalents (1 026) (1 102)
Net cash and cash equivalents at beginning of year 2 542 3 642
Effect of foreign exchange rate gains on cash and cash
equivalents 3 2
Net cash and cash equivalents at end of year 12 1 519 2 542
* R50 million restated from additions to assets for capital expansion to cash paid to suppliers due to fraud at one of the subsidiaries (Trudon). Refer to note 2.2.3** Includes R48 million (2016: R83 million) inventory purchases in the current financial year.
*

Condensed consolidated provisional annual financial statements 50 51Telkom group provisional annual results 2017
1 Corporate information
Telkom SA SOC Limited (Telkom) is a company incorporated and domiciled in the Republic of South Africa (South Africa) whose shares are publicly traded. The main objective of the Telkom group is to supply telecommunication, multimedia, technology, information and other related information technology services to the group customers, as well as mobile communication services, in Africa.
2 Basis of preparation and accounting policies
2.1 Basis of preparation The condensed consolidated provisional annual financial statements have been prepared in accordance with IAS 34 Interim Financial Reporting and in compliance with the Listings Requirements of the JSE Limited, the South African Companies Act, 2008, as amended, the SAICA Financial Reporting Guide as issued by the Accounting Practices Committee and the Financial Reporting Standards Council.
The condensed consolidated provisional annual financial statements are disclosed in South African Rand, which is also the group’s presentation currency. All financial information presented in Rand has been rounded off to the nearest million.
The condensed consolidated provisional annual financial statements are prepared on the historical cost basis, with the exception of certain financial instruments initially(and sometimes subsequently) measured at fair value. Details of the group’s significant accounting policies are consistent with those applied in the previous financial year except for those listed below.
Significant accounting judgements, estimates and assumptionsIn preparing these condensed consolidated provisional annual financial statements, the significant judgements made by management in applying the group’s accounting policies and the key sources of estimation uncertainty were consistent with those applied to the consolidated financial statements for the year ended 31 March 2016 except for the changes in note 2.2, note 4 and the assumptions used to calculate the deferred tax asset in Telkom company. Significant accounting policiesThe condensed consolidated provisional annual financial statements have been prepared in accordance with the accounting policies adopted in the group’s last annual financial statements for the year ended 31 March 2016, except for the adoption of the amendments, new standards and changes in accounting policies as described in note 2.2.
The following new standards and amendments to standards have been early adopted.
Standard(s), Amendment(s) Salient feature of the changes Effective date
IFRS 12 Disclosure of interests in Other Entities
Amendment clarifying the scope of IFRS 12 with respect to interests in entities classified as held for sale in accordance with IFRS 5 Non-current assets held for sale and discontinued operations. This amendment has been adopted and have no impact on the group.
1 January 2017
IAS 12 Recognition of Deferred Tax Assets for Unrealised Losses
The amendments clarifies that an entity needs to consider whether tax law restricts the sources of taxable profits against which it may make deductions on the reversal of that deductible temporary difference. Furthermore, the amendments provide guidance on how an entity should determine future taxable profits and explains in which circumstances taxable profit may include the recovery of some assets for more than their carrying amount. This amendment has been adopted and does not have an impact on the group.
1 January 2017
The group has not early adopted any other standard, interpretation or amendment that has been issued but is not yet effective.
Notes to the condensed consolidated provisional annual financial statementsfor the year ended 31 March 2017

Condensed consolidated provisional annual financial statements 52 53Telkom group provisional annual results 2017
2 Basis of preparation and accounting policies (continued)
2.2 Correction of prior period errors and change in accounting policy Correction of prior period errorsThe condensed consolidated provisional annual financial statements provide comparative information in respect of the previous period. In addition, the group presents an additional statement of financial position at the beginning of the preceding period when there is a retrospective application of an accounting policy and a retrospective restatement. An additional statement of financial position as at 31 March 2015 is presented in these condensed consolidated provisional annual financial statements due to the retrospective correction of a prior period error.
2.2.1 Telkom Retirement FundDuring the 31 March 2016 reporting period, the group reported the restatement of the balances as a “Reassessment of the Telkom Retirement Fund (TRF) Defined Benefit Plan”. For classification purposes, it should be noted that the reassessment of the TRF constituted an error and not a change in accounting policy as previously stated. All relevant IAS 8 disclosures (nature, correction amounts and the amount of correction at the beginning of the year) regarding the error were appropriately disclosed in the March 2016 Financial Statements. 2.2.2 Fair value hierarchyDuring the previous reporting periods, the group reported the fair value hierarchy of the TL20 bonds as level 1 instead of level 2 based on the fact that it could access the quoted price of the bonds. According to IFRS 13, bonds can only be level 1 if they are quoted on an active market. The TL20 bonds are quoted on the market, however their transactions are not frequent enough for the market to be regarded liquid.
The group has corrected this disclosure by changing the TL20 fair value hierarchy from level 1 to level 2. The group has assessed that there has been no impact on the fair value of the TL20 bonds in the prior year as the quoted price is an adjusted market price, for perceived changes in risk as well as the time value of money. The group will continue to assess if the quoted price of the listed TL20 bonds is considered to be a level 1 or level 2 price and if further adjustment might be required.
2.2.3 Fraud - TrudonDuring the current financial year, the group uncovered fraud at one of its subsidiaries, Trudon, resulting in the termination of the services of the General Manager, IT.
An internal investigation into the fraud was launched, which identified invoicing and accounting irregularities which led to the incorrect recognition and subsequent measurement of intangible assets over a period of several years. The investigation also identified the past practice of irregularly capitalising operating expenditure as intangible assets. The nature of the errors identified included:• Intangible assets capitalised for which there was no evidence of a valid asset or expense as
a result of the above fraud;• Expenses capitalised to intangible assets which on re-evaluation of the nature of expense,
based on the invoice detail, was deemed to not meet the recognition criteria of IAS 38 at date of capitalisation;
• Identification of intangible assets which were no longer in use and which had been decommissioned in earlier periods but not de-recognised at time of decommissioning;
2 Basis of preparation and accounting policies (continued)
• Income tax implications in relation to expenses and wear and tear allowances deducted in prior periods relating to invoices associated with financial irregularities which based on senior counsel opinion should not have been deducted for tax purposes.
These issues identified constituted material prior period errors and have been corrected by restating each of the affected line items for the prior period as shown in the table 2.3 and 2.4 below.
2.2.4 Change in accounting policies Cost of salesThe group has previously included all the expenses that can be directly linked to revenue received for services provided and goods sold to customers in the definition of cost of sales.
Following the sale of the Enterprise business to BCX in November 2016, the group elected to change its accounting policy for cost of sales to only include expenses directly tied to revenue from the sale of goods. This decision to change the accounting policy in the view of management will provide more reliable and relevant information to ensure consistentpresentation across the group following the sale of Enterprise to BCX.
The new group accounting policy now applies that cost of sales determined as:Cost of goods sold relating to the sale of goods net of supplier rebates and discounts including:• Commission costs paid to external parties for the sale of goods sold• Logistics and delivery expenses relating to the goods sold
All other costs are disclosed by nature with the following being the key categories:• Employee expenses• Selling, general and administrative expenses • Service fees • Operating leases • Depreciation and amortisation
This change in policy has resulted in the re-classification of these line items in the comparative statement of profit or loss and other comprehensive income. Refer to note 2.3.
Notes to the condensed consolidated provisional annual financial statements (continued)for the year ended 31 March 2017

Condensed consolidated provisional annual financial statements 54 55Telkom group provisional annual results 2017
Notes to the condensed consolidated provisional annual financial statements (continued)for the year ended 31 March 2017
2 Basis of preparation and accounting policies (continued)2.3 Adjustments to the condensed consolidated provisional statement of profit or loss and other comprehensive income for the year ended 31 March 2016
Group
As previously reported
Rm
Telkom Restatement
Rm
BCX Restatement
Rm
Trudon IAS 8 disclosure
RmRestated
Rm
Operating revenue 37 325 – – – 37 325
Payments to other operators 2 793 – – – 2 793
Cost of sales 6 969 100 (2 047) (11) 5 011
Net operating revenue 27 563 (100) 2 047 11 29 521
Other income 1 281 – – – 1 281
Operating expenses 20 083 (100) 1 968 75 22 026
Employee expenses 10 901 – 1 264 – 12 165
Selling, general and administrative expenses 4 978 – 743 75 5 796
Service fees 3 106 (100) (41) – 2 965
Operating leases 1 098 – 2 – 1 100
EBITDA 8 761 – 79 (64) 8 776
Depreciation of property, plant and equipment 4 370 – 79 (1) 4 448
Amortisation of intangible assets 902 – – (22) 880
Write-offs, impairment and losses of property, plant and equipment and intangible assets 170 – – – 170
Operating profit 3 319 – – (41) 3 278
Investment income 203 – – – 203
Finance charges and fair value movements 622 – – – 622
Interest 521 – – – 521
Foreign exchange and fair value movements 101 – – – 101
Profit before taxation 2 900 – – (41) 2 859
Taxation expense 524 – – 14 538
Profit for the year 2 376 – – (55) 2 321
Other comprehensive income
Items that will be reclassified subsequently to profit or loss
Exchange losses on translating foreign operations (9) – – – (9)
Items that will not be reclassified to profit or loss
Defined benefit plan actuarial losses 191 – – – 191
Defined benefit plan asset ceiling limitation 86 – – – 86
Other comprehensive income for the year, net of taxation 268 – – – 268
Total comprehensive income for the year 2 644 – – (55) 2 589
Total operations
Basic earnings per share (cents) 439.4 432.4
Diluted earnings per share (cents) 432.8 425.8
* Refer to note 2.2.4 ** Refer to note 2.2.3.
* * **

Condensed consolidated provisional annual financial statements 56 57Telkom group provisional annual results 2017
Notes to the condensed consolidated provisional annual financial statements (continued)for the year ended 31 March 2017
2 Basis of preparation and accounting policies (continued)2.4 Adjustments to the condensed consolidated provisional statement of financial position
Group - March 2016 Group - March 2015
As previously
reportedRm
Trudon IAS 8 disclosure
Rm
Restated March 2016
Rm
As previously
reportedRm
Trudon IAS 8 disclosure
Rm
Restated March 2015
Rm
Assets
Non-current assets 33 875 (186) 33 689 30 855 (160) 30 695
Property, plant and equipment 25 357 (7) 25 350 24 479 (8) 24 471
Intangible assets 4 584 (179) 4 405 2 982 (152) 2 830
Other investments 2 318 – 2 318 2 231 – 2 231
Employee benefits 846 – 846 452 – 452
Other financial assets 55 – 55 28 – 28
Finance lease receivables 281 – 281 413 – 413
Deferred taxation 434 – 434 270 – 270
Current assets 12 912 (48) 12 864 11 127 (27) 11 100
Inventories 971 – 971 638 – 638
Income tax receivable 57 (14) 43 11 (8) 3 Current portion of finance lease receivables 207 – 207 200 – 200
Trade and other receivables 7 375 (34) 7 341 5 388 (19) 5 369 Current portion of other financial assets 1 754 – 1 754 1 247 – 1 247
Cash and cash equivalents 2 548 – 2 548 3 643 – 3 643
Total assets 46 787 (234) 46 553 41 982 (187) 41 795
Equity and liabilities
Equity attributable to owners of the parent 26 134 (159) 25 975 24 864 (123) 24 741
Share capital 5 208 – 5 208 5 208 – 5 208
Share-based compensation reserve 241 – 241 126 – 126
Non-distributable reserves 1 507 – 1 507 1 507 – 1 507
Retained earnings 19 178 (159) 19 019 18 023 (123) 17 900
Non-controlling interest 473 (83) 390 363 (64) 299
Total equity 26 607 (242) 26 365 25 227 (187) 25 040
* Refer to note 2.2.3.
* *

Condensed consolidated provisional annual financial statements 58 59Telkom group provisional annual results 2017
Notes to the condensed consolidated provisional annual financial statements (continued)for the year ended 31 March 2017
2 Basis of preparation and accounting policies (continued)2.4 Adjustments to the condensed consolidated provisional statement of financial position (continued)
Group - March 2016 Group - March 2015
As previously
reportedRm
Trudon IAS 8 disclosure
Rm
Restated March 2016
Rm
As previously
reportedRm
Trudon IAS 8 disclosure
Rm
Restated March 2015
Rm
Non-current liabilities 7 104 – 7 104 5 272 – 5 272
Interest-bearing debt 4 566 – 4 566 3 244 – 3 244
Employee related provisions 1 665 – 1 665 1 264 – 1 264
Non-employee related provisions 66 – 66 61 – 61
Deferred revenue 656 – 656 687 – 687
Deferred taxation 151 – 151 16 – 16
Current liabilities 13 076 8 13 084 11 483 – 11 483
Trade and other payables 7 134 – 7 134 5 635 – 5 635
Shareholders for dividend 22 – 22 19 – 19
Current portion of interest-bearing debt 703 – 703 1 612 – 1 612
Current portion of employee related provisions 2 231 – 2 231 1 882 – 1 882
Current portion of non-employee related provisions 142 – 142 303 – 303
Current portion of deferred revenue 1 708 – 1 708 1 502 – 1 502
Income tax payable 675 8 683 344 – 344
Current portion of other financial liabilities 455 – 455 185 – 185
Credit facilities utilised 6 – 6 1 – 1
Total liabilities 20 180 8 20 188 16 755 – 16 755
Total equity and liabilities 46 787 (234) 46 553 41 982 (187) 41 795
* Refer to note 2.2.3.
* *

Condensed consolidated provisional annual financial statements 60 61Telkom group provisional annual results 2017
Notes to the condensed consolidated provisional annual financial statements (continued)for the year ended 31 March 2017
3 Segment information
The Executive Committee (Exco) is the group’s chief operating decision maker (CODM). Management has determined the operating segments based on the reports reviewed by Exco that are used to make the strategic decisions, allocate resources, and assess performance. For the period ended 31 March 2016, the Telkom group presented two reportable segments, namely Telkom and BCX. In the period under review, the group started implementing a more flexible and agile operating and reporting model to manage performance and allocate resources. In its journey to fully operationalise this aspiration, the CODM has started to assess the performance of the business units on a net operating revenue level and make decisions about the allocation of resources for fixed stream, mobile stream and BCX at an EBITDA level.
In September 2016 (Interim report), the group reported four segments, namely Openserve, Consumer, Enterprise and BCX. On 1 November 2016, Telkom company sold one of its business divisions (Enterprise division) to BCX, a wholly owned subsidiary of Telkom. The Enterprise segment was integrated into the BCX segment, resulting in three reportable segments, Openserve, Consumer and BCX for the group at the reporting date. Subsequently, Enterprise is no longer a reportable segment as its operating results are not regularly reviewed by the group’s CODM. The results of the Enterprise business has been included into the BCX segment as if the sale transactions occurred on 1 April 2016 and the comparative information has been restated on the same basis. “Other” includes Swiftnet, Trudon and other non-trading entities. The financial information reviewed by the CODM excludes inter segmental revenue and cost allocations as the transfer pricing principles continue to evolve.

Condensed consolidated provisional annual financial statements 62 63Telkom group provisional annual results 2017
3 Segment information (continued)The segment information provided to Exco for the reportable segments is as follows:
Openserve Consumer BCX Other Consolidated
Rm Rm Rm Rm Rm
March 2017
Transactions with external customers
Operating revenue from external customers 5 150 15 048 19 686 1 086 40 970
Payment to other operators (2 618)
Cost of sales (6 498)
Segment net operating revenue 3 819 10 978 16 559 498 31 854
Fixed stream 3 819 8 974 – – 12 793
Mobile stream – 2 004 – – 2 004
BCX group – – 16 559 – 16 559
Other – – – 498 498
Notes to the condensed consolidated provisional annual financial statements (continued)for the year ended 31 March 2017
*
Reconciliation of operating profit to profit before tax Fixed Stream Mobile Stream BCX Other Eliminations Consolidated
Rm Rm Rm Rm Rm Rm
Transactions with external customers and within the segments (before cost allocations and eliminations)
Segment net operating revenue 15 189 2 004 17 692 631 (3 662) 31 854
Other income 692 62 58 503 (581) 734
Operating expenses (9 617) (1 467) (9 806) (4 930) 4 173 (21 647)
Earnings before interest, tax, depreciation and amortisation (EBITDA) for reportable segments excluding
voluntary packages 6 264 599 7 944 (3 796) (70) 10 941Voluntary severance and early retirement packages (66)
Depreciation, amortisation, impairment, write-offs and losses (5 661)
Operating profit 5 214
Investment income 219
Finance charges and fair value movement (888)
Profit before taxation 4 545
Other segment Information**
Capital expenditure of property, plant and equipment and intangible assets 6 262 1 936 366 42 – 8 606
* Includes Enterprise results as if the transaction was effective on 1 April 2016. ** The R8.6 billion of capital expenditure includes R48 million that was purchased as inventory for network expansion. Refer to note 8.
*
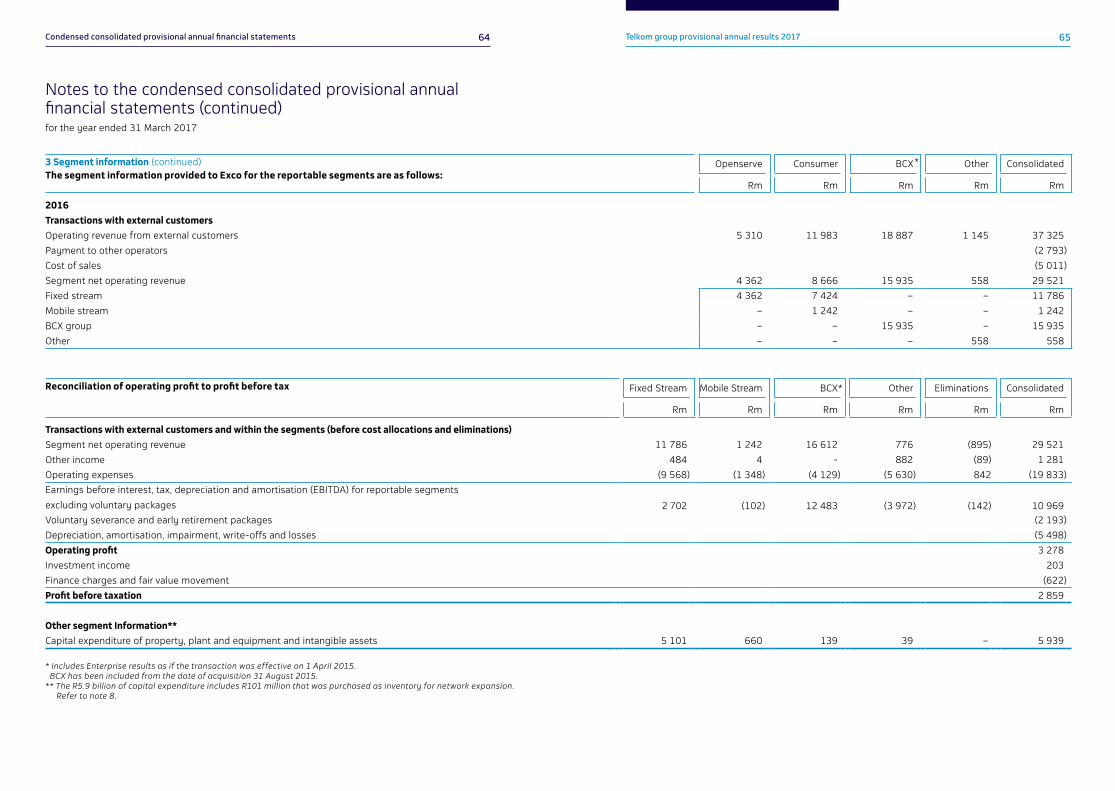
Condensed consolidated provisional annual financial statements 64 65Telkom group provisional annual results 2017
Notes to the condensed consolidated provisional annual financial statements (continued)for the year ended 31 March 2017
3 Segment information (continued)The segment information provided to Exco for the reportable segments are as follows:
Openserve Consumer BCX Other Consolidated
Rm Rm Rm Rm Rm
2016
Transactions with external customers
Operating revenue from external customers 5 310 11 983 18 887 1 145 37 325
Payment to other operators (2 793)
Cost of sales (5 011)
Segment net operating revenue 4 362 8 666 15 935 558 29 521
Fixed stream 4 362 7 424 – – 11 786
Mobile stream – 1 242 – – 1 242
BCX group – – 15 935 – 15 935
Other – – – 558 558
*
Reconciliation of operating profit to profit before tax Fixed Stream Mobile Stream BCX Other Eliminations Consolidated
Rm Rm Rm Rm Rm Rm
Transactions with external customers and within the segments (before cost allocations and eliminations)
Segment net operating revenue 11 786 1 242 16 612 776 (895) 29 521
Other income 484 4 - 882 (89) 1 281
Operating expenses (9 568) (1 348) (4 129) (5 630) 842 (19 833)
Earnings before interest, tax, depreciation and amortisation (EBITDA) for reportable segments
excluding voluntary packages 2 702 (102) 12 483 (3 972) (142) 10 969Voluntary severance and early retirement packages (2 193)
Depreciation, amortisation, impairment, write-offs and losses (5 498)
Operating profit 3 278
Investment income 203
Finance charges and fair value movement (622)
Profit before taxation 2 859
Other segment Information**
Capital expenditure of property, plant and equipment and intangible assets 5 101 660 139 39 – 5 939
* Includes Enterprise results as if the transaction was effective on 1 April 2015. BCX has been included from the date of acquisition 31 August 2015. ** The R5.9 billion of capital expenditure includes R101 million that was purchased as inventory for network expansion. Refer to note 8.
*

Condensed consolidated provisional annual financial statements 66 67Telkom group provisional annual results 2017
Notes to the condensed consolidated provisional annual financial statements (continued)for the year ended 31 March 2017
4 Total income 2017 Rm
2016 Rm
Operating revenue 40 970 37 325
Other income 734 1 281
Investment income 219 203
Operating revenue increased due to higher mobile data revenue, higher equipment sales and the BCX revenue. This is partially offset by the decline in fixed-line voice revenue and lower connectivity revenue.
The decrease in other income is mainly attributable to lower gains from the sale of properties of R487 million when compared to the year ended 31 March 2016.
In the current financial year Openserve reassessed its leased lines customer relationship period (CRP) that is used for the deferral of installation fee revenue. The CRP was changed from five years to four years. This is more reflective of the modern day customer behaviour within the industry. The change in estimate resulted in revenue increasing by R20 million in the current year.
5 Expenses 2017
Rm
Restated2016
Rm
5.1 Payments to other operators 2 618 2 793 Payments to other operators decreased mainly due to the lower traffic volumes. 5.2 Cost of sales 6 498 5 011 The increase in cost of sales is largely attributable to the increase of IT service and the increase in the sale of high end devices as well as the effect of the full year consolidation of BCX. Change in comparativesRefer to note 2.3.5.3 Employee expenses 10 562 12 165 The decrease in employee expenses is mainly due to the decline in headcount and the lower VSP/VERP expense compared to the prior financial year.Change in comparativesRefer to note 2.3.5.4 Selling, general and administrative expenses 7 237 5 796 The increase in selling, general and administrative expenses is mainly due to the full year inclusion of BCX and increased outsourcing costs. Change in comparativesRefer to note 2.3.
5 Expenses (continued) 2017
Rm
Restated2016
Rm
5.5 Service fees 2 869 2 965 The decrease is mainly due to lower company transformation and property management expenses.Change in comparativesRefer to note 2.3.5.6 Operating leases 1 045 1 100 The decrease in operating leases is mainly due to a decrease in the number of vehicles leased.Change in comparativesRefer to note 2.3.5.7 Depreciation, amortisation, impairment and write-offs 5 661 5 498
Depreciation of property, plant and equipment 4 752 4 448
Amortisation of intangible assets 766 880
Write-offs, impairment and losses of property, plant and equipment and intangible assets
143
170
The increase is due to accelerated depreciation of old technology as we intensify the roll-out of fibre and LTE as well as higher asset write-offs.
As a result of the transformation programme, the group reassessed the useful lives of certain technologies to address the challenges within the competitive market and IP-based products and services. The reassessment of useful lives had the effect of increasing the depreciation and amortisation expense for the year ended 31 March 2017 by R325 million (2016: R192 million).Depreciation and amortisation for each year of the remaining useful lives of the individually reassessed equipment will be significantly lower.Change in comparativesRefer to note 2.3
6 Taxation expense2017
Rm
Restated2016
Rm
Taxation expense 691 538
Normal company taxation 713 574
Deferred taxation (50) (15)
Withholding tax 4 1
Common control transaction 24 (22)
The tax expense increased in the current financial year as a result of higher group profit.

Condensed consolidated provisional annual financial statements 68 69Telkom group provisional annual results 2017
7 Earnings per share2017
Rm
Restated2016
Rm
Total operations
Basic earnings per share (cents) 738.8 432.4
Diluted earnings per share (cents) 724.1 425.8
Headline earnings per share (cents) 721.1 323.0
Diluted headline earnings per share (cents) 706.8 318.1
Reconciliation of weighted average number of ordinary shares: Number of
shares
Number of
shares
Ordinary shares in issue 526 948 700 526 948 700
Weighted average number of shares held by subsidiaries
and in escrow (12 994 315) (15 791 240)
Weighted average number of shares outstanding 513 954 385 511 157 460
Reconciliation of diluted weighted average number of
ordinary shares
Weighted average number of shares outstanding 513 954 385 511 157 460
Expected future vesting of shares 10 416 531 7 808 223
Diluted weighted average number of shares outstanding 524 370 916 518 965 683
Reconciliation between earnings and headline earnings: Rm Rm
Profit for the year 3 854 2 321
Non-controlling interests (57) (111)
Profit attributable to owners of Telkom 3 797 2 210
Profit on disposal of property, plant and equipment and
intangible assets
(217) (704)
Write-offs of property, plant and equipment and
intangible assets 143 170
Taxation effects (17) (25)
Headline earnings 3 706 1 651
* Refer to note 2.3.
Dividend per share (cents) The calculation of dividend per share is based on dividends of R1 422 million declared on 4 July 2016 and R692 million declared on 11 November 2016 (31 March 2016: R1 291 million). 526 948 700 ordinary shares were outstanding on the date of the dividend declaration (31 March 2016: 526 948 700).
Notes to the condensed consolidated provisional annual financial statements (continued)for the year ended 31 March 2017
8 Capital additions and disposals 2017 Rm
2016 Rm
Property, plant and equipment
Additions 7 539 5 263
Disposals (23) (231)
7 516 5 032
Intangible assets
Additions 1 069 726
Disposals (27) -
1 042 726
The additions are largely due to the deployment of fibre and other technologies to support the growing data services business, internet capacity growth, links to the mobile cellular operators and access line deployment in selected high growth commercial and business areas.
An estimated amount of R48 million (31 March 2016: R101 million) included in inventories will be used for Telkom’s network expansion, R48 million of which was purchased in the current financial year (31 March 2016: R83 million).
Finance charges of R130 million (31 March 2016: R103 million) were capitalised to property, plant and equipment and intangible assets in the current financial year.
9 Employee benefits 2017 Rm
2016 Rm
635 846
Telkom Pension Fund asset 23 114
Post-retirement medical aid net plan asset 612 732
The assets recognised are determined in accordance with IAS 19. The Telkom Pension Fund assets decreased due to a S15E transfer in terms of the Pension Act to the Telkom Retirement Fund of approximately R96 million.
The decrease in the post-retirement medical aid net plan asset is due to the decrease in the fair value of the annuity policy.
*

Condensed consolidated provisional annual financial statements 70 71Telkom group provisional annual results 2017
10 Other investments and financial assets 2017 Rm
2016 Rm
Non-current other investments
Other investments 40 2 318
Cell captive preference shares – 2 235
FutureMakers 11 13
Equity investment in Number Portability Company 5 4
BCX group interests in associates and joint ventures 24 66
Other financial assets 2 514 1 754
Current other financial assets consist of: 126 1 754
- Repurchase agreements – 1 634
- Derivative instruments 78 101
Forward exchange contracts 54 20
Firm commitments 24 43
Cross currency swaps - 38
- Asset finance receivables 48 19
The decrease in other financial assets is primarly due to the disposal of the repurchase agreement.
Current other investments consist of: 2 388 –
- Cell captive preference shares 2 388 –
The cell captive preference shares were reclassified from non-current assets to current assets in the current financial year as it is highly probable that it will be liquidated in the short term.
11 Inventories 2017 Rm
2016 Rm
Inventories 1 384 971
Gross inventories 1 522 1 062
Write-down of inventories to net realisable value (138) (91)
The increase was mainly attributable to the increase in installation, maintenance and network equipment. Refer to note 8 for inventory required for capital requirements.
12 Net cash and cash equivalents 2017 Rm
2016 Rm
Net cash and cash equivalents 1 519 2 542
Cash shown as current assets 1 612 2 548
Cash and bank balances 953 418
Short-term deposits 659 2 130
Credit facilities utilised (93) (6)
The lower cash balance is as a result of dividend payment, voluntary severance and retirement
packages settled in the current financial year.
13 Deferred taxation 2017 Rm
2016 Rm
Deferred taxation is made up as follows: 303 283
Deferred taxation asset 442 434
Deferred taxation liability (139) (151)
The group did not recognise deferred tax assets of R400 million (2016: R1.1 billion) in respect of temporary differences amounting to R1.4 billion (2016: R4 billion) that can be carried forward against future taxable income.
14 Financial risk management Exposure to continuously changing market conditions has made management of financial risk critical for the group. Treasury policies, risk limits and control procedures are continuously monitored by the board of directors through its Audit and Risk Committee.
The condensed consolidated provisional annual financial statements do not include all financial risk management information and disclosures required in the annual financial statements and should be read in conjunction with the group’s annual financial statements as at 31 March 2017. The group uses derivatives as hedging instruments.
14.1 Liquidity risk Liquidity risk is the risk that the group will not be able to meet its financial obligations as they fall due. The group is exposed to liquidity risk as a result of uncertain cash flows as well as the capital commitments of the group.
Liquidity risk is managed by the group’s Treasury department in accordance with policies and guidelines formulated by the group’s Executive Committee. In terms of its borrowing requirements the group ensures that sufficient facilities exist to meet its immediate obligations.
Compared to the 2016 financial year end, there was no material change in the contractual undiscounted cash out flows for financial liabilities.
Notes to the condensed consolidated provisional annual financial statements (continued)for the year ended 31 March 2017

Condensed consolidated provisional annual financial statements 72 73Telkom group provisional annual results 2017
14 Financial risk management continued 14.2 Fair value of financial instruments The carrying amount of financial instruments approximate fair value, with the exception of interest-bearing debt (at amortised cost) which has a fair value of R6 578 million (2016: R5 569 million)and a carrying amount of R6 285 million (2016: R5 269 million) (refer to note 16).
Valuation techniques and assumptions applied for the purposes of measuring fair value
Type of financial instrument
Fair value at 31 March 2017
RmValuation technique
Significant inputs
Receivables, bank balances, repurchase agreements, and other liquid funds, payables and accruals, credit facilities utilised and shareholders for dividends
4 473 Undiscounted future estimated cash flows due to theshort-term maturities of these instruments
Probability of default
Derivatives (363) Discounted cash flows
Yield curvesMarket interest ratesMarket foreign currency rates
Borrowings (6 578) Discounted cash
flows and quoted
bond prices
Market interest ratesMarket foreign currency rates
The estimated net fair values as at the reporting date have been determined using available market information and appropriate valuation methodologies as outlined below. This value is not necessarily indicative of the amounts that the group could realise in the normal course of business.The fair value of the financial assets and financial liabilities are sensitive to exchange rate and interest rate movements.
Derivatives are recognised at fair value. The fair values of derivatives are determined using quoted prices or, where such prices are not available, a discounted cash flow analysis is used. These amounts reflect the approximate values of the net derivative position at the reporting date. The fair values of the borrowings disclosed above are based on quoted prices or, where such prices are not available, the expected future payments discounted at market interest rates. As a result they differ from their carrying values. The fair value of receivables, bank balances, repurchase agreements and other liquid funds, payables and accruals, approximate their carrying amount due to the short-term maturities of these instruments.
Notes to the condensed consolidated provisional annual financial statements (continued)for the year ended 31 March 2017
14.3 Fair value hierarchy The table below analyses financial instruments carried at fair value and amortised cost, by valuation method.
The different levels have been defined as follows: a) Quoted prices in active markets for identical assets or liabilities (level 1). b) Inputs other than quoted prices, that are observable for the asset or liability (level 2). c) Inputs for the asset or liability that are not based on observable market data (level 3).
Hierarchy levels
2017 Rm
2016 Rm
Assets measured at fair value
Investment in cell captive preference shares Level 2 2 388 2 235
Investments made by FutureMakers Level 3 11 13
Forward exchange contracts Level 2 54 20
Assets finance receivable Level 2 73 39
Loans Level 2 35 35
Firm commitments Level 2 24 43
Cross currency swaps Level 2 – 38
Liabilities measured at fair value
Interest rate swaps Level 2 (22) (7)
Firm commitments Level 2 (189) (155)
Forward exchange contracts Level 2 (229) (293)
Liabilities measured at amortised cost
Interest-bearing debt consisting of: (6 578) (5 569)
Listed debt* Level 2 (6 578) (5 569)
* Refer to note 2.2.2

Condensed consolidated provisional annual financial statements 74 75Telkom group provisional annual results 2017
Notes to the condensed consolidated provisional annual financial statements (continued)for the year ended 31 March 2017
15 Acquisitions and disposals 15.1 Acquisitions 15.1.1 Taropa Technologies (Proprietary) Limited (Taropa) On 1 March 2017 BCX acquired the entire issued ordinary share capital of Taropa.The total purchase consideration was R13 million. The consideration is made up of R8 million cash and R5 million deferred consideration.
To the extent that Taropa’s profit after tax exceeds the warranted profit, the seller will earn additional consideration amounting up to R5 million, payable in the 2019 and 2020 financial years.
Taropa provides innovative business solutions based on information and communication technology and runs ICT systems and manages products, services and solutions for a wide range of customers.
The merger will enable BCX to expand its existing offerings while, at the same time, providing scale in IT services, which will help reinforce Telkom’s core connectivity business and enhance BCX’s strategy.
The acquisition has been accounted for using the acquisition method. The date of acquisition is 1 March 2017 and the financial statements include the Taropa results for the one month ended 31 March 2017.
The fair value of the identifiable assets and liabilities at acquisition date were determined as follows:
2017Rm
Assets
Property, plant and equipment 1
Trade and other receivables 15
Inventories 18
Cash and cash equivalents 2
Total assets 36
Liabilities
Trade and other payables 29
Income tax payable 1
Total liabilities 30
Total identifiable net assets at fair value 6
2017Rm
Non-controlling interest at proportional share of net assets –
Goodwill arising on acquisition (provisional) 7
Purchase consideration transferred 13
Analysis of cash flows at acquisition:Net cash outflow on acquisition of the subsidiary (included in cash flows from investing activities) Cash paid 8
Cash acquired (2)
Net cash out flow on acquisition 6
At the date of the acquisition, the fair value of the trade receivables approximated its carrying value. The gross amount of trade receivables is R13.9 million.
From the date of acquisition, Taropa has contributed R9.3 million of revenue and R0.33 million to the net profit before tax from the continuing operations of the BCX group. If the acquisition had taken place at the beginning of the year, BCX revenue from continuing operations would have been R14 079 million and the BCX group profit from continuing operations for the period would have been R1 068 million.
The goodwill recognised is primarily attributed to the expected synergies and other benefits from combining the assets and activities of Taropa with those of the BCX group. The goodwill is not deductible for income tax purposes.
Transaction costs of less than R1 million, which includes issue costs, have been expensed since the inception of the acquisition. These expenses were recognised in service fees.
The fair value of intangible assets and goodwill has been measured on a provisional basis pending the completion of an independent valuation.
If new information is obtained within one year of the acquisition date on facts and circumstances that existed at the acquisition date, the above amounts will be revised.

Condensed consolidated provisional annual financial statements 76 77Telkom group provisional annual results 2017
Notes to the condensed consolidated provisional annual financial statements (continued)for the year ended 31 March 2017
15 Acquisitions and disposals (continued)15.1 Acquisitions (continued)15.1.2 African Arete Proprietary Limited (African Arete)On 1 November 2016 BCX acquired the entire issued ordinary share capital of African Arete.
The total purchase consideration was R19 million which was settled in cash.
African Arete provides innovative business solutions based on information and communication technology and runs ICT systems and manages products, services and solutions for a wide range of customers.
The merger will enable BCX to expand its existing offerings while, at the same time, providing scale in IT services, which will help reinforce Telkom’s core connectivity business and enhance BCX’s strategy.
The acquisition has been accounted for using the acquisition method. The date of acquisition is 1 November 2016 and the financial statements include the African Arete results for the five months ended 31 March 2017.
At the date of the acquisition, the fair value of the trade receivables approximated its carrying value. The gross amount of trade receivables is R6.5 million.
From the date of acquisition, African Arete has contributed R21.2 million of revenue and R1.2 million to the net profit before tax from the continuing operations of the BCX group. If the acquisition had taken place at the beginning of the year, BCX revenue from continuing operations would have been R13 905 million and the BCX group profit from continuing operations for the period would have been R1 066 million.
The goodwill recognised is primarily attributed to the expected synergies and other benefits from combining the assets and activities of African Arete with those of the BCX group. The goodwill is not deductible for income tax purposes.
Transaction costs of less than R1 million, which include isssue costs, have been expensed since the inception of the acquisition. These expenses were recognised in service fees. The fair value of intangible assets and goodwill has been measured on a provisional basis pending the completion of an independent valuation.
If new information is obtained within one year of the acquisition date on facts and circumstances that existed at the acquisition date, the above amounts will be revised.
15.1.3 Relational Database Consulting Proprietary Limited (RDC)On 1 April 2016, Business Connexion Group Limited acquired the entire share capital of RDC.
The total purchase consideration amounted to R30 million, funded by a cash payment of R16 million and a deferred purchase consideration of R14 million payable on achieving financial targets. RDC is a market leader in Database and Operating System administration with a strongfocus on Oracle.
The merger will enable the group to expand its existing offerings while, at the sametime, providing scale in IT services, which will help reinforce the group’s core connectivity business and enhance convergence strategy. Their expanded range of services includes Oracle E-Business Suite, Oracle Fusion Middleware, Oracle Solaris Support and Oracle Sales. The acquisition has been accounted for using the acquisition method. The date of acquisition is 1 April 2016 and the financial statements include the RDC results for the twelve months ended 31 March 2017.
2017Rm
Assets
Trade and other receivables 7
Total assets 7
Liabilities
Trade and other payables 3
Income tax payable 1
Total liabilities 4
Total identifiable net assets at fair value 3
Non-controlling interest at proportional share of net assets –
Goodwill arising on acquisition (provisional) 16
Purchase consideration transferred 19
Analysis of cash flows at acquisition:Net cash outflow on acquisition of the subsidiary (included in cash flows from investing activities) Cash paid 19
Net cash out flow on acquisition 19
The fair value of the identifiable assets and liabilities at acquisition date were determined as follows:

Condensed consolidated provisional annual financial statements 78 79Telkom group provisional annual results 2017
Notes to the condensed consolidated provisional annual financial statements (continued)for the year ended 31 March 2017
15 Acquisitions and disposals (continued)15.1 Acquisitions (continued)15.1.3 Relational Database Consulting Proprietary Limited (RDC) (continued)
The fair value of the identifiable assets and liabilities at acquisition date were determined as follows:
2017Rm
Assets
Trade and other receivables 5
Cash and cash equivalents 17
Total assets 22
Liabilities
Non current debt (3)
Trade and other payables (13)
Total liabilities (16)
Total identifiable net assets at fair value 6
Goodwill arising at acquisition 24
Purchase consideration transferred 30
Analysis of cash flows at acquisition:Net cash acquired with the subsidiary (included in cash flows from investing activities)
Cash paid 16
Cash acquired at acquisition 17
Net cash inflow on acquisition 1
To the extent that RDC’s profit after tax exceeds the warranted profit, the seller will earn additional consideration amounting to R14 million, payable in the 2019 and 2020 financial years. At the date of the acquisition, the fair value of the trade receivables approximated its carrying value. The gross amount of trade receivables is R5.2 million.
From the date of acquisition, RDC has contributed R89.4 million of revenue and R13.5 million to the net profit before tax from the continuing operations of the BCX group. The goodwill recognised is primarily attributed to the expected synergies and other benefits from combining the assets and activities of RDC with those of the BCX group. The goodwill is not deductible for income tax purposes. Transaction costs of less than R1 million, which includes issue costs, have been expensed since the inception of the acquisition.
March 2016 15.1.4 Business Connexion group (BCX)On 25 August 2015, Telkom acquired the entire issued ordinary share capital and the entire issued “A“ordinary shares of BCX. The total purchase consideration of R2.7 billion was funded through Telkom’s own cash resources. BCX provides innovative business solutions based on information and communicationtechnology and runs ICT systems and manages products, services and solutions for awide range of customers.
15.1.5 Anco IT Proprietary Limited (Anco)On 1 November 2015 BCX acquired the entire issued ordinary share capital of Anco. The total purchase consideration of R41 million was in the form of cash, earn-out payments,a loan to BCX and deferred consideration.
Anco provides innovative business solutions based on information and communicationtechnology and runs ICT systems and manages products, services and solutions for a wide range of customers.

Condensed consolidated provisional annual financial statements 80 81Telkom group provisional annual results 2017
Notes to the condensed consolidated provisional annual financial statements (continued)for the year ended 31 March 2017
15 Acquisitions and disposals (continued)15.1 Acquisitions (continued)15.1.6 UCS Solutions Proprietary Limited (UCS) minority interest On 31 December 2015 the Telkom group, through BCX, acquired the remaining 15% of the UCS (and its holding in Integr8 IT Proprietary Limited), based on the vested put option agreement with shareholders. UCS and Integr8 are now wholly owned subsidiaries of the BCX group. This transaction was accounted for as an equity transaction.
15.2 Common control transactions201715.2.1 Enterprise businessOn 1 November 2016 Enterprise, previously a division of Telkom, was sold to BCX torealise synergies. The integration will enable the Telkom group to offer Enterprise solutions beyond connectivity and to strengthen Telkom’s leadership in the Enterprise market.The transaction was financed through redeemable preference sharesfrom BCX to Telkom and accounted for as a common control transaction. BCX recognisedthe acquired Enterprise assets at their carrying amount on the date of sale and thedifference between the proceeds and the carrying amount of the Enterprise business was recognised as a common control equity reserve. In Telkom company the difference between the carrying amount of the Enterprise business and proceeds was recognised in profit or loss.
201615.2.2 Telkom DCOOn 1 November 2015 Cybernest (DCO), previously the IT business division of Telkom, was sold to BCX to realise synergies. The transaction was financed through a loan from Telkom to BCX and accounted for as a common control transaction. BCX recognised the acquired DCO assets at their carrying amount on the date of sale and the difference between the proceeds and the carrying amount of the DCO business was recognised as a common control equity reserve. In Telkom company the difference between the carrying amount of the DCO business and proceeds was recognised in profit or loss.
15.3 Disposals 2017Rm
15.3.1 Nanoteq Proprietary LimitedThe group concluded a transaction to sell its Nanoteq business shareholding, effective 30 September 2016, for a total consideration of R57 million.The net cash flows attributable to the operating, investing and financing activities of discontinued operations:Net assets disposed 1
Non-controlling interest (1)
Consideration 57
Profit on disposal 57
15.3.2 Other propertiesTelkom board approved the disposal of an additional 26 properties to the market. These properties were identified as no longer needed for the Telkom operations. The sale is planned to take place during the 2018 financial period.
2017Rm
At 31 March 2017, the group, recognised these properties as held for sale in its statement of financial position.
The fair values of these properties at 31 March 2017 exceeds their carrying values.Carrying Value 12
15.4 Goodwill reconciliation - 2017
Opening balance 1 214
Acquisition of Anco* (8)
Acquisition of RDC 24
Acquisition of Taropa 7
Acquisition African Arete 16
1 253
16 Interest-bearing debt 2017 Rm
2016 Rm
Non-current interest-bearing debt 4 744 4 566
Local debt 4 550 4 340
Foreign debt 123 154
Finance leases 71 72
Current portion of interest-bearing debt 1 541 703
Local debt 1 500 654
Foreign debt 2 18
Finance leases 39 31
The current portion of interest-bearing debt of R1.541 million (2016: R703 million) for group as at 31 March 2017 is expected to be repaid from operational cash flow and other borrowings.
2016Rm
Goodwill reconciliation - 2016
Opening balance 63
Acquisition of BCX 1 119
Acquisition of African Arete 32
1 214 * At 31 March 2016, goodwill of R32 million was raised in respect of the acquisition of Anco. This amount has been reduced by R8 million in the current year as a result of the finalisation of the goodwill calculation.
In the current financial year the entire goodwill allocation relating to the BCX group was allocated to the BCX Cash Generating Unit (CGU). A value in use calculation was performed in the current financial year. There is no impairment on the BCX CGU.

Condensed consolidated provisional annual financial statements 82 83Telkom group provisional annual results 2017
Notes to the condensed consolidated provisional annual financial statements (continued)for the year ended 31 March 2017
18 Trade and other payables 2017 Rm
2016 Rm
Trade and other payables 7 516 7 134
Trade payables 3 870 3 872
Finance cost accrued 60 54
Accruals and other payables 3 586 3 208
Accruals and other payables mainly represent amounts payable for goods received net of value added tax, obligations and licence fees.
Included in the current and prior year balance is the refund from SARS of R854 million including interest. Refer to note 20.
19 Commitments 2017 Rm
2016 Rm
Capital commitments authorised 8 158 6 574
Commitments against authorised capital expenditure 6 594 3 388
Authorised capital expenditure not yet contracted 1 564 3 186
Capital commitments are largely attributable to purchases of property, plant and equipment and software. Management expects these commitments to be financed from internally generated cash and other borrowings.
20 Contingencies
Contingent liabilitiesMatters before ICASAEnd-User and Service Charter Regulations Based on ICASA’s Complaints and Compliance Committee (CCC) ruling in the prior period, Telkom has initiated administrative review proceedings seeking to set aside the applicability of the Regulations in issue. The review application is in process and no hearing date has been allocated as yet. In the interim, however, ICASA promulgated the Amended End-User and Subscriber Charter Regulations on 1 April 2016, in terms of which the fault clearance measurement for fixed services was amended to 90% fault clearance within five days,instead of three days. Telkom is in the process of assessing the impact of the amended Regulationsgoing forward.
High CourtRadio Surveillance Security Services Proprietary Limited (RSSS)In December 2011, RSSS issued a summons against Telkom for the sum of R216 million. Telkom is defending the matter and has filed a plea and a counterclaim for R22 million. No contract was concluded with RSSS, no purchase orders were issued and no quotations were accepted by Telkom. The trial which was initially heard in May 2016 has been re-enrolled for hearing in late August 2017.
Phutuma Networks Proprietary Limited (Phutuma)In August 2009 Phutuma served summons on Telkom, claiming damages to the amount of R5,5 billion arising from the cancellation of a tender published by Telkom in November 2007. The High Court granted absolution from the instance, in Telkom’s favour. The Supreme Court of Appeal (SCA) had initially dismissed Phutuma’s application for leave to appeal in October 2014. In November 2014, the SCA rescinded its order granted in October 2014. In early 2015, the SCA referred the appeal back to the North Gauteng High Court. The appeal which was heard in September 2016, was upheld. A request has been made for the re-enrollment of the matter for trial. We are awaiting a court date.
OtherSection 197: Labour Relations ActTelkom invoked a process in terms of Section 197 of the Labour Relations Act, to outsource certain service functions, in Telkom, as going concerns. Section 197 (8) states that Telkom and the new employers are jointly and severally liable to any employee who was transferred and becomes entitled to receive payment as a result of the employee’s dismissal for reasons relating to the new employer’s operational requirements or liquidation. Telkom will be held liable for a period of 12 months after the date of transfer, which may result in an onerous obligation.
Contingent assetTax mattersAs noted in the 2015 consolidated annual financial statements, the tax treatment of the loss that arose in 2012 and 2014 financial years on the sale of foreign subsidiaries is based on a specific set of circumstances and a complex legislative environment. A tax refund received during prior periods, relating to the 2012 sale, is contingent and will only be recognised once the matter has been resolved with SARS.
17 Provisions 2017 Rm
2016 Rm
Non-current portion of provisions 1 592 1 731
Employee related 1 536 1 665
Non-employee related 56 66
Current portion of provisions 1 521 2 373
Employee related 1 397 2 231
Non-employee related 124 142
The decrease in the non-current employee provision is mainly due to the change in assumptions used to value Telkom’s obligation to future retirees in the Telkom retirement fund. The assumptions used are based on the valuation techniques prescribed by IAS 19. The decrease in the current employee provision is mainly due to the settlement of the VSP/VERP packages provided in the prior financial year and a lower bonus provision in the current financial year due to changes to the remuneration policy.

Condensed consolidated provisional annual financial statements 84 85Telkom group provisional annual results 2017
Notes to the condensed consolidated provisional annual financial statements (continued)for the year ended 31 March 2017
21 Related parties 2017 Rm
2016 Rm
Details of material transactions and balances with related parties
were as follows:
With shareholders:
Government of South Africa*
Related party balances
Finance lease receivable 180 272
Trade receivables 692 562
Provision for doubtful debt (147) (67)
Related party transactions
Revenue (3 927) (3 699)
Individually significant revenue** (1 376) (1 282)
Department of Correctional Services (85) (78)
Department of Justice (107) (104)
South African National Defence Force (70) (66)
South African Police Services (586) (577)
S.I.T.A. Proprietary Limited (214) (201)
Ekurhuleni Metropolitan Council (77) (57)
Department of Internal Affairs (52) (53)
Eastern Cape Department of Health*** (52) (49)
Department of Agriculture (54) (33)
Province of KZN Health Service*** (79) (64)
Collectively significant revenue** (2 551) (2 418)
* Comparatives are restated.** The nature of the individually and collectively significant revenue consists mostly of data revenue.*** Individually significant from the current year.
At 31 March 2017, the Government of South Africa held 39.3% (2016: 39.3%) of Telkom’s shares, and has the ability to exercise significant influence, and the Public Investment Corporation held 11.9% (2016: 11.4%) of Telkom’s shares.
21 Related parties (continued) 2017 Rm
2016 Rm
With entities under common control:Major public entitiesRelated party balances
Trade receivables 40 130
Trade payables (21) (5)
Related party transactions
Revenue (291) (394)
Expenses 236 226
Individually significant expenses 236 207
South African Post Office 63 52
Eskom 173 155
Collectively significant expenses – 19
Rent received (35) (28)
Individually significant rent received:
South African Post Office (26) (25)
Collectively significant rent received (9) (3)
Rent paid 25 10
Individually significant rent paid: South African Post Office 20 5
Collectively significant rent paid 5 5
Key management personnel compensation:
(Including directors and prescribed officers’ emoluments)
Related party transactions
Short-term employee benefits 262 308
Post-employment benefits 13 17
Termination benefits 19 14
Equity compensation benefits 17 14
Terms and conditions of transactions with related partiesOutstanding balances at the year-end are unsecured, interest free and settlement occurs in cash. There have been no guarantees provided or received for related party receivables or payables.

Condensed consolidated provisional annual financial statements 86 87Telkom group provisional annual results 2017
Notes to the condensed consolidated provisional annual financial statements (continued)for the year ended 31 March 2017
22 Significant events
Results of the Telkom Annual General Meeting regarding directors’ re-appointmentsOn 24 August 2016, all board members were re-elected as per the Annual General Meeting ordinary resolutions.
Dividends The Telkom board declared an ordinary dividend of 270 cents per share on 6 June 2016 payable on 4 July 2016 to shareholders registered on 1 July 2016.
The Telkom board declared an interim dividend of 131.23874 cents per share on 11 November 2016 which was payable on 5 December 2016 to shareholders registered on 2 December 2016. Employee Share Plan During April 2016, Telkom purchased 3 710 126 shares from the market through Rossal, a wholly owned subsidiary for the purposes of the employee share plan.
Telkom Enterprise and Business Connexion (BCX) Integration On 6 June 2016, Telkom announced its intention to integrate Telkom Enterprise into BCX. BCX operates as the Business to Business arm of the larger Telkom group. As from November 2016, the Telkom Enterprise business has been integrated into BCX. The integration enables the Telkom group to offer Enterprise solutions beyond connectivity and to strengthen Telkom’s leadership in the Enterprise market. Allocation of shares in terms of the Telkom Employee Share Plan On 6 June 2016, the board approved the fourth allocation of shares to employees in terms of its Employee Share Plan. The number of shares that vests will depend on the extent to which the performance conditions are met at the end of the applicable vesting period. Vesting and sale of shares In terms of the Telkom Share Plan 161 627 and 64 685 shares vested to Sipho Maseko and Deon Fredericks respectively. On 4 July 2016, Sipho Maseko disposed of 145 907 shares.On 5 July 2016, Sipho Maseko and Deon Fredericks disposed of 15 720 and 25 581 shares respectively. Appointment of non-executive director Telkom has announced on 20 October 2016 that Dr Hamadoun Touré has been appointed to the board of directors as a non-executive director with effect from 19 October 2016.
Resignation of non-executive director Telkom announced on 3 November 2016 that Ms Nunu Ntjeke (Ntshingila) had informed the board of her resignation as director with effect from 3 November 2016.
23 Events after the reporting date
Dividends The Telkom board declared an ordinary dividend of 290.75253 cents per share on 5 June 2017 payable on 3 July 2017 to shareholders registered on 30 June 2017. Resignation of non-executive director Telkom announced on 11 May 2017 that Ms Thembisa Skweyiya (Dingaan) had informed the board of her resignation as director from 10 May 2017.
Establishment of Gyro group Telkom SA SOC Ltd (Telkom) and Gyro group, are entering into a sale of business for shares transaction in terms of which Telkom is selling its Masts and Towers (M&T) business to an existing subsidiary, Swiftnet, and 40 properties to a newly established wholly owned subsidiary, Gyro.
The M&T business will be sold as a going concern. Included in the M&T business are contracts, licenses, M&T fixed assets and free right of use on Intellectual Property (IP) all of which is currently used by the M&T business. The 40 properties consist of technical, commercial and industrial properties owned by Telkom.
The sale is part of the Telkom’s endeavor to unlock value in its property and M&T portfolios and the sale will be effective from the date of transfer of the properties. Other matters The directors are not aware of any other matters or circumstance since the financial year ended 31 March 2017 and the date of this report, or otherwise dealt with in the financial statements, which significantly affects the financial position of the group and the results of its operations.

Overview of our business 88 Telkom group provisional annual results 2017 89
05 Today’s presentation