telling stories with open data
TRANSCRIPT

Reth
ink Telling Stories with Open Data
Engage Your Citizens with Data-driven Storytelling

Reth
ink
Webinar Panelists
Kate BenderSENIOR PERFORMANCE MANAGEMENT ANALYST
Kansas City, MO
Thom RobbinsSENIOR PRODUCT MARKETING MANAGER
Socrata, Inc.
Kate Bender is a senior analyst with the Office of Performance
Management, part of the City Manager’s Office in Kansas City,
Missouri. One of her first responsibilities after starting with the
city in 2007 was to analyze 311 data, which became the
foundation for the development of the Office of Performance
Management in 2009. In the 4 years since, the Office of
Performance Management has developed a new framework for
analysis and reporting that integrates other data sources such as
citizen survey data and department performance indicators and
reports out to the public via KCStat.
As Socrata’s chief product marketer, Thom focuses on helping
people understand what Open Data can do for them. He is a
guiding force in demonstrating the value of Open Data, the
versatility of the Socrata platform, and how public sector
organizations can leverage data technology to better engage
constituents.
A prolific business writer, Thom helps bridge the gap between the
technical needs of developers and the aspirational desires of
forward-thinking government leaders. He has authored many
books and articles, including, “If Abraham Lincoln Were a CMO.”

Reth
ink
Reth
ink
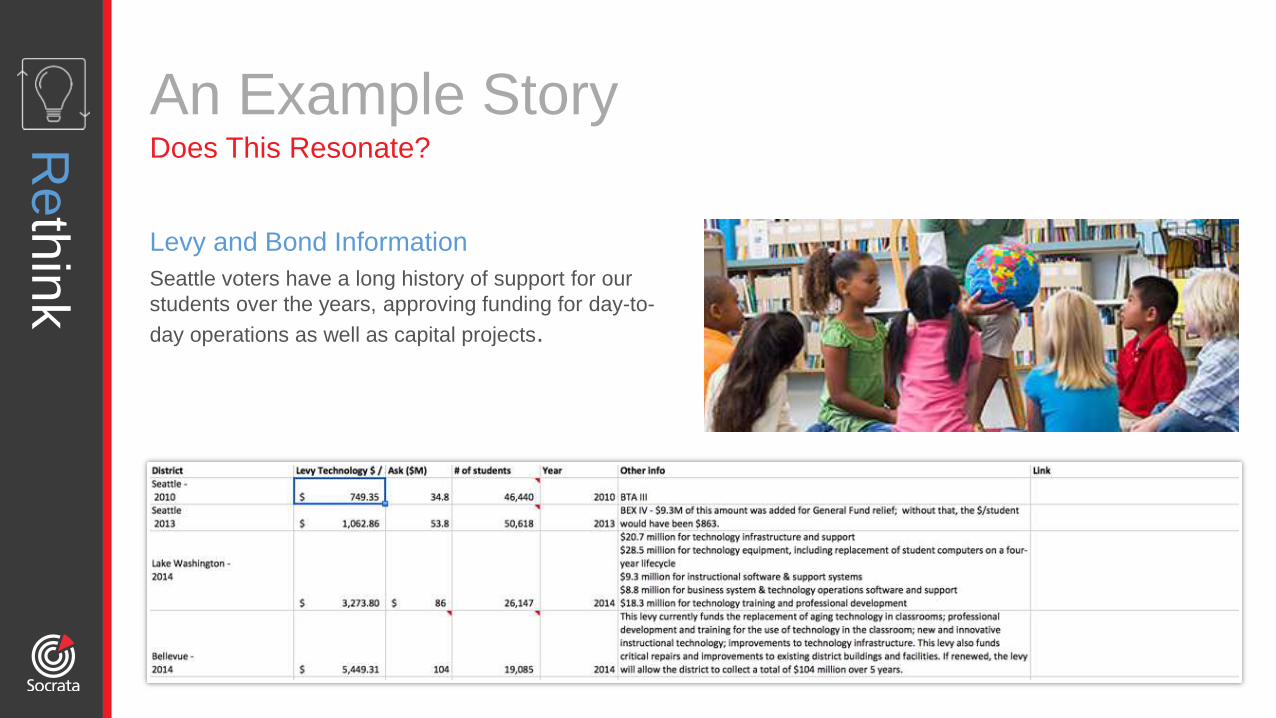
An Example StoryDoes This Resonate?
Levy and Bond Information
Seattle voters have a long history of support for our
students over the years, approving funding for day-to-
day operations as well as capital projects.

Reth
ink
An Example StoryIs This a Better Start?
Levy Technology $ / Student
$6,000
$5,000
$4,000
$3,000
$2,000
$1,000
$
SEATTLE
2010
SEATTLE
2013
LAKE WASHINGTON
2014
BELLEVUE
2014
$749.35$1,062.86
$3,273.80
$5,449.31

Reth
ink
WelcomeWhat’s The Power of a Story?
“People are more interested in a great story than
in the storyteller. If you want to get your point
across, you need to learn how to condense your
data into a good story.”
Reth
ink
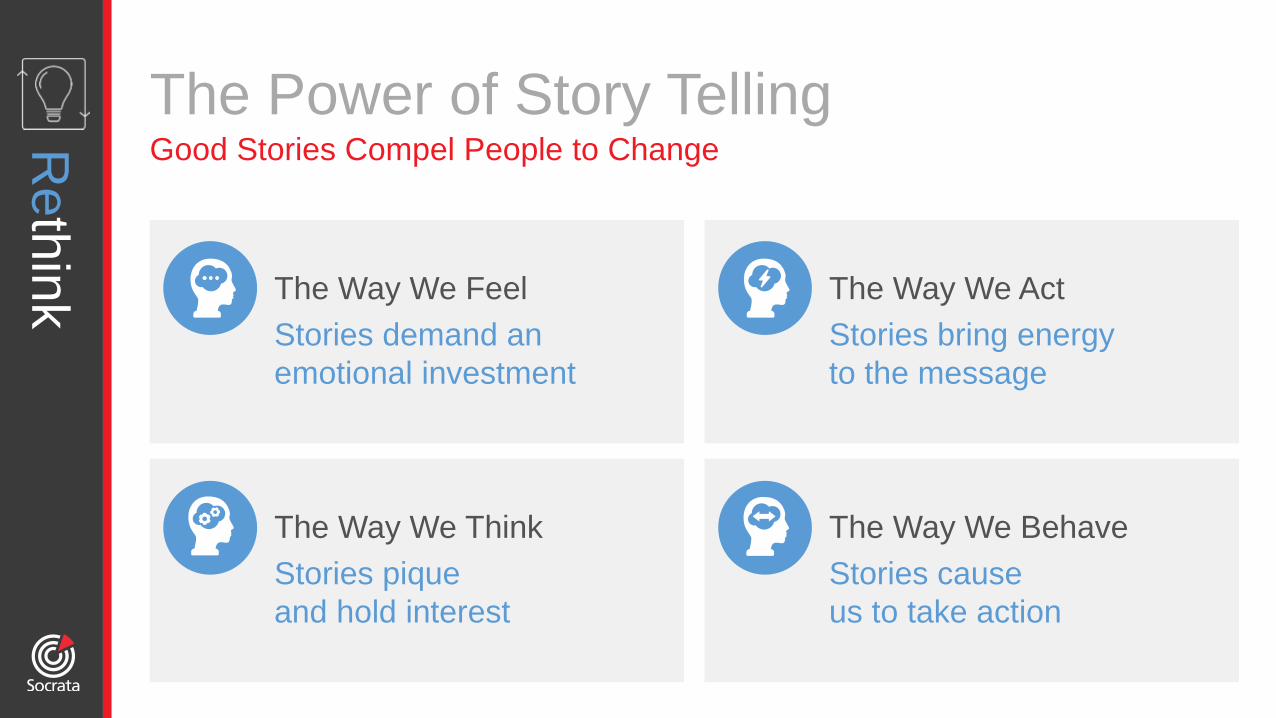
The Power of Story Telling Good Stories Compel People to Change
The Way We Feel
Stories demand an
emotional investment
The Way We Act
Stories bring energy
to the message
The Way We Think
Stories pique
and hold interest
The Way We Behave
Stories cause
us to take action
Reth
ink
Story Rule #1
Content
(Data) is king
Reth
ink
Story Rule #2
Collaboration
is Queen

Reth
ink
Lessons from the Private SectorThe Value of Story Telling
Emotional branding is a progressive marketing strategy used that
has been shown to drive revenue and increase customer retention.
How a person feels about your brand typically determines whether
they buy your product.
A brand is a matter of perception. When you tell a story that embodies
human challenges, you create an experience that resonates with your
customers.

Reth
ink
Storytelling CharacteristicsMixture of Marketing, Branding, & Fiction Writing
1. Speak Truthfully – Honesty, transparency an consistency are vital parts of any story and all stories
should be rooted in in your citizens reality.
2. Infuse personalities into stories – Boring stories won’t attract and retain people, but stories
brimming with personality will.
3. Create characters you’re your citizens will root for – Create characters that enable your audience
to become emotionally connected and want to follow them
4. Include a beginning, middle and end – Fictional stories follow a structure that includes a beginning,
middle and end. Your data stories should follow a similar structure.
5. Don’t give it all away – Make sure your data stories are page turners and focus on leaving your
citizens wanting more.
Reth
ink
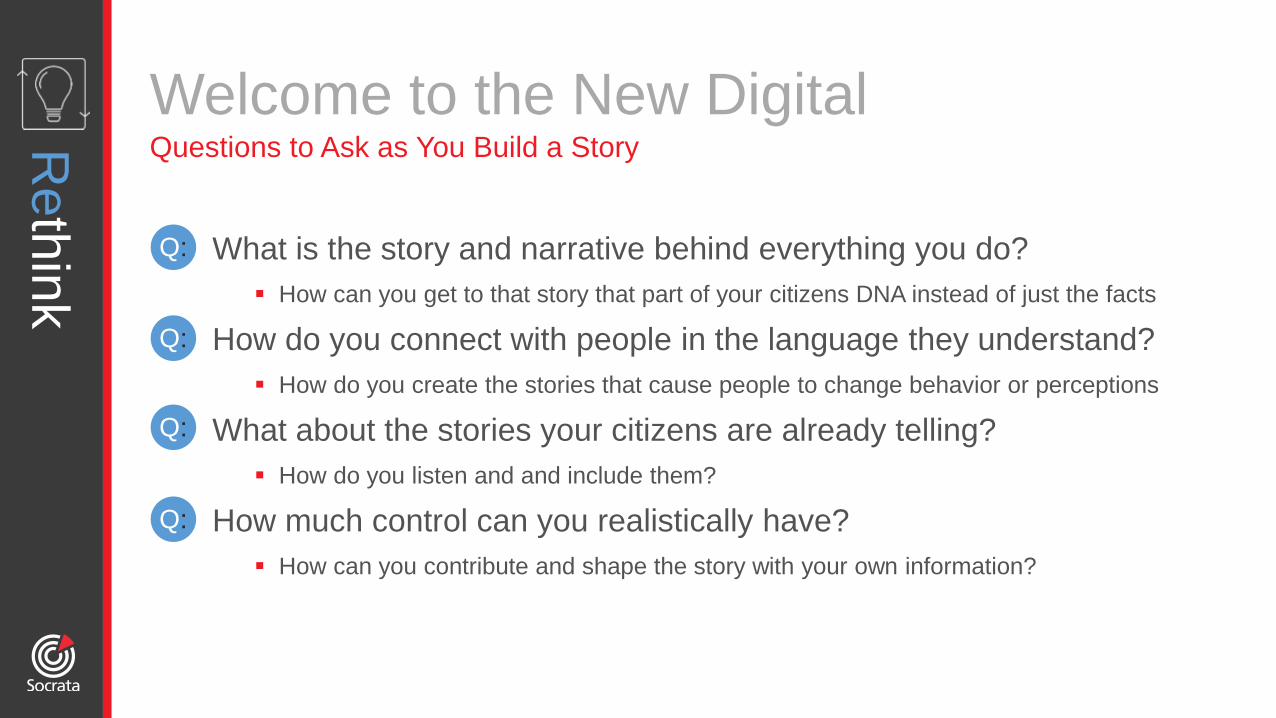
Welcome to the New DigitalQuestions to Ask as You Build a Story
What is the story and narrative behind everything you do?
How can you get to that story that part of your citizens DNA instead of just the facts
How do you connect with people in the language they understand?
How do you create the stories that cause people to change behavior or perceptions
What about the stories your citizens are already telling?
How do you listen and and include them?
How much control can you realistically have?
How can you contribute and shape the story with your own information?
Q:
Q:
Q:
Q:

Reth
ink
Time
Methods
Classifying Data Stories4 Dimensions of Stories with Data & Analytics
Focus
Depth

Reth
ink
Classifying Data StoriesTime-based Stories
Analytics stories about the past, present,
or future
Past
Most common type of analytical reporting is about the past
(it’s reporting)
Present
Most involve a survey and stories of what people
are currently doing
Future
Predictive model based on the past

Reth
ink
Classifying Data StoriesFocus-based Stories
Telling a “What”, “Why” or “How” to address
the issue in the story
What stories
Like reporting – they simply tell what happened
Why stories
Go into underlying factors that caused the outcome
How to address the issues
Focus on ways to improve the situation identified in the What and
Why stories

Reth
ink
Classifying Data StoriesDepth-based Stories
“CSI” Stories
Relatively small ad-hoc investigation to find out why something
sub-optimal is happening
Eureka Stories
Long, analytical-driven searches for a solution to a problem
Tend be long, important and expensive to getting stakeholder
buy-in is vital

Reth
ink
Classifying Data StoriesMethods-based Stories
Different types of stories based on the analytical
methods used
Correlation story
Relationship among variables rose or fell at the same time
Causation story
One variable caused the other
Reth
ink
Thank You!
Find Us!
Socrata.com
Follow Us!
@Socrata
Friend Us!
facebook.com/socrata
Watch Us!
http://www.youtube.com/user/socratavideos

Reth
ink
LEVEL OF DATA MATURITY
Consumer-style web &
mobile interfaces
Accessible storytelling
tools for Publishers
Open Performance and
fact-based decision
making
Robust, high-
performance data APIs
and developer
resources
Automated, real-time
data publishing
Turnkey, UX optimized
apps for high-value data
LEVEL 4
Data as
a Platform
Automatic syndication to
the Consumer Web
Built-in Apps Ecosystem
Data for analytics and
predictive modeling
Intra-government data
federation
Open connectors to
enterprise systems
Domain-specific peer
benchmarking
Location awareness and
mobile by default
Crowdsourcing data and
insight
Sensor-based streaming
data and apps
Data science-enabled
semantic discovery
across the network
LEVEL 5
The Open
Data Network
Scattered spreadsheets
and PDFs online
Legacy custom
web apps
LEVEL 1
Pre Open Data Silos
Basic catalog of
downloadable files
(CSV, XLS, SHP, ZIP,
PDF)
Metadata/Catalog APIs
LEVEL 2
The Catalog Phase
IT resource-intensive
development project
Manual data publishing
Limited interactivity with
basic data tables, and
visualizations
Social sharing
LEVEL 3
Basic Interactive Experience
Our Approach to Customer ValueProducts Designed to Support Program Maturity