telus investor booklet merrill lynch communications forum dallas, texas march 2005
TRANSCRIPT

TELUS investor booklet
Merrill LynchCommunications Forum
Dallas, TexasMarch 2005
2
This booklet and answers to questions contain forward-looking statements about expected future events including competition, labour relations developments and financial and operating results that are subject to risks and uncertainties. TELUS’ actual results, performance, or achievement could differ materially from those expressed or implied by such statements. For additional information on potential risk factors, see TELUS’ 2004 Annual Information Form, and other filings with securities commissions in Canada and the United States.
TELUS disclaims any intention or obligation to update or revise any forward-looking statements, whether as a result of new information, future events or otherwise.
forward-looking statements
all dollars in C$ unless otherwise specified
3
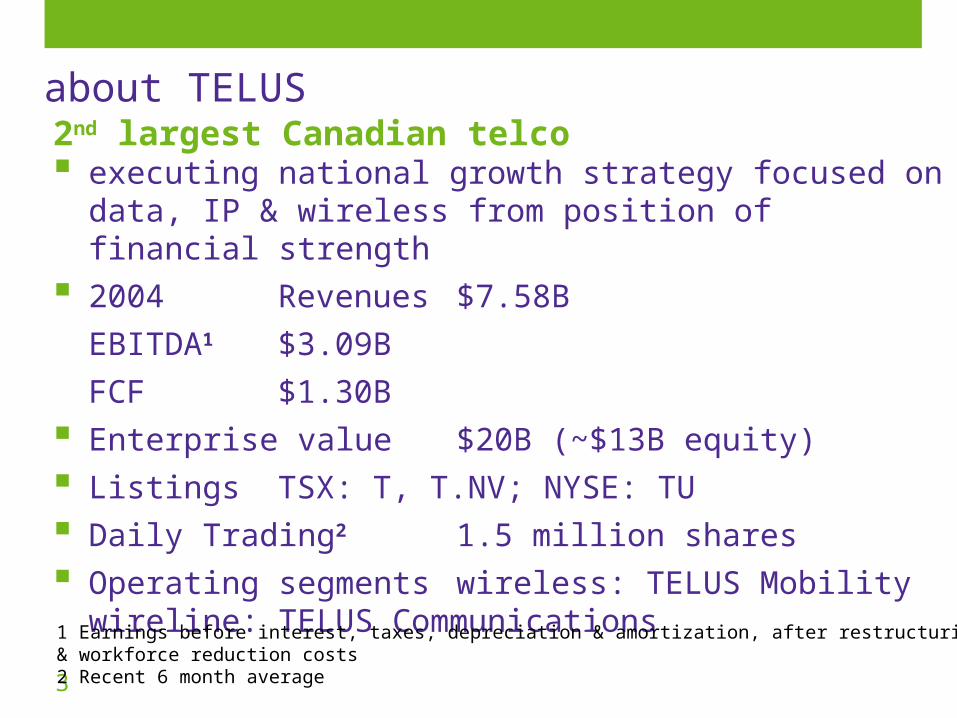
2nd largest Canadian telco executing national growth strategy focused on data, IP &
wireless from position of financial strength
2004 Revenues $7.58B
EBITDA1 $3.09B
FCF $1.30B
Enterprise value $20B (~$13B equity)
Listings TSX: T, T.NV; NYSE: TU
Daily Trading2 1.5 million shares
Operating segments wireless: TELUS Mobilitywireline: TELUS Communications
1 Earnings before interest, taxes, depreciation & amortization, after restructuring & workforce reduction costs2 Recent 6 month average
about TELUS
4
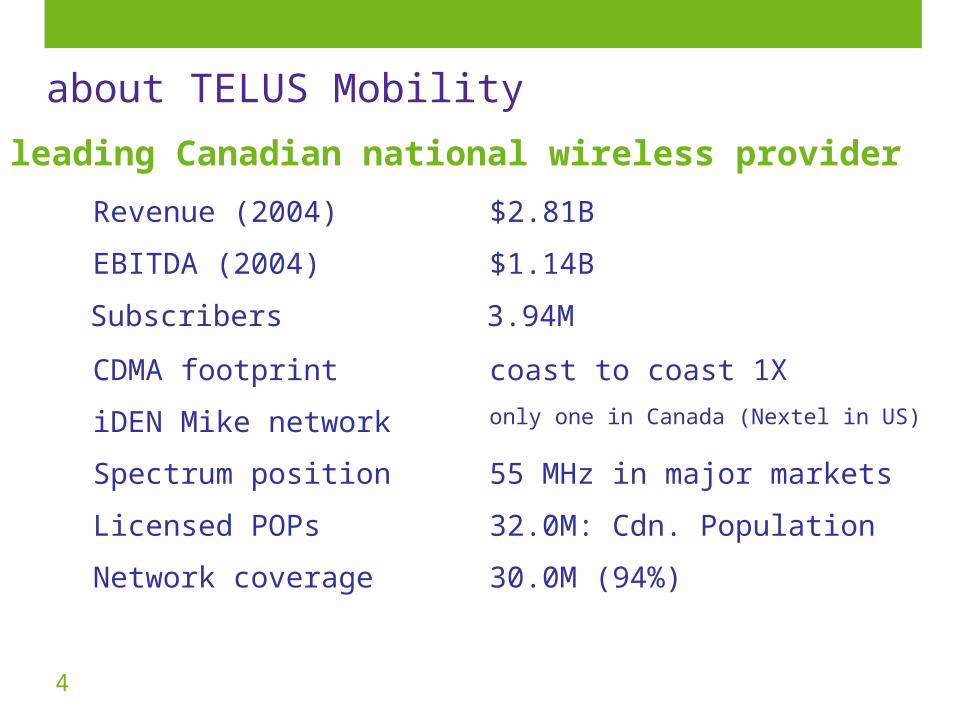
about TELUS Mobility
32.0M: Cdn. PopulationLicensed POPs
30.0M (94%)Network coverage
55 MHz in major marketsSpectrum position
only one in Canada (Nextel in US)iDEN Mike network
coast to coast 1XCDMA footprint
$1.14B EBITDA (2004)
$2.81BRevenue (2004)
3.94MSubscribers
leading Canadian national wireless provider
5
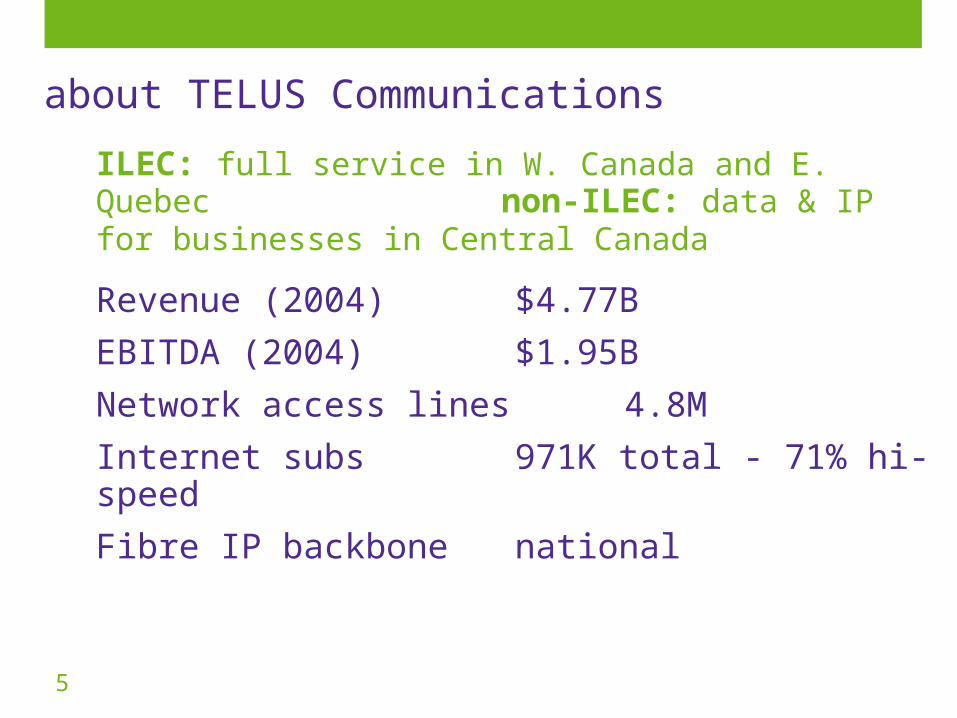
ILEC: full service in W. Canada and E. Quebec non-ILEC: data & IP for businesses in Central Canada
Revenue (2004) $4.77B
EBITDA (2004) $1.95B
Network access lines 4.8M
Internet subs 971K total - 71% hi-speed
Fibre IP backbone national
about TELUS Communications
6
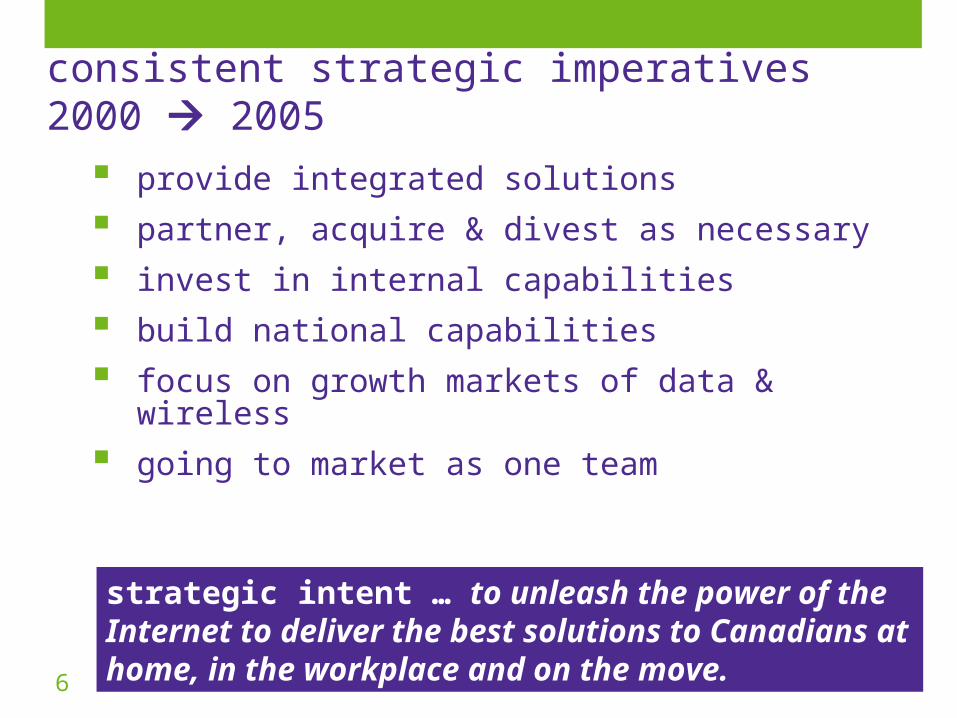
consistent strategic imperatives 2000 2005
provide integrated solutions
partner, acquire & divest as necessary
invest in internal capabilities
build national capabilities
focus on growth markets of data & wireless
going to market as one team
strategic intent … to unleash the power of the Internet to deliver the best solutions to Canadians at home, in the workplace and on the move.
7
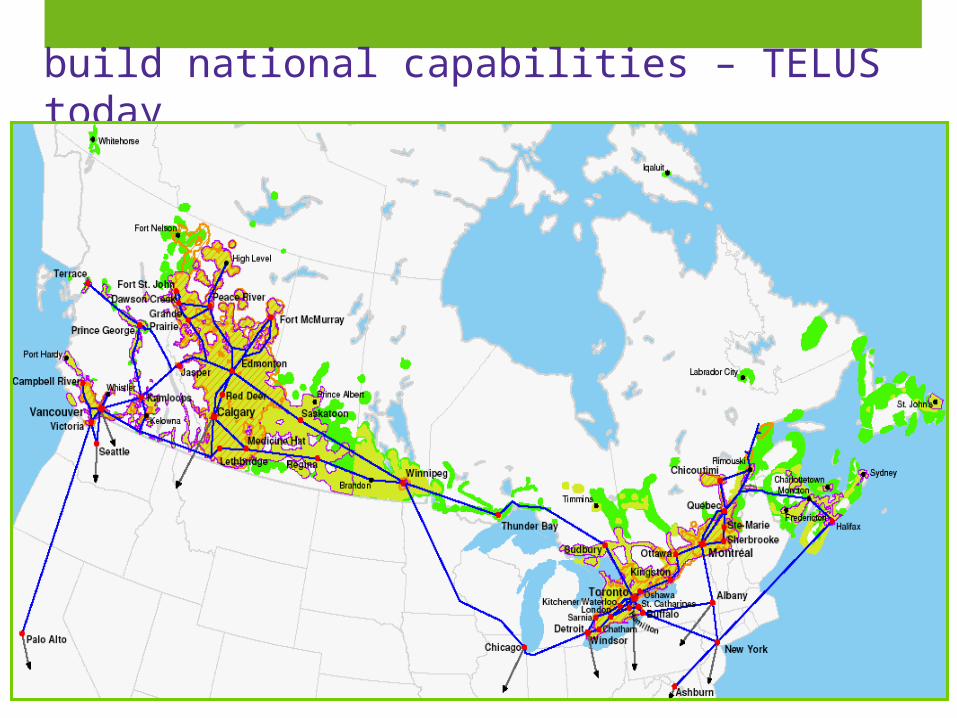
build national capabilities – TELUS today
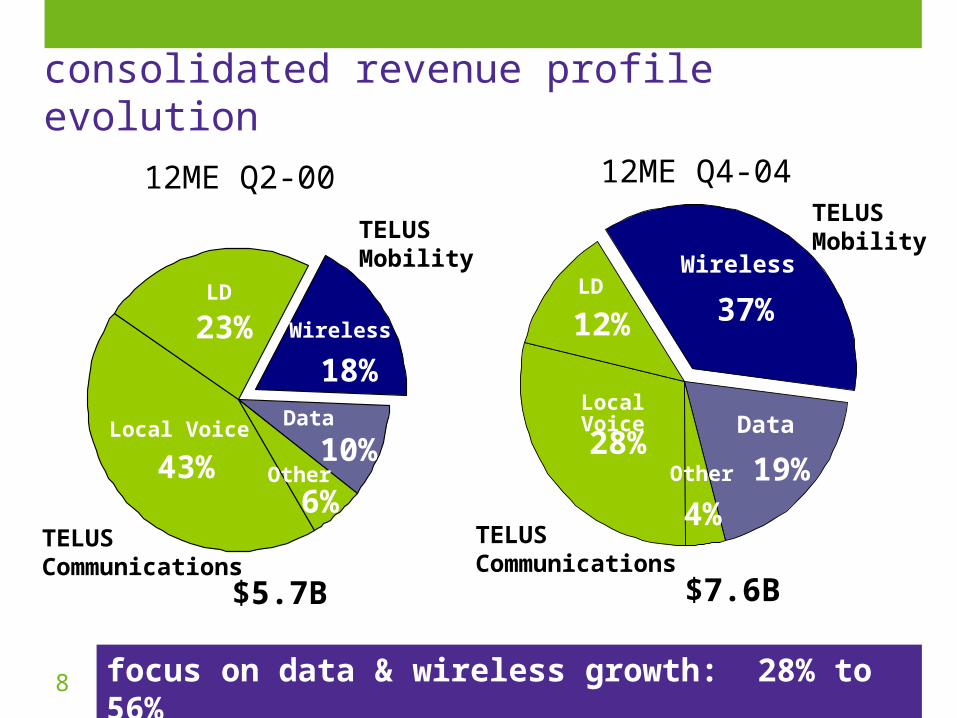
8 focus on data & wireless growth: 28% to 56%
$5.7B
43%
18%
10%
6%Other
12ME Q4-04
$7.6B
Local Voice
Wireless
Data28%
37%
19%
4%Other
LD
Wireless
12ME Q2-00
Local Voice
23%
Data
12%LD
TELUSCommunications
TELUSCommunications
TELUSMobility
TELUSMobility
consolidated revenue profile evolution
9
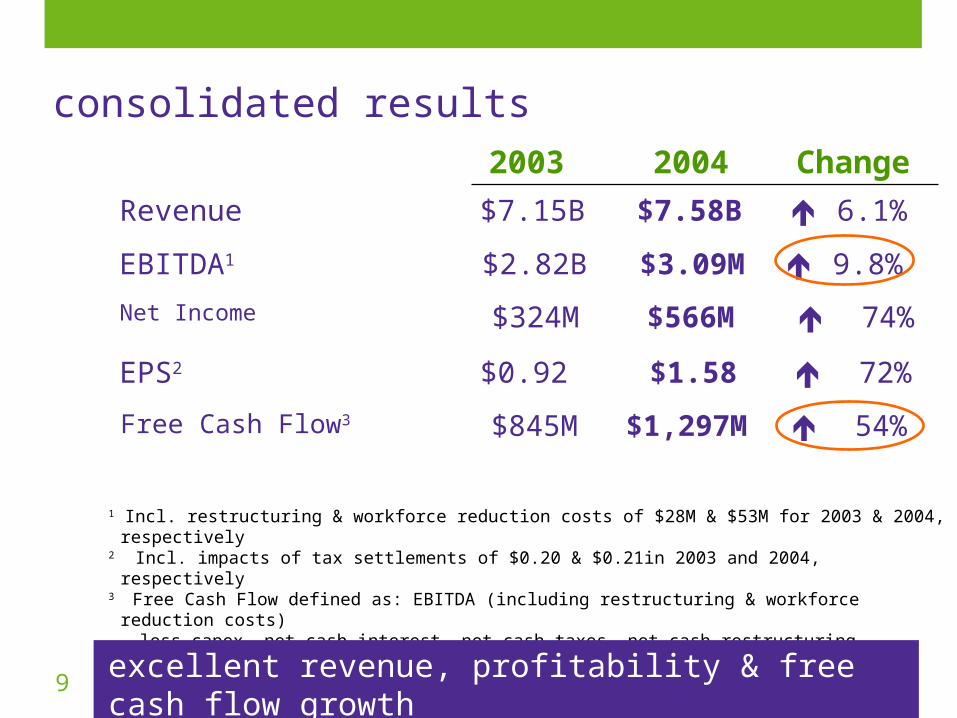
consolidated results
Change
1 Incl. restructuring & workforce reduction costs of $28M & $53M for 2003 & 2004, respectively2 Incl. impacts of tax settlements of $0.20 & $0.21in 2003 and 2004, respectively3 Free Cash Flow defined as: EBITDA (including restructuring & workforce reduction costs) less capex, net cash interest, net cash taxes, net cash restructuring payments, and excess share
compensation expense over share compensation payments
74%$566M$324MNet Income
72%
$1.58$0.92EPS2
6.1%$7.58B$7.15BRevenue
9.8%$3.09M$2.82BEBITDA1
20042003
excellent revenue, profitability & free cash flow growth
54%$1,297M$845MFree Cash Flow3
TELUS Mobility
11
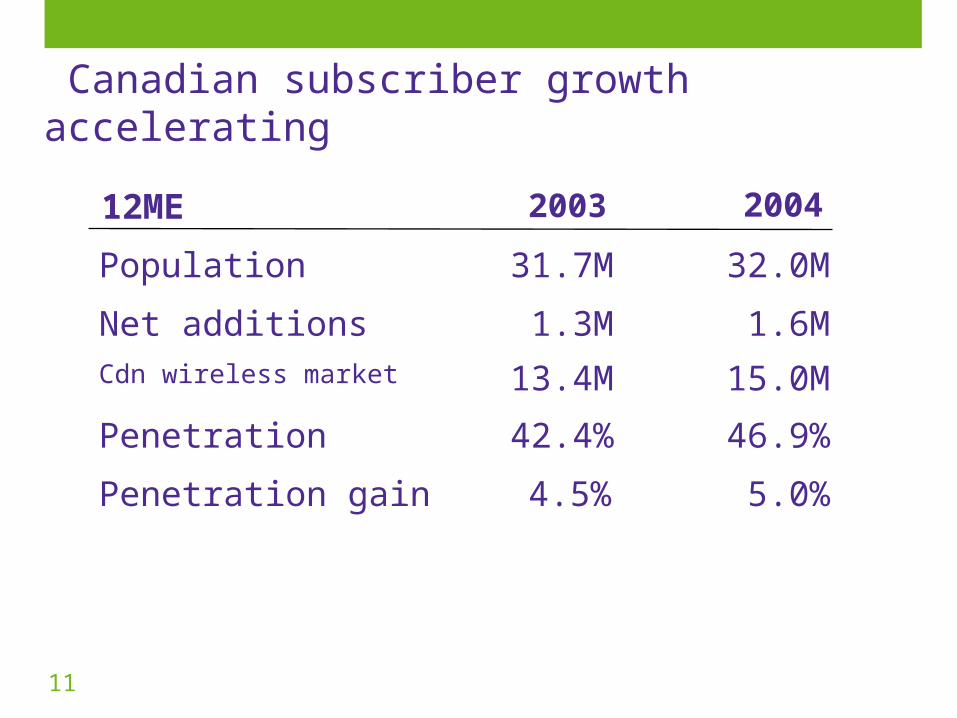
Canadian subscriber growth accelerating
5.0%4.5%Penetration gain
1.6M1.3MNet additions
32.0MPopulation 31.7M
15.0MCdn wireless market 13.4M
20042003
46.9%42.4%Penetration
12ME
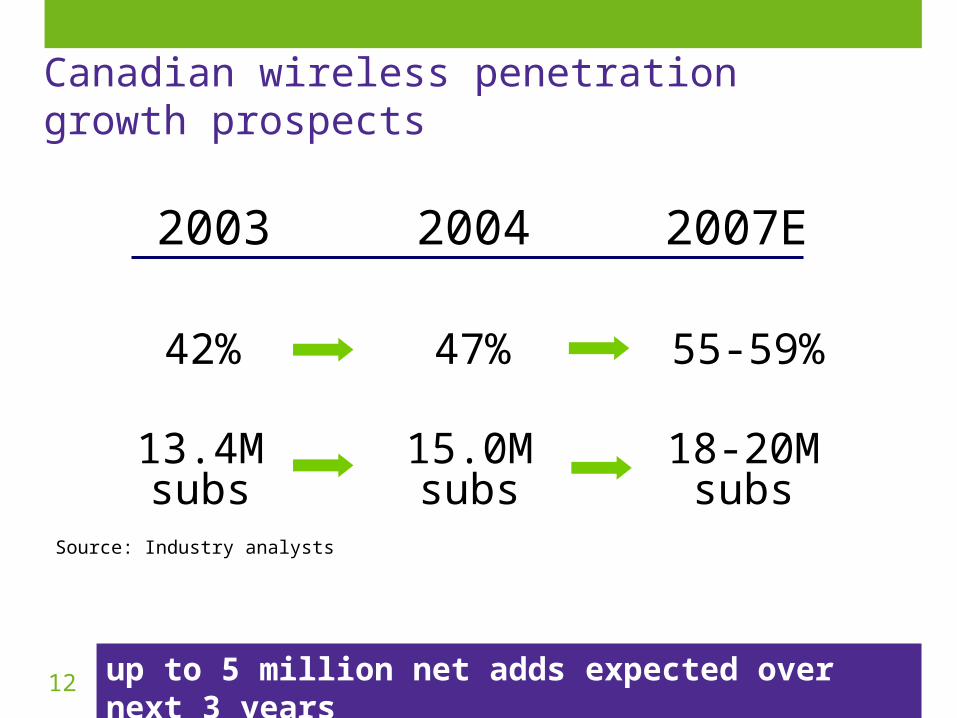
12 up to 5 million net adds expected over next 3 years
Source: Industry analysts
2003
42%
2007E
55-59%
2004
47%
13.4Msubs
18-20Msubs
15.0Msubs
Canadian wireless penetration growth prospects
13
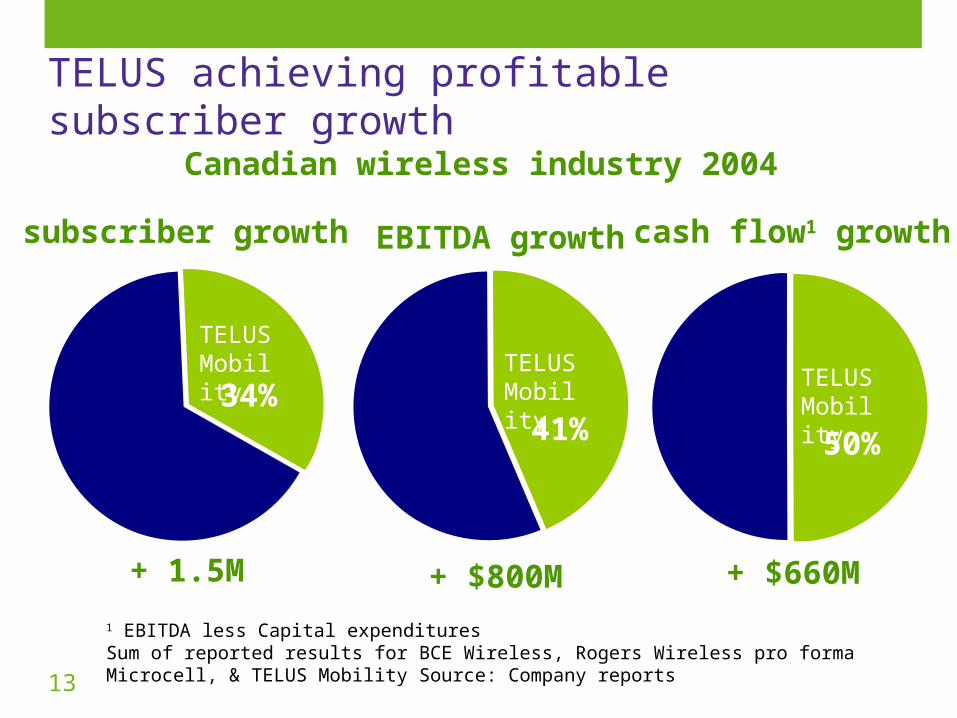
TELUS achieving profitable subscriber growth
1 EBITDA less Capital expendituresSum of reported results for BCE Wireless, Rogers Wireless pro forma Microcell, & TELUS Mobility Source: Company reports
EBITDA growth
subscriber growth
+ $800M+ 1.5M
TELUSMobility
41%34%
TELUSMobility
+ $660M
cash flow1 growth
50%
TELUSMobility
Canadian wireless industry 2004
14
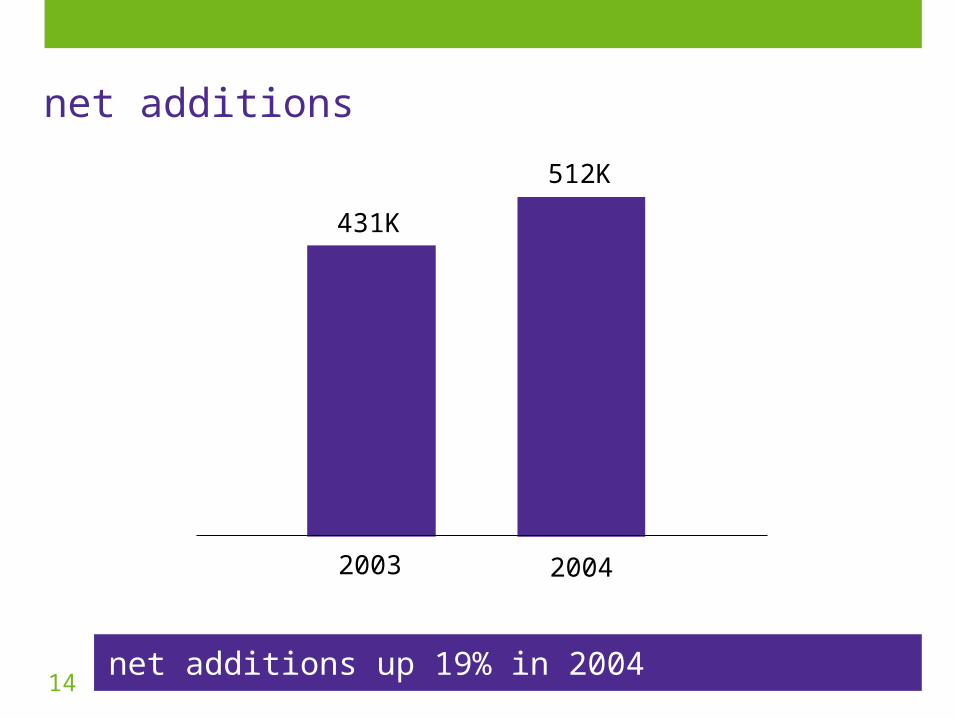
net additions
net additions up 19% in 2004
2003
431K
2004
512K
15
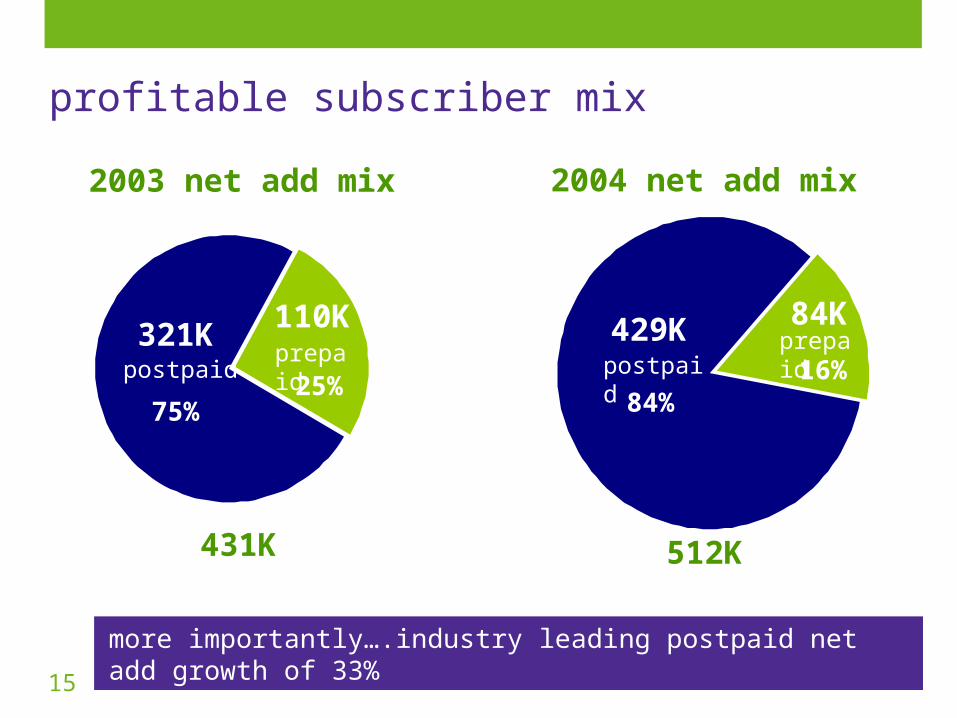
profitable subscriber mix
more importantly….industry leading postpaid net add growth of 33%
512K
2004 net add mix
84K
postpaidprepaid
84%
431K
2003 net add mix
prepaid
25%postpaid
75%
321K 429K110K
16%
16
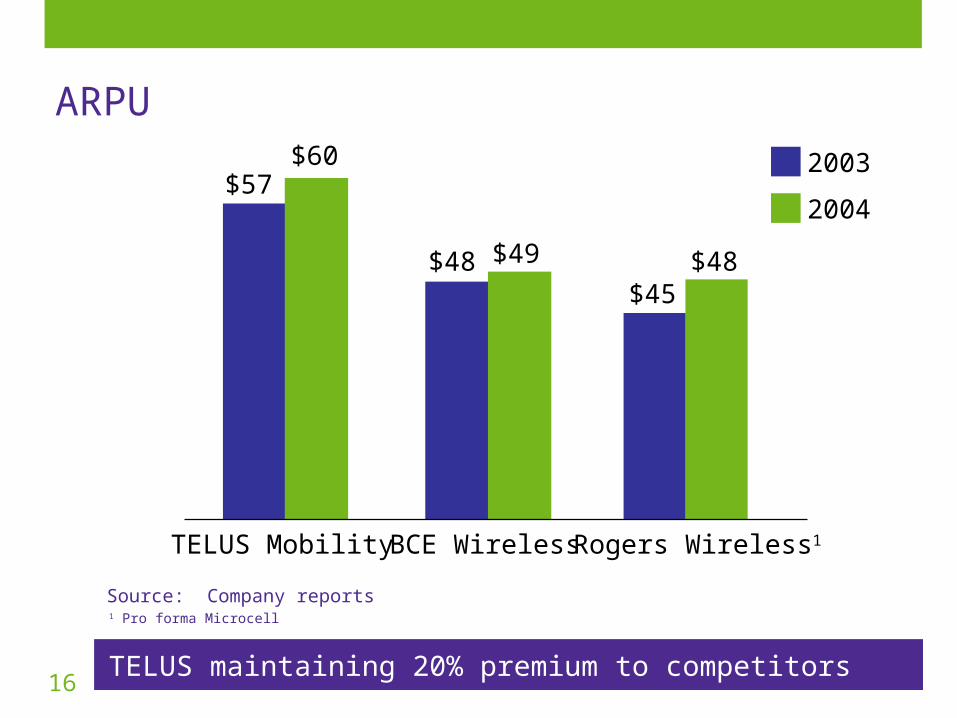
Source: Company reports
ARPU
TELUS maintaining 20% premium to competitors
TELUS Mobility Rogers Wireless1BCE Wireless
$57
$45$48
$60
$48$49
2003
2004
1 Pro forma Microcell
17
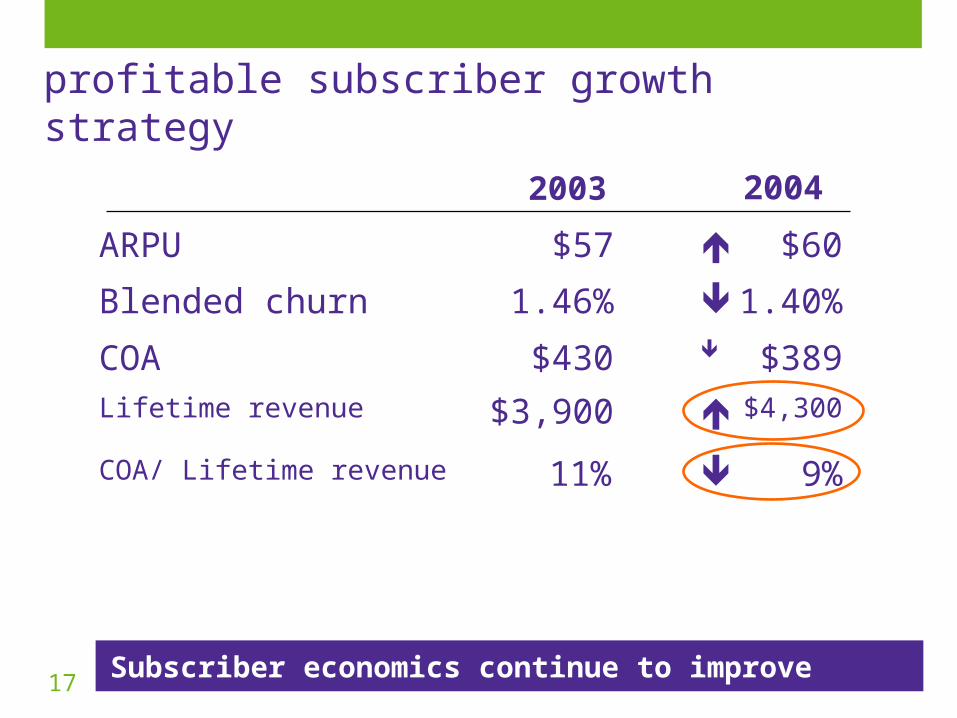
9%11%COA/ Lifetime revenue
1.40%1.46%Blended churn
$60ARPU $57
$389COA $430
20042003
$4,300
$3,900Lifetime revenue
Subscriber economics continue to improve
profitable subscriber growth strategy
18
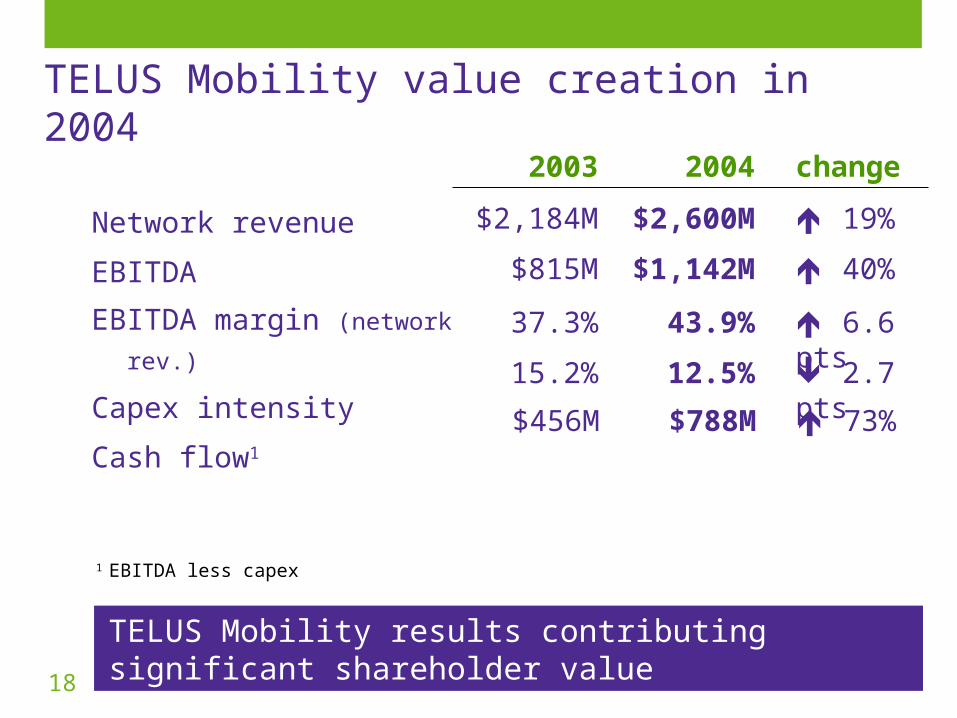
Network revenue
EBITDA
EBITDA margin (network rev.)
Capex intensity
Cash flow1
1 EBITDA less capex
2003 2004 change
$2,184M $2,600M 19%
$815M $1,142M 40%
37.3% 43.9% 6.6 pts
15.2% 12.5% 2.7 pts
$456M $788M 73%
TELUS Mobility value creation in 2004
TELUS Mobility results contributing significant shareholder value
19
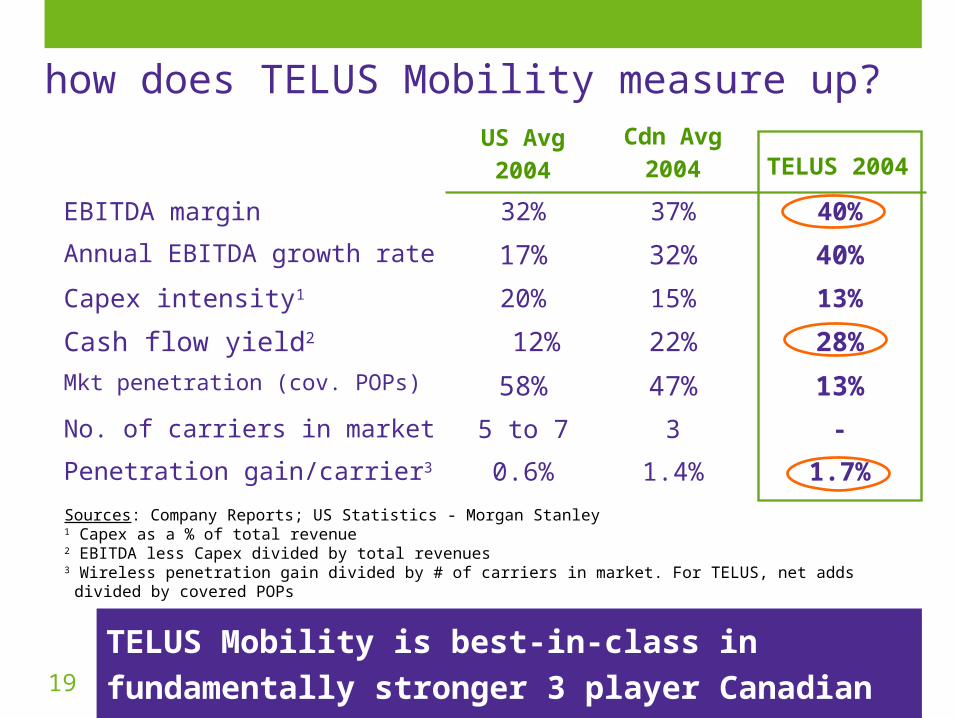
how does TELUS Mobility measure up?
Sources: Company Reports; US Statistics - Morgan Stanley1 Capex as a % of total revenue2 EBITDA less Capex divided by total revenues
3 Wireless penetration gain divided by # of carriers in market. For TELUS, net adds divided by covered POPs
Penetration gain/carrier3
No. of carriers in market
Mkt penetration (cov. POPs)
Cash flow yield2
Capex intensity1
Annual EBITDA growth rate
EBITDA margin
0.6%
5 to 7
58%
12%
20%
17%
32%
US Avg 2004
1.4%
3
47%
22%
15%
32%
37%
Cdn Avg
2004
1.7%
-
13%
28%
13%
40%
40%
TELUS 2004
TELUS Mobility is best-in-class in fundamentally
stronger 3 player Canadian wireless industry
20
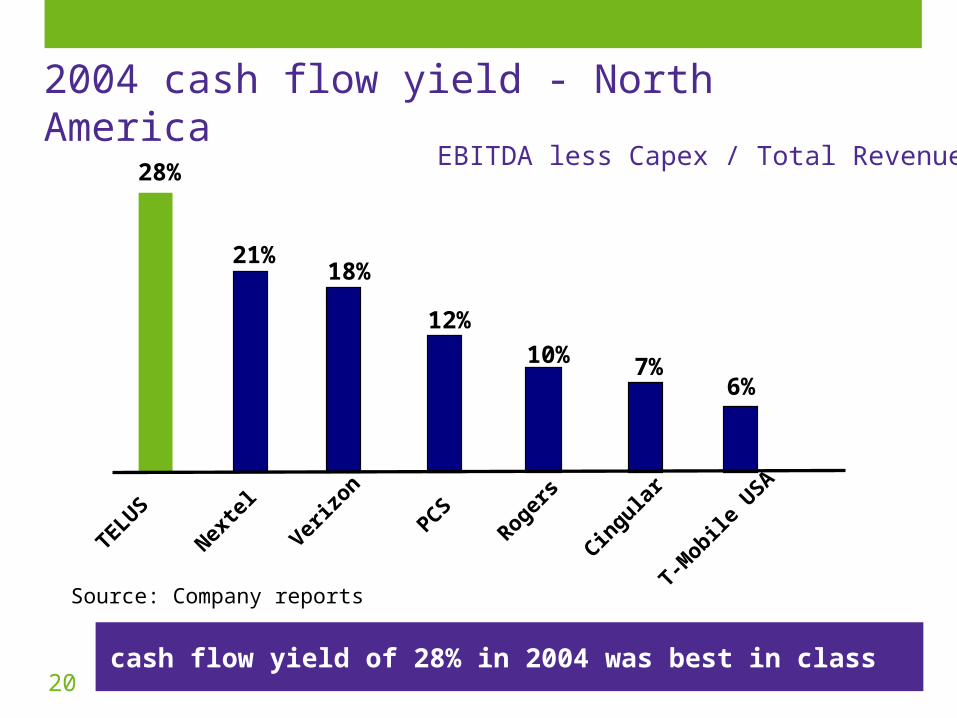
28%
21%18%
12%
10% 7%6%
TELUS
Verizo
n
Nexte
lPCS
Rogers
Cingula
r
T-Mobile
USA
2004 cash flow yield - North America
Source: Company reports
EBITDA less Capex / Total Revenue
cash flow yield of 28% in 2004 was best in class
21
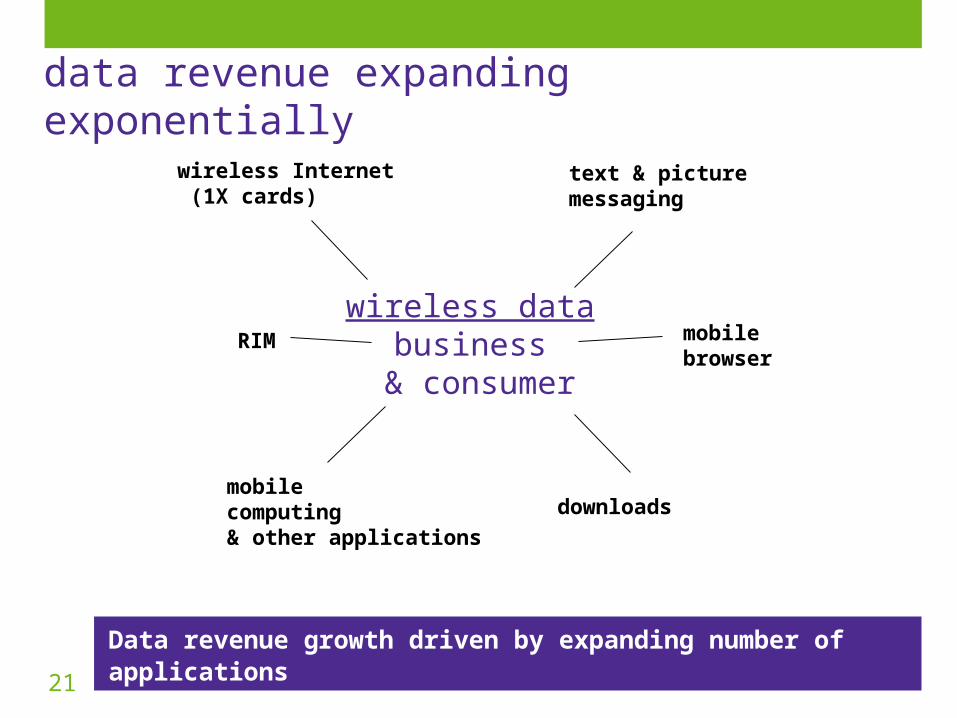
data revenue expanding exponentially
Data revenue growth driven by expanding number of applications
text & picturemessaging
mobilebrowser
downloadsmobilecomputing& other applications
RIM
wireless Internet (1X cards)
wireless databusiness
& consumer
22
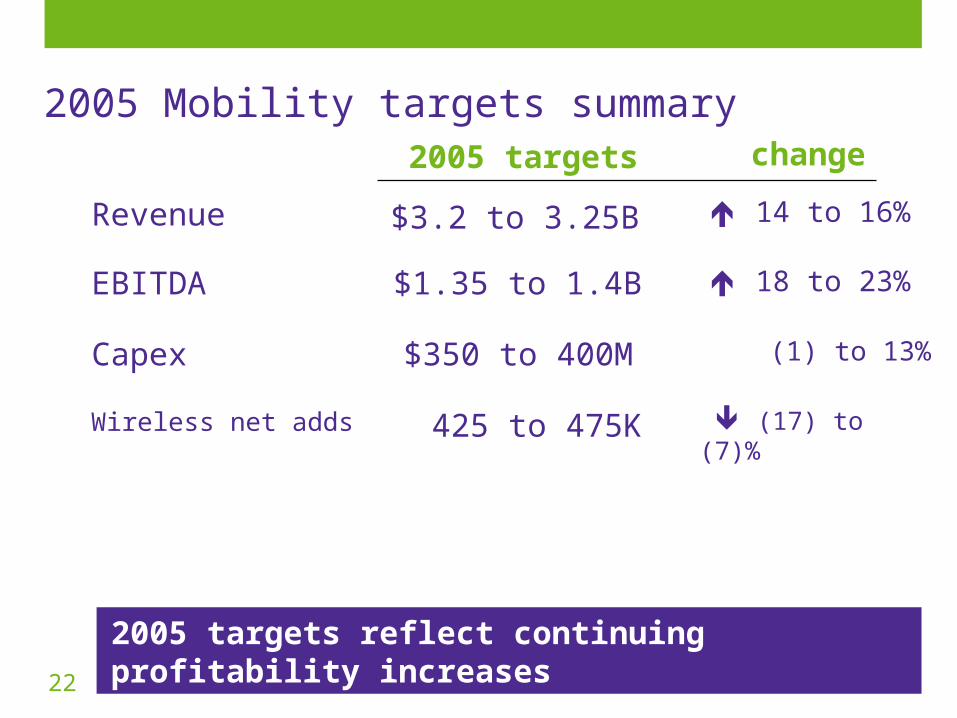
(1) to 13%$350 to 400MCapex
18 to 23%
change
EBITDA
Revenue
2005 targets
$1.35 to 1.4B
$3.2 to 3.25B 14 to 16%
2005 targets reflect continuing profitability increases
2005 Mobility targets summary
(17) to (7)% 425 to 475KWireless net adds
23
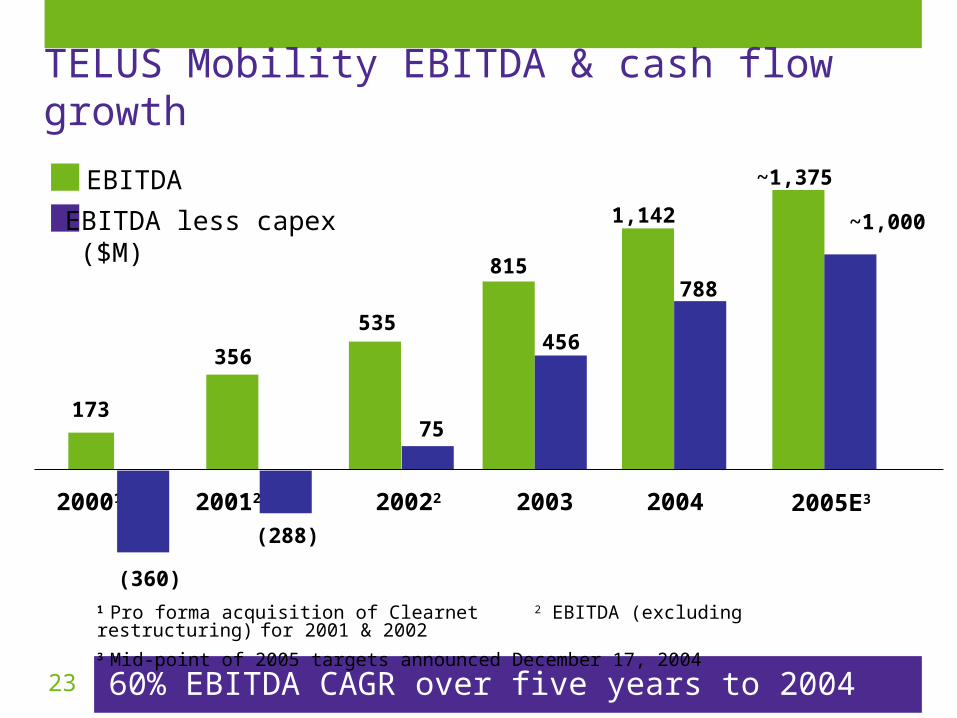
TELUS Mobility EBITDA & cash flow growth
60% EBITDA CAGR over five years to 2004
1 Pro forma acquisition of Clearnet 2 EBITDA (excluding restructuring) for 2001 & 2002
3 Mid-point of 2005 targets announced December 17, 2004
(360)
173
815
200320001
356
20012
535
20022
1,142
2004
456
(288)
75
EBITDA
EBITDA less capex($M)
788
2005E3
~1,375
~1,000

TELUS in 2005
25
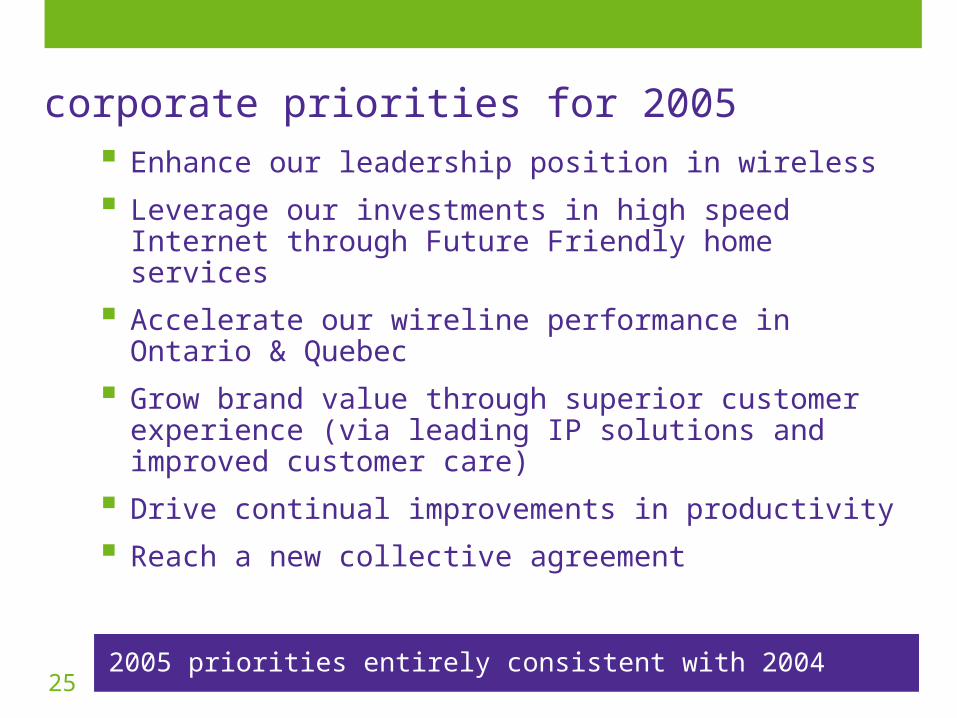
Enhance our leadership position in wireless
Leverage our investments in high speed Internet through Future Friendly home services
Accelerate our wireline performance in Ontario & Quebec
Grow brand value through superior customer experience (via leading IP solutions and improved customer care)
Drive continual improvements in productivity
Reach a new collective agreement
corporate priorities for 2005
2005 priorities entirely consistent with 2004
26
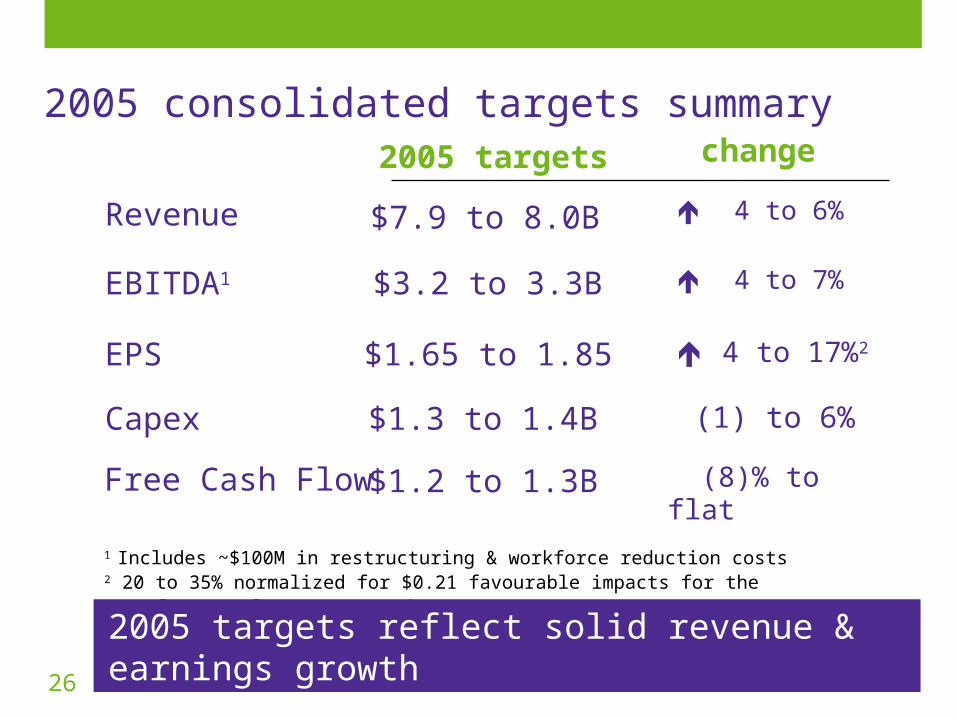
(1) to 6%$1.3 to 1.4BCapex
4 to 17%2$1.65 to 1.85EPS
4 to 7%
change
EBITDA1
Revenue
2005 targets
$3.2 to 3.3B
$7.9 to 8.0B
1 Includes ~$100M in restructuring & workforce reduction costs2 20 to 35% normalized for $0.21 favourable impacts for the settlement of tax matters in 2004
Free Cash Flow $1.2 to 1.3B
4 to 6%
2005 targets reflect solid revenue & earnings growth
2005 consolidated targets summary
(8)% to flat
27
Normal Course Issuer Bid for 25.5M TELUS shares effective Dec 20, 2004
2.2M shares repurchased for $78M in Q4 2004
Quarterly dividend 33% to 20¢ for Jan. 1, 2005
New dividend payout ratio guideline of 45 to 55% of net earnings
Measures to restrict issue of TELUS shares
Liquidity 26% due to 73.5M share offering by Verizon
shareholder value enhancing initiatives - update
balanced approach to stakeholder interests
28
TELUS Mobility top performing wireless carrier in N. America industry consolidation benefits without integration risks
TELUS Communications strong performance relative to other telcos improving results driven by stronger data & non-ILEC
high exposure to wireless
strong EPS growth
free cash flow of >$1B, resulting in attractive FCF yield
material debt & leverage reduction – exceeded targets
shareholder value focus reflected by recent initiatives
leading the way into 2005 with positive outlook
why invest in TELUS


Appendix
31
Price changes continue to roll through the base per minute billing - Jul-02 evening & weekend clock change - Jul-03 select calling features - Jul-04
minutes of use up 21% in 2003, 10% in 2004 expanding data offering (intercarrier SMS, 1X & RIM) roaming/resale agreements Verizon’s preferred Canadian PCS roaming partner iDEN roaming with Nextel in U.S.
ARPU drivers
Mobility segment
32
3 year contracts improved coverage
significant improvement in drop call rate expanded national footprint
better phones grandfathered rate plans dedicated retention team excellent customer care levels
Churn control & retention drivers
Mobility segment
33
excellent spectrum position - minimal cell splitting CDMA/1X roaming/resale agreements in Central &
Eastern Canada Network digitization largely complete Mike (iDEN) network largely built out 1X network implemented, voice capacity
improvement
Capex drivers
Mobility segment
34
e.ComReport Watch
excellence in investor communications ranked 9th globally by Corporate Essentials, “Annual Report of
Annual Reports”
1st in Canada; 2nd in North America ranked #1 in world for “strategy, objectives & outlook”
10 years of disclosure excellence in corporate reporting awards by Canadian Institute of Chartered Accountants
2003 annual report rated best in Canada
IR website ranked 3rd among global telcos by IR Web Report
member of DJSI, only N. American telco
35
excellence in … recognized as Canada’s Best Environmental Corporate
Citizen
only Canadian company to receive BEST award (ranked 6th globally) for employee learning and development
Illuminati Award for Best Leadership Development Program
long time “Imagine” company
focused on support of education, health & sports and arts