temperature and salinity tolerances predict range
TRANSCRIPT
Temperature and Salinity Tolerances Predict Range Expansion for Two Invasive Marine Invertebrates
Clifton Dassuncao MIT Sea Grant College Program
MITSG Center for Coastal Resources 292 Main Street, E38-300
Cambridge, MA 02139 [email protected]
Advisor: Judith Pederson, Ph.D. MIT Sea Grant College Program Publication no. MITSG 09-32 May 1, 2009

TABLE OF CONTENTS
1.0 Introduction 2.0 Austrominius modestus 3.0 Methods 4.0 Results 5.0 Discussion 6.0 Conclusion 7.0 References
1.0 Introduction Aquatic invasions of nonindigenous species have increased dramatically due to the globalization of consumer goods, which relies on shipping to connect once isolated marine environments (Bright 1999, Barbier and Shogren 2004, Perrings et al. 2005). European waters have been shown to pose a particularly high threat to the northeastern United States due to the disproportionately large amount of shipping arriving from the area (Dassuncao 2008 unpublished) and the presence of invasive species, from regions outside Europe, currently established in European countries (Molnar et al. 2008). One European invader thought to be especially likely to arrive in the near future is the Australasian barnacle, Austrominius (=Elminius) modestus, (J. Pederson, MITSG, 2008), which has a long history in European waters (Crisp 1958, Harms and Anger 1989). Because A. modestus has been present in Europe for over 60 years, the question is why has it not appeared in the U.S? As fouling organisms, barnacles are among those species that are spread readily as invaders. Predicting the potential for further distribution of an invasive species is critical for developing mitigation and eradication strategies. Recent risk assessments have used temperature as the preliminary basis for determining the potential habitat for invaders. A more extensive study done by DeRivera et al (2007) similarly uses temperature to investigate the expansion of an introduced crab, Carcinus maenas, in North America; noting that a subsequent paper will evaluate the effects of salinity. However, both temperature and salinity are critical variables in determining the survivability of aquatic invertebrates (Barnes and Barnes 1974, Bhatnagar and Crisp 1965, Harms 1999, Tucker et al. 2000). In this paper, the potential of this barnacle species to spread along the eastern United States coast was investigated by comparing the salinity and temperature tolerances of the organism to yearly profiles in the region. Temperature and salinity tolerances for the adult populations of this species as well as its larval stages are discussed. Because adult populations tend to be more resilient than their offspring survivability of larvae is crucial to a successful establishment of marine invaders (Harms 1999). Various studies examined the adult and larvae of A. modestus, and therefore, this body of literature was used to identify the biological tolerances of the barnacle. The information on the physiological tolerances of A. modestus, were compared to temperature and salinity data from the National Oceanic and Atmospheric Administration (NOAA) in the northeastern U.S. Analyzing the two stressors together may provide a better prediction of potential spread. 2.0 Austrominius (=Elminius) modestus Native to Australian and New Zealand waters, A. modestus has become ubiquitous in Europe and is thought to have arrived not long before 1943 as a result of unique war-time conditions (Crisp 1958), namely returning naval vessels from having been stationed in the Pacific Ocean. Initial worry focused on its potential to affect native sessile species, most notably oysters (Boschma 1948, Knight-Jones 1948). Since then it has spread throughout Europe, often replacing native barnacles (Crisp 1958).
Intertidal barnacles are especially susceptible to changes in temperature and salinity because of their fixed location in shallow coastal waters that are easily warmed by the sun and diluted by precipitation (Bhatnagar and Crisp 1965). In order to regulate the salinity concentration in its blood, which Foster (1970) linked as being directly proportional to external salinity levels over time, the barnacle closes its opercular valves in response to the external change in concentration (Davenport 1976). Foster (1970) showed that barnacles will then acclimate to the change in salinity and resume activity. Austrominius modestus displays its greatest activity, measured as cirral and valve movement, when submerged in salinity concentrations close to that of the sea ~33.5‰ (Davenport 1976, Foster 1970), and stops all activity outside of the range 17‰ – 53‰ (Foster 1970). Temperature changes also affect the barnacle by inducing larval release whether the temperature increases or decreases, which coupled with A. modestus’ year-round breeding season, can happen often (Cawthorne and Davenport 1980). Following the first discovery of A. modestus in European (non-native) waters (Bishop 1947), data have been collected on the larval life history and physiological tolerances of the species. Knight-Jones and Waugh (1949) described in detail the six naupliar stages of the barnacle and compared its cyprid stage to its British counterparts. Furthermore, when compared to other barnacle species, the larvae have been found to be exceptionally tolerant to a wide range of salinities and temperatures (Bhatnagar and Crisp 1965) Barnes and Barnes (1974) report that embryos of A. modestus can fully develop and hatch into functioning nauplii at salinities of 21.4-42.8‰ at 20 °C. This compares to the salinity level, 21‰, at which Cawthorne and Davenport (1980) found a cessation of larval release. Once released however, the larvae can survive at salinities as low as 9‰ (Cawthorne and Davenport 1980). These estimated salinity tolerances were obtained at fixed temperatures. The most comprehensive salinity and temperature data available for A. modestus are a result of experiments performed by Bhatnagar and Crisp (1965), and Harms (1986). Each study tested multiple combinations of temperature and salinity to determine survivability of the barnacle larvae. In this study, survivability will be taken to mean greater than 50% of the specimen survive in a given experiment. Data from both these studies allow for deduction of this number, albeit from very different testing environments. Bhatnagar and Crisp (1965) estimate larval survivability to have a lower threshold of around 10 ppt for all plausible temperatures, while the ceiling threshold is significantly higher than what can be found in the field. All of the studies concluded that A. modestus can survive above sea water salinity concentrations. Harms (1986) examined numerous conditions for both the British population as well as the Australasian one. Because different results have been shown for the European and native populations, we will only consider experiments performed by the more likely invader from Europe. By compiling the data points from these two studies as well as the estimated tolerances of all the previous studies, the salinity versus temperature graph illustrating the likely realm of survivability for the barnacle was created using available information in both Europe and comparing it to the northeastern U.S.
3.0 Methods Results from published research on the temperature and salinity tolerances of A. modestus were compiled to produce a two-dimensional contour, outside of which, the particular species at hand is not expected to survive. Salinity and temperature profiles for particular locations along the northeastern coast of the United States were acquired. This allowed for easily overlaying the two datasets in order to see where and when the species would be able to survive. The source of the regional temperature and salinity profiles is the National Oceanic and Atmospheric Administration’s (NOAA) Global Temperature-Salinity Profile Program (GTSPP). Developed to maintain a global dataset of temperature and salinity profiles, GTSPP provides quality controlled data via Canada’s Integrated Science Data Management (ISDM) group (Canadian Department of Fisheries and Oceans Operational Oceanography Group). The Best Copy Data Sets accessible on GTSPP’s website were downloaded for all of the months in 2006-2008 in the Atlantic Ocean. A twelve month series was chosen from this range where only data sites that had both temperature and salinity measurements along the eastern coast of the United States, and had at least daily or every other day resolution were used in the analysis. Index files provided with the data, which present a summary of the entire dataset, were used to identify sites that met these requirements. The Index Files for each month were imported into MS Access and sorted by the number of parameters in each file. All files contained depth and temperature parameters; however, some did not contain salinity. If null values were present for salinity the corresponding sites were eliminated. The remaining sites were queried to determine which possessed a suitable resolution. The query was done by selecting sites that had data for at least fourteen of the days in each month, corresponding to a resolution of about one reading every other day for a year. Originally, the most recent complete year was chosen for analysis (2007), but a surprisingly low number of sites had data that matched the requirements. Therefore, additional data from January 2006 to December 2008 were downloaded, and a twelve month period was chosen from this range that possessed the greatest number of sites that matched the criteria. The latitudes and longitudes for these sites were imported into ArcGIS in order to easily eliminate those that did not lie along the eastern coast of the United States. Each individual measurement from any given site was contained in a separate NetCDF file resulting in hundreds of thousands of files for the date range at hand. Therefore, using the index files, a list was compiled of the file names corresponding to the selected sites, and a Bash script was written to separate these from the rest of the downloaded data. Once isolated, a Python script involving the PyCDF module was written to sift through each NetCDF file and pull out the depth, temperature, and salinity measurements. These parameters were then imported into the MS Access database. Some readings contained
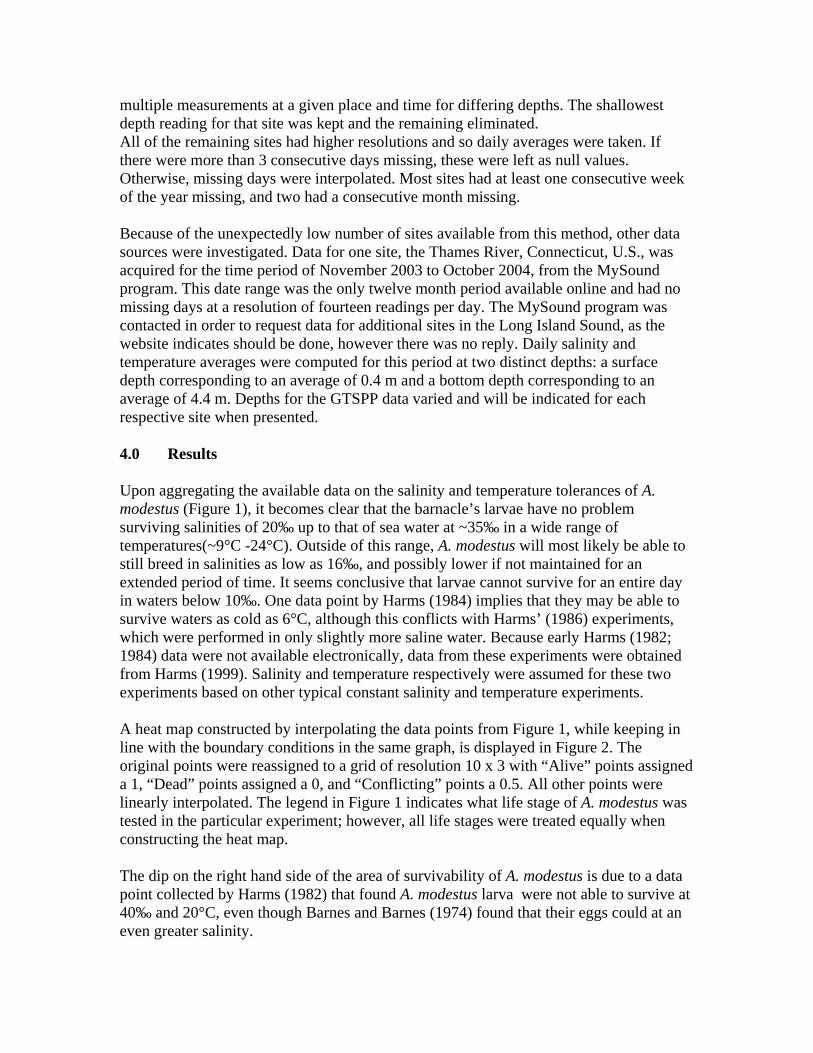
multiple measurements at a given place and time for differing depths. The shallowest depth reading for that site was kept and the remaining eliminated. All of the remaining sites had higher resolutions and so daily averages were taken. If there were more than 3 consecutive days missing, these were left as null values. Otherwise, missing days were interpolated. Most sites had at least one consecutive week of the year missing, and two had a consecutive month missing. Because of the unexpectedly low number of sites available from this method, other data sources were investigated. Data for one site, the Thames River, Connecticut, U.S., was acquired for the time period of November 2003 to October 2004, from the MySound program. This date range was the only twelve month period available online and had no missing days at a resolution of fourteen readings per day. The MySound program was contacted in order to request data for additional sites in the Long Island Sound, as the website indicates should be done, however there was no reply. Daily salinity and temperature averages were computed for this period at two distinct depths: a surface depth corresponding to an average of 0.4 m and a bottom depth corresponding to an average of 4.4 m. Depths for the GTSPP data varied and will be indicated for each respective site when presented. 4.0 Results Upon aggregating the available data on the salinity and temperature tolerances of A. modestus (Figure 1), it becomes clear that the barnacle’s larvae have no problem surviving salinities of 20‰ up to that of sea water at ~35‰ in a wide range of temperatures(~9°C -24°C). Outside of this range, A. modestus will most likely be able to still breed in salinities as low as 16‰, and possibly lower if not maintained for an extended period of time. It seems conclusive that larvae cannot survive for an entire day in waters below 10‰. One data point by Harms (1984) implies that they may be able to survive waters as cold as 6°C, although this conflicts with Harms’ (1986) experiments, which were performed in only slightly more saline water. Because early Harms (1982; 1984) data were not available electronically, data from these experiments were obtained from Harms (1999). Salinity and temperature respectively were assumed for these two experiments based on other typical constant salinity and temperature experiments. A heat map constructed by interpolating the data points from Figure 1, while keeping in line with the boundary conditions in the same graph, is displayed in Figure 2. The original points were reassigned to a grid of resolution 10 x 3 with “Alive” points assigned a 1, “Dead” points assigned a 0, and “Conflicting” points a 0.5. All other points were linearly interpolated. The legend in Figure 1 indicates what life stage of A. modestus was tested in the particular experiment; however, all life stages were treated equally when constructing the heat map. The dip on the right hand side of the area of survivability of A. modestus is due to a data point collected by Harms (1982) that found A. modestus larva were not able to survive at 40‰ and 20°C, even though Barnes and Barnes (1974) found that their eggs could at an even greater salinity.
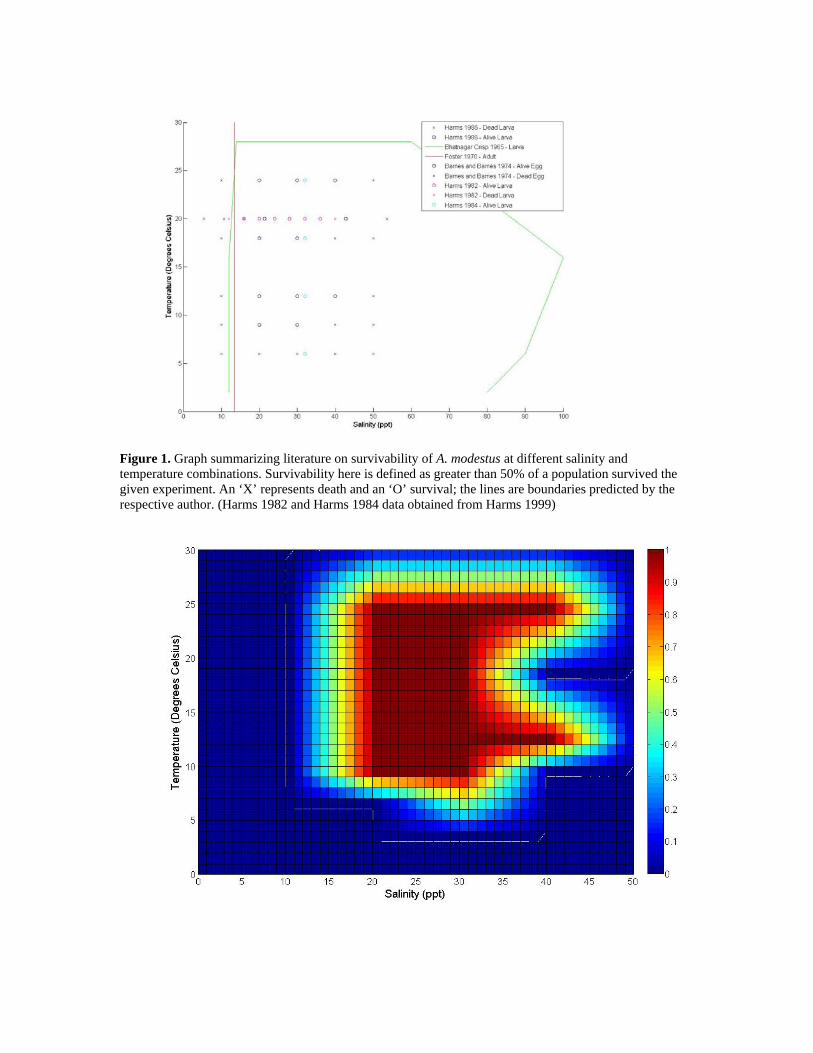
Figure 1. Graph summarizing literature on survivability of A. modestus at different salinity and temperature combinations. Survivability here is defined as greater than 50% of a population survived the given experiment. An ‘X’ represents death and an ‘O’ survival; the lines are boundaries predicted by the respective author. (Harms 1982 and Harms 1984 data obtained from Harms 1999)
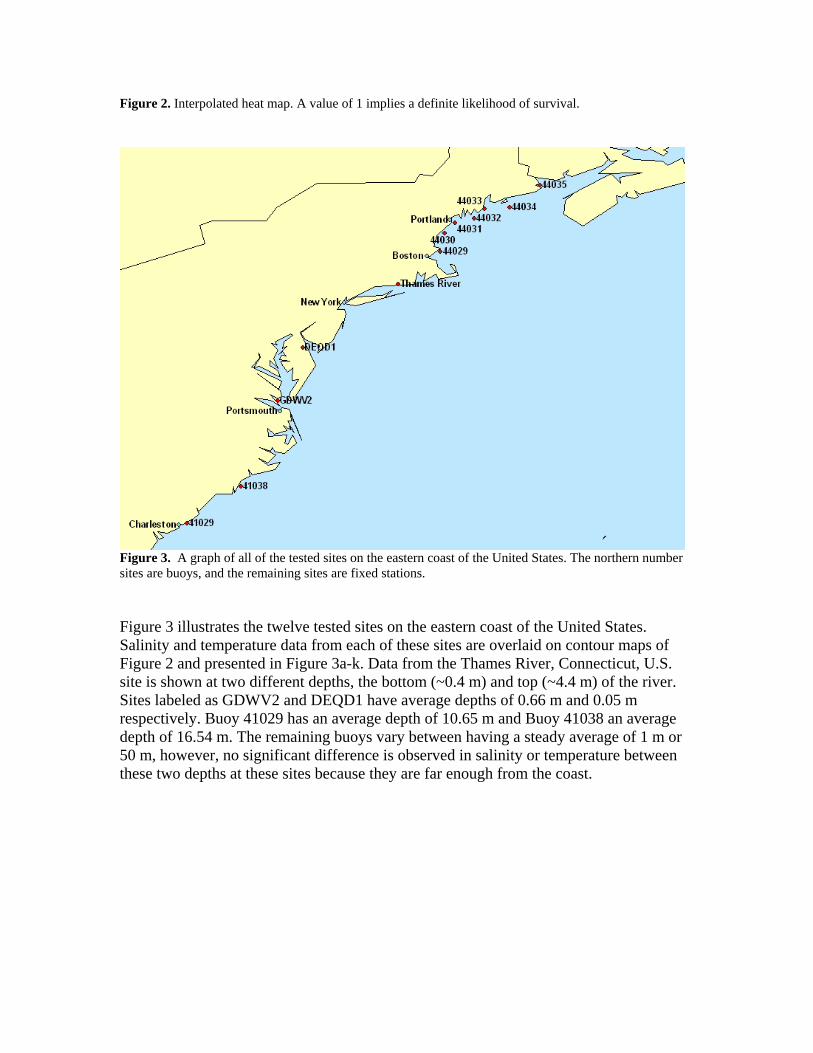
Figure 2. Interpolated heat map. A value of 1 implies a definite likelihood of survival.
Figure 3. A graph of all of the tested sites on the eastern coast of the United States. The northern number sites are buoys, and the remaining sites are fixed stations. Figure 3 illustrates the twelve tested sites on the eastern coast of the United States. Salinity and temperature data from each of these sites are overlaid on contour maps of Figure 2 and presented in Figure 3a-k. Data from the Thames River, Connecticut, U.S. site is shown at two different depths, the bottom (~0.4 m) and top (~4.4 m) of the river. Sites labeled as GDWV2 and DEQD1 have average depths of 0.66 m and 0.05 m respectively. Buoy 41029 has an average depth of 10.65 m and Buoy 41038 an average depth of 16.54 m. The remaining buoys vary between having a steady average of 1 m or 50 m, however, no significant difference is observed in salinity or temperature between these two depths at these sites because they are far enough from the coast.
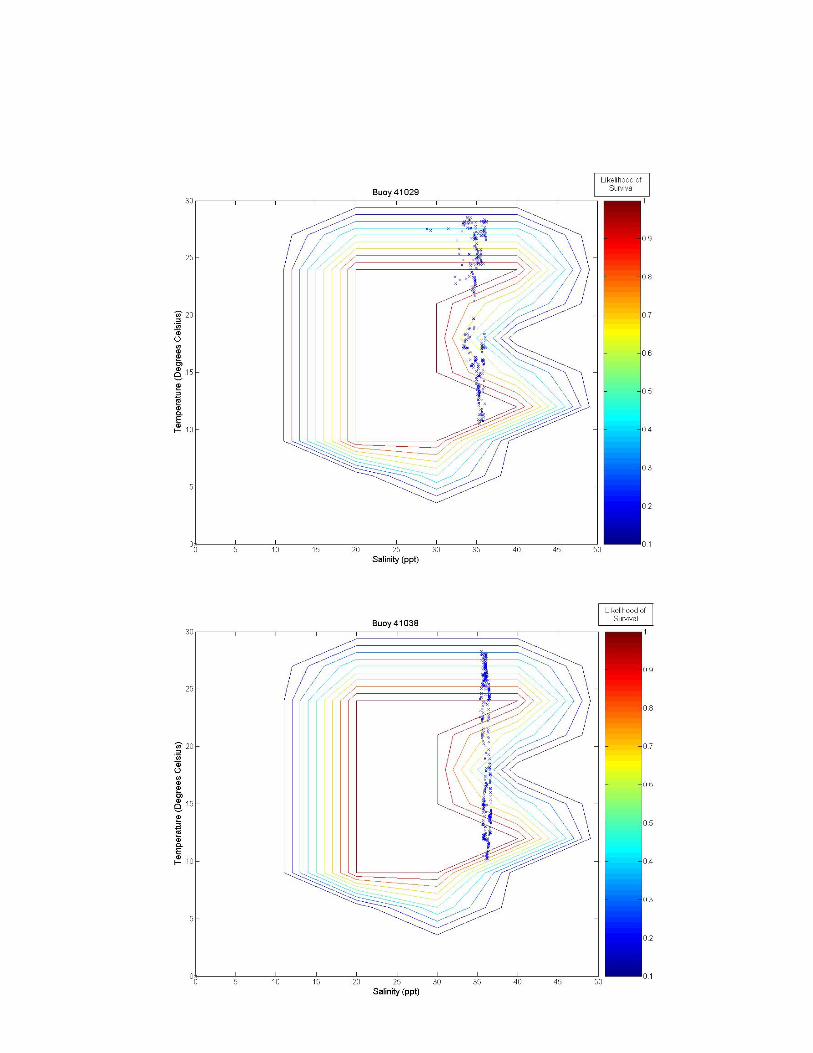
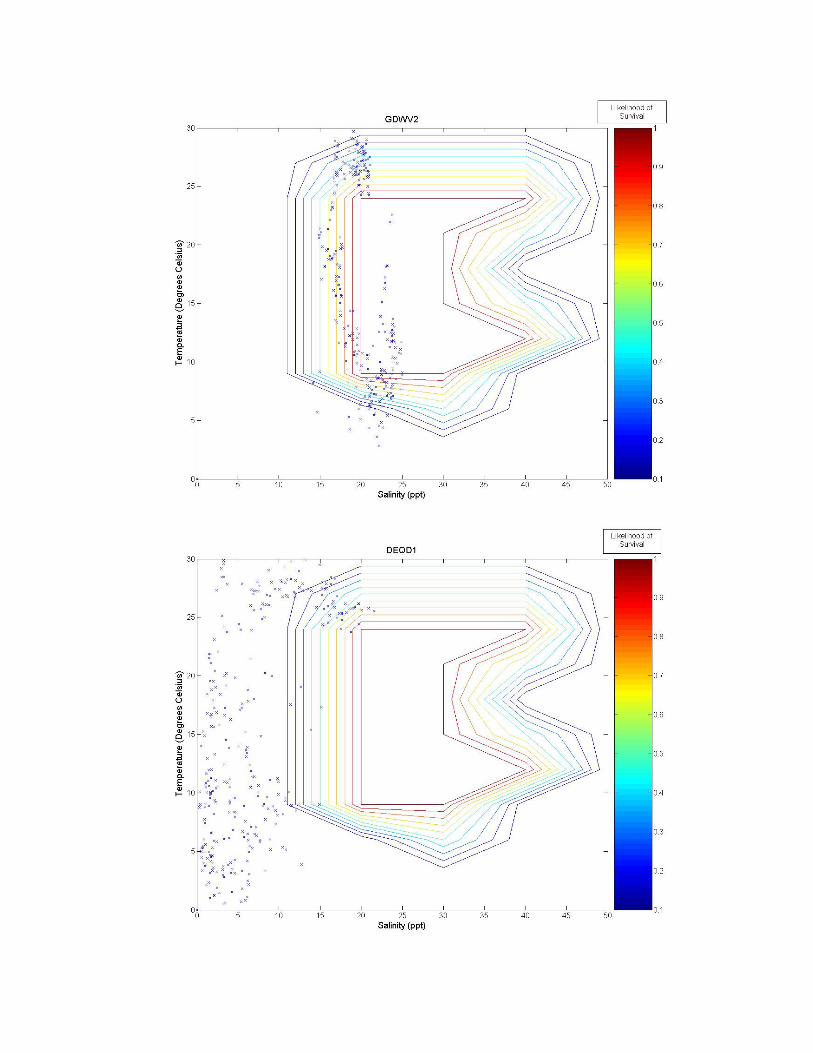
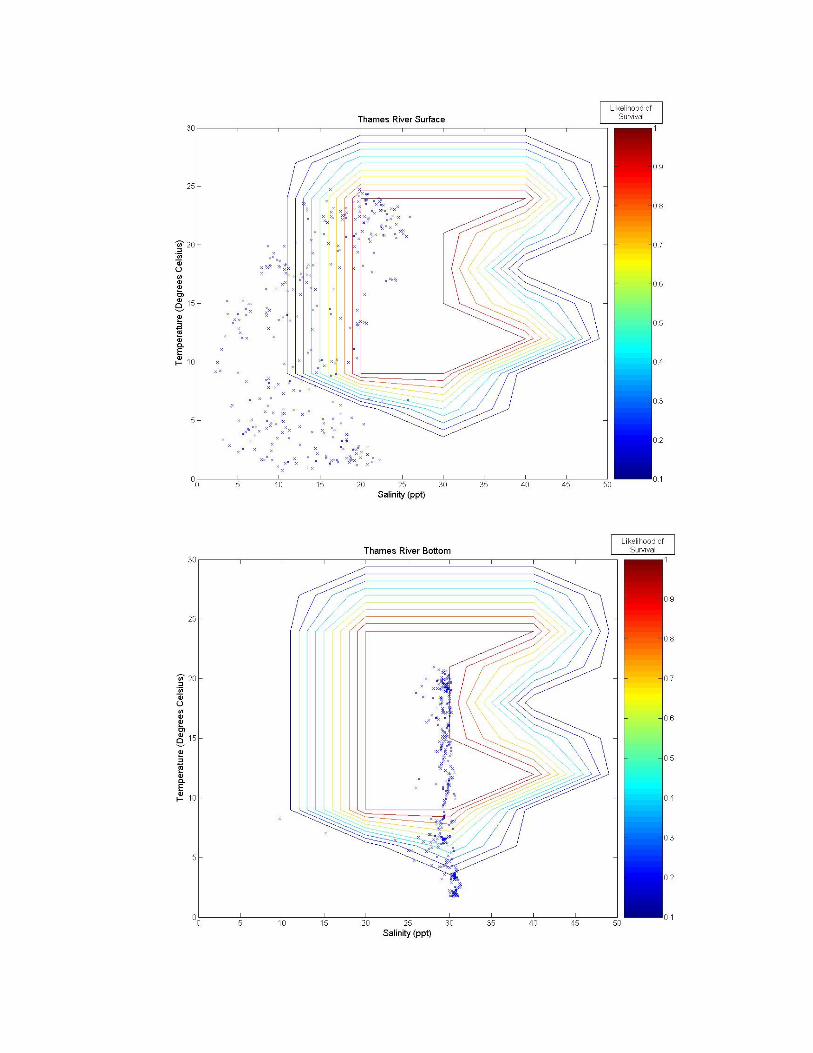
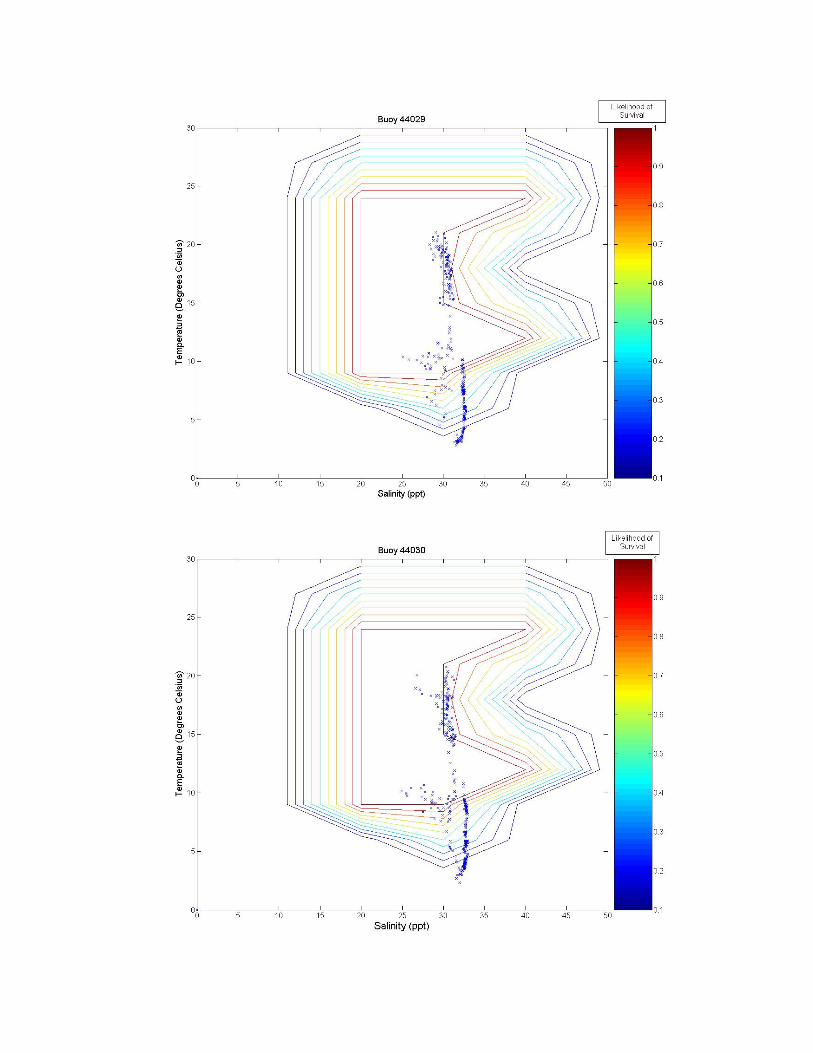

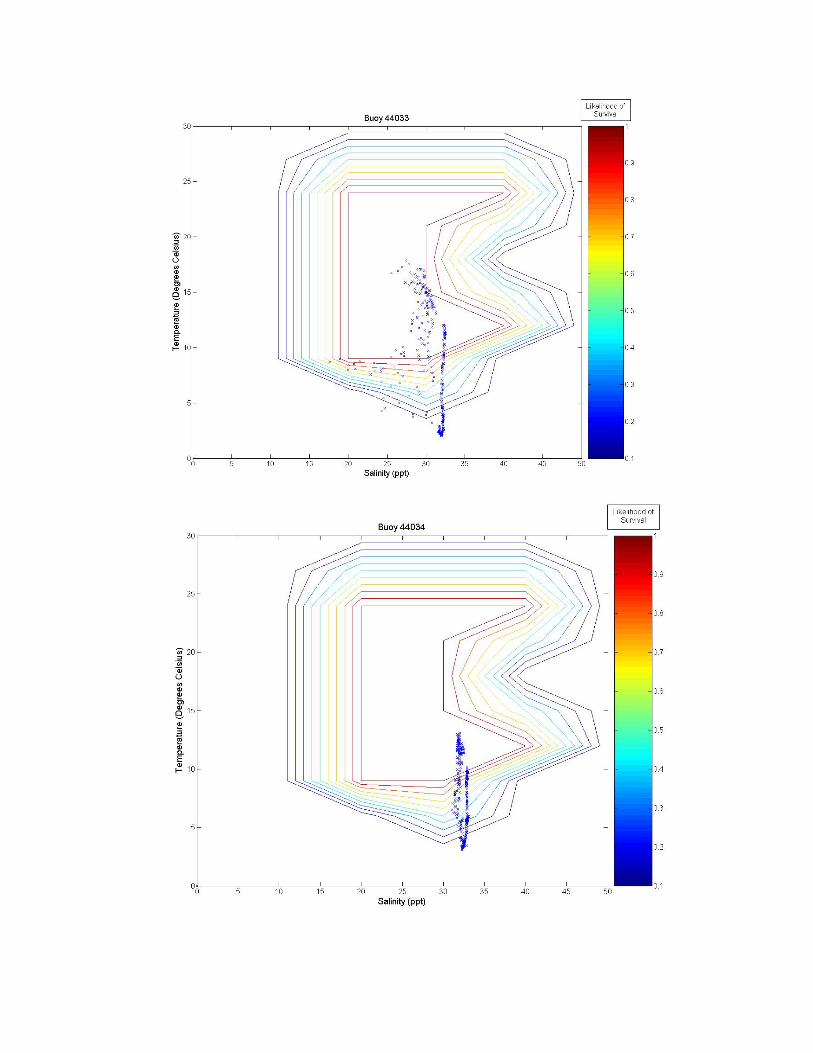
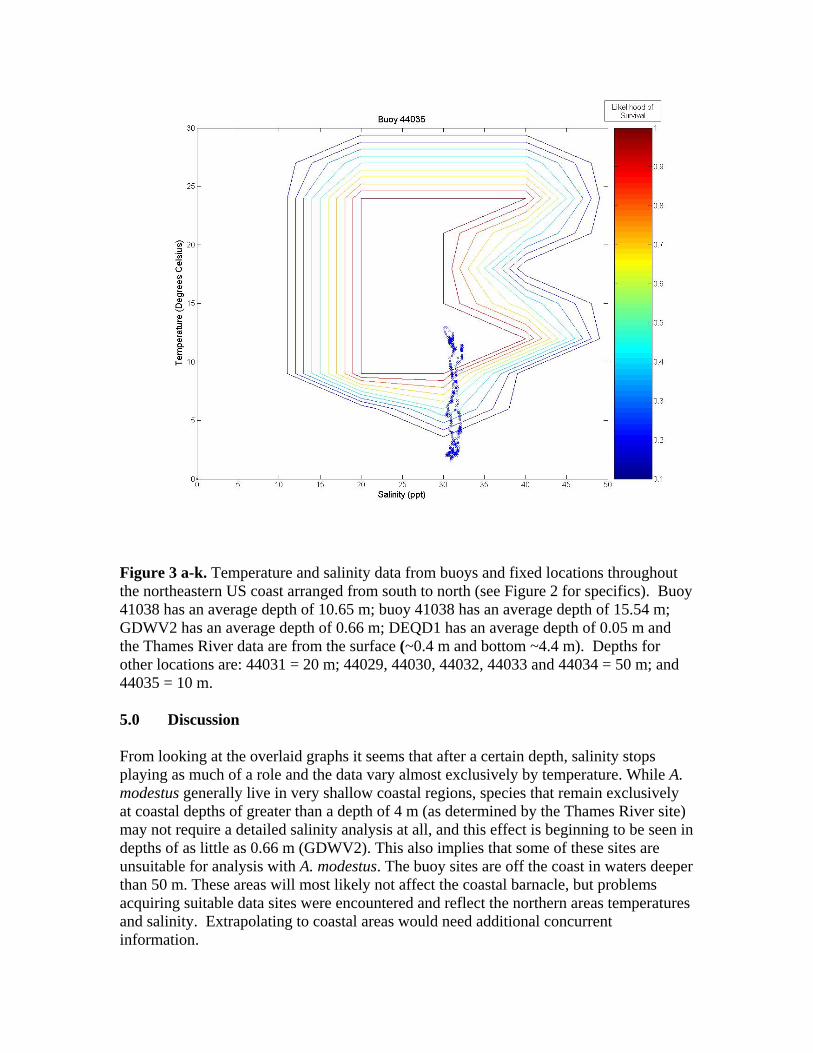
Figure 3 a-k. Temperature and salinity data from buoys and fixed locations throughout the northeastern US coast arranged from south to north (see Figure 2 for specifics). Buoy 41038 has an average depth of 10.65 m; buoy 41038 has an average depth of 15.54 m; GDWV2 has an average depth of 0.66 m; DEQD1 has an average depth of 0.05 m and the Thames River data are from the surface (~0.4 m and bottom ~4.4 m). Depths for other locations are: 44031 = 20 m; 44029, 44030, 44032, 44033 and 44034 = 50 m; and 44035 = 10 m. 5.0 Discussion From looking at the overlaid graphs it seems that after a certain depth, salinity stops playing as much of a role and the data vary almost exclusively by temperature. While A. modestus generally live in very shallow coastal regions, species that remain exclusively at coastal depths of greater than a depth of 4 m (as determined by the Thames River site) may not require a detailed salinity analysis at all, and this effect is beginning to be seen in depths of as little as 0.66 m (GDWV2). This also implies that some of these sites are unsuitable for analysis with A. modestus. The buoy sites are off the coast in waters deeper than 50 m. These areas will most likely not affect the coastal barnacle, but problems acquiring suitable data sites were encountered and reflect the northern areas temperatures and salinity. Extrapolating to coastal areas would need additional concurrent information.
The southern most buoys, 41029 and 41038, fall mostly within A. modestus’ habitable range. They push the upper boundary for both salinity and temperature tolerance of the species, however, temperatures higher than 24°C have not been tested and the literature claims the barnacle can most likely tolerate very high temperatures, so survivability seems likely at these locations. The barnacle is expected to come from a much colder European climate though, and so A. modestus is expected to invade areas to the north of these locations. The Chesapeake Bay site, GDWV2, also seems provide a suitable environment for this species having less saline waters than the southern two sites. The DEQD1 site was too fresh for the barnacle because of its presence in a river some distance from marine salinities. The Thames River site illustrates the difference that depth plays in such an analysis. The very top of the river is too fresh for the barnacle, while the bottom may support survival. The Thames River site in the Long Island Sound also marks the location above which the mid-winter days may play a role in limiting A. modestus’ arrival. In all of the figures we can see a few weeks of data where the temperature may be too cold for the barnacle to survive. If the cold weather days, e.g., below between 5 oC-10 oC are consecutive, the barnacle may not survive and establish populations. Further analysis is needed to evaluate survival at these lower temperatures. If the days are consecutive it would put a much greater strain on the barnacle then if they occurred sporadically throughout the winter. And if the European waters have a comparable amount of cold days lying below A. modestus’ survivability threshold, then these sites may very well still be viable for the barnacle. 6.0 Conclusion With the proper data, the analytic described in this paper is relatively simple. Overlaying the two datasets, temperature and salinity allows for visual identification of areas of likely concern. Further numerical analysis would be similarly possible. This type of analysis is rooted in similar principles as ecological niche models, which use multiple environmental variables to predict likelihood of distribution of a particular species. Two main differences however, are that a niche model requires significantly more data from a wide range of variables, and that it is often at a significantly lower temporal resolution (although models often attempt to make up for this by characterizing the most important points of data such as maximum and minimum values in addition to lower resolution averages). More biological data on specific invasive species should be collected in a way that allows for producing such multivariate living spaces as illustrated in the Figure 2 heat map. Temperature and salinity experiments performed at multiple organized combinations like that of Harms (1986) allow for producing a grid like field that communicates a much better understanding of the realm of survivability of the species. These data could be used in combination with environmental datasets to identify areas at high risk for invasion.
7.0 References Cited
Barbier E., Shogren J., (2004) “Growth with endogenous risk of biological invasion,” Economic Inquiry. 42(4):587-601
Barnes, H. and Barnes, M. “The responses during development of the Embryos of some common cirripedes to wide changes in salinity,” J. of Mar. Biol. Ecol. 15 (1974): 197-202
Bhatnagar, K. M. and D. J. Crisp. “The Salinity Tolerance of Nauplius Larvae of
Cirripedes,” The Journal of Animal Ecology 34 (2) (1965): 419-428. Bishop, Marcus W.H. “Establishment of an Immigrant Barnacle in British Coastal
Waters,” Nature 159 (1947): 501.
Boschma, Prof. H. “Elminius modestus in the Netherlands,” Nature 161 (1948): 403.
Bright, C., 1999. “Invasive species: pathogens of globalization,” Foreign Policy
116, pp. 50–64 Cawthorne D. F. and J. Davenport. “The effects of fluctuating temperature,
salinity, and aerial exposure upon larval release in Balanus balanoides and Elminius modestus,” Journal of the Marine biological Association of the UK 60 (1980): 367-377
Crisp, D.J. (1958). “The spread of Elminius modestus Darwin in North-West
Europe,” J. Mar. Biol. Ass. U.K. 37: 483-520 Davenport, John. “A comparative study of the behaviour of some balanomorph
barnacles exposed to fluctuating sea water concentrations,” J. Mar. Biol. Ass. UK 56 (1976): 889-907.
deRivera, Catherine et al. “Larval development rate predicts range expansion of
an introduced crab,” Mar. Biol. 150 (2007): 1275-1288 Foster, B. A. “Responses and Acclimation to Salinity in the Adults of Some
Balanomorph Barnacles,” Phil. Trans. Of the Royal society of London 256 (1970): 377-400.
Harms, J. “Effects of temperature and salinity on larval development of Elminius
modestus (Crustacea, Cirripedia) from Helgoland (North Sea) and New Zealand” Helgoland Marine Research 40 (4) (1986): 355-376.
Harms, J. “The neozoan Elminius modestus Darwin (Crustacea, Cirripedia): Possible explanations for its successful invasion in European water,” Helgoland Marine Research 52 (1999): 337-345.
Harms, J. and K. Anger (1989) “Settlement of the barnacle Elminius modestus
Darwin on test panels in Helgoland (North Sea): a ten year study,” In: Topics in marine biology. Ed. By J. D. Ros Sci. Mar. 53, 417-421.
Knight-Jones, E.W. and G. Duncan Waugh. “On the Larval Development of
Elminius modestus Darwin,” Journal of Marine Biological Association UK 28 (2) (1949): 413-428.
Mann, R and Harding, JM. (2000) “Invasion of the North American Atlantic coast by a large predatory Asian mollusk,” Biological Invasions [Biol. Invasions]. Vol. 2, no. 1, pp. 7-22.
Molnar, Jennifer L., Rebecca L Gamboa, Carmen Revenga, and Mark D Spalding “Assessing the global threat of invasive species to marine biodiversity,” Frontier in Ecology and the Environment 6 (9) (2008): 485-492.
Operational Oceanography Group: Global Temperature–Salinity Profile Program. June 2006. U.S. Department of Commerce, National Oceanic and Atmospheric Administration, National Oceanographic Data Center, Silver Spring, Maryland, 20910. <http://www.nodc.noaa.gov/GTSPP/>.
Perrings, C., Dehnen-Schmutz, K., Touza, L. & Williamson, M. (2005) “How to manage biological invasions under globalization,” Trends in Ecology & Evolution, 20, 212–215. Tucker, C. S., Sommerville C, and Wootten R. “The effect of temperature and salinity on the settlement and survival of copepodids of Lepeophtheirus salmonis (Kroyer, 1837) on Atlantic salmon, Salmno salar L.” Journal of Fish Diseases 23 (2000): 309-320