temperature dependency and temperature compensation in a
TRANSCRIPT

Biophysical Chemistry 106(2003) 179–192
0301-4622/03/$ - see front matter� 2003 Elsevier B.V. All rights reserved.doi:10.1016/S0301-4622(03)00191-1
Temperature dependency and temperature compensation in amodel of yeast glycolytic oscillations
Peter Ruoff *, Melinda K. Christensen , Jana Wolf , Reinhart Heinricha, a b b
School of Science and Technology, Stavanger University College, P.O. Box 8002, Ullandhaug, N-4068 Stavanger, Norwaya
Institute of Biology, Humboldt-University Berlin, Invalidenstrasse 42, D-10115 Berlin, Germanyb
Received 17 February 2003; received in revised form 30 June 2003; accepted 1 July 2003
Abstract
Temperature sensitivities and conditions for temperature compensation have been investigated in a model for yeastglycolytic oscillations. The model can quantitatively simulate the experimental observation that the period length ofglycolytic oscillations decreases with increasing temperature. Temperature compensation is studied by using controlcoefficients describing the effect of rate constants on oscillatory frequencies. Temperature compensation of theoscillatory period is observed when the positive contributions to the sum of products between control coefficientsand activation energies balance the corresponding sum of the negative contributions. The calculations suggest that bychanging the activation energies for one or several of the processes, i.e. by mutations, it could be possible to obtaintemperature compensation in the yeast glycolytic oscillator.� 2003 Elsevier B.V. All rights reserved.
Keywords: Temperature compensation; Glycolysis; Biochemical oscillations;Saccharomyces cereviciae; Mathematical modelling;Metabolic control theory; Cellular systems
1. Introduction
Many biological oscillators have important reg-ulatory functions of physiological processes and inthe adaptation of organisms to their environments.Circadian rhythms, for example, have clock ortiming functions w1–4x. Because of this, periodsin these biological clocks are compensated againstenvironmental influences such as temperature, pHand nutritional conditions. Among the environmen-tal compensation mechanisms, temperature com-
*Corresponding author. Tel.:q47-51-831887; fax:q47-51-831750.
E-mail address: [email protected](P. Ruoff).
pensation in circadian clocks is one of the bestdocumentedw1,2,5,6x. Temperature compensationmeans that within a physiological temperaturerange the rhythm’s period length remains nearlyconstant at different(but constant) temperatures,despite the fact that most of the underlying indi-vidual (enzyme-catalyzed) processes are quitedependent on temperature. In general, theQ of10
enzyme-catalyzed processes lies in the range of 2w7x, which means that the reaction rate doubles asthe temperature increases by 108C.
Although the existence of temperature compen-sation of biological clocks is well documented,little is known about how these compensation

180 P. Ruoff et al. / Biophysical Chemistry 106 (2003) 179–192
mechanisms operate. Hastings and Sweeneyw8xwere the first to suggest the existence of opposingreactions controlling the period of biological clockssimilar to the opposing processes occurring in atemperature-compensated mechanical pendulum orin modern temperature-compensated electronicclocks w9x. A theory of opposing reactionsw10,11xcan be formulated on the basis of positive andnegative elements that are apparently present inany reaction kinetic oscillator. A brief descriptionof this theory will be given below. Other proposalsconcerning the origin of temperature compensationhave focused on the importance of diffusion-controlled processes or opposing processes withinenzyme catalysis(for a review see Ref.w9x).
While temperature compensation is advanta-geous for the action of biological clocks, there areonly few examples of temperature-compensatedprocesses within pure chemical or biochemicaloscillators. Skrabalw12x was probably the first toreport a temperature-overcompensated process, i.e.a process where the overall reaction rate decreasesas temperature increases. Besides the early workby Skrabal we are aware of only two other reportsw13,14x which experimentally described and mod-elled temperature compensation of a chemicaloscillator.
Biochemical oscillations, such as the oscillatoryglycolysisw15–19x are important experimental sys-tems for understanding the dynamics and regula-tion of biological rhythms. However, chemical aswell as biochemical oscillators are generally nottemperature-compensated. Because temperaturecompensation is an important aspect in manybiological clock rhythms, we wondered whether itwould be possible, at least in theory, to constructa temperature-compensated biochemical oscillator.As a target system we chose the glycolytic oscil-lator in yeast cells, because the oscillations areeasily generated, and intensively studied. More-over, a wide spectrum of yeast mutants is available.In this work we investigated how temperaturecompensation can occur in a model of glycolyticoscillations in yeast cells developed by some of usw20x. Our results show that a ‘balance’ in activationenergies of opposing processes appears necessaryto observe temperature compensation. Similarobservations have also been made in a theoretical
temperature-sensitivity study of theDrosophilacircadian oscillator w21,22x and the oscillatoryperoxidase–oxidase reactionw23x.
Our theoretical analysis is based on data on thetemperature dependency of glycolytic oscillationsin suspensions of yeast cells by Betz and Chancew24x and by unpublished work of Hemker, Bakker,Teusink, Richard, Westerhoff and van Dam. Thesedata demonstrate that the frequency of the oscil-lations increase with temperature between 5 and40 8C. A corresponding increase in frequency withincreasing temperature has also been observed inyeast cell extracts by Z. Yuan, K. Tsuji and S.C.Muller (unpublished).¨
2. Condition for temperature compensation inreaction kinetic oscillators
Temperature compensation means that the oscil-lator’s period is nearly constant at different tem-peratures as long as the temperature is heldconstant during the oscillations. Experimentally,temperature compensation is normally observedonly in a certain—for the organism physiologicallyimportant—temperature interval, while outside ofthis interval the period may rapidly change oroscillations may no longer be observable. Also ina recently discovered chemical temperature-com-pensated oscillatorw13,14x temperature compen-sation occurs only in a limited temperature interval.
The type of mathematical model we considerhere consists of a set of coupled differential equa-tions describing how the metabolite concentrationsS change in timei
dSis n v (1)ij j8dt i
In these equations, the parametersn denote stoi-ij
chiometric coefficients of the reaction system andv are the reaction rates of the individual processesj
w25,26x. The reaction rates are functions of therate constants and the metabolite concentrations.A reasonable assumption to make is that thetemperature dependence of the rate constantsk isj
described by the Arrhenius-equation
E yRTjksA e (2)j j

181P. Ruoff et al. / Biophysical Chemistry 106 (2003) 179–192
where A is a pre-exponential factor,E is thej j
activation energy of processj, T is the temperaturein Kelvin and R is the gas constant. TheA ’s andj
E ’s may be considered as temperature-independentj
constants. In the case where rapid-equilibriumconstantsK are included in the rate equations, thel
temperature-dependence ofK can be described inl
an analogous way as by Eq.(2), i.e. by substitutingthe activation energy with the enthalpyDH . In0
l
this case the pre-exponential factor can still betreated as temperature-independent and becomesA sexp(yDS yR) w27x.0
l l
The temperature dependence of the oscillator’speriod P will be a function f of the rate andequilibrium constants, i.e.
Psf k (T), K (T) (3)Ž .j l
To find the condition for temperature compensa-tion in a temperature interval around a certainreference temperatureTsT , we start from dPyref
dT at this point
dP ≠f dk ≠f dKj ls q (4)8 8dT ≠k dT ≠K dTj lj l
Using Eq.(2) for calculating the derivatives dk yjdT and inserting the resulting expression(andanalogous expression for dK ydT) into Eq. (4)l
yields
dln P ≠ln f ≠ln f2 0RT s Eq DH (5)j l8 8dT ≠ln k ≠ln Kj lj l
The terms≠ln f y≠ln k and ≠ln f y≠ln K can bej l
considered as sensitivity coefficients which in thecontext of metabolic regulation are called ‘controlcoefficients’C andC , respectivelyw25,28,29x.j l
Temperature compensation of the oscillationsrequires dlnPydTs0. In general, theC ’s dependj
on the kinetic constantsk , such that the conditionj
for temperature compensation from Eq.(5)becomes only approximately valid within a certaintemperature range. For such a local temperaturerange the condition for temperature compensationcan be formulated as
C E(0 (6)i i8i
where index ‘i’ runs over all rate constants and(rapid) equilibrium constants(if present in thesystem). In reaction kinetic oscillators there areoften distinct positive and negative contributionsto the period, which are reflected by positive ornegativeC valuesw10x. These positive and nega-i
tive contributions appear to be necessary(but notsufficient) elements for physico-chemical oscilla-tions to occur. The simultaneous occurrence ofpositive and negative feedbacks, which appear tobe present in all physico-chemical oscillators hasbeen described by Franckw30x as ‘antagonisticfeedback’.
An alternative way to formulate the conditionof temperature compensation, Eq.(6), is to sepa-rate both negative and positive contributions. Thisleads to an ‘antagonistic balance equation’ withthe ‘opposing’ positive(a) and negative(b)contributions on each side of the equation
C E (y C E (7)a a b b8 8a b
Eq. (7) can be considered as a generalization ofthe proposal by Hastings and Sweeneyw8x whereopposing reactions are already contained withinany oscillator modelw10x and need not necessarilylie outside of the oscillator’s reaction network.
3. The model
The mechanism of the oscillatory glycolysis wasfound to be strongly dependent on the kineticproperties of the key enzyme phosphofructokinase(PFK) w31x. PFK is activated by its substrate,fructose 6-phosphate, by its product, ADP and, insome cases, by its second product, fructose 1,6-bisphosphate. ATP acts at higher concentrations asan inhibitor, whereas AMP activates PFK.Although models which describe glycolytic oscil-lations vary in complexityw32–37x, they are most-ly based on one or several of the regulatoryproperties of PFK. The model we consider here isbased on the cooperative inhibition of PFK byATP and was previously used to study the effect
182 P. Ruoff et al. / Biophysical Chemistry 106 (2003) 179–192
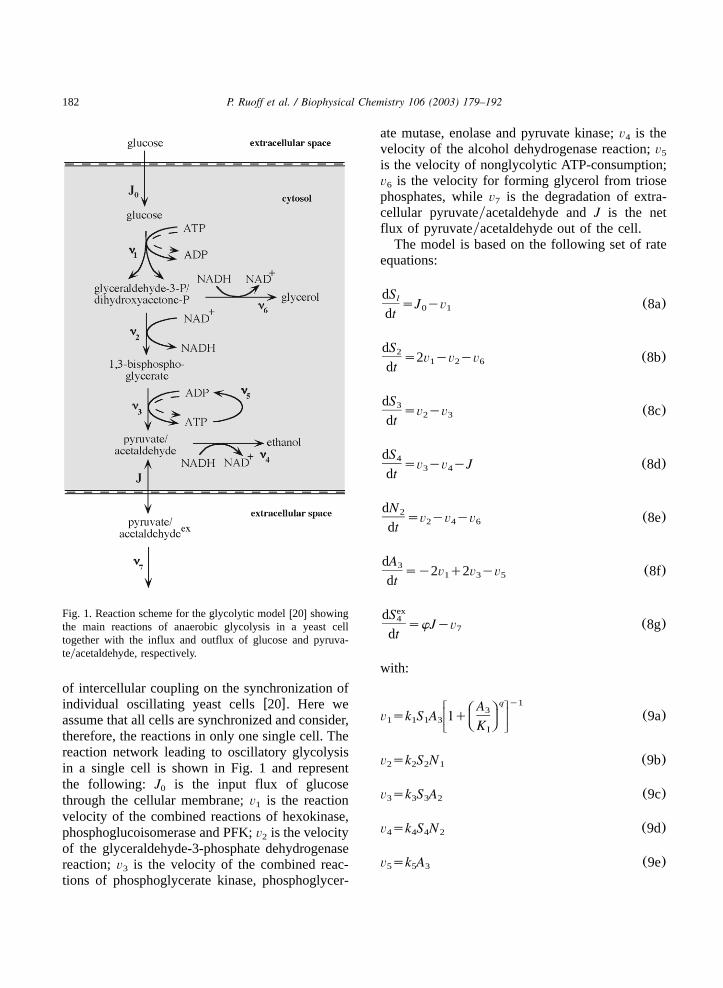
Fig. 1. Reaction scheme for the glycolytic modelw20x showingthe main reactions of anaerobic glycolysis in a yeast celltogether with the influx and outflux of glucose and pyruva-teyacetaldehyde, respectively.
of intercellular coupling on the synchronization ofindividual oscillating yeast cellsw20x. Here weassume that all cells are synchronized and consider,therefore, the reactions in only one single cell. Thereaction network leading to oscillatory glycolysisin a single cell is shown in Fig. 1 and representthe following: J is the input flux of glucose0
through the cellular membrane;v is the reaction1
velocity of the combined reactions of hexokinase,phosphoglucoisomerase and PFK;v is the velocity2
of the glyceraldehyde-3-phosphate dehydrogenasereaction;v is the velocity of the combined reac-3
tions of phosphoglycerate kinase, phosphoglycer-
ate mutase, enolase and pyruvate kinase;v is the4
velocity of the alcohol dehydrogenase reaction;v5
is the velocity of nonglycolytic ATP-consumption;v is the velocity for forming glycerol from triose6
phosphates, whilev is the degradation of extra-7
cellular pyruvateyacetaldehyde andJ is the netflux of pyruvateyacetaldehyde out of the cell.
The model is based on the following set of rateequations:
dSlsJ yv (8a)0 1dt
dS2s2v yv yv (8b)1 2 6dt
dS3sv yv (8c)2 3dt
dS4sv yv yJ (8d)3 4dt
dN2sv yv yv (8e)2 4 6dt
dA3sy2v q2v yv (8f)1 3 5dt
exdS4 swJyv (8g)7dt
with:
q y1w zB EA3C Fv sk S A 1q (9a)x |1 1 1 3D GKy ~I
v sk S N (9b)2 2 2 1
v sk S A (9c)3 3 3 2
v sk S N (9d)4 4 4 2
v sk A (9e)5 5 3
183P. Ruoff et al. / Biophysical Chemistry 106 (2003) 179–192
v sk S N (9f)6 6 2 2
exv skS (9g)7 4
A andA , andN andN denote the concentra-2 3 1 2
tions of ADP and ATP, and NAD and NADH,q
respectively. Since several glycolytic reactions areomitted and other reactions are lumped, the modelvariables denote, in some cases, the concentrationsof pools of intermediates, rather than concentra-tions of individual compounds. This concerns thepool of the triose phosphates, glyceraldehyde 3-phosphate and dihydroxyacetone phosphate(vari-ableS ), and the pool of pyruvate and acetaldehyde2
(variable S ). The concentration of glucose is4
represented by the variableS , and that of 1,3-1
bisphosphoglycerate byS . S denotes the concen-ex3 4
tration of the coupling substance in the externalsolution. Furthermore, the lumping process impliesthat the concentrations of some compounds do notappear as separate model variables. The differentialequations forN andA are omitted, because these1 2
concentrations follow from the conservationconditions
N qN sNsconstant (10a)1 2
A qA sAsconstant (10b)2 3
w denotes the ratio of the total cellular volume tothe extracellular volume.K and q are the inhibi-I
tion constants and the cooperativity coefficient ofthe ATP inhibition, respectively. For the transmem-brane fluxes, we use
J sk G (11a)0 0 ex
and
exJsk S yS (11b)Ž .4 4
In these equations,G denotes the concentrationex
of external glucose which is considered to beconstant,k a rate constant which is directly relatedto the permeability of the membrane. For a moredetailed description of this model the reader isreferred to the work by Wolf and Heinrichw20x.
4. Methods
The model’s differential equations (Eqs. (8–9))were solved numerically by use of theFORTRAN
subroutineLSODE w38x. The calculations were per-formed on a Macintosh computer using Absoft’sFORTRAN 77 compiler for the Macintosh, version4.4 w39x. Calculations involving stochastic fitting(see below) were run on a Unix workstation atStavanger University College.
In the stochastic fitting method the activationenergiesE of the rate constantsk (Eq. (2)) andj j
the enthalpyDH of K were varied randomly0K II
until a certain target functionP (T) wastar
approached closely enough by the numericallycalculated periodP(T). This was achieved bycalculating the root-mean-square deviationx
2w zx |xs P T yP T (12)Ž . Ž .tar i iy ~8y
i
for a variety of temperature pointsT for ani
iterative but random choice of activation energies(which are chosen within a certain activationenergy interval). During the iteration only thoseactivation energies were kept that led to a decreasein x. The FORTRAN function RAN1 w40x was usedas the random number generator. For a givenreference temperatureT (see below) and activa-ref
tion energy E , the pre-exponential factorA ofj j
process ‘j’ is calculated by means of theTref
assigned rate constant valuek by use of thej
Arrhenius equation, Eq.(2), i.e.
A sk exp E yRT (13)Ž .j j j ref
5. Results
5.1. Control coefficients
To investigate the conditions for temperaturecompensation by using Eq.(7), we determined thecontrol coefficients C s≠ln f y≠ln k and C sj j KI
≠ln f y≠ln K . First, a reference temperatureT andI ref
a reference state of limit cycle oscillations waschosen with parameters listed in Table 1(andfigure legends) and using for integration initial
184 P. Ruoff et al. / Biophysical Chemistry 106 (2003) 179–192
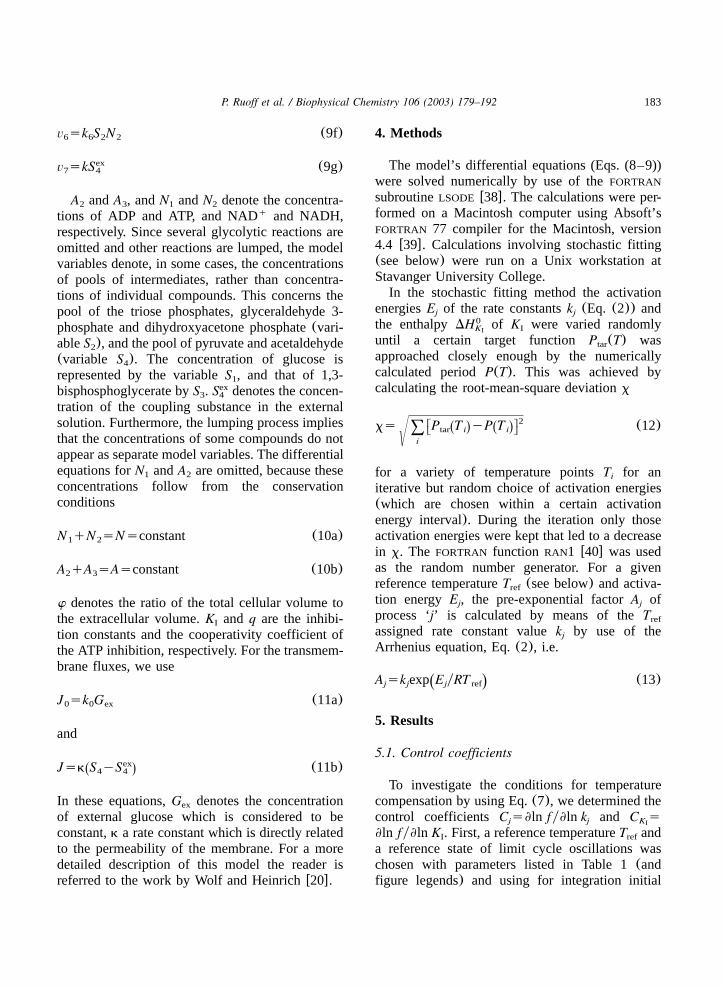
Table 1Parameter values of the reference statea
Parameter Value
J0 2.5 mMymink1 100.0 mMymink2 6.0 mMymink3 16.0 mMymink4 100.0 mMymink5 1.28ymink6 12.0 mMymink 1.8ymink 13.0yminq 4.0KI 0.52 mMN 1.0 mMA 4.0 mMw 0.1
Resulting in a period length of 1.17 min. A description ofa
the parameters can be found in Section 3.
Table 2Initial concentrations for reference state oscillations
Compound Concentration(mM)
Glucose 1.187Glyceraldehyde-3-Pydihydroxyacetone-P 0.1931,3-Bisphosphoglycerate 0.050Pyruvateyacetaldehyde 0.115External pyruvateyacetaldehyde 0.077ADP 1.525ATP 2.475NADq 0.923NADH 0.077
concentrations given in Table 2. Then, the periodsfor varying individually thek ’s (including K ) arei I
calculated by keeping all otherk ’s (i/j) constant.j
Fig. 2 shows the relationships lnP vs. lnk fori
those rate constants for which the control coeffi-cientsC varied most with varyingk . The controli i
coefficients for the reference state are listed inTable 3(calculations have been performed for 1%variations and for 10% variations of the rateconstant and of the inhibition constantK . FromI
the ten adjustable parameters only three contributepositively to the period, i.e. when increasingk ani
increase of the period is observed; see Table 3.Among the positive contributions the input fluxJ has the largest influence. From the parameters0
with a negative contribution to the period, the rate
constantk of nonglycolytic ATP consuming pro-5
cesses exerts the strongest effect.
5.2. Temperature dependency of the oscillationsand conditions for temperature compensation
The condition of Eq.(6) or Eq. (7) impliesthat, theoretically, there should be an infinite num-ber of activation energy combinations leading totemperature compensation. We have tested theapplicability of condition given by Eq.(7) usingthe stochastic fitting method described above tomodel the experimental period–temperature rela-tionship and temperature-compensated conditions.
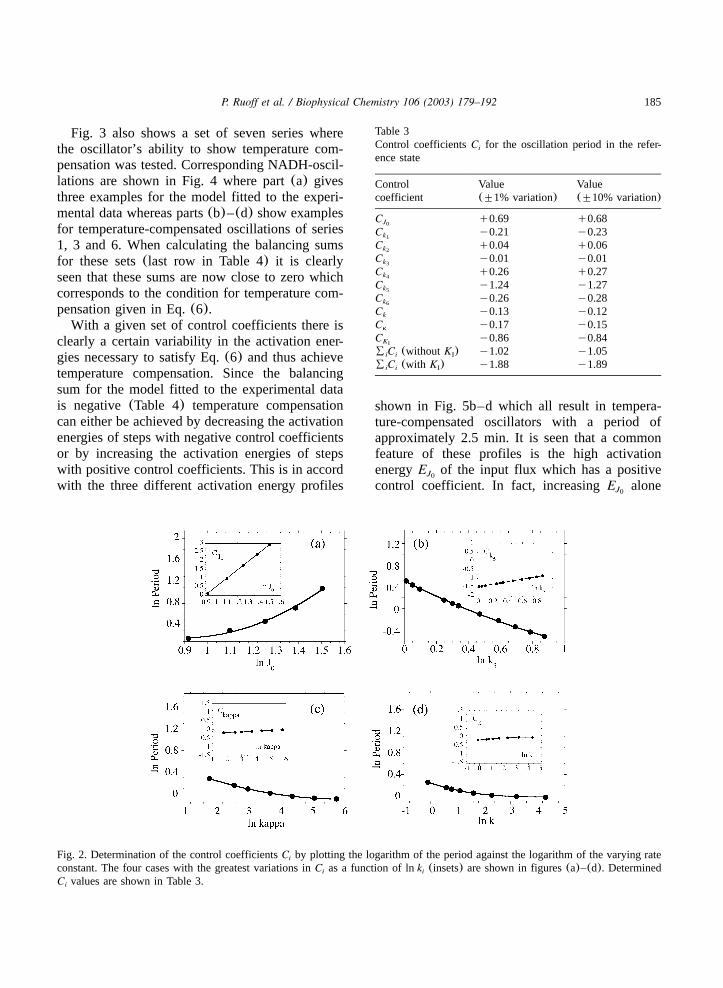
First, we determined by a stochastic fit, a set ofactivation energies which gives a good descriptionof the temperature dependency of the oscillationperiod to the experimental data of Betz and Chance(w24x; shown as open diamonds in Fig. 3) andHemker et al.(unpublished; shown as open squaresand a thick solid line in Fig. 3). The correspondingactivation energies are given in Fig. 5a and in thefirst column of Table 4. Large solid points in Fig.3 show the result of a stochastic fit of the modelto the data by Hemker et al. While experimentalperiod lengths have been observed as low as 0.2min, the model stops showing oscillations atapproximately 0.8 min. Within the oscillatoryrange of the model, however, there is a goodagreement between experiment and calculations.The considerable dominance of negative contri-butions in the balancing sum, Eq.(6), is reflectedby the fact that the period decreases rapidly withincreasing temperature(see8 C E in last row ofi k ii
Table 4).
185P. Ruoff et al. / Biophysical Chemistry 106 (2003) 179–192
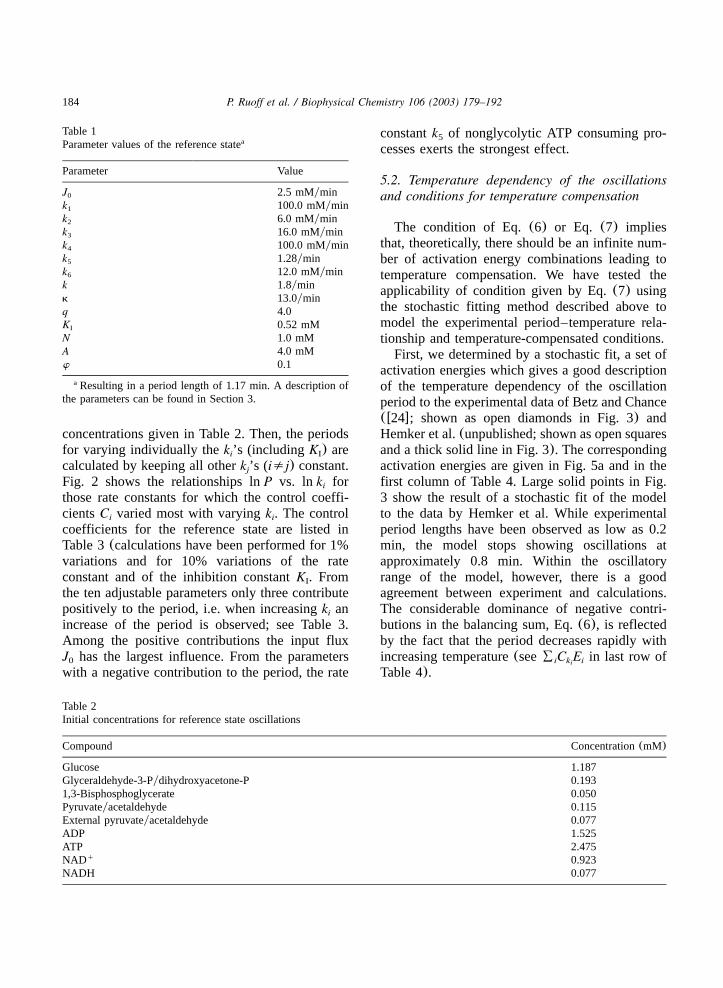
Table 3Control coefficientsC for the oscillation period in the refer-i
ence state
Control Value Valuecoefficient ("1% variation) ("10% variation)
CJ0q0.69 q0.68
Ck1y0.21 y0.23
Ck2q0.04 q0.06
Ck3y0.01 y0.01
Ck4q0.26 q0.27
Ck5y1.24 y1.27
Ck6y0.26 y0.28
Ck y0.13 y0.12Ck y0.17 y0.15CKI
y0.86 y0.848 C (without K )i i I y1.02 y1.058 C (with K )i i I y1.88 y1.89
Fig. 2. Determination of the control coefficientsC by plotting the logarithm of the period against the logarithm of the varying ratei
constant. The four cases with the greatest variations inC as a function of lnk (insets) are shown in figures(a)–(d). Determinedi i
C values are shown in Table 3.i
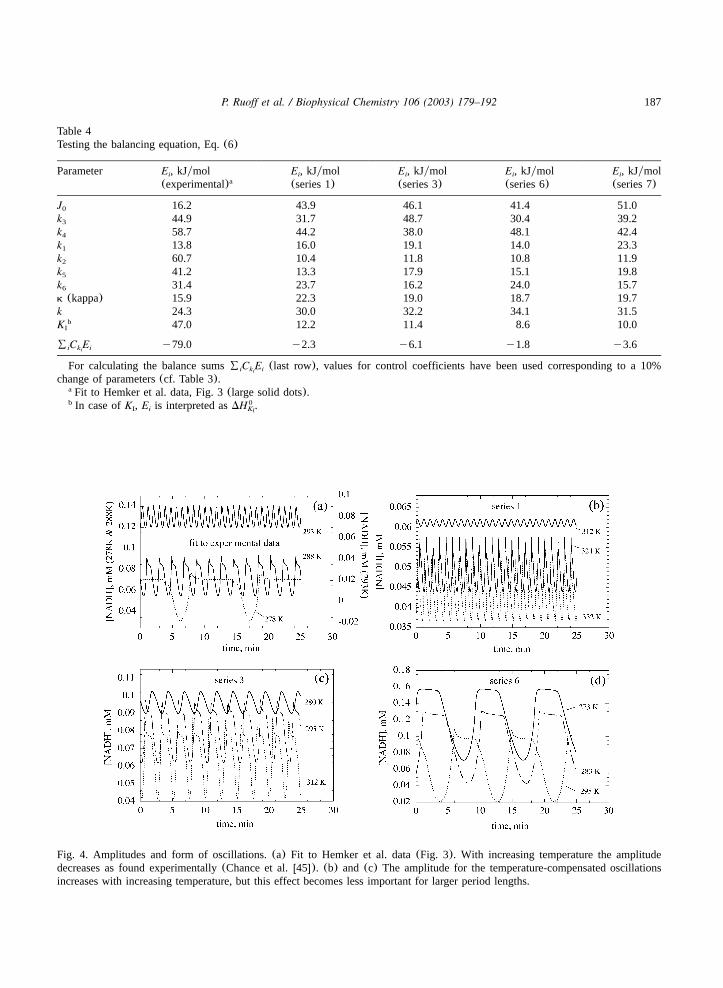
Fig. 3 also shows a set of seven series wherethe oscillator’s ability to show temperature com-pensation was tested. Corresponding NADH-oscil-lations are shown in Fig. 4 where part(a) givesthree examples for the model fitted to the experi-mental data whereas parts(b)–(d) show examplesfor temperature-compensated oscillations of series1, 3 and 6. When calculating the balancing sumsfor these sets(last row in Table 4) it is clearlyseen that these sums are now close to zero whichcorresponds to the condition for temperature com-pensation given in Eq.(6).
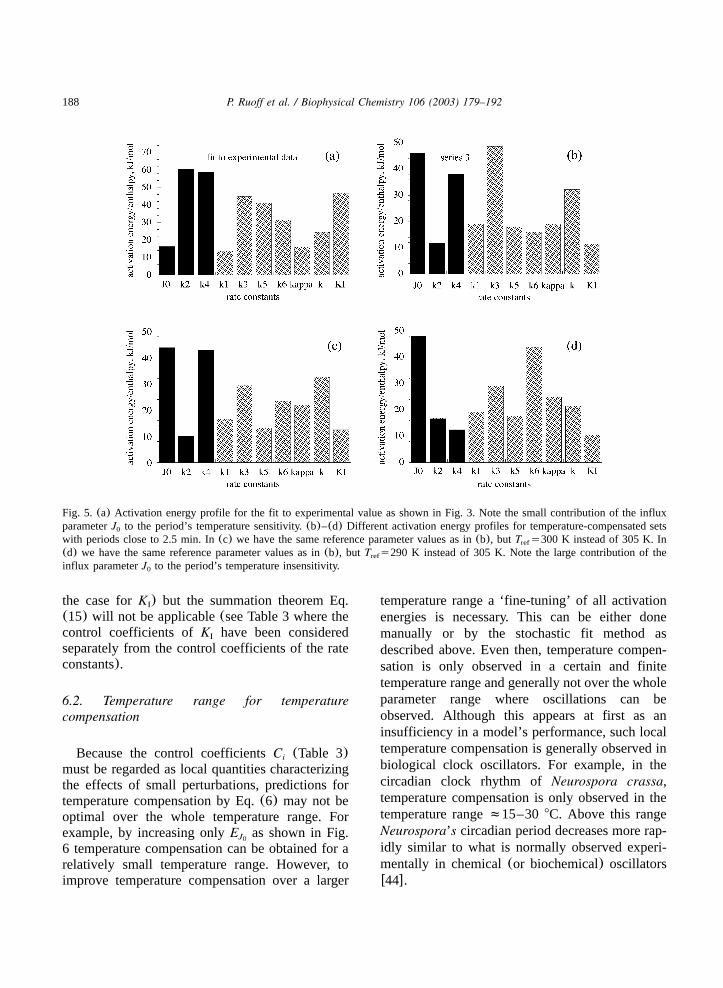
With a given set of control coefficients there isclearly a certain variability in the activation ener-gies necessary to satisfy Eq.(6) and thus achievetemperature compensation. Since the balancingsum for the model fitted to the experimental datais negative(Table 4) temperature compensationcan either be achieved by decreasing the activationenergies of steps with negative control coefficientsor by increasing the activation energies of stepswith positive control coefficients. This is in accordwith the three different activation energy profiles
shown in Fig. 5b–d which all result in tempera-ture-compensated oscillators with a period ofapproximately 2.5 min. It is seen that a commonfeature of these profiles is the high activationenergyE of the input flux which has a positiveJ0
control coefficient. In fact, increasingE aloneJ0

186 P. Ruoff et al. / Biophysical Chemistry 106 (2003) 179–192
Fig. 3. Horizontal lines(1)–(7): Temperature-compensatedoscillations with different periods. Reference parameter values:(1) T s300 K, J s1.0 mMymin, k s25 mMymin, k s2.0ref 0 1 2
mMymin, all other parameter values as in Table 1;E ’s arei
given in Table 4;(2) T s300 K, k s25 mMymin, k s2.0ref 1 2
mMymin, k s2.2ymin, all other parameter values as in Table5
1; E s39.8 kJymol, E s17.1 kJymol, E s9.9 kJymol, E sJ k k k0 1 2 3
29.2 kJymol, E s39.2 kJymol, E s14.3 kJymol, E s23.7k k k4 5 6
kJymol, E s31.3 kJymol, E s23.7 kJymol, E s12.3k kappa KI
kJymol; (3) T s305 K, k s25 mMymin, k s2.0 mMymin,ref 1 2
all other parameter values as in Table 1;E ’s are given in Tablei
4; (4) T s312 K, J s4.1 mMymin, k s25 mMymin, k sref 0 1 2
2.0 mMymin, k s1.1ymin, all other parameter values as in5
Table 1; E s45.8 kJymol, E s15.2 kJymol, E s10.5J k1 k0 2
kJymol, E s31.1 kJymol, E s45.4 kJymol, E s13.3k k k3 4 5
kJymol, E s21.2 kJymol, E s32.6 kJymol, E s20.0k k kappa6
kJymol, E s12.3 kJymol; (5) T s312 K, J s4.3 mMymin,K ref 0I
k s25 mMymin, k s2.0 mMymin, k s0.7ymin, all other1 2 5
parameter values as in Table 1;E s42.0 kJymol, E s15.3J k0 1
kJymol, E s10.7 kJymol, E s28.4 kJymol, E s44.1k k k2 3 4
kJymol, E s13.3 kJymol, E s23.0 kJymol, E s29.6k k k5 6
kJymol, E s20.2 kJymol, E s11.7 kJymol; (6) T s318kappa K refI
K, J s4.5 mMymin, k s20 mMymin, k s1.5 mMymin, k s0 1 2 4
150 mMymin, k s0.7ymin, K s0.45 mM, all other parameter5 I
values as in Table 1;E ’s are given in Table 4;(7) T s312i ref
K, J s4.7 mMymin, k s20 mMymin, k s1.5 mMymin, k s0 1 2 4
150 mMymin, k s0.7ymin, K s0.37 mM, all other parameter5 I
values as in Table 1;E ’s are given in Table 4. Open diamonds:i
experimental data by Betz and Chancew24x. Open squares:experimental data by Hemker et al.(unpublished). Thick solidline: smoothed curve of Hemker et al. data. Large solid dots:fit of model to Hemker et al. data;T s286.5 K, k s25ref 1
mMymin, k s2.0 mMymin, all other parameter values as in2
Table 1;E ’s are given in Table 4.i
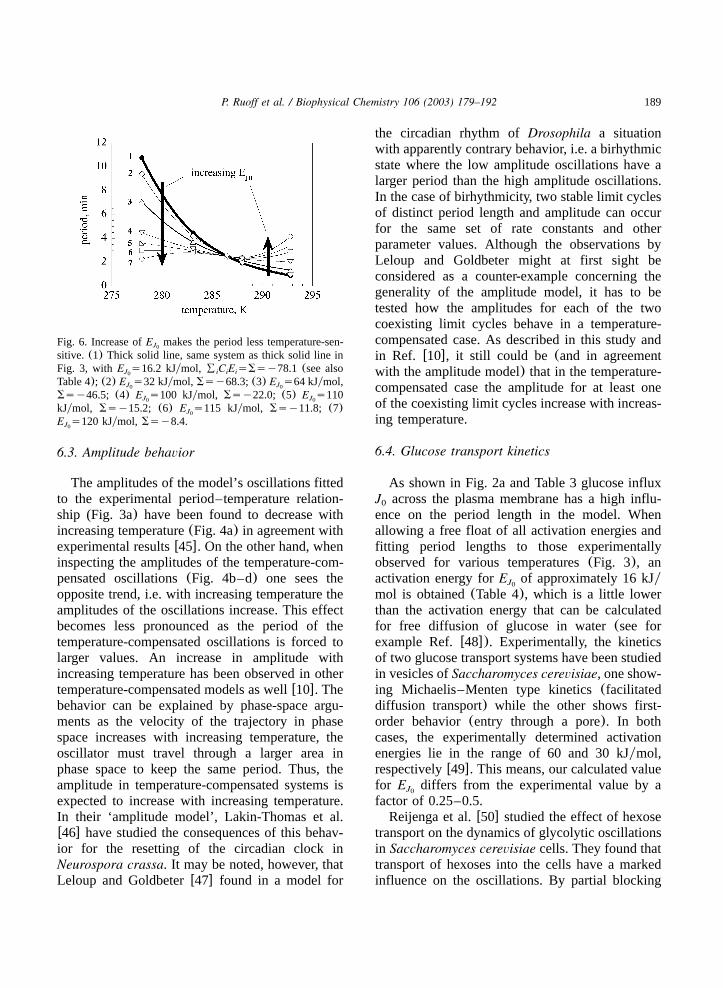
makes the period of the oscillations less tempera-ture-sensitive as shown in Fig. 6. Moreover, theactivation energy of nonglycolytic ATP-consump-tion (step 5) which is characterized by a strong
negative control coefficient is decreased for tem-perature-compensated oscillations. The same holdstrue for the enthalpy which enters the temperaturedependence of the inhibition constantK . TheI
values of the other activation energies for stepswith lower absolute values of the control coeffi-cients are more variable.
6. Discussion
6.1. Control coefficients and approximate descrip-tion of period
The results shown in Fig. 3 and Table 4 showclearly that the model of glycolytic oscillationscan be easily temperature-compensated with Eq.(6) as an indicator when temperature compensationis expected to occur. The suitability of Eq.(6) topredict temperature compensation has been shownfor several other chemical and biological oscillatormodelsw10,41,42x. On the basis of the performedsensitivity analysis it may be appropriate toapproximate the oscillator’s periodP, Eq. (3), bythe expression
CiB EkiC FP(h k ,«,k st (14)Ž .1 N 02D Gki,0i
which results from a logarithmic expansion of thefunction P(k ,«, k ) around a reference state1 N
characterized by the rate constantsk and thei,0
reference periodt w10,41x. According to the0
summation theorem for control coefficients ofoscillatory periods the following relation isfulfilled
Csy1 (15)i8i
w25,28,43x. Eq.(15) reflects the fact that the periodis a homogeneous function of the rate constants ofdegreey1. For larger deviations of the rate con-stants from their reference values Eq.(14) is onlyapproximately fulfilled. Some(temperature-sensi-tive) parameters(for exampleK ) may not enterI
the rate equations in a homogenous form as mostof the rate constants normally do. In this case, theperiod will still depend on that parameter(as is
187P. Ruoff et al. / Biophysical Chemistry 106 (2003) 179–192
Table 4Testing the balancing equation, Eq.(6)
Parameter E , kJymoli E , kJymoli E , kJymoli E , kJymoli E , kJymoli
(experimental)a (series 1) (series 3) (series 6) (series 7)
J0 16.2 43.9 46.1 41.4 51.0k3 44.9 31.7 48.7 30.4 39.2k4 58.7 44.2 38.0 48.1 42.4k1 13.8 16.0 19.1 14.0 23.3k2 60.7 10.4 11.8 10.8 11.9k5 41.2 13.3 17.9 15.1 19.8k6 31.4 23.7 16.2 24.0 15.7k (kappa) 15.9 22.3 19.0 18.7 19.7k 24.3 30.0 32.2 34.1 31.5K b
I 47.0 12.2 11.4 8.6 10.0
8 C Ei k iiy79.0 y2.3 y6.1 y1.8 y3.6
For calculating the balance sums8 C E (last row), values for control coefficients have been used corresponding to a 10%i k ii
change of parameters(cf. Table 3).Fit to Hemker et al. data, Fig. 3(large solid dots).a
In case ofK , E is interpreted asDH .b 0I i KI
Fig. 4. Amplitudes and form of oscillations.(a) Fit to Hemker et al. data(Fig. 3). With increasing temperature the amplitudedecreases as found experimentally(Chance et al.w45x). (b) and (c) The amplitude for the temperature-compensated oscillationsincreases with increasing temperature, but this effect becomes less important for larger period lengths.
188 P. Ruoff et al. / Biophysical Chemistry 106 (2003) 179–192
Fig. 5. (a) Activation energy profile for the fit to experimental value as shown in Fig. 3. Note the small contribution of the influxparameterJ to the period’s temperature sensitivity.(b)–(d) Different activation energy profiles for temperature-compensated sets0
with periods close to 2.5 min. In(c) we have the same reference parameter values as in(b), but T s300 K instead of 305 K. Inref
(d) we have the same reference parameter values as in(b), but T s290 K instead of 305 K. Note the large contribution of theref
influx parameterJ to the period’s temperature insensitivity.0
the case forK ) but the summation theorem Eq.I
(15) will not be applicable(see Table 3 where thecontrol coefficients ofK have been consideredI
separately from the control coefficients of the rateconstants).
6.2. Temperature range for temperaturecompensation
Because the control coefficientsC (Table 3)i
must be regarded as local quantities characterizingthe effects of small perturbations, predictions fortemperature compensation by Eq.(6) may not beoptimal over the whole temperature range. Forexample, by increasing onlyE as shown in Fig.J0
6 temperature compensation can be obtained for arelatively small temperature range. However, toimprove temperature compensation over a larger
temperature range a ‘fine-tuning’ of all activationenergies is necessary. This can be either donemanually or by the stochastic fit method asdescribed above. Even then, temperature compen-sation is only observed in a certain and finitetemperature range and generally not over the wholeparameter range where oscillations can beobserved. Although this appears at first as aninsufficiency in a model’s performance, such localtemperature compensation is generally observed inbiological clock oscillators. For example, in thecircadian clock rhythm ofNeurospora crassa,temperature compensation is only observed in thetemperature rangef15–30 8C. Above this rangeNeurospora’s circadian period decreases more rap-idly similar to what is normally observed experi-mentally in chemical(or biochemical) oscillatorsw44x.
189P. Ruoff et al. / Biophysical Chemistry 106 (2003) 179–192
Fig. 6. Increase ofE makes the period less temperature-sen-J0
sitive. (1) Thick solid line, same system as thick solid line inFig. 3, with E s16.2 kJymol, 8 C E sSsy78.1 (see alsoJ i i i0
Table 4); (2) E s32 kJymol, Ssy68.3;(3) E s64 kJymol,J J0 0
Ssy46.5; (4) E s100 kJymol, Ssy22.0; (5) E s110J J0 0
kJymol, Ssy15.2; (6) E s115 kJymol, Ssy11.8; (7)J0
E s120 kJymol, Ssy8.4.J0
6.3. Amplitude behavior
The amplitudes of the model’s oscillations fittedto the experimental period–temperature relation-ship (Fig. 3a) have been found to decrease withincreasing temperature(Fig. 4a) in agreement withexperimental resultsw45x. On the other hand, wheninspecting the amplitudes of the temperature-com-pensated oscillations(Fig. 4b–d) one sees theopposite trend, i.e. with increasing temperature theamplitudes of the oscillations increase. This effectbecomes less pronounced as the period of thetemperature-compensated oscillations is forced tolarger values. An increase in amplitude withincreasing temperature has been observed in othertemperature-compensated models as wellw10x. Thebehavior can be explained by phase-space argu-ments as the velocity of the trajectory in phasespace increases with increasing temperature, theoscillator must travel through a larger area inphase space to keep the same period. Thus, theamplitude in temperature-compensated systems isexpected to increase with increasing temperature.In their ‘amplitude model’, Lakin-Thomas et al.w46x have studied the consequences of this behav-ior for the resetting of the circadian clock inNeurospora crassa. It may be noted, however, thatLeloup and Goldbeterw47x found in a model for
the circadian rhythm ofDrosophila a situationwith apparently contrary behavior, i.e. a birhythmicstate where the low amplitude oscillations have alarger period than the high amplitude oscillations.In the case of birhythmicity, two stable limit cyclesof distinct period length and amplitude can occurfor the same set of rate constants and otherparameter values. Although the observations byLeloup and Goldbeter might at first sight beconsidered as a counter-example concerning thegenerality of the amplitude model, it has to betested how the amplitudes for each of the twocoexisting limit cycles behave in a temperature-compensated case. As described in this study andin Ref. w10x, it still could be (and in agreementwith the amplitude model) that in the temperature-compensated case the amplitude for at least oneof the coexisting limit cycles increase with increas-ing temperature.
6.4. Glucose transport kinetics
As shown in Fig. 2a and Table 3 glucose influxJ across the plasma membrane has a high influ-0
ence on the period length in the model. Whenallowing a free float of all activation energies andfitting period lengths to those experimentallyobserved for various temperatures(Fig. 3), anactivation energy forE of approximately 16 kJyJ0
mol is obtained(Table 4), which is a little lowerthan the activation energy that can be calculatedfor free diffusion of glucose in water(see forexample Ref.w48x). Experimentally, the kineticsof two glucose transport systems have been studiedin vesicles ofSaccharomyces cerevisiae, one show-ing Michaelis–Menten type kinetics(facilitateddiffusion transport) while the other shows first-order behavior(entry through a pore). In bothcases, the experimentally determined activationenergies lie in the range of 60 and 30 kJymol,respectivelyw49x. This means, our calculated valuefor E differs from the experimental value by aJ0
factor of 0.25–0.5.Reijenga et al.w50x studied the effect of hexose
transport on the dynamics of glycolytic oscillationsin Saccharomyces cerevisiae cells. They found thattransport of hexoses into the cells have a markedinfluence on the oscillations. By partial blocking
190 P. Ruoff et al. / Biophysical Chemistry 106 (2003) 179–192
the influx of glucose into the cells using maltosethe authors found an increase in frequency withan increase of the glucose influx. The Reijenga etal. in vivo studies are also in agreement withearlier experiments performed on cell extractsw51x,where it was found that the frequency of theoscillations increased with increasing input rate ofsubstrate glucose or fructose. Although the modelstudied here shows a considerable influence of theglucose influx on the period, the experimentalfindings by Reijenga et al.w50x are opposite to theJ -influence in the model, which predicts a0
decrease in frequency with an increase of glucoseinflux J (Fig. 2a). The reason for this discrepancy0
is not clear, but it could be related to the complexregulation of glucose uptake by different hexosetransportersw52,53x or to the type of PFK regula-tion considered in the studied model. Althoughmodels based on activation of PFKw32x or pyru-vate kinasew54x are in agreement with the exper-imental relationship between frequency andglucose influx, a check of frequency control coef-ficients w29,55,56x showed that even more detailedmodels such as the ‘full-scale model’ of Hynne etal. w33x do not reflect the experimentally observednegative effect of the glucose influx on the oscil-latory period.
6.5. Experimental temperature-compensated yeastglycolytic oscillators?
An interesting question is whether it would bepossible to obtain yeast mutants which have aglycolytic oscillator that is less temperature sensi-tive or even temperature-compensated. As indicat-ed by this study and also by experimentsw50x, theinflux of glucose into the cells seems to play animportant role in the control of glycolytic dynam-ics. Therefore, a possible start in the search for atemperature-compensated-glycolytic oscillator maybe to look at the oscillator’s temperature behaviorin hexose transport mutantsw53x.
However, using glycolytic oscillator models asguidelines is somewhat problematic. Mainlybecause the different models have different sensi-tivities against parameter changes and also focuson different aspects of the oscillationsw29,56x. Anextensive comparison between in vivo behavior of
yeast glycolysis and the in vitro kinetic propertiesof the constituent enzymes showed considerablediscrepancies and for only 50% of the enzymesthe in vitro kinetics did describe the in vivo activitysatisfactorily w57x. Although the dynamics of theglycolytic oscillations in yeast are still not com-pletely understood, model calculations in combi-nation with site directed mutation experiments onthe hexose transporter genesw53x could still beuseful in order to make yeast mutants which havea less temperature-sensitive-glycolytic oscillator.
7. Conclusion
We have shown that temperature compensationis possible in a detailed modelw20x for glycolyticoscillations. Using the same strategy, conditionsfor temperature compensation in other glycolyticoscillator models should be obtainable. By affect-ing the kinetics and activation energies for one orseveral component processes with molecular biol-ogy methods it might even be possible to constructyeast mutants which show temperature-compensat-ed glycolytic oscillations. Such mutants may notonly be of importance for an understanding of themolecular processes in glycolytic oscillations, butalso for our understanding of temperature compen-sation in biological clocks.
Acknowledgments
We thank Hans Westerhoff for allowing us touse the work by Hemker et al. and for bringingup the idea of a temperature-compensated glycol-ytic oscillator. We also thank Stefan Muller for¨helpful correspondence and comments. P.R. thanksJay Dunlap, Department of Genetics, DartmouthMedical School for hospitality and support whilea final version of the manuscript was prepared.
References
w1x E. Bunning, The Physiological Clock, Springer, Berlin,¨1963.
w2x L.N. Edmunds, Cellular and Molecular Bases of Biolog-ical Clocks, Springer, New York, 1988.
w3x L. Rensing, U. Meyer-Grahle, P. Ruoff, Biologicaltiming and the clock metaphor: oscillatory and hourglassmechanisms, Chronobiol. Int. 18(2001) 329–369.
191P. Ruoff et al. / Biophysical Chemistry 106 (2003) 179–192
w4x J.C. Dunlap, J.J. Loros, P.J. DeCoursey, BiologicalTimekeeping, Sinauer Associates, Inc. Publishers, Sun-derland, 2003.
w5x Special issue on Temperature compensation: molecularmechanisms and models, Chronobiol. Int. 14(1997)445–536.
w6x C.S. Pittendrigh, Temporal organization: reflections ofa Darwinian clock-watcher, Ann. Rev. Physiol. 55(1993) 16–54.
w7x M. Dixon, E.C. Webb, C.J.R. Thorne, K.F. Tipton,Enzymes, Longman, London, 1979.
w8x J.W. Hastings, B.M. Sweeney, On the mechanism oftemperature independence in a biological clock, Proc.Natl. Acad. Sci. USA 43(1957) 804–811.
w9x P. Ruoff, M. Vinsjevik, L. Rensing, Temperature com-pensation in biological oscillators: a challenge for jointexperimental and theoretical analysis, Comments Theor.Biol. 5 (2000) 361–382.
w10x P. Ruoff, Introducing temperature-compensation in anyreaction kinetic oscillator model, J. Interdiscipl. CycleRes. 23(1992) 92–99.
w11x P. Ruoff, L. Rensing, R. Kommedal, S. Mohsenzadeh,Modeling temperature compensation in chemical andbiological oscillators, Chronobiol. Int. 14(1997)499–510.
w12x A. Skrabal, Vorlesungsversuch zur Demonstration einesFalles der Abnahme der Reaktionsgeschwindigkeit mitder Temperatur, Z. Elektrochem. 21(1915) 461–463.
w13x G. Rabai, I. Hanazaki, Temperature compensation in the´oscillatory hydrogen peroxide–thiosulfate–sulfite flowsystem, Chem. Comm. 19(1999) 1965–1966.
w14x K.M. Kovacs, G. Rabai, Temperature-compensation in´ ´pH-oscillators, Phys. Chem. Chem. Phys. 4(2002)5265–5269.
w15x B. Chance, E.K. Pye, A.K. Ghosh, B. Hess, Biologicaland Biochemical Oscillators, Academic Press, NewYork, 1973.
w16x S. Danø, P.G. Sørensen, F. Hynne, Sustained oscillationsin living cells, Nature 402(1999) 320–322.
w17x B. Hess, A. Boiteux, Oscillatory phenomena in bio-chemistry, Ann. Rev. Biochem. 40(1971) 237–258.
w18x B. Hess, Periodic patterns in biochemical reactions, Q.Rev. Biophys. 30(1997) 121–176.
w19x P. Richard, B. Teusink, M.B. Hemker, K. Van Dam,H.V. Westerhoff, Sustained oscillations in free-energystate and hexose phosphates in yeast, Yeast 12(1996)731–740.
w20x J. Wolf, R. Heinrich, Effect of cellular interaction onglycolytic oscillations in yeast: a theoretical investiga-tion, Biochem. J. 345(Pt 2) (2000) 321–334.
w21x J.C. Leloup, A. Goldbeter, Temperature compensationof circadian rhythms: control of the period in a modelfor circadian oscillations of the per protein inDrosoph-ila, Chronobiol. Int. 14(1997) 511–520.
w22x C.I. Hong, J.J. Tyson, A proposal for temperaturecompensation of the circadian rhythm inDrosophila
based on dimerization of the PER protein, Chronobiol.Int. 14 (1997) 521–529.
w23x K.R. Valeur, R. degli Agosti, Simulations of temperaturesensitivity of the peroxidase–oxidase oscillator, Bio-phys. Chem. 99(2002) 259–270.
w24x A. Betz, B. Chance, Influence of inhibitors and temper-ature on the oscillation of reduced pyridine nucleotidesin yeast cells, Arch. Biochem. Biophys. 109(1965)579–584.
w25x R. Heinrich, S. Schuster, The Regulation of CellularSystems, Chapman and Hall, New York, 1996.
w26x R.M. Noyes, Kinetics of complex reactions, Techniquesof Chemistry 6, Invest. Rates Mech. React., third ed.,(Pt 1) (1974) 489–538.
w27x K.J. Laidler, J.H. Meiser, Physical Chemistry, seconded., Houghton Mifflin Company, Geneva(Illinois),1995.
w28x H. Kacser, J.A. Burns, The control of flux, Symp. Soc.Exp. Biol. 27(1973) 65–104.
w29x K.A. Reijenga, H.V. Westerhoff, B.N. Kholodenko, J.L.Snoep, Control analysis for autonomously oscillatingbiochemical networks, Biophys. J. 82(2002) 99–108.
w30x U.F. Franck, Feedback kinetics in physicochemicaloscillators, Ber. Bunsenges. Phys. Chem. 84(1980)334–341.
w31x A. Goldbeter, Biochemical Oscillations and CellularRhythms: The Molecular Bases of Periodic and ChaoticBehavior, Cambridge University Press, Cambridge, UK,1996.
w32x A. Goldbeter, R. Lefever, Dissipative structures for anallosteric model. Application to glycolytic oscillations,Biophys. J. 12(1972) 1302–1315.
w33x F. Hynne, S. Danø, P.G. Sørensen, Full-scale model ofglycolysis inSaccharomyces cerevisiae, Biophys. Chem.94 (2001) 121–163.
w34x O. Richter, A. Betz, C. Giersch, The response ofoscillating glycolysis to perturbations in the NADHyNAD system: a comparison between experiments and acomputer model, Biosystems 7(1975) 137–146.
w35x E.E. Sel’kov, Self-oscillations in glycolysis. 1. A simplekinetic model, Eur. J. Biochem. 4(1968) 79–86.
w36x P. Smolen, A model for glycolytic oscillations based onskeletal muscle phosphofructokinase kinetics, J. Theor.Biol. 174 (1995) 137–148.
w37x Y. Termonia, J. Ross, Oscillations and control featuresin glycolysis: numerical analysis of a comprehensivemodel, Proc. Natl. Acad. Sci. USA 78(1981)2952–2956.
w38x K. Radhakrishnan, A.C. Hindmarsh, Description andUse of LSODE, the Livermore Solver for OrdinaryDifferential Equations, National Aeronautics and SpaceAdministration, Lewis Research Center, Cleveland, OH44135-3191, 1993.
w39x FORTRAN 77 compiler for Macintosh, Absoft Corp.,Rochester Hills, MI 48309, USA, 1997.
w40x W.H. Press, B.P. Flannery, S.A. Teukolsky, W.T. Vetter-ling, Numerical Recipes. The Art of Scientific Comput-

192 P. Ruoff et al. / Biophysical Chemistry 106 (2003) 179–192
ing (FORTRAN Version), Cambridge University Press,Cambridge, UK, 1989.
w41x P. Ruoff, Antagonistic balance in the Oregonator: aboutthe possibility of temperature-compensation in theBelousov–Zhabotinsky reaction, Physica D 84(1995)204–211.
w42x P. Ruoff, L. Rensing, The temperature-compensatedGoodwin model simulates many circadian clock prop-erties, J. Theor. Biol. 179(1996) 275–285.
w43x P.F. Baconnier, P. Pachot, J. Demongeot, An attempt togeneralize the control coefficient concept, J. Biol. Syst.1 (1993) 335–347.
w44x G.F. Gardner, J.F. Feldman, Temperature compensationof circadian periodicity in clock mutants ofNeurosporacrassa, Plant Physiol. 68(1981) 1244–1248.
w45x B. Chance, R.W. Estabrook, A. Ghosh, Damped sinu-soidal oscillations of cytoplasmic reduced pyridinenucleotide in yeast cells, Proc. Natl. Acad. Sci. USA 51(1964) 1244–1251.
w46x P.L. Lakin-Thomas, S. Brody, G.G. Cote, Amplitudemodel for the effects of mutations and temperature onperiod and phase resetting of theNeurospora circadianoscillator, J. Biol. Rhythms 6(1991) 281–297.
w47x J.C. Leloup, A. Goldbeter, Chaos and birhythmicity ina model for circadian oscillations of the PER and TIMproteins in Drosophila, J. Theor. Biol. 198(1999)445–459.
w48x W.D. Stein, Transport and Diffusion Across Cell Mem-branes, Academic Press, San Diego, 1986.
w49x C. Reinhardt, B. Volker, H.J. Martin, J. Kneiseler, G.F.Fuhrmann, Different activation energies in glucose
uptake inSaccharomyces cerevisiae DFY1 suggest twotransport systems, Biochim. Biophys. Acta 1325(1997)126–134.
w50x K.A. Reijenga, J.L. Snoep, J.A. Diderich, H.W.van Verseveld, H.V. Westerhoff, B. Teusink, Control ofglycolytic dynamics by hexose transport inSaccharo-myces cerevisiae, Biophys. J. 80(2001) 626–634.
w51x B. Hess, A. Boiteux, Biological and biochemical oscil-lators, in: B. Chance, E.K. Pye, A.K. Ghosh, B. Hess(Eds.), Substrate Control of Glycolytic Oscillations,Academic Press, New York, 1973, pp. 229–241.
w52x A.L. Kruckeberg, The hexose transporter family ofSaccharomyces cerevisiae, Arch. Microbiol. 166(1996)283–292.
w53x S. Ozcan, M. Johnston, Function and regulation of yeast¨
hexose transporters, Microbiol. Mol. Biol. Rev. 63(1999) 554–569.
w54x V.V. Dynnik, E.E. Sel’kov, On the possibility of self-oscillations in the lower part of the glycolytic system,FEBS Lett. 37(1973) 342–346.
w55x M. Bier, B.M. Bakker, H.V. Westerhoff, How yeast cellssynchronize their glycolytic oscillations: a perturbationanalytic treatment, Biophys. J. 78(2000) 1087–1093.
w56x B. Teusink, B.M. Bakker, H.V. Westerhoff, Control offrequency and amplitudes is shared by all enzymes inthree models for yeast glycolytic oscillations, Biochim.Biophys. Acta 1275(1996) 204–212.
w57x B. Teusink, J. Passarge, C.A. Reijenga, et al., Can yeastglycolysis be understood in terms of in vitro kinetics ofthe constituent enzymes? Testing biochemistry, Eur. J.Biochem. 267(2000) 5313–5329.