temperature measurment
TRANSCRIPT

1
Koya University
Faculty of Engineering Chemical Engineering Department
Laboratory of Heat Transfer Experiment Number Six
Temperature Measurement
Instructor: Dr.Barham & Mrs.
Name of Student: Aree Salah Tahir
Experiment Contacted on: 13/April/2015
Report Submitted on: 20/April /2015
Group:A

2
List of content:
Aim………………………………………………………….3
Introduction...…………………………….……………..….4
Background Theory ……………………………………….5
Procedure …………………………………………………..6
Equipment and components used........................................7
Calculation.............................................................................8
Plots………………………………………………………9-10
Discussion ………………………………………………….11
References ………………………………………………….12

3
Aim:
The probe type is determined by the measurement task. The selection
of the most suitable temperature sensor is made according to the
following criteria:
- Measurement range
- Accuracy
- Measurement site design
- Reaction time
- Durability. {1}

4
Introduction:
Temperature measurement in today’s industrial environment
encompasses a wide variety of needs and applications. To meet this
wide array of needs the process controls industry has developed a
large number of sensors and devices to handle this demand. In this
experiment you will have an opportunity to understand the concepts
and uses of many of the common transducers, and actually run an
experiment using a selection of thesemdevices. Temperature is a very
critical and widely measured variable for most mechanical engineers.
Many processes must have either a monitored or controlled
temperature. This can range from the simple monitoring of the water
temperature of an engine or load device, or as complex as the
temperature of a weld in a laser welding application. More difficult
measurements such as the temperature of smoke stack gas from a
power generating station or blast furnace or the exhaust gas of a
rocket may be need to be monitored. Much more common are the
temperatures of fluids in processes or process support applications, or
the temperature of solid objects such as metal plates, bearings and
shafts in a piece of machinery.{2}

5
Background Theory:
In many engineering systems temperature constitutes an important
physical variable that needs to be monitored and controlled. For
example, temperature sensors are present in buildings, chemical
processing plants, engines, computers, vehicles, etc. Many physical
phenomena (e.g., pressure, volume, electrical resistance, expansion
coefficients, etc.) can be related to temperature through
the fundamental molecular structure. Temperature variations affect
these quantities, and hence their changes can be used to indirectly
measure temperature.
Temperature measurement devices can be classified as mechanically
operative (mercury thermometer and bimetallic strip) or electrically
operative (resistance temperature detector, thermistor, and
thermocouple). In this laboratory, we will concentrate on electric-
based temperature sensors due to their higher accuracy and ease in
providing measurements for signal processing and computer
acquisition. These sensors are based on the principle that electrical
resistance or voltage of some materials changes in a reproducible
manner with temperature.{3}
2.1. Resistance Temperature Detector (RTD)
2.2. Thermistor
2.3. Thermocouple

6
Procedure:
1. Fill the insulated task with water
2. Put the immersion heater in socket and immerse it in water
(unregulated socket).
3. At room temperature which we will take it from mercury
thermometer we should all the temperatures from other sensors.
4. After that we record the temperature for each one of the sensors
with thermometer that means the mercury thermometer is our
standard method.
5. Make a table and record the data.

7
Equipment and components used:
1-power-regulated socket
2-laboratory heater for water and sand
3-psychrometer to determine air humidity
4-gas pressure thermometer
5-bimetal thermometer
6-vacuum flask
7-mercury thermometer
8-digital display, thermocouple type K
9-digital display, thermistor (NTC)
10-digital display, Pt100
11-multimeter
{4}

8
calculation:
Table of calculation:
NO D.D.Pt100 TNS Gas P.T B.M.TH Mercury.TH
1 22.9 22.2 19 11 22
2 88 69 70 80 90
3 86.4 69 70 79 85
4 82.5 68.2 59 77 80
5 75.5 66.5 61 70 75
6 69.5 64 58 60 70
9
Plots:
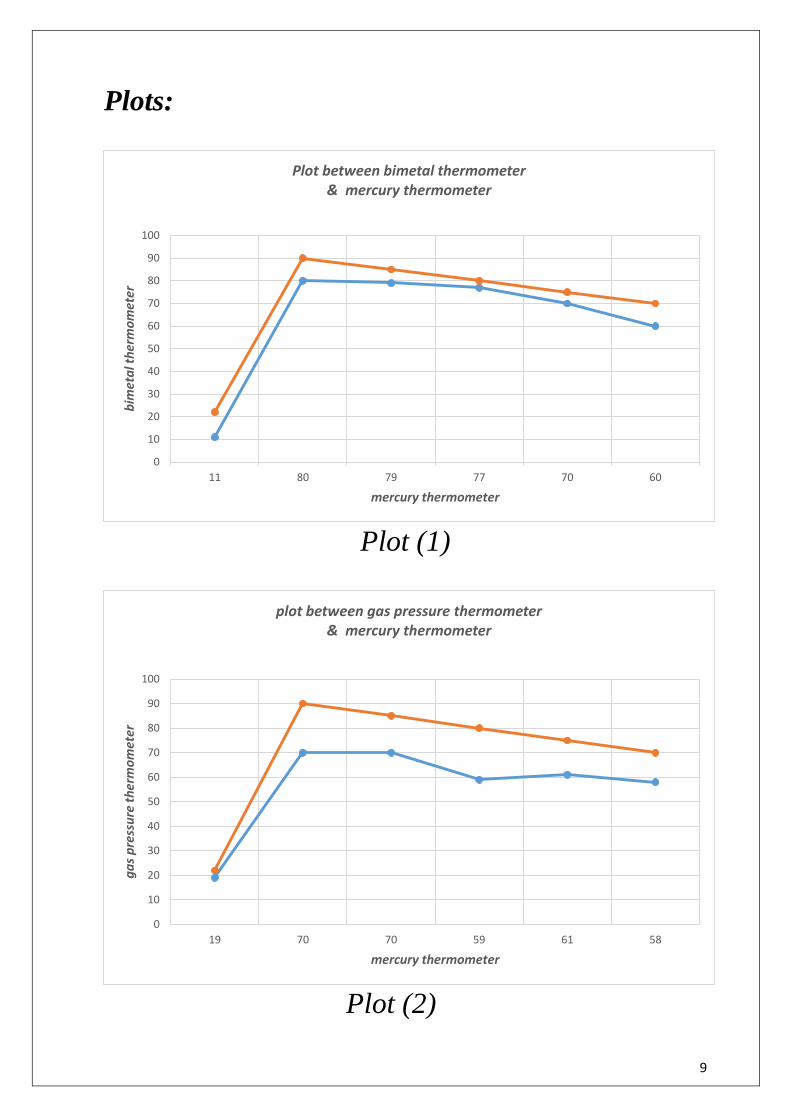
Plot (1)
Plot (2)
0
10
20
30
40
50
60
70
80
90
100
11 80 79 77 70 60
bim
eta
l th
erm
om
eter
mercury thermometer
Plot between bimetal thermometer& mercury thermometer
0
10
20
30
40
50
60
70
80
90
100
19 70 70 59 61 58
ga
s p
ress
ure
th
erm
om
eter
mercury thermometer
plot between gas pressure thermometer& mercury thermometer
10
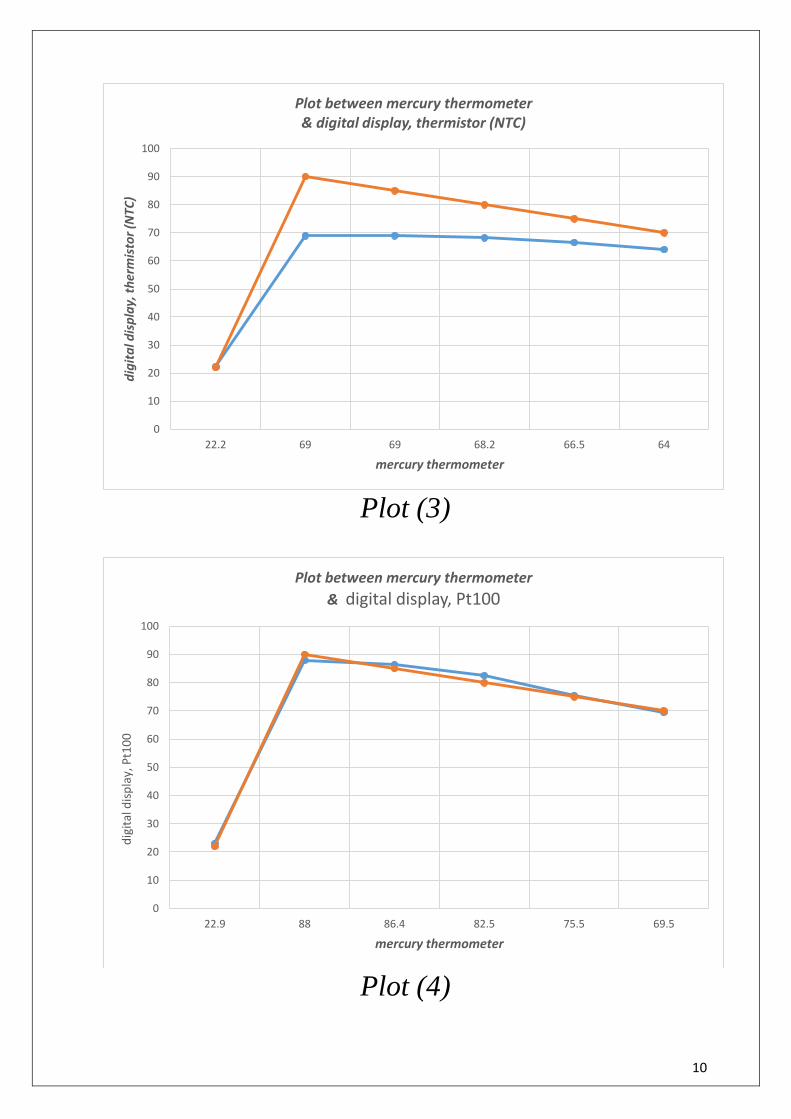
Plot (3)
Plot (4)
0
10
20
30
40
50
60
70
80
90
100
22.2 69 69 68.2 66.5 64
dig
ita
l dis
pla
y, t
her
mis
tor
(NTC
)
mercury thermometer
Plot between mercury thermometer& digital display, thermistor (NTC)
0
10
20
30
40
50
60
70
80
90
100
22.9 88 86.4 82.5 75.5 69.5
dig
ital
dis
pla
y, P
t10
0
mercury thermometer
Plot between mercury thermometer
& digital display, Pt100
11
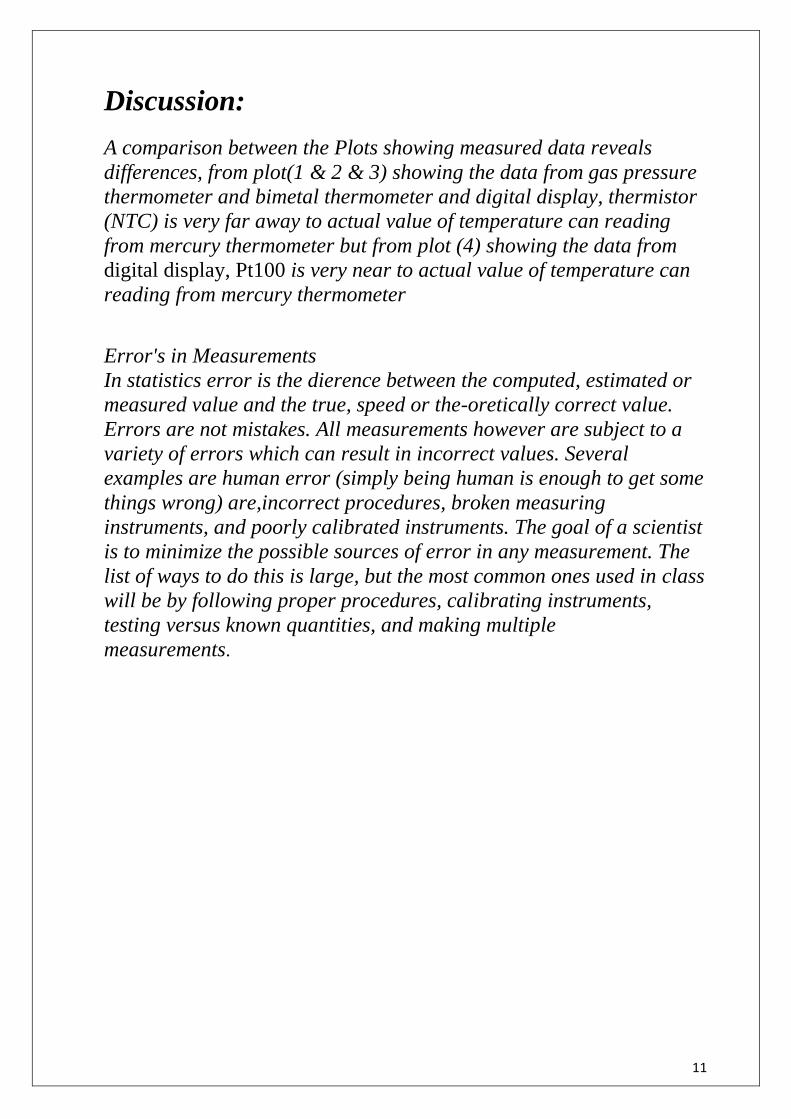
Discussion:
A comparison between the Plots showing measured data reveals
differences, from plot(1 & 2 & 3) showing the data from gas pressure
thermometer and bimetal thermometer and digital display, thermistor
(NTC) is very far away to actual value of temperature can reading
from mercury thermometer but from plot (4) showing the data from
digital display, Pt100 is very near to actual value of temperature can
reading from mercury thermometer
Error's in Measurements
In statistics error is the dierence between the computed, estimated or
measured value and the true, speed or the-oretically correct value.
Errors are not mistakes. All measurements however are subject to a
variety of errors which can result in incorrect values. Several
examples are human error (simply being human is enough to get some
things wrong) are,incorrect procedures, broken measuring
instruments, and poorly calibrated instruments. The goal of a scientist
is to minimize the possible sources of error in any measurement. The
list of ways to do this is large, but the most common ones used in class
will be by following proper procedures, calibrating instruments,
testing versus known quantities, and making multiple
measurements.
12
References:
1- http://fetweb.ju.edu.jo/ME/courses/labs/measurements/l
absheet/Experiment%20No%207%20RTD.pdf
2- http://me.emu.edu.tr/haybar/ME345/Experiment1.pdf
3- http://mechanical.poly.edu/faculty/slee/ME3511/Exp4.p
df
4- http://www.gunt.de/static/s3651_1.php#