temperature projections in hong kong based on ipcc … · 1 temperature projections in hong kong...
TRANSCRIPT
Reprint 764
Temperature Projections in Hong Kong
Based on IPCC Fourth Assessment Report
Y.K. Leung, M.C. Wu, K.K. Yeung & W.M. Leung
Hong Kong Meteorological Society Bulletin, Volume 17 (2007)
1
Temperature projections in Hong Kong based on IPCC Fourth Assessment Report
Y.K. Leung, M.C. Wu, K.K. Yeung and W.M. Leung
1. Background In the past several years, the Hong Kong Observatory (HKO) has carried out a series of studies on climate change in Hong Kong. One such study is on temperature projections based on the projections made in the Intergovernmental Panel on Climate Change (IPCC) Third Assessment Report (AR3) (IPCC, 2001). Since then, new methodologies, new models, expanded data sets, and new findings have emerged. These are reflected in the IPCC Fourth Assessment Report (AR4) published in 2007 (IPCC, 2007). In view of the new assessment in AR4, the temperature projections in Hong Kong need to be revised. As urbanization also contributes to the rise in Hong Kong’s temperature, the re-assessment will also take into account this effect. This paper outlines the methodology and presents some salient results.
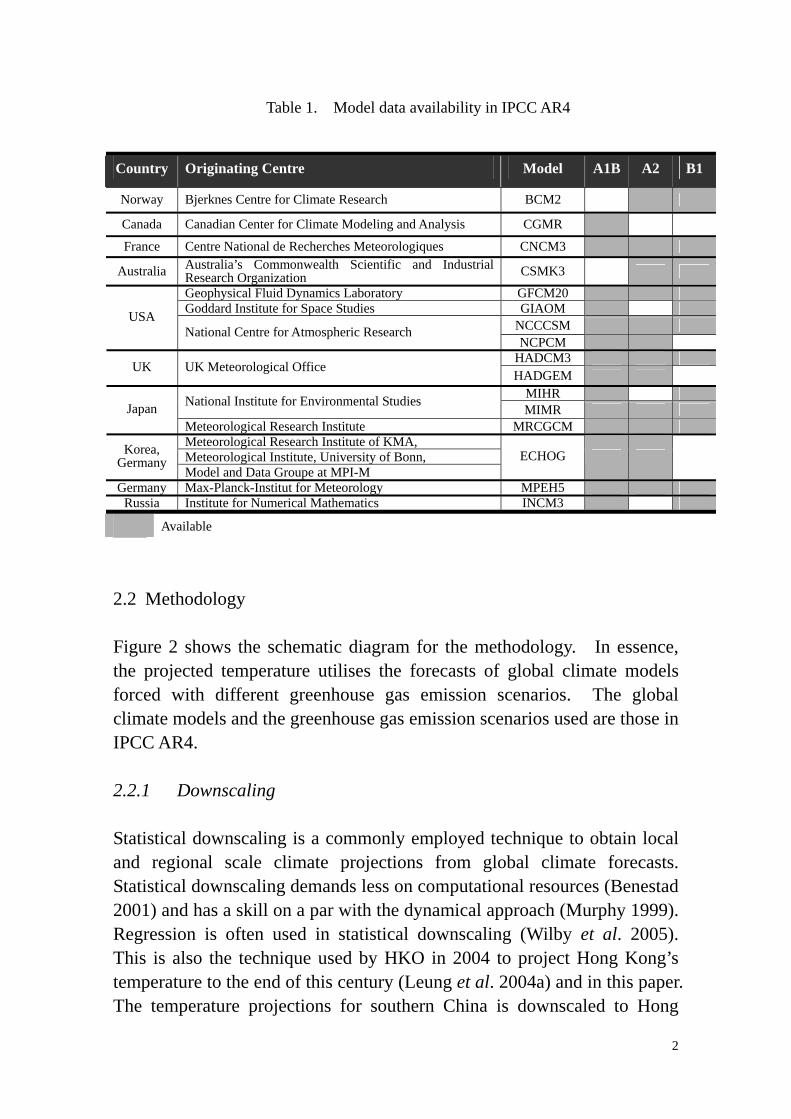
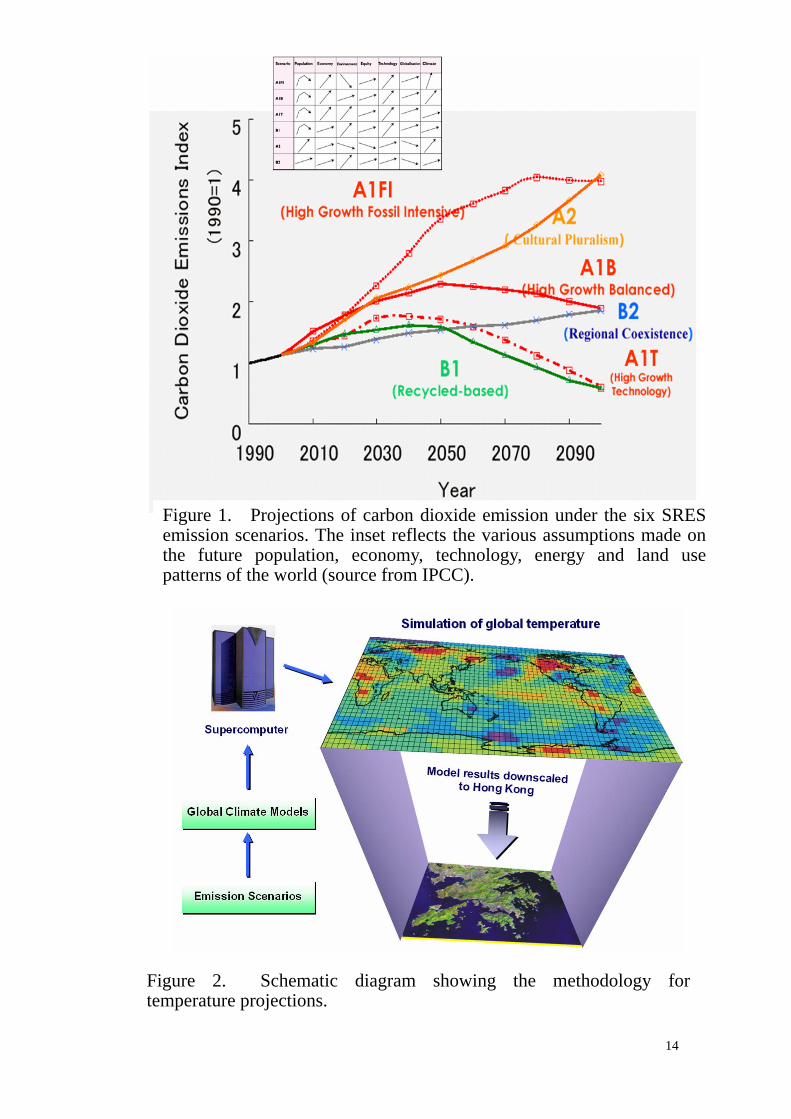
2. Data and Methodology 2.1 Data In IPCC AR4, the Special Report on the 6 Emission Scenarios (SRES) for greenhouse gas employed in IPCC AR3 is still adopted. The 6 scenarios from low to high emission are B1, A1T, B2, A1B, A2 and A1FI (Figure 1). Higher resolution and more sophisticated global climate models are developed since IPCC AR3. 16 (7 in AR3) gridded model temperature data for 3 scenarios, viz. B1, A1B and A2 (6 in AR3) are available from AR4 (Table 1). Unlike AR3, maximum and minimum temperatures of most models as well as the gridded data of the remaining 3 scenarios, viz. A1T, B2 and A1FI, are not available on the internet for public access in AR4.
2
2.2 Methodology Figure 2 shows the schematic diagram for the methodology. In essence, the projected temperature utilises the forecasts of global climate models forced with different greenhouse gas emission scenarios. The global climate models and the greenhouse gas emission scenarios used are those in IPCC AR4. 2.2.1 Downscaling Statistical downscaling is a commonly employed technique to obtain local and regional scale climate projections from global climate forecasts. Statistical downscaling demands less on computational resources (Benestad 2001) and has a skill on a par with the dynamical approach (Murphy 1999). Regression is often used in statistical downscaling (Wilby et al. 2005). This is also the technique used by HKO in 2004 to project Hong Kong’s temperature to the end of this century (Leung et al. 2004a) and in this paper. The temperature projections for southern China is downscaled to Hong
Country Originating Centre Model A1B A2 B1
Norway Bjerknes Centre for Climate Research BCM2
Canada Canadian Center for Climate Modeling and Analysis CGMR
France Centre National de Recherches Meteorologiques CNCM3
Australia Australia’s Commonwealth Scientific and Industrial Research Organization CSMK3
Geophysical Fluid Dynamics Laboratory GFCM20 Goddard Institute for Space Studies GIAOM
NCCCSM USA National Centre for Atmospheric Research
NCPCM HADCM3
UK UK Meteorological Office HADGEM
MIHR National Institute for Environmental Studies MIMR Japan Meteorological Research Institute MRCGCM Meteorological Research Institute of KMA, Meteorological Institute, University of Bonn, Korea,
Germany Model and Data Groupe at MPI-M
ECHOG
Germany Max-Planck-Institut for Meteorology MPEH5 Russia Institute for Numerical Mathematics INCM3
Available
Table 1. Model data availability in IPCC AR4
3
Kong based on past temperature regression relationship between southern China and Hong Kong. 2.2.2 Relationship between temperature in southern China and Hong Kong with urbanization effect removed For southern China, Empirical Orthogonal Function (EOF) analysis on 28 stations showed that there was generally warming mode over southern China from 1951 to 2000 (Leung et al. 2004a). Part of this warming is caused by urbanization (Guangdong Meteorological Bureau 2007). Unfortunately, quantitative assessment of the urbanization effect has not been made as no rural stations can be identified in southern China (Zhou et al. 2004). This paper makes use of the past NCEP re-analysis temperature data instead of the observed data from southern China weather stations to correlate with Hong Kong’s temperature. NCEP re-analysis data is relatively free from urbanization or land use effect because surface temperature observations are not used directly (Kalnay and Cai 2003). Instead, atmospheric vertical soundings of wind and temperature strongly influence the data (Kalnay et al. 1996). The trend for the NCEP temperature data is 0.03°C per decade, smaller than the 0.11°C per decade for the mean temperature of the 28 stations in southern China during the same period of 1951 to 2001. The magnitude of urbanization effect on temperature is taken as the temperature of the urban station minus that of a typical rural station of the region (e.g. Sakakibara and Owa 2005). In Hong Kong, the HKO Headquarters (HKO Hq) is chosen as the urban station. In a previous study (Leung et al. 2004b), Ta Kwu Ling (TKL) and Lau Fau Shan (LFS) were taken as the typical rural stations. Temperatures of the island stations such as Cheung Chau and Waglan Island were found substantially modulated by the relatively more complicated variation of temperature of the near-shore waters, hence the island stations had not been used as rural stations (Sakakibara and Owa 2005). At LFS, changes in the environment were observed near the site in the past few years. The grassland in the vicinity of LFS was converted into concrete surface for stacking up cargo containers. Also, there had been
4
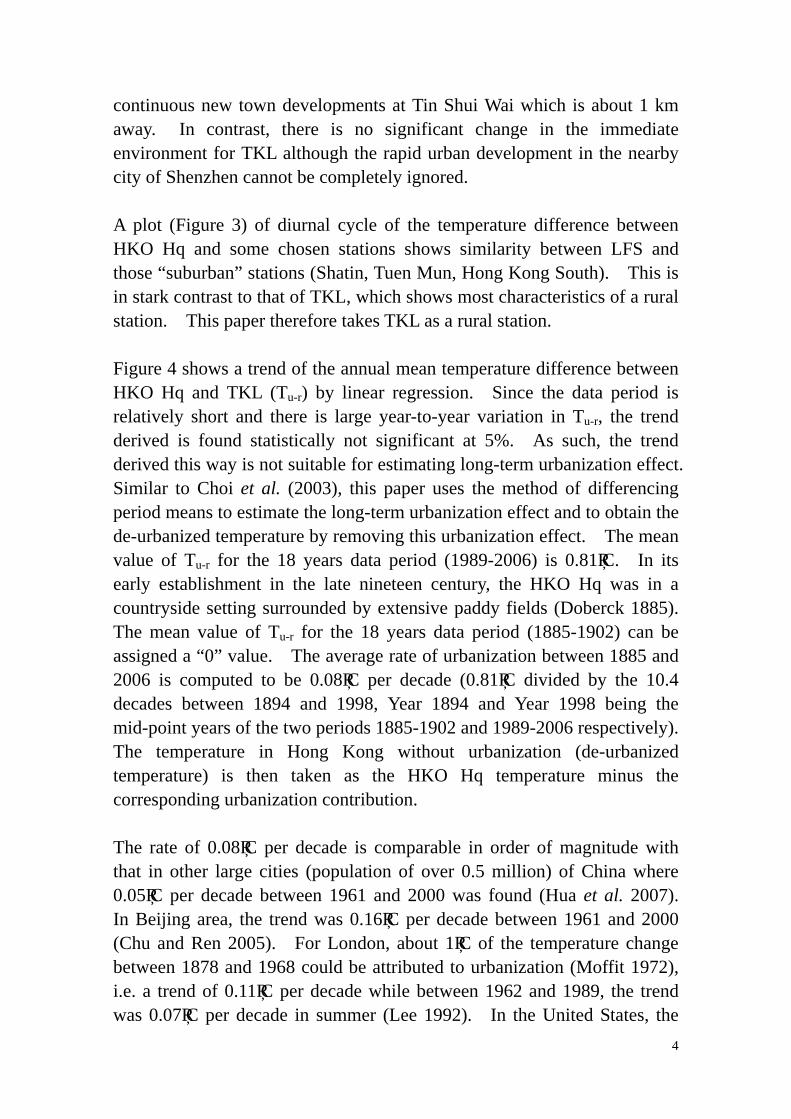
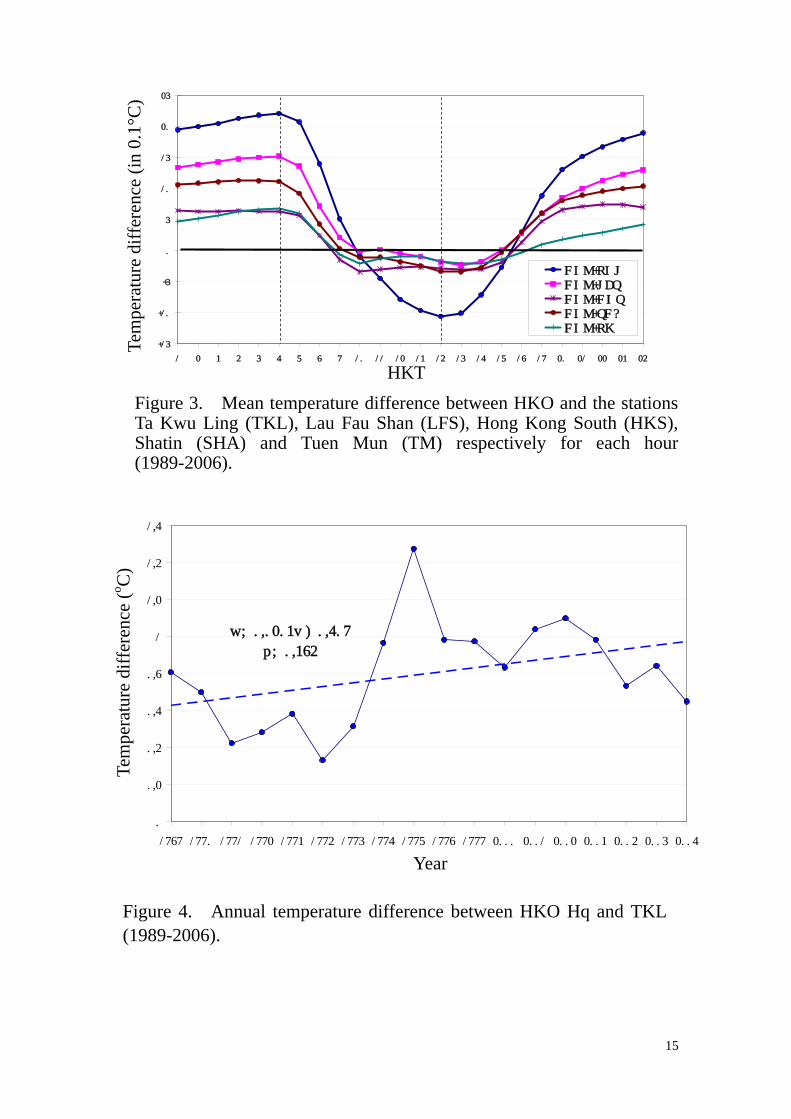
continuous new town developments at Tin Shui Wai which is about 1 km away. In contrast, there is no significant change in the immediate environment for TKL although the rapid urban development in the nearby city of Shenzhen cannot be completely ignored. A plot (Figure 3) of diurnal cycle of the temperature difference between HKO Hq and some chosen stations shows similarity between LFS and those “suburban” stations (Shatin, Tuen Mun, Hong Kong South). This is in stark contrast to that of TKL, which shows most characteristics of a rural station. This paper therefore takes TKL as a rural station. Figure 4 shows a trend of the annual mean temperature difference between HKO Hq and TKL (Tu-r) by linear regression. Since the data period is relatively short and there is large year-to-year variation in Tu-r, the trend derived is found statistically not significant at 5%. As such, the trend derived this way is not suitable for estimating long-term urbanization effect. Similar to Choi et al. (2003), this paper uses the method of differencing period means to estimate the long-term urbanization effect and to obtain the de-urbanized temperature by removing this urbanization effect. The mean value of Tu-r for the 18 years data period (1989-2006) is 0.81°C. In its early establishment in the late nineteen century, the HKO Hq was in a countryside setting surrounded by extensive paddy fields (Doberck 1885). The mean value of Tu-r for the 18 years data period (1885-1902) can be assigned a “0” value. The average rate of urbanization between 1885 and 2006 is computed to be 0.08°C per decade (0.81°C divided by the 10.4 decades between 1894 and 1998, Year 1894 and Year 1998 being the mid-point years of the two periods 1885-1902 and 1989-2006 respectively). The temperature in Hong Kong without urbanization (de-urbanized temperature) is then taken as the HKO Hq temperature minus the corresponding urbanization contribution. The rate of 0.08°C per decade is comparable in order of magnitude with that in other large cities (population of over 0.5 million) of China where 0.05°C per decade between 1961 and 2000 was found (Hua et al. 2007). In Beijing area, the trend was 0.16°C per decade between 1961 and 2000 (Chu and Ren 2005). For London, about 1°C of the temperature change between 1878 and 1968 could be attributed to urbanization (Moffit 1972), i.e. a trend of 0.11°C per decade while between 1962 and 1989, the trend was 0.07°C per decade in summer (Lee 1992). In the United States, the
5
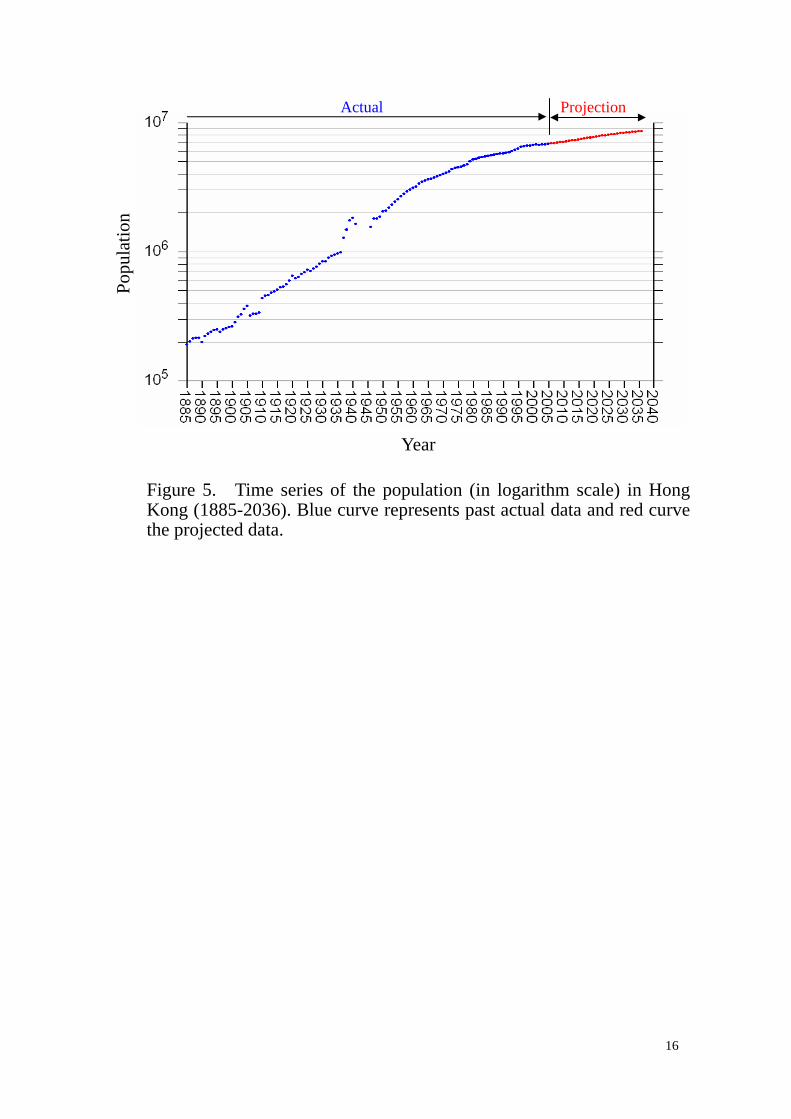
mean trend for 50 large metropolitan areas between 1951 and 2000 was 0.05°C per decade (Stone 2007). The above describes our first attempt at quantifying the long-term urbanization effect on air temperature in Hong Kong. Further refinements might follow on the basis of further studies on air temperature. Regression between temperature anomalies (with reference to the mean temperature of 1980-1999, period also chosen by IPCC AR4 for computation of climatological normal) in southern China and Hong Kong is carried out from the NCEP re-analysis data and de-urbanized HKO Hq data for the past 55 years from 1951 to 2006. The projected temperature data for southern China derived from the IPCC AR4 global model data are then fed into the regression relationship to get the temperature projections in Hong Kong without urbanization effect. 2.2.3 Projections on urbanization effect In the lack of information on the future change to the end of the century in urban planning, land use, population etc. that will have an influence on temperature, this study makes use of two assumptions for the future urbanization projections: (i) constant rate of change of urbanization as mentioned in paragraph 6 of Section 2.2.2, and (ii) urbanization frozen at 2006, the time of the latest available data when this assessment is made. Since the urbanization effect will unlikely go up forever, the former provides the upper bound while the latter the lower bound for the urbanization effect on temperature in the future. The actual future urbanization effect may lie within these boundaries. This is consistent with the future population trend as discussed below. A plot of the logarithm of the population (Figure 5, data from Census and Statistics Department, and also Planning Department) from 1885 to 2006 with prediction extending to 2036 shows a rather linear trend up to 1980s. The rate of change gradually decreases thereafter and is projected to remain so into the future. Empirically, some researcher (e.g., Karl et al. 1988) suggested that Tu-r may be linearly correlated with the logarithm of the population. If this is the case, Tu-r will exhibit a generally linear trend in the past and its rate of change gradually decreases in the future similar to
6
the logarithm of the population. 2.2.4 Temperature projections incorporating urbanization effect The urbanization effect mentioned in Section 2.2.3 is added to the temperature projections without urbanization effect in Section 2.2.2 to give the final temperature projections in Hong Kong. 2.2.5 Scaling for other 3 SRES scenarios As mentioned in Section 2.1, only gridded model data from the three SRES scenarios B1, A1B and A2 are available. Following Carter et al. (2000), scaling method is used to estimate the temperature projections in 2090-2099 for the other three SRES scenarios A1T, B2 and A1FI. In essence, the method assumes that the ratio in regional temperature projections under two different emission scenarios is equal to their global temperature projections ratio. To find the temperature anomaly in Hong Kong under A1FI, we apply the formula:
Temperature anomaly in Hong Kong under A1FI : Temperature anomaly in Hong Kong under A2 = Global temperature anomaly under A1FI : Global temperature anomaly under A2.
The reason to use A2 rather than B1 or A1B to scale A1FI is that the carbon dioxide emission profile for A1FI is closer to A2 than B1 or A1B (see Figure 1). Similarly, B1 is used to scale both A1T and B2. For 2090-2099, the global temperature anomalies under all the six SRES scenarios are available from IPCC AR4 final report, and hence the temperature anomalies in Hong Kong under the three scenarios A1T, B2 and A1FI can be computed. To indicate somehow the degree of accuracy of the above scaling methodology, we can use A1B or B1 to scale A2 and then compare the scaling results with the results obtained by downscaling. The carbon dioxide emission profile for A2 is closer to A1B than B1 (see Figure 1). In the case of using A1B to scale A2, the mean temperature anomaly for A2
7
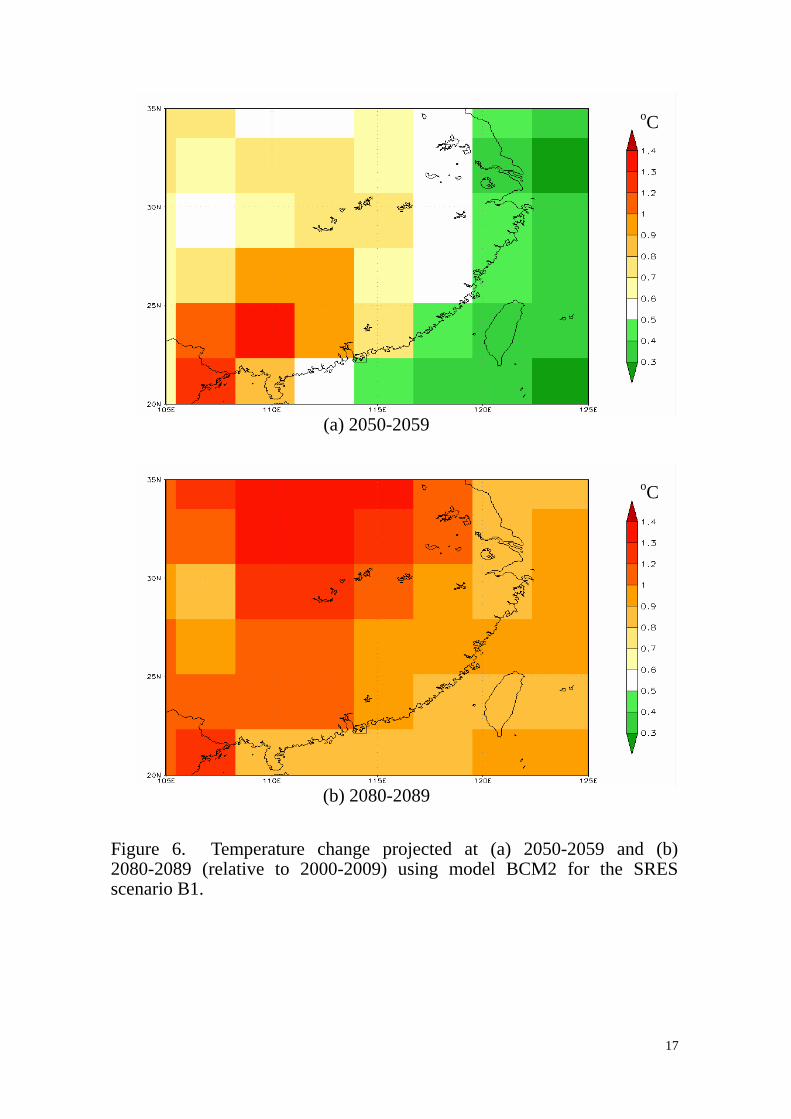
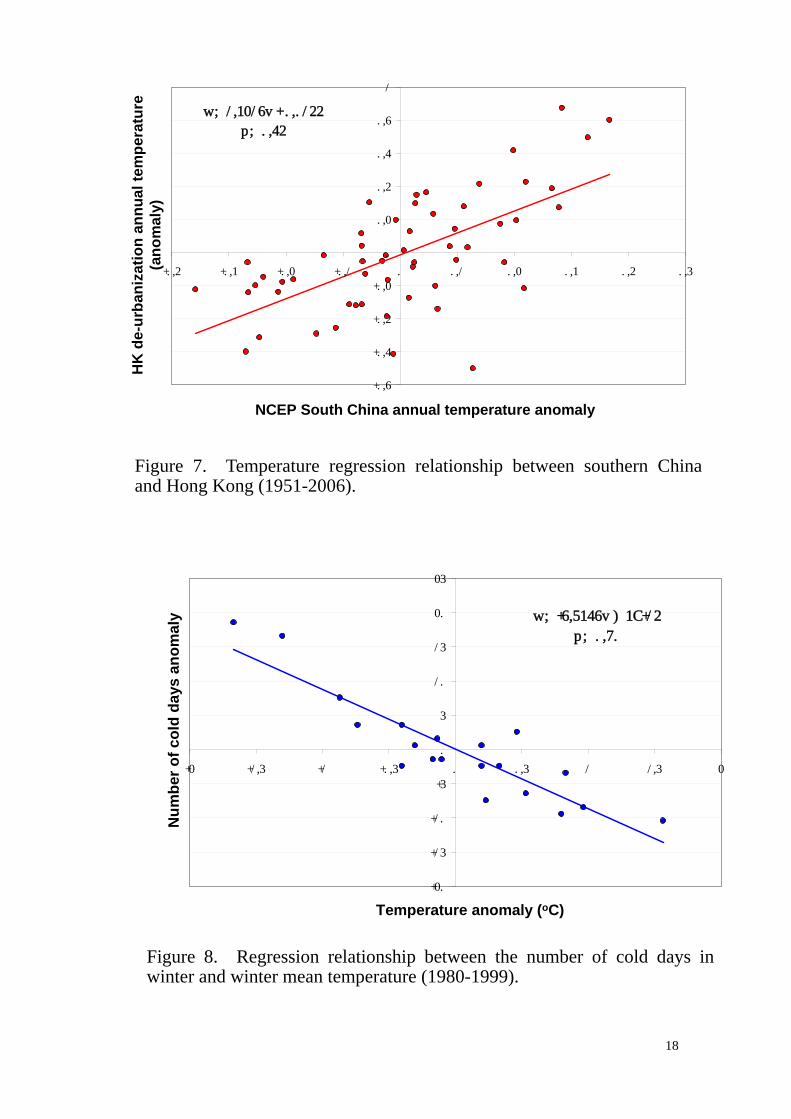
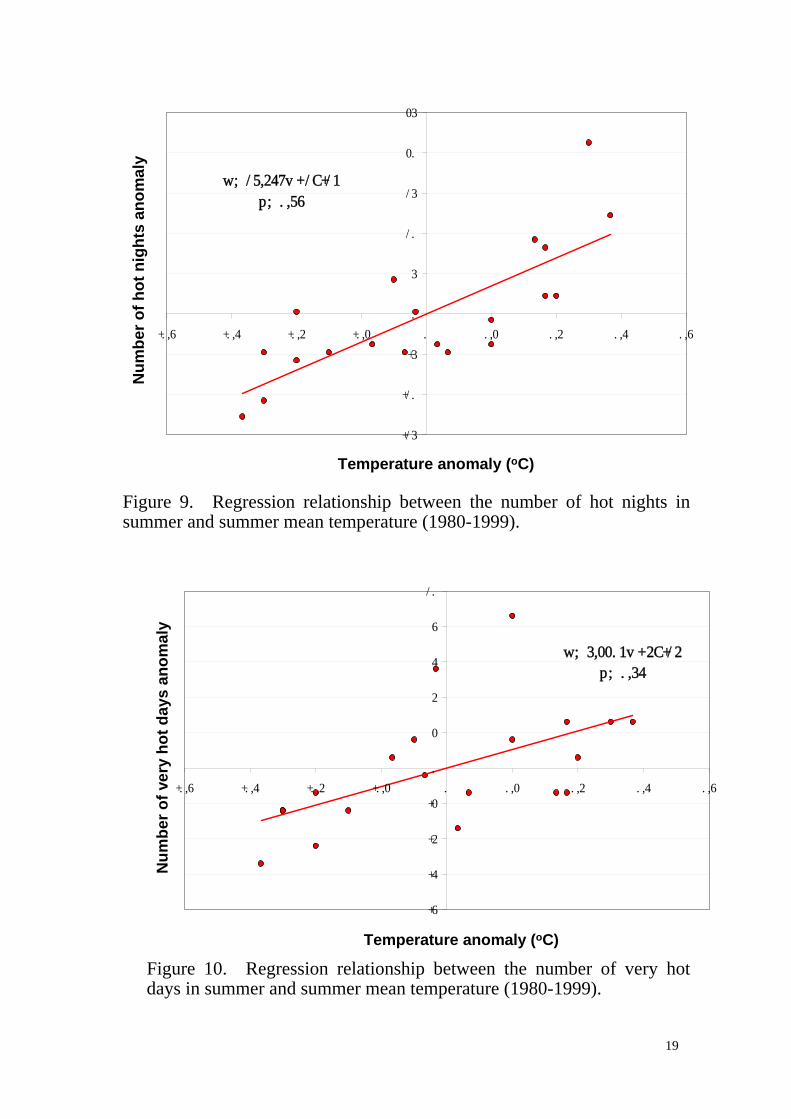
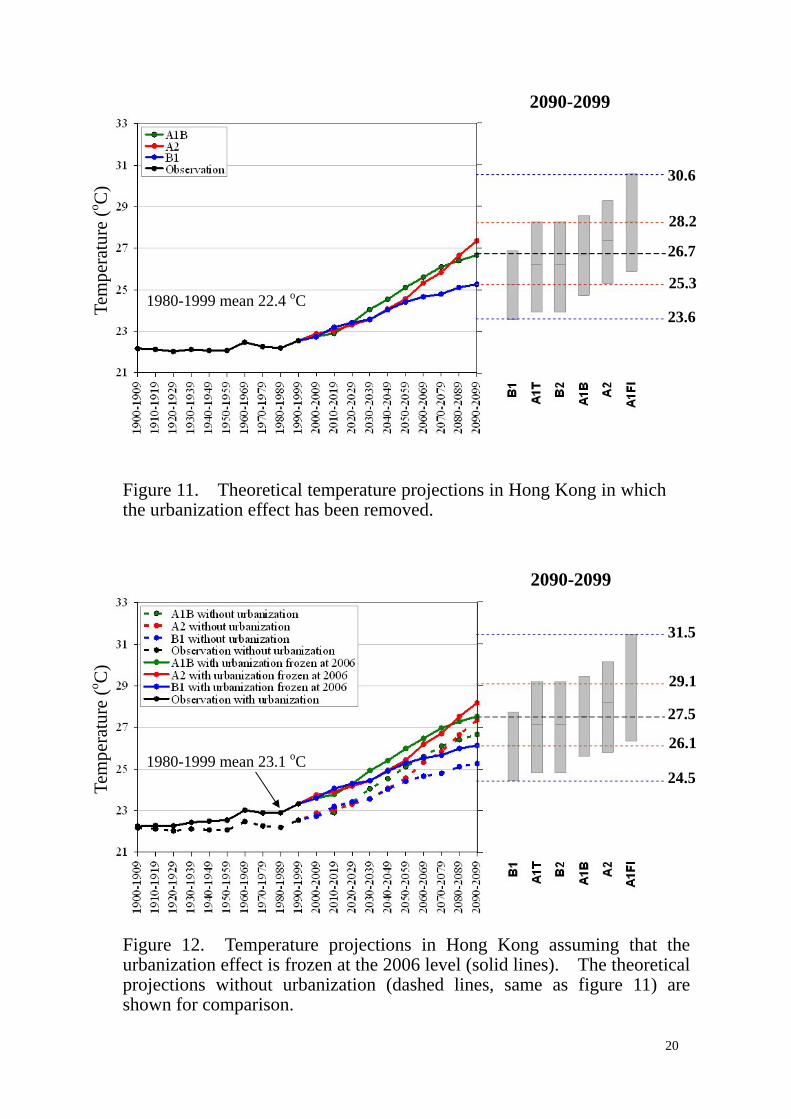
in 2090-2099 is 6.21°C, 7.8% higher than the 5.76°C obtained from downscaling. This deviation of 7.8% is smaller than the 21.7% when B1 is used to scale A2. 2.2.6 Projections of cold days, hot nights and very hot days In Leung et al. (2004a), the projected number of cold days in winter, hot nights and very hot days in summer are based on the regression relationships in the past between these parameters and the minimum/maximum temperature at HKO Hq respectively. Since gridded projected minimum and maximum temperature data in most models used in AR4 are not available (see Section 2.1), mean temperature data are used instead for generating the regression relationships. 3. Results Figure 6 shows as an example the projected temperature change for southern China in the model BCM2 under the SRES scenario B1 for 2050-2059 and 2080-2089 (relative to 2000-2009). Temperatures are on a rising trend in southern China. Figure 7 to 10 show respectively the scatter diagrams of temperature regression relationship between southern China and Hong Kong, and the parameters in Section 2.2.6 with temperature at HKO Hq. The correlation coefficients are all statistically significant at 5%. The correlation coefficients between the mean temperature and the number of cold days in winter, hot nights and very hot days in summer are 0.90, 0.78 and 0.56 respectively. Comparing with the correlation coefficients using maximum and minimum temperatures with the number of cold days in winter, hot nights and very hot days in summer, i.e. 0.90, 0.83 and 0.65 respectively, the present assessment have roughly the same or slightly lower correlation. The theoretical temperature projections in Hong Kong in which the urbanization effect has been removed are given in Figure 11. In the figure, the decadal mean temperature of the model ensemble under the scenarios B1, A1B and A2 are shown respectively. For 2090-2099, the model ensemble means as well as the range under each of the 6 scenarios are also given. The results of temperature projections incorporating two scenarios of urbanization viz. (a) urbanization frozen at 2006 and (b) constant
8
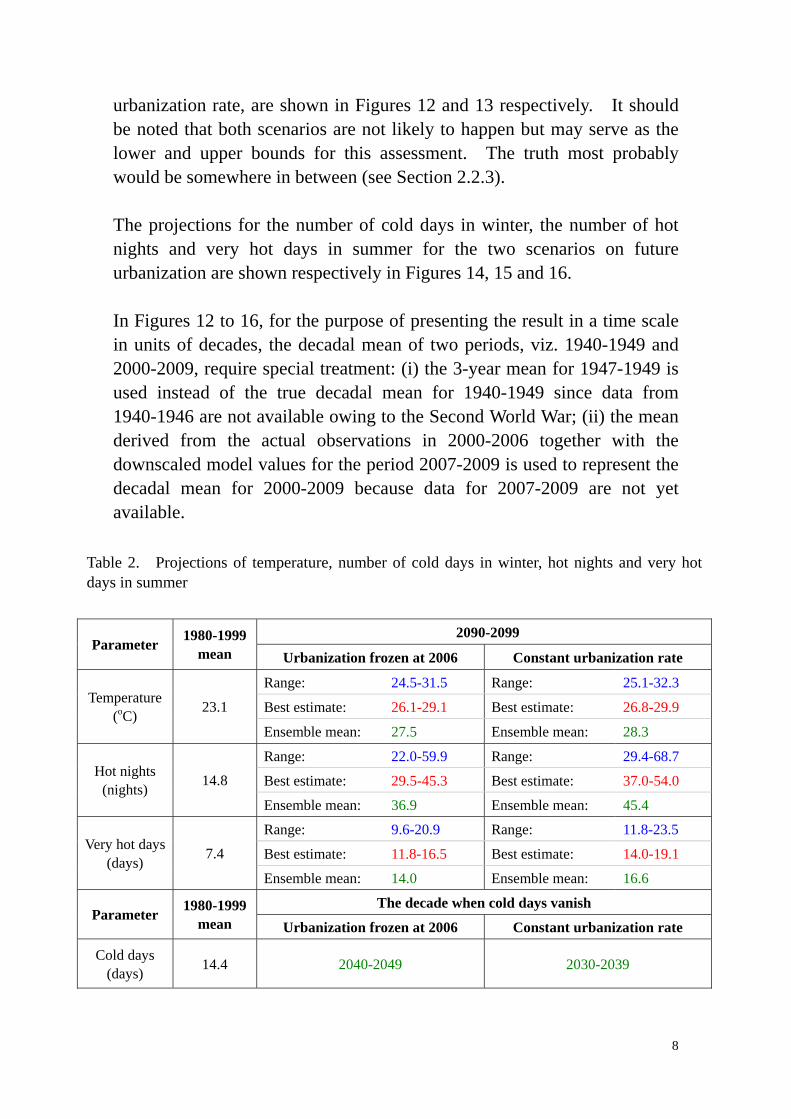
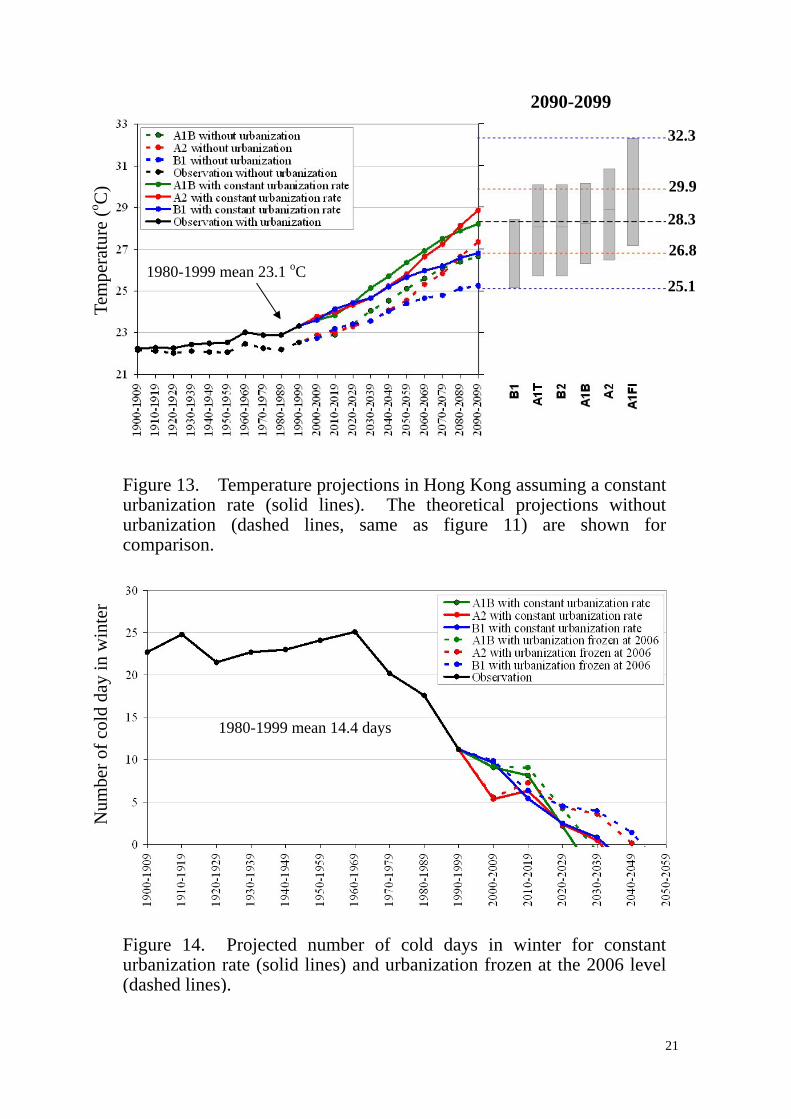
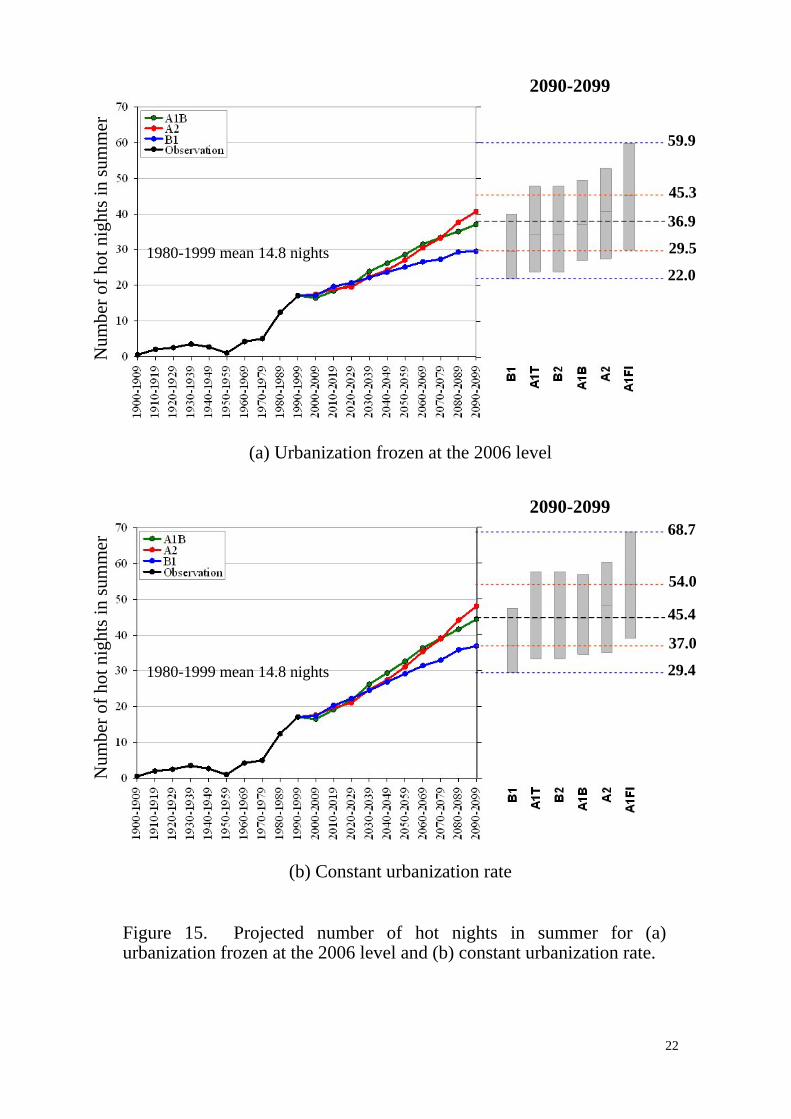
urbanization rate, are shown in Figures 12 and 13 respectively. It should be noted that both scenarios are not likely to happen but may serve as the lower and upper bounds for this assessment. The truth most probably would be somewhere in between (see Section 2.2.3). The projections for the number of cold days in winter, the number of hot nights and very hot days in summer for the two scenarios on future urbanization are shown respectively in Figures 14, 15 and 16. In Figures 12 to 16, for the purpose of presenting the result in a time scale in units of decades, the decadal mean of two periods, viz. 1940-1949 and 2000-2009, require special treatment: (i) the 3-year mean for 1947-1949 is used instead of the true decadal mean for 1940-1949 since data from 1940-1946 are not available owing to the Second World War; (ii) the mean derived from the actual observations in 2000-2006 together with the downscaled model values for the period 2007-2009 is used to represent the decadal mean for 2000-2009 because data for 2007-2009 are not yet available.
2090-2099 Parameter 1980-1999
mean Urbanization frozen at 2006 Constant urbanization rate
Range: 24.5-31.5 Range: 25.1-32.3
Best estimate: 26.1-29.1 Best estimate: 26.8-29.9 Temperature (oC) 23.1
Ensemble mean: 27.5 Ensemble mean: 28.3
Range: 22.0-59.9 Range: 29.4-68.7
Best estimate: 29.5-45.3 Best estimate: 37.0-54.0 Hot nights
(nights) 14.8
Ensemble mean: 36.9 Ensemble mean: 45.4
Range: 9.6-20.9 Range: 11.8-23.5
Best estimate: 11.8-16.5 Best estimate: 14.0-19.1 Very hot days
(days) 7.4
Ensemble mean: 14.0 Ensemble mean: 16.6
The decade when cold days vanish Parameter 1980-1999
mean Urbanization frozen at 2006 Constant urbanization rate
Cold days (days) 14.4 2040-2049 2030-2039
Table 2. Projections of temperature, number of cold days in winter, hot nights and very hot days in summer
9
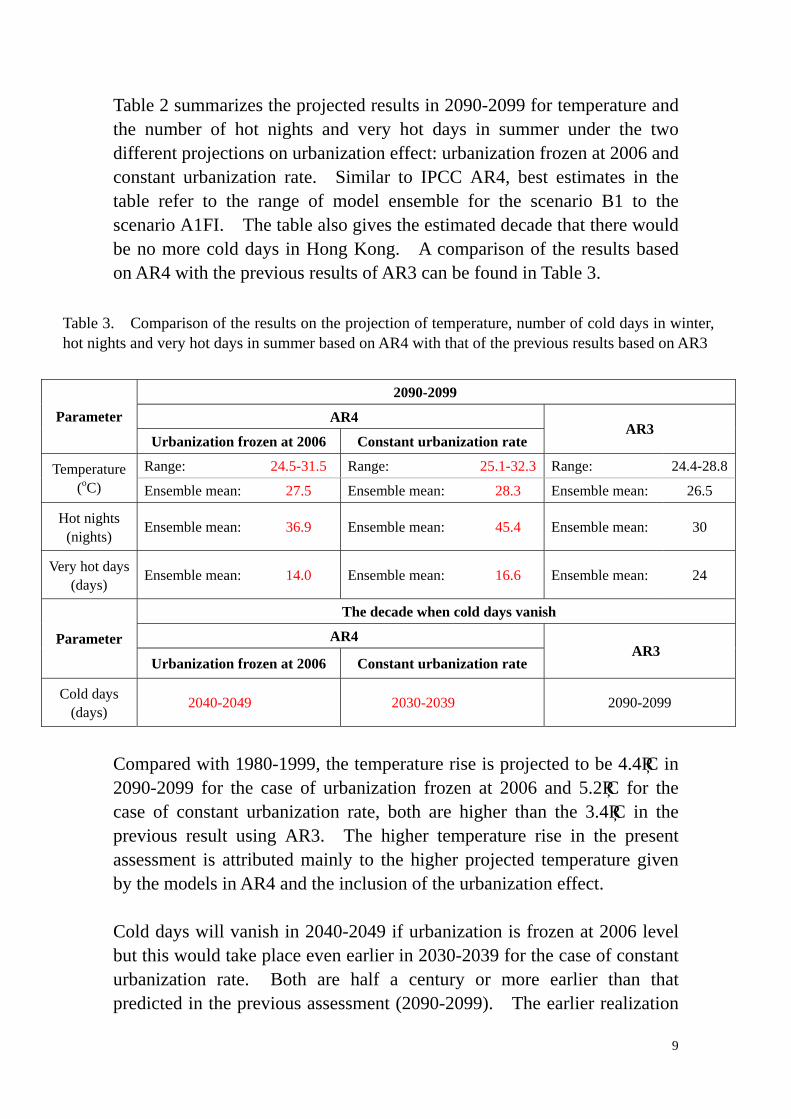
Table 2 summarizes the projected results in 2090-2099 for temperature and the number of hot nights and very hot days in summer under the two different projections on urbanization effect: urbanization frozen at 2006 and constant urbanization rate. Similar to IPCC AR4, best estimates in the table refer to the range of model ensemble for the scenario B1 to the scenario A1FI. The table also gives the estimated decade that there would be no more cold days in Hong Kong. A comparison of the results based on AR4 with the previous results of AR3 can be found in Table 3.
2090-2099
AR4 Parameter
Urbanization frozen at 2006 Constant urbanization rate AR3
Range: 24.5-31.5 Range: 25.1-32.3 Range: 24.4-28.8Temperature (oC) Ensemble mean: 27.5 Ensemble mean: 28.3 Ensemble mean: 26.5
Hot nights (nights)
Ensemble mean: 36.9 Ensemble mean: 45.4 Ensemble mean: 30
Very hot days (days)
Ensemble mean: 14.0 Ensemble mean: 16.6 Ensemble mean: 24
The decade when cold days vanish
AR4 Parameter
Urbanization frozen at 2006 Constant urbanization rate AR3
Cold days (days)
2040-2049 2030-2039 2090-2099
Compared with 1980-1999, the temperature rise is projected to be 4.4°C in 2090-2099 for the case of urbanization frozen at 2006 and 5.2°C for the case of constant urbanization rate, both are higher than the 3.4°C in the previous result using AR3. The higher temperature rise in the present assessment is attributed mainly to the higher projected temperature given by the models in AR4 and the inclusion of the urbanization effect. Cold days will vanish in 2040-2049 if urbanization is frozen at 2006 level but this would take place even earlier in 2030-2039 for the case of constant urbanization rate. Both are half a century or more earlier than that predicted in the previous assessment (2090-2099). The earlier realization
Table 3. Comparison of the results on the projection of temperature, number of cold days in winter, hot nights and very hot days in summer based on AR4 with that of the previous results based on AR3
10
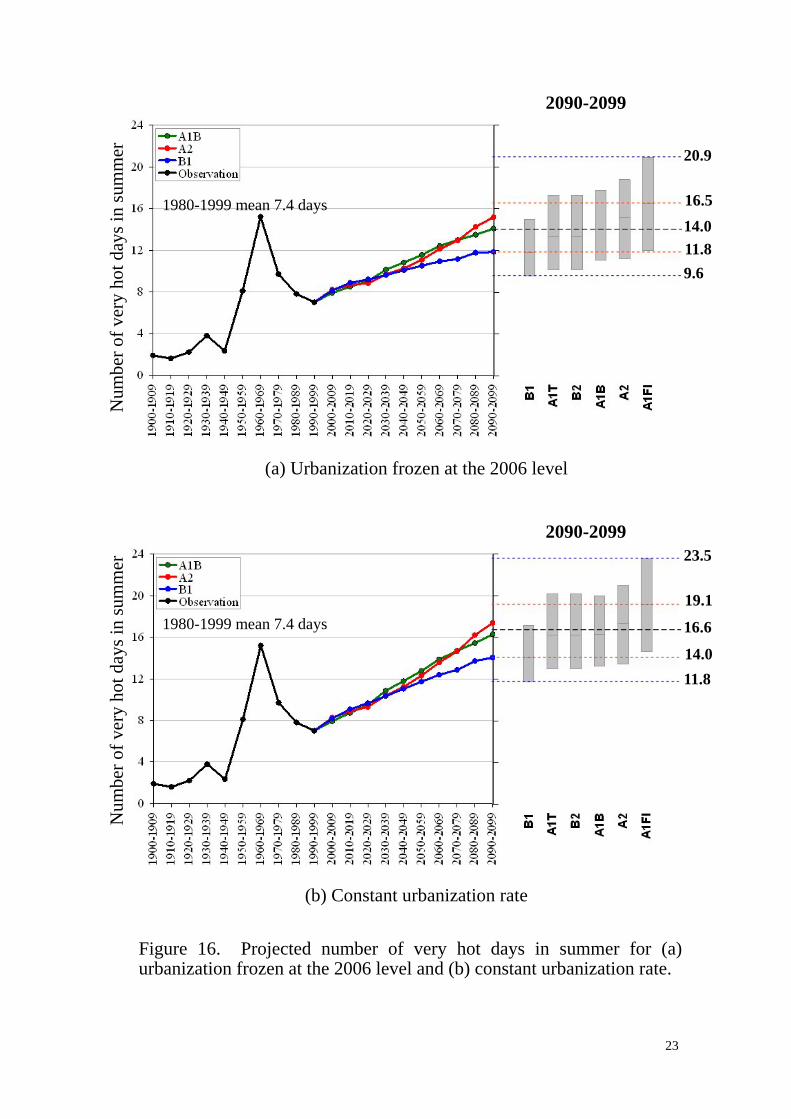
of “no cold days” in the present assessment compared with the previous one is consistent with the higher projected temperature. The number of hot nights per summer is projected to increase from 15 nights in 1980-1999 to 37 nights and 45 nights respectively in 2090-2099 for the case of urbanization frozen at 2006 and constant urbanization rate. In both cases, the number of hot nights in 2090-2099 is higher than 30 nights predicted in the previous assessment. The present assessment also predicts that there would be 30 hot nights per summer by 2070-2079 if urbanization is frozen at 2006; and by 2050-2059 if constant urbanization rate is assumed. Both are decades earlier than that predicted in the previous assessment (2090-2099). Again such predictions are consistent with the higher projected temperature. The number of very hot days per summer is projected to increase from 7 in 1980-1999 to 14 and 17 respectively in 2090-2099 for the case of urbanization frozen at 2006 and constant urbanization rate. In both cases, the number of very hot days in 2090-2099 is lower than 24, the value predicted in the previous assessment. The projected number of very hot days is computed as the projected anomaly obtained from regression equation plus the number of very hot days in the reference period. The relatively smaller number of very hot days (i.e. 7) in the reference period 1980-1999 in the present assessment compared with 12 in the 1961-1990 used in the previous assessment contributed to the smaller projected number of very hot days. 4. Conclusion Temperature projections for the 21st Century for Hong Kong by downscaling the global climate model projections of the Intergovernmental Panel on Climate Change (IPCC) Fourth Assessment Report were made. With respect to the 1980-1999 climatological mean, Hong Kong temperature is projected to rise by 4.4°C in 2090-2099 for the case of urbanization frozen at 2006 and 5.2°C for the case of constant urbanization rate, both are higher than the 3.4°C in the previous result based on the projections made in the IPCC Third Assessment Report. Cold days will vanish in 2040-2049 if urbanization is frozen at 2006 level but this would take place even earlier in 2030-2039 for the case of constant
11
urbanization rate. The number of hot nights per summer is projected to increase from 15 nights in 1980-1999 to 37 nights and 45 nights respectively in 2090-2099 for the case of urbanization frozen at 2006 and constant urbanization rate. The present assessment also predicts that there would be 30 hot nights per summer by 2070-2079 if urbanization is frozen at 2006; and by 2050-2059 if constant urbanization rate is assumed. The number of very hot days per summer is projected to increase from 7 in 1980-1999 to 14 and 17 respectively in 2090-2099 for the case of urbanization frozen at 2006 and constant urbanization rate. Acknowledgement The authors would like to thank colleagues of the Hong Kong Observatory Ms. Y.Y. Cheng and Mr. Y.H. Lau for their assistance in data extraction and compilation, and to Mr. C.Y. Lam for his invaluable advice.
12
4. References Benestad, R., 2001: A comparison between two empirical downscaling strategies. International Journal on Climatology, 21, 1645-1668. Carter, T.R., M. Hulme, J.F. Crossley, S. Malyshev, M.G. New, M.E. Schlesinger, and H. Tuomenvirta, 2000: Climate Change in the 21st Century - Interim Characterizations based on the New IPCC Emissions Scenarios. The Finnish Environment, 433, Finnish Environment Institute, Helsinki. 148 pp. Choi, Y., H-S Jung, K-Y Nam and W.T. Kwon, 2003: Adjusting urban bias in the regional mean surface temperature series of South Korea, 1968-99. International Journal on Climatology, 23, 577-591. Chu, Z. and G. Ren, 2005: Change in urban heat island magnitude and its effect on mean air temperature record in Beijing region. ACTA Meteorologica Sinica, 63(4), 534-540 (In Chinese). Doberck, W, 1885: Annual Departmental Report. Observations and researches made at the Hong Kong Observatory in the year 1885. Hong Kong Observatory. Guangdong Meteorological Bureau, 2007: Guangdong Assessment Report of Climate Change. 27 pp (In Chinese). Hua, L. J., Z. G. Ma and W.D. Guo, 2007: The impact of urbanization on air temperature across China. Theoretical and Applied Climatology, DOI 10.1007/s00704-007-0339-8. IPCC, 2001: Climate Change 2001: The Science of Climate Change. Contribution of the Working Group I to the Third Assessment Report of the Intergovernmental Panel on Climate Change [Houghton, J.T., Y. Ding, D.J. Griggs, M. Noguer, P.J. van der Linden, X. Dai, K. Maskell, C.A. Johnson (eds.)]. Cambridge University Press, Cambridge, United Kingdom and New York, NY, USA, 881 pp. IPCC, 2007: Climate Change 2007: The Physical Science Basis. Contribution of the Working Group I to the Fourth Assessment Report of the Intergovernmental Panel on Climate Change [Solomon, S., D. Qin, M. Manning, Z. Chen, M. Marquis, K.B. Averyt, M. Tignor and H.L. Miller (eds.)]. Cambridge University Press, Cambridge, United Kingdom and New York, NY, USA, 996 pp.
13
Kalnay, E., and Coauthors, 1996: The NCEP/NCAR 40-year reanalysis project. Bulletin of American Meteorological Society, 77, 437-471. Kalnay, E., and M. Cai, 2003: Impact of urbanization and land-use change on climate. Nature, 423, 528-531. Karl, T.R., H.F. Diaz and G. Kukla, 1998: Urbanization: Its detection and effect in the United States climate record. Journal of Climate, November 1988 Volume 1, 1099-1123. Lee, D.O., 1992: Urban warming? – An analysis of recent trends in London’s urban heat island. Weather, 47, 50-56. Leung, Y.K., E.W.L. Ginn, M.C. Wu, K.H. Yeung and W.L. Chang, 2004a: Temperature projections for Hong Kong in the 21st Century. Bulletin of Hong Kong Meteorological Society, 4, No.1/2, 21-48. Leung, Y.K., K.H. Yeung, E.W.L. Ginn and W.M. Leung, 2004b: Climate Change in Hong Kong. Hong Kong Observatory Technical Note, 107, 41pp. Moffit, B.J., 1972: The effects of urbanisation on mean temperatures at Kew Observatory. Weather, 27, 121-129. Murphy, J.M., 1999: An evaluation of statistical and dynamical techniques for downscaling local climate. Journal of Climate, 12, 2256-2284. Sakakibara, Y. and K. Owa, 2005: Urban – rural temperature differences in coastal cities: Influence of rural sites. International Journal of Climatology, 25, 811-820. Stone, B. Jr., 2007: Urban and rural temperature trends in proximity to large US cities: 1951-2000. International Journal of Climatology, 27(13), 1801-1807. Wilby, R.L., S.P. Charles, E. Zorita, B. Timbal, P. Whetton and L.Mearns, 2005: Guidelines for use of climate scenarios developed from statistical downscaling methods. 27pp. Zhou, L., R.E. Dickinson, Y. Tian, J. Fang, Q. Li, R.K. Kaufmann, C.J. Tucker, and R.B. Myneni, 2004: Evidence for a significant urbanization effect on Climate in China. Proceedings of the National Academy of Sciences, 101, 9540-9544.
14
Figure 1. Projections of carbon dioxide emission under the six SRES emission scenarios. The inset reflects the various assumptions made on the future population, economy, technology, energy and land use patterns of the world (source from IPCC).
Figure 2. Schematic diagram showing the methodology for temperature projections.
15
Figure 3. Mean temperature difference between HKO and the stations Ta Kwu Ling (TKL), Lau Fau Shan (LFS), Hong Kong South (HKS), Shatin (SHA) and Tuen Mun (TM) respectively for each hour(1989-2006).
Figure 4. Annual temperature difference between HKO Hq and TKL (1989-2006).
y = 0.0203x + 0.609
r = 0.384
0
0.2
0.4
0.6
0.8
1
1.2
1.4
1.6
1989 1990 1991 1992 1993 1994 1995 1996 1997 1998 1999 2000 2001 2002 2003 2004 2005 2006
Year
Tem
pera
ture
diff
eren
ce (o C
)
-15
-10
-5
0
5
10
15
20
25
1 2 3 4 5 6 7 8 9 10 11 12 13 14 15 16 17 18 19 20 21 22 23 24
HKO-TKLHKO-LFSHKO-HKSHKO-SHAHKO-TM
HKT
Tem
pera
ture
diff
eren
ce (i
n 0.
1°C
)
16
Figure 5. Time series of the population (in logarithm scale) in Hong Kong (1885-2036). Blue curve represents past actual data and red curve the projected data.
Year
Popu
latio
n Projection Actual
17
Figure 6. Temperature change projected at (a) 2050-2059 and (b) 2080-2089 (relative to 2000-2009) using model BCM2 for the SRES scenario B1.
(b) 2080-2089
(a) 2050-2059
oC
oC
18
y = 1.3218x - 0.0144
r = 0.64
-0.8
-0.6
-0.4
-0.2
0
0.2
0.4
0.6
0.8
1
-0.4 -0.3 -0.2 -0.1 0 0.1 0.2 0.3 0.4 0.5
NCEP South China annual temperature anomaly
HK
de-
urba
niza
tion
annu
al te
mpe
ratu
re
(ano
mal
y)
y = -8.7368x + 3E-14
r = 0.90
-20
-15
-10
-5
0
5
10
15
20
25
-2 -1.5 -1 -0.5 0 0.5 1 1.5 2
Temperature anomaly (oC)
Num
ber o
f col
d da
ys a
nom
aly
Figure 7. Temperature regression relationship between southern China and Hong Kong (1951-2006).
Figure 8. Regression relationship between the number of cold days in winter and winter mean temperature (1980-1999).
19
y = 5.2203x - 4E-14
r = 0.56
-8
-6
-4
-2
0
2
4
6
8
10
-0.8 -0.6 -0.4 -0.2 0 0.2 0.4 0.6 0.8
Num
ber o
f ver
y ho
t day
s an
omal
y
Temperature anomaly (oC)
y = 17.469x - 1E-13
r = 0.78
-15
-10
-5
0
5
10
15
20
25
-0.8 -0.6 -0.4 -0.2 0 0.2 0.4 0.6 0.8
Num
ber o
f hot
nig
hts
anom
aly
Temperature anomaly (oC)
Figure 10. Regression relationship between the number of very hot days in summer and summer mean temperature (1980-1999).
Figure 9. Regression relationship between the number of hot nights in summer and summer mean temperature (1980-1999).
20
30.6
28.2
26.7
25.3
23.6
2090-2099
Figure 11. Theoretical temperature projections in Hong Kong in which the urbanization effect has been removed.
Tem
pera
ture
(o C)
1980-1999 mean 22.4 oC
Figure 12. Temperature projections in Hong Kong assuming that the urbanization effect is frozen at the 2006 level (solid lines). The theoretical projections without urbanization (dashed lines, same as figure 11) are shown for comparison.
1980-1999 mean 23.1 oC
Tem
pera
ture
(o C)
31.5
29.1
27.5
26.1
24.5
2090-2099
21
Figure 13. Temperature projections in Hong Kong assuming a constant urbanization rate (solid lines). The theoretical projections without urbanization (dashed lines, same as figure 11) are shown for comparison.
Figure 14. Projected number of cold days in winter for constant urbanization rate (solid lines) and urbanization frozen at the 2006 level (dashed lines).
Num
ber o
f col
d da
y in
win
ter
1980-1999 mean 14.4 days
Tem
pera
ture
(o C)
1980-1999 mean 23.1 oC
32.3
29.9
28.3
26.8
25.1
2090-2099
22
Num
ber o
f hot
nig
hts i
n su
mm
er
1980-1999 mean 14.8 nights
59.9
45.3
36.9
29.5
22.0
2090-2099
Figure 15. Projected number of hot nights in summer for (a) urbanization frozen at the 2006 level and (b) constant urbanization rate.
Num
ber o
f hot
nig
hts i
n su
mm
er
1980-1999 mean 14.8 nights
68.7
54.0
45.4
37.0
29.4
2090-2099
(a) Urbanization frozen at the 2006 level
(b) Constant urbanization rate
23
N
umbe
r of v
ery
hot d
ays i
n su
mm
er
1980-1999 mean 7.4 days
20.9
16.5 14.0 11.8 9.6
2090-2099
Figure 16. Projected number of very hot days in summer for (a) urbanization frozen at the 2006 level and (b) constant urbanization rate.
Num
ber o
f ver
y ho
t day
s in
sum
mer
1980-1999 mean 7.4 days
23.5
19.1
16.6
14.0 11.8
2090-2099
(a) Urbanization frozen at the 2006 level
(b) Constant urbanization rate