template brochure 10.16
TRANSCRIPT
Visit www.dataoptimize.com/excel‐financial‐modeling‐templates for more details or to order your own templates.
Excel Financial Modeling Templates
DataOptimize has developed a large and growing library of high‐end financial modeling templates. These 60‐
month templates (also automatically summarized into 5 years) are designed with ease of integration in mind and
are now available at a price that is a fraction of the value of the time it would take to create them yourself.
Our templates are far more granular and therefore a lot more accurate than the many free ones you’ll find on the
Internet. They also facilitate auto balancing where this is a requirement (e.g. balance sheet, cash flow statement,
deferred revenue reconciliation), plus they’re designed to seamlessly integrate with one another.
Best of all, they represent the ultimate in plug and play. Literally copy and paste the entire tab into your own
model, link the input cells (all with instructions) to your source data and you're done. They are all fully tried and
tested with companies of all sizes across multiple industries and can all be acquired stand‐alone or bundled.
Templates currently available include:
‐ Self‐balancing, integrated Balance Sheet, Income Statement and Cash Flow Statement, with simplified
data input tab. ($9)
‐ Accounts Receivable calculator (With look‐back function that precisely calculates AR based on estimated
days' sales outstanding, using actual month‐by‐month sales data and not averages. Cost $7)
‐ Accounts Payable calculator (With look‐back function that precisely calculates AP based on days' COS,
overheads and capex outstanding per month on the same basis as described above. Cost $7)
‐ Inventory calculator (with look‐forward function that precisely calculates inventory based on estimated
days of inventory required to support projected cost of sales, using actual month‐by‐month forward COS
data and not averages. Cost $7)
‐ Working Capital bundle (Accounts Receivable, Payable and Inventory bundled into a single template. Cost
$15)
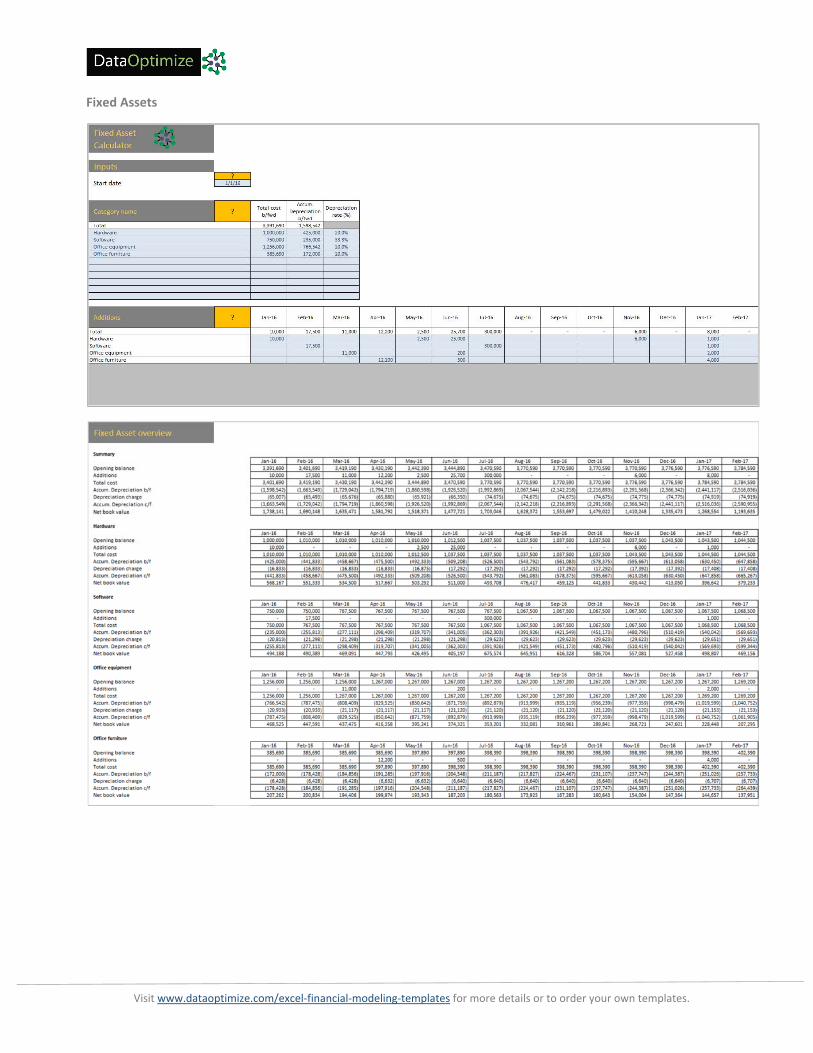
‐ Fixed asset calculator (Complete month‐by‐month table including opening cost, additions/disposals,
depreciation calculation Cost $9$and net book value for up to 10 asset categories, plus a summary. It also
has a built in function to prevent over‐depreciation, a not uncommon problem with other simplistic
models. Cost $7)
DataOptimize modular templates can be used independently or combined as part of an
integrated solution.
Pick the pieces you need and integrate with ease into your own purpose‐specific model.
One‐size‐fits‐all templates do not work. Period
No two businesses are alike and cramming a square peg into a round hole is never a good
solution.
Visit www.dataoptimize.com/excel‐financial‐modeling‐templates for more details or to order your own templates.
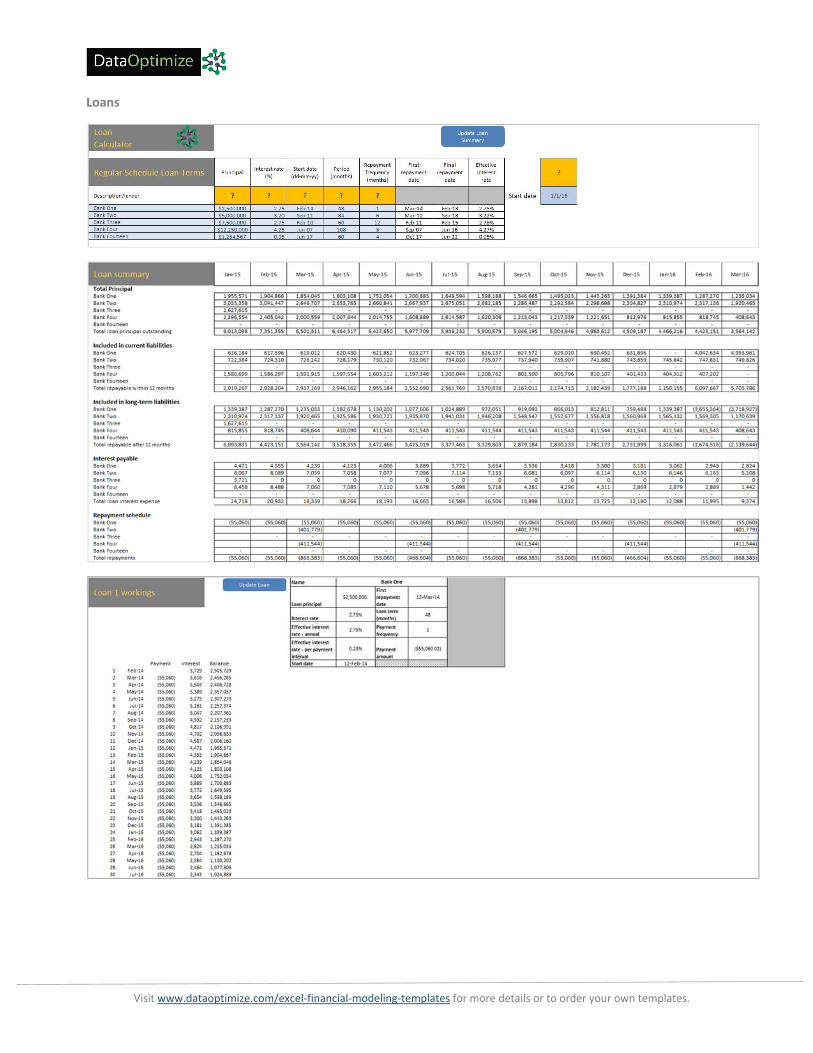
‐ Loan calculator (For up to 5 mortgage type loans with fixed repayment terms, regardless of payment
intervals. Includes a comprehensive summary that includes details of loan amortization, interest charge
and automated allocation between long and short term liabilities. Cost $7)
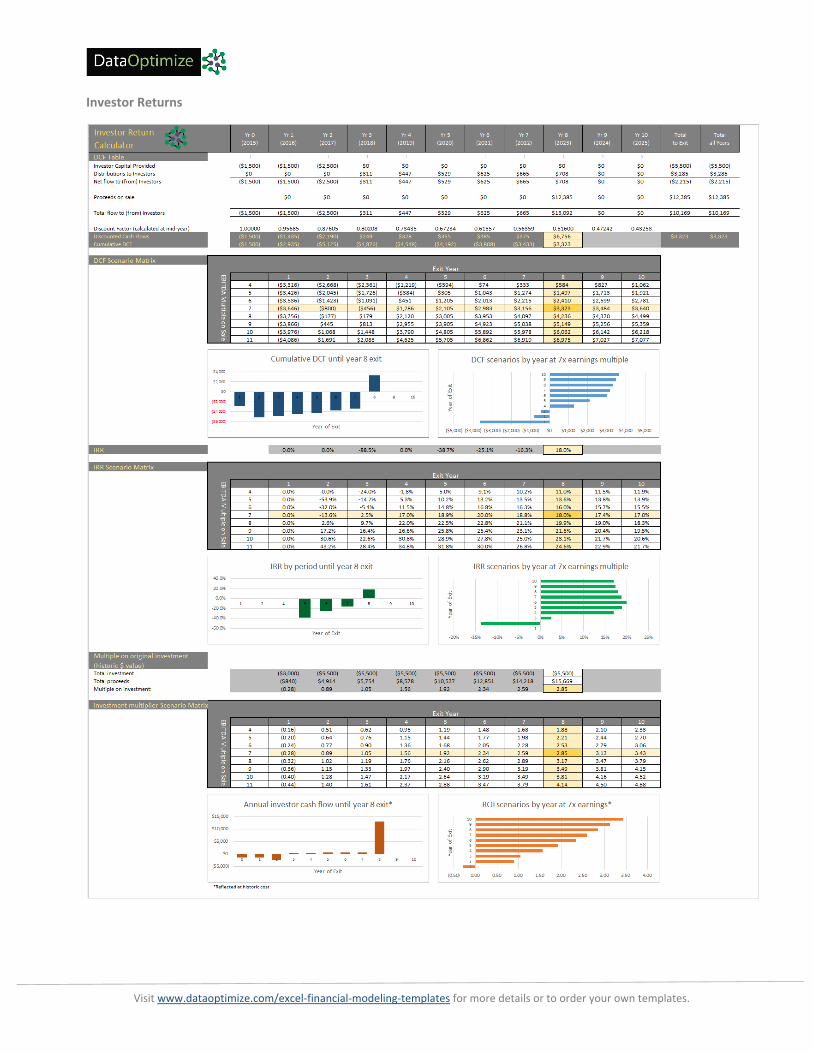
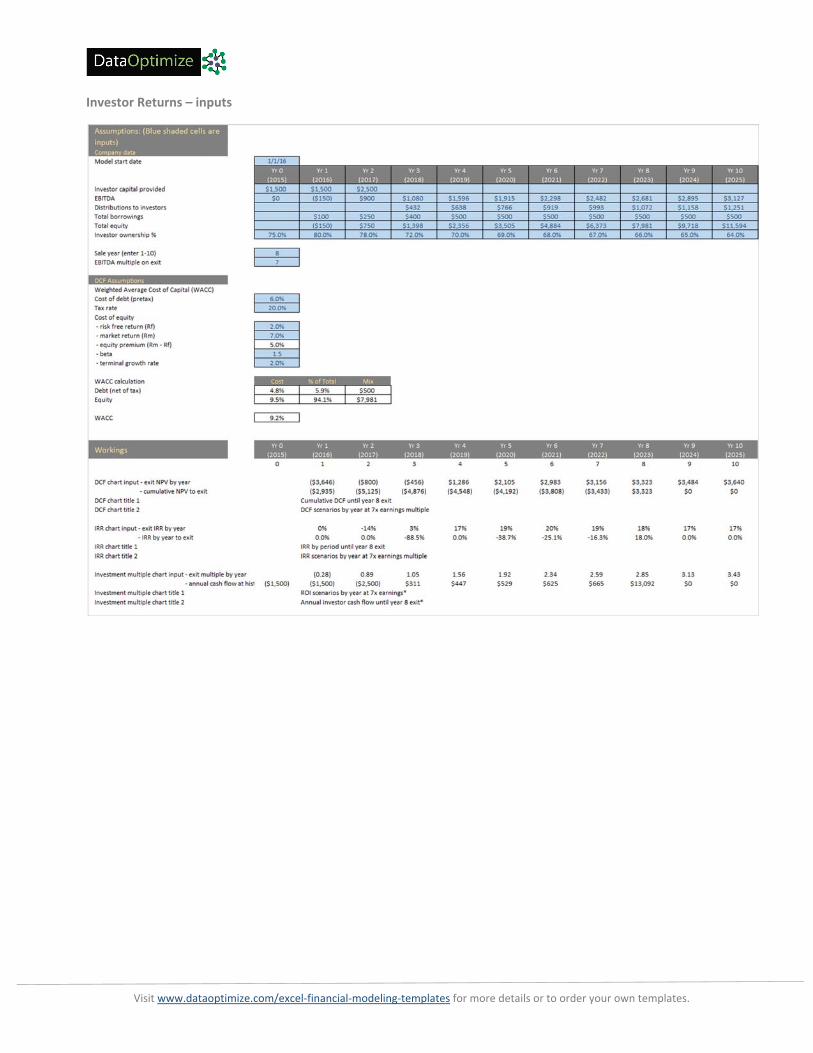
‐ Investor Return calculator (Facilitates measurement of Discounted Cash Flow; Internal Rate of Return
(IRR); and Multiple on Original Investment over a 10‐year timeframe. Includes comprehensive "what if"
capability, multi‐scenario data tables and powerful visualization. Return on investment is an often
forgotten, but critical part of any presentation to investors and this template will provide answers to all of
the key questions that investors will have regarding the timing and value of their returns. Cost $15)
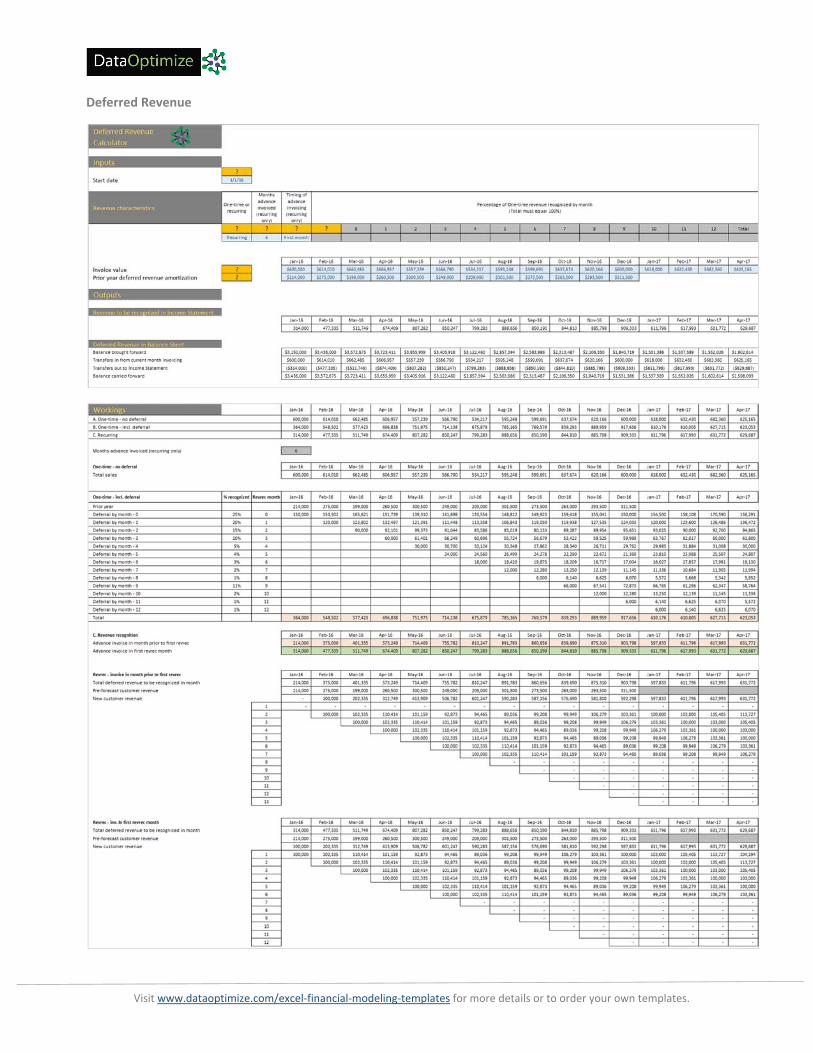
‐ Deferred revenue calculator (Comprehensive revenue recognition model, including Balance Sheet
reconciliation, for all the most common deferred revenue use cases. This one will save you days, not
hours! Cost $12)
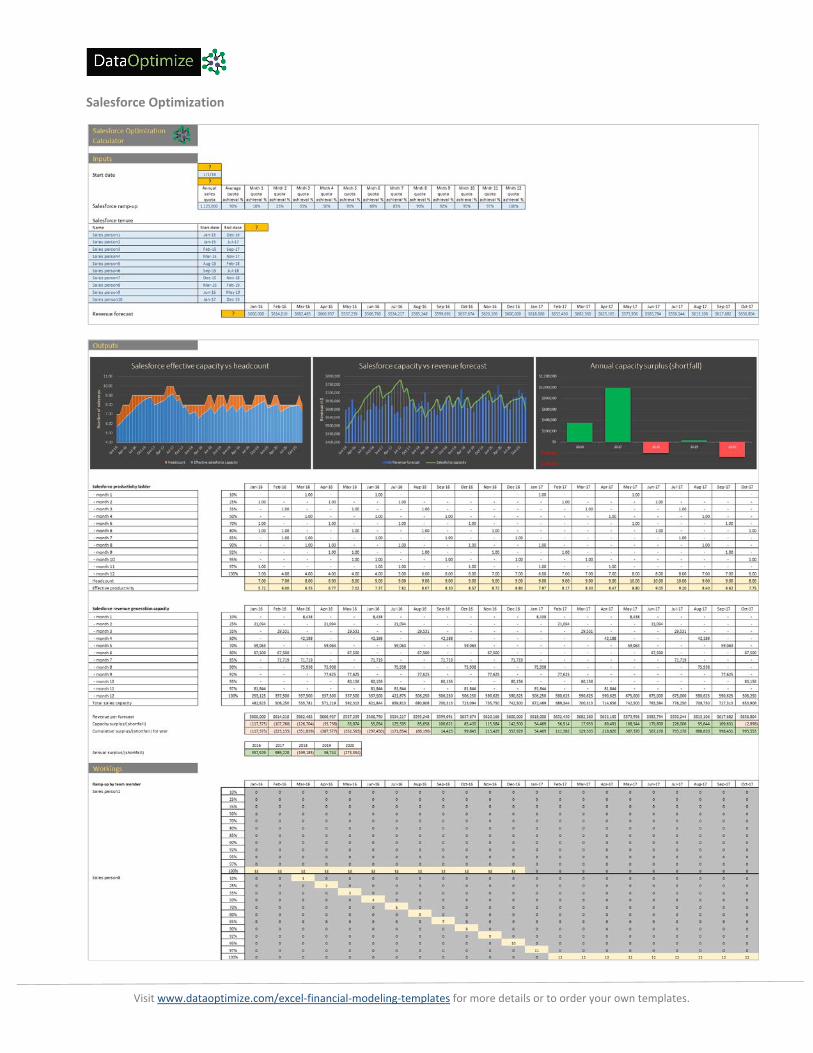
‐ Salesforce optimization model (Compares forecast revenue with sales team’s delivery capacity, based on
defined sales quotas, quota achievement percentage and new salesperson’s ramp up time and
percentage quota achievement by month. Cost $12)
‐ Bundled package with all templates above fully integrated and linked. (Cost $59)
These are just a start, with more to follow shortly.
Please contact us for more details at [email protected] or go directly to
www.dataoptimize.com.
Payment is via PayPal only.
If you are not completely satisfied with your purchase within 7 days, we will refund your
purchase price in full.
Visit www.dataoptimize.com/excel‐financial‐modeling‐templates for more details or to order your own templates.
Below are some of the most pervasive problems with Excel models, every one of which is addressed by our
templates.
1. Cause: Reinventing the wheel every time you create a new model. Effect: Disproportionate waste of
preparer’s time; Inconsistent use of formulas; flawed logic; accidental errors, all resulting in a higher risk
of model error and incorrect outcomes.
2. Cause: Spending too much time with preparation and not enough on analysis of results. Effect: You
prepared what you believe to be a great model, but you spent more time on making it work and look
good than you did on studying the results. At best you gave up an opportunity to really optimize your
outcomes and at worst you missed a fundamental error or passed over a less than obvious conclusion.
3. Cause: Looking in the wrong direction when calculating simple dependencies. For example, calculating
future inventory levels based on historic cost of sales. Effect: Inaccurate inventory and working capital
projections, with knock‐on impact on ordering/production and cash management.
4. Cause: Using averages. Effect: Seasonality, growth, or contraction are all effectively ignored; Problem
areas and outliers go unnoticed.
5. Cause: Ignoring obvious relationships. Some relationships are easily seen (albeit not well accounted for –
see #3 & 4 above), such as the one between sales and accounts receivable, or between cost of sales and
accounts payable or inventory, but what about others, such as size of the sales team (including ramp‐up
time of new sales people) in relation to sales projections? Someone in sales management may have this
covered to some extent, but if it isn’t factored into the sensitivity analysis inherent in your model, then it’s
being ignored. Effect: Projected outcomes become unachievable because of lack of proper resource
matching.
Using templates that work properly, are battle tested and that integrate with one another will help you to
overcome every one of the challenges listed above.
We have decades of experience in Data Analysis and specialize in designing and developing very complex Excel
driven solutions for multiple industry verticals. The templates that we have developed are built from this
experience.
We also design & create custom models on request.
Visit www.dataoptimize.com/excel‐financial‐modeling‐templates for more details or to order your own templates.
The images included in the gallery are abridged because of size constraints, but will give you a general idea of
what we’ve created, even though they aren't able to do justice to the depth or complexity of the workings behind
them. The attributes listed below will help to fill some of those gaps.
‐ DataOptimize templates incorporate features that provide precision and accuracy in areas that are often just
measured in terms of averages.
‐ They automate many of the tedious and time consuming aspects of financial modeling (e.g. balancing of
Balance Sheet and Cash Flow Statement, allocation of loans between current and long‐term, reconciliation of
deferred revenue and more)
‐ They are completely modular and can be integrated into your existing models, each template in a single tab,
thereby eliminating the need to link to external spreadsheets.
‐ They eliminate the risk of broken links.
‐ They free up your time to allow you to concentrate on the substance of your model and not on building
formulas.
‐ They increase confidence in your model’s construction and therefore in its conclusions too.
‐ They are built with plug and play in mind, meaning that they are easily integrated and can be re‐used over
and over again in different models.
‐ They are transparent, with every bit of logic laid out in the simplest possible manner, often aided by the
creative use of conditional formatting to make processes easier to track.
‐ They are scalable and designed for further enhancement by appropriately skilled Excel users with an
understanding of financial statements.
Visit www.dataoptimize.com/excel‐financial‐modeling‐templates for more details or to order your own templates.
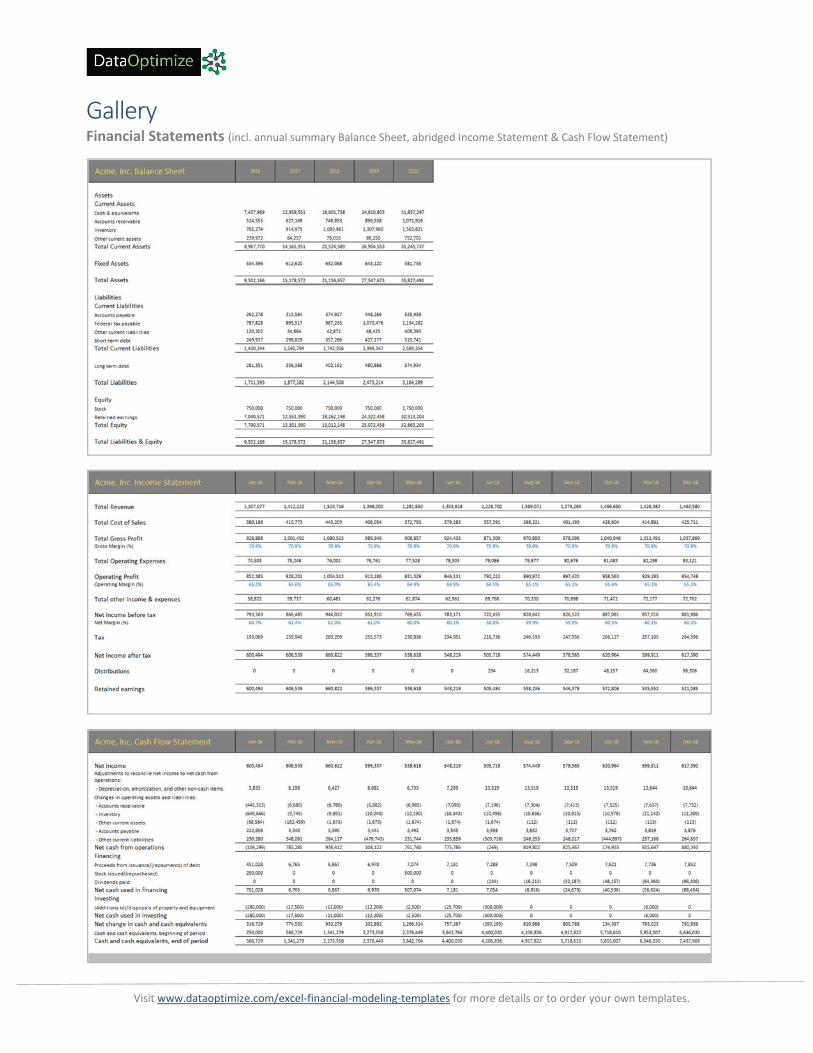
Gallery Financial Statements (incl. annual summary Balance Sheet, abridged Income Statement & Cash Flow Statement)
Visit www.dataoptimize.com/excel‐financial‐modeling‐templates for more details or to order your own templates.
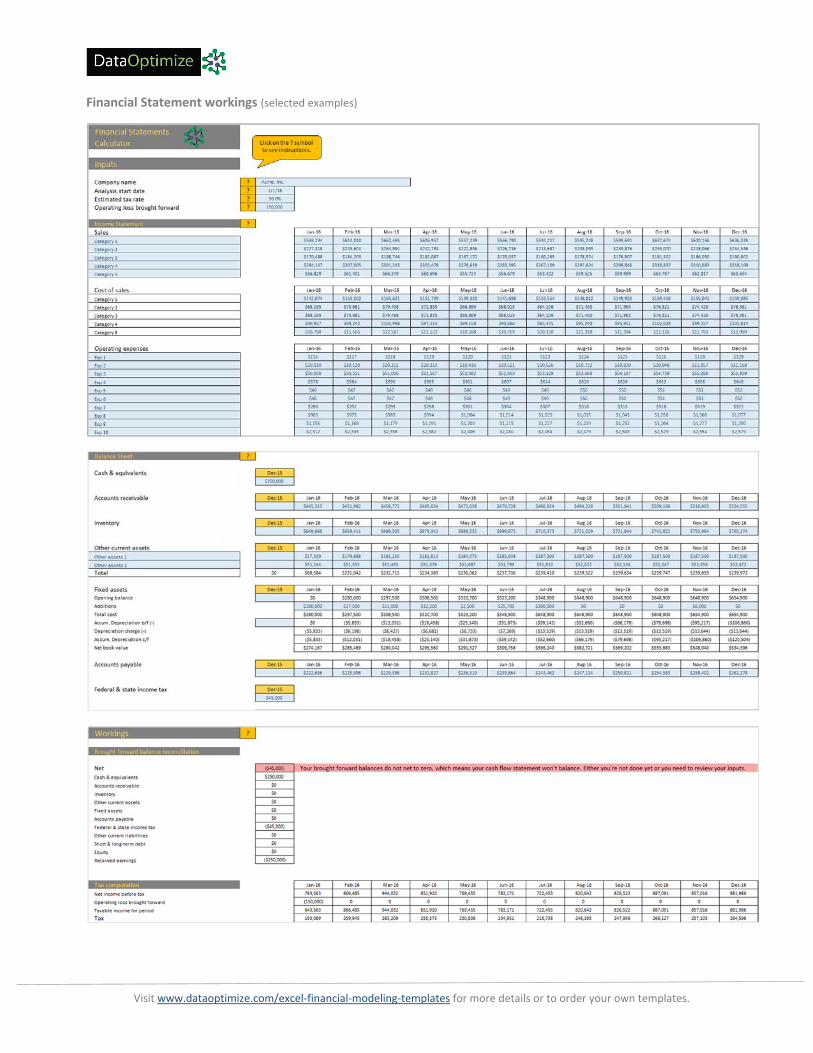
Financial Statement workings (selected examples)
Visit www.dataoptimize.com/excel‐financial‐modeling‐templates for more details or to order your own templates.
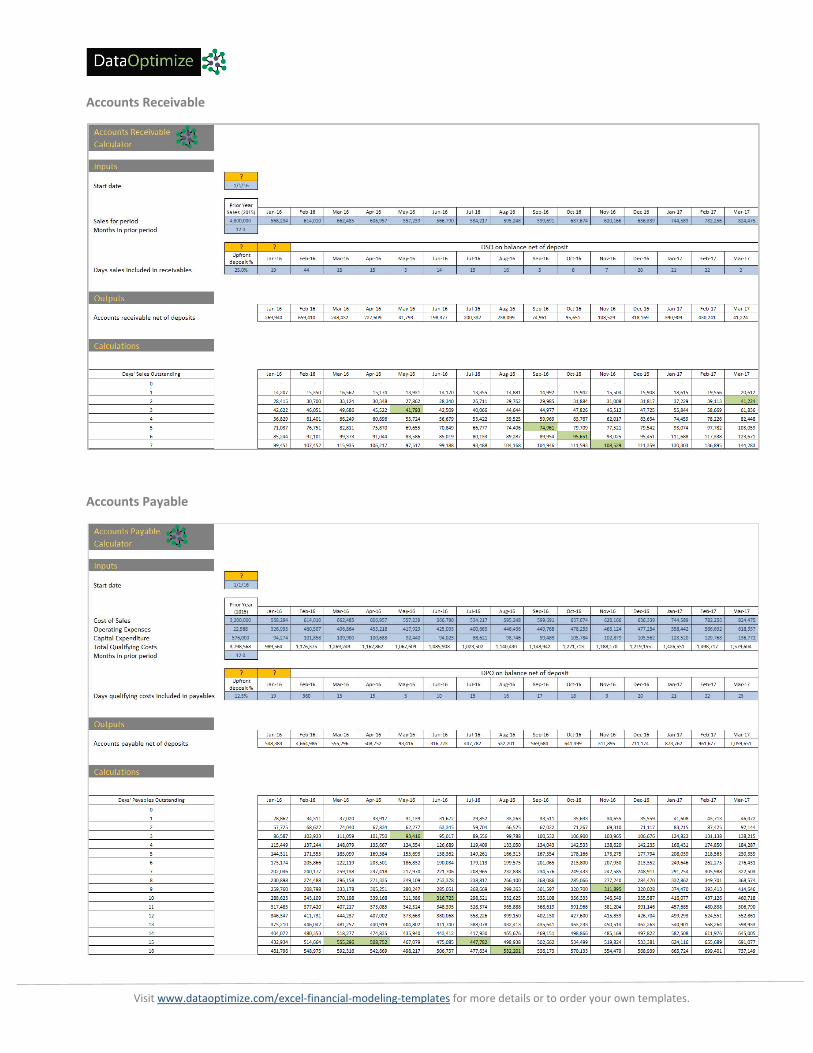
Accounts Receivable
Accounts Payable
Visit www.dataoptimize.com/excel‐financial‐modeling‐templates for more details or to order your own templates.
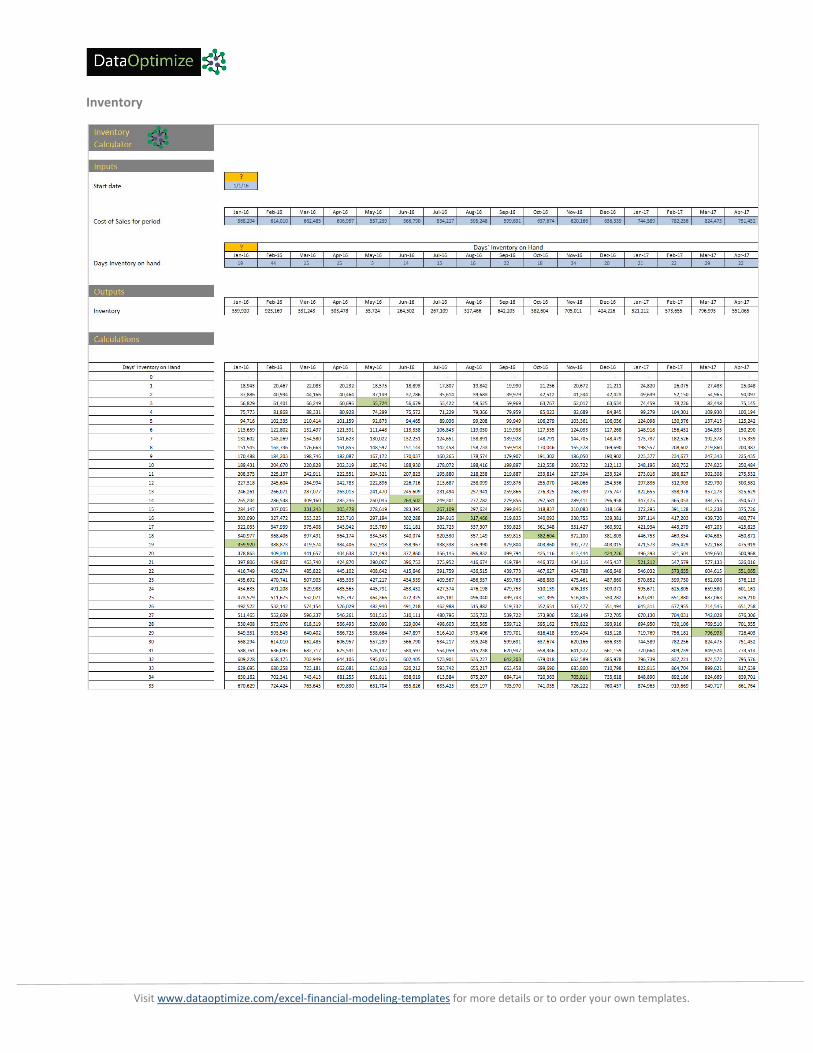
Inventory
Visit www.dataoptimize.com/excel‐financial‐modeling‐templates for more details or to order your own templates.
Fixed Assets
Visit www.dataoptimize.com/excel‐financial‐modeling‐templates for more details or to order your own templates.
Loans
Visit www.dataoptimize.com/excel‐financial‐modeling‐templates for more details or to order your own templates.
Investor Returns
Visit www.dataoptimize.com/excel‐financial‐modeling‐templates for more details or to order your own templates.
Investor Returns – inputs
Visit www.dataoptimize.com/excel‐financial‐modeling‐templates for more details or to order your own templates.
Deferred Revenue
Visit www.dataoptimize.com/excel‐financial‐modeling‐templates for more details or to order your own templates.
Salesforce Optimization