template for conceptual model construction: model review and
TRANSCRIPT

PURPOSE: This technical note reports on a review of conceptual model construction and use, and identifies how conceptual model use can be facilitated to better serve the Corps of Engineers (CE). Previously, Henderson and O’Neil (2004) described a six-step process for conceptual model development and discussed uses and applications of conceptual models in CE Planning and Operations activities. Observations that many Corps conceptual model applications had similar objectives and involved similar resources and disciplines led to a proposal for a template for conceptual model construction. The template will expedite conceptual model construction by providing users with model parameters and potential model components, building on a study team’s knowledge and experience, and promoting thought and discussion on “how this system works.” The template will be developed from work on previous models and documentation on the resources, objectives, and impacts encountered in systemwide studies. As a preliminary step for a conceptual model template, conceptual models and current Corps applications were reviewed and categorized. The findings of those reviews are presented here and are used to identify initial descriptor categories for the template. BACKGROUND: The response to water resources problems—flooding, water supply, pollution—has historically been with site-specific solutions in the form of structures, water system development, pollutant loading or water quality standards for river or stream reaches. The current scientific, technical, and political approach for water resources management requires a broader approach rather than the site-specific approach. Problems may be manifested at a particular location, but the source of the problem may be at numerous sites in upper or lower watershed locations, or be diffusely distributed over a wide area, only concentrating in the problem site location. Research, modeling, and understanding of hydrology, geomorphology, and aquatic ecology have been based on systems approaches looking at spatial relationships and dynamics for the watershed, but with less involvement or linkage to the other resources or disciplines. The site-specific response to water resource problems and the discipline focus of water resources research give rise to two circumstances for which conceptual models are ideally suited. First, conceptual models promote the linking of a site-specific phenomenon to the systemwide sources of the phenomenon. Problem manifestation is viewed as a systemwide phenomenon and conceptual models are constructed by identifying the system forces and changes that result in the site-specific problems. Conceptual models look at a target or problem condition and ask “what are the changes that resulted in this problem?” Flooding and high flows can be reduced with detention basins, instream channel improvements, and diversion structures. However, if the
ERDC TN-SWWRP-07-4August 2007
Template for Conceptual Model Construction:Model Review and Corps Applications
By Jim E. Henderson and L. Jean O’Neil

Report Documentation Page Form ApprovedOMB No. 0704-0188
Public reporting burden for the collection of information is estimated to average 1 hour per response, including the time for reviewing instructions, searching existing data sources, gathering andmaintaining the data needed, and completing and reviewing the collection of information. Send comments regarding this burden estimate or any other aspect of this collection of information,including suggestions for reducing this burden, to Washington Headquarters Services, Directorate for Information Operations and Reports, 1215 Jefferson Davis Highway, Suite 1204, ArlingtonVA 22202-4302. Respondents should be aware that notwithstanding any other provision of law, no person shall be subject to a penalty for failing to comply with a collection of information if itdoes not display a currently valid OMB control number.
1. REPORT DATE AUG 2007 2. REPORT TYPE
3. DATES COVERED 00-08-2007 to 00-08-2007
4. TITLE AND SUBTITLE Template for Conceptual Model Construction: Model Review and Corps Applications
5a. CONTRACT NUMBER
5b. GRANT NUMBER
5c. PROGRAM ELEMENT NUMBER
6. AUTHOR(S) 5d. PROJECT NUMBER
5e. TASK NUMBER
5f. WORK UNIT NUMBER
7. PERFORMING ORGANIZATION NAME(S) AND ADDRESS(ES) Engineer Research and Development Center,3909 Halls Ferry Road,Vicksburg,MS,39180-6199
8. PERFORMING ORGANIZATIONREPORT NUMBER
9. SPONSORING/MONITORING AGENCY NAME(S) AND ADDRESS(ES) 10. SPONSOR/MONITOR’S ACRONYM(S)
11. SPONSOR/MONITOR’S REPORT NUMBER(S)
12. DISTRIBUTION/AVAILABILITY STATEMENT Approved for public release; distribution unlimited
13. SUPPLEMENTARY NOTES
14. ABSTRACT
15. SUBJECT TERMS
16. SECURITY CLASSIFICATION OF: 17. LIMITATION OF ABSTRACT Same as
Report (SAR)
18. NUMBEROF PAGES
21
19a. NAME OFRESPONSIBLE PERSON
a. REPORT unclassified
b. ABSTRACT unclassified
c. THIS PAGE unclassified
Standard Form 298 (Rev. 8-98) Prescribed by ANSI Std Z39-18

ERDC TN-SWWRP-07-4 August 2007
2
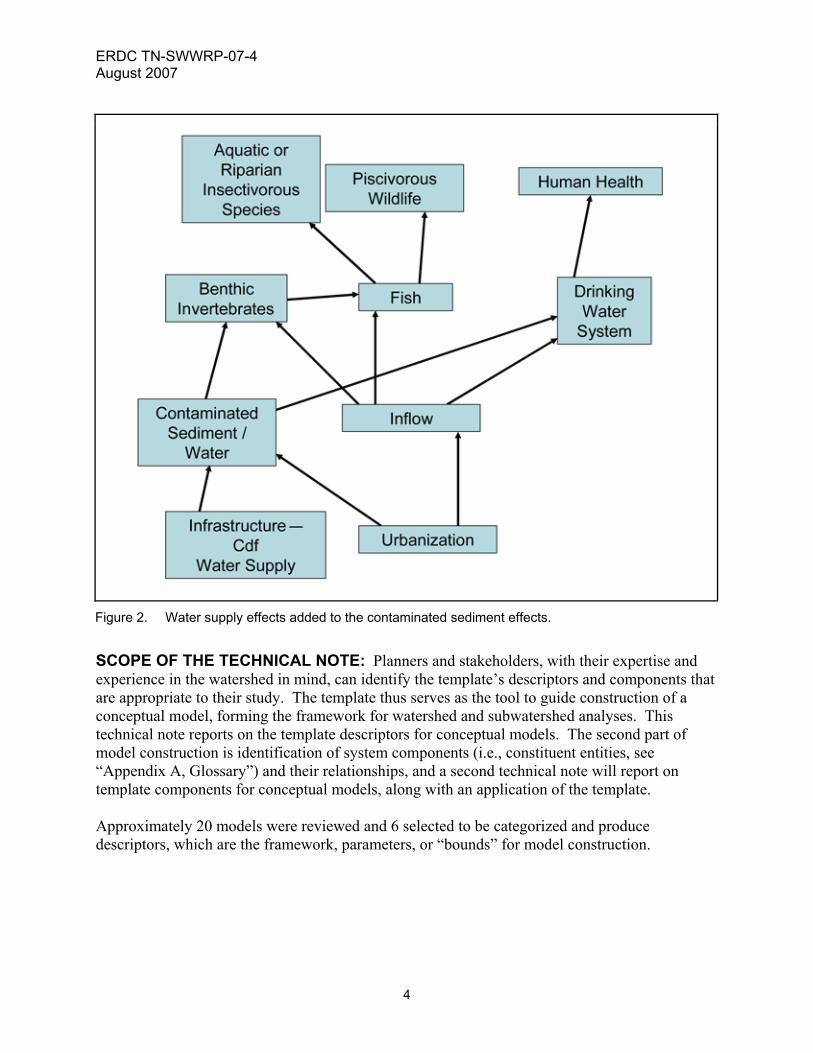
flooding is caused by increased runoff and nutrient flows due to land use changes in the upper tributaries—residential development, forest clear cutting—then the site-specific solutions address only a part of the system’s resource management needs, and may fail to solve the system’s problems. Second, a watershed or ecosystem study may be the first time the models and data are used together to address the system questions. Systemwide management requires integration of resources, disciplines, or components to produce publicly desired flows of goods and services. Conceptual models explicate the identification and sequencing or dependencies of energy, materials, and information required for the goods and services. Determining the ecological viability of establishment of a plant community can involve understanding the linkages among waterflow, sediment movement, nutrient flow, and biotic responses, all in the same watershed, but possibly modeled separately. Conceptual models ask “what materials and forces caused this result to occur,” and “how strong are the relationships between the system processes and components.” This helps to force integration of multiple disciplines. Research into the water resource systems that the Corps has responsibilities for has produced a great deal of knowledge and numerous models, and identified some data gaps for which conceptual models provide a vehicle to implement the watershed approach. Comparing conceptual models developed for different water resource applications identifies similarities and differences that can be used to construct a template. Commonalities in basic uses and content and differences in level of detail, scale, and hierarchical or trophic level focus are expected. The template is intended to guide development of conceptual models by suggesting important model descriptors and components, not to replace technical discussions or consensus. These circumstances are illustrated in Figures 1 and 2. A breach in a dike at a confined disposal facility (CDF) results in uncontrolled discharge from contaminated sediments. This causes degradation of fish and wildlife by the pathways shown in Figure 1 (adapted from U.S. Army Engineer District, New England 2005). Planning for stream restoration seems straightforward. If this watershed is undergoing urbanization with loss of riparian vegetation and increased runoff, the problems become more complicated and the solutions less clear (Figure 2). Increased runoffs may resuspend the contaminated sediments and flush benthic invertebrates, moving them downstream into the area of water supply intakes. Restoration started with biologists and contaminated sediment experts, dealing with a site-specific sediment contamination issue, but characterization of the problem has expanded to include water quality and water supply issues, with the associated stakeholders (affected publics, institutional agencies (e.g., water supply marketers), and regulatory agencies). This movement from a single resource issue to multiple problems and multiple stakeholders is typical of most watershed and systemwide studies. The site-specific release of contaminants occurred, but can be understood and addressed either as in Figure 1 or Figure 2; it is the same problem. Understanding and portraying the effort as Figure 1 gives a misleading perception of the problem and the solutions. The resources or entities in Figure 2 must be incorporated to solve problems at a watershed level. To initiate planning for addressing these and other problems within a watershed approach, a conceptual model such as Figure 3 can be developed, using the Driver-Stressor-Essential Ecosystem Component-Endpoint (D-S-EEC-E) construction used in the template. In this way conceptual models help in understanding and addressing the site-specific problems within a systemwide context.

ERDC TN-SWWRP-07-4 August 2007
3
Figure 1. New England District model of contaminated sediment uptake to fish and wildlife (adapted from U.S.Army Engineer District, New England 2005).
ERDC TN-SWWRP-07-4 August 2007
4
Figure 2. Water supply effects added to the contaminated sediment effects.
SCOPE OF THE TECHNICAL NOTE: Planners and stakeholders, with their expertise and experience in the watershed in mind, can identify the template’s descriptors and components that are appropriate to their study. The template thus serves as the tool to guide construction of a conceptual model, forming the framework for watershed and subwatershed analyses. This technical note reports on the template descriptors for conceptual models. The second part of model construction is identification of system components (i.e., constituent entities, see “Appendix A, Glossary”) and their relationships, and a second technical note will report on template components for conceptual models, along with an application of the template. Approximately 20 models were reviewed and 6 selected to be categorized and produce descriptors, which are the framework, parameters, or “bounds” for model construction.

ERDC TN-SWWRP-07-4 August 2007
5
Driver
Stressor
Endpoint
Human Populations and Demographics
Infrastructure (water supply)
Water Resource Mgt.(nav. project, CDF, water
supply system)
Sediment Quality(contamination)
Water Quantity andQuality
(contamination)
Aquatic Species:Benthic
Invertebrates
AquaticInsectivorous
(benthiceating)Species
Aquatic Species:Fish
Piscivorous(fish eating)
Wildlife
DrinkingWater
(humanhealth)
EEC
Figure 3. Conceptual model of contaminated sediment - water supply using D-S-EEC-D formulation.

ERDC TN-SWWRP-07-4 August 2007
6
DESCRIPTOR CATEGORIES: Approximately 20 models were reviewed and 6 selected to be categorized and produce descriptors, which are the framework, parameters, or “bounds” for model construction. Table 1 lists the six models and summarizes the descriptors, which are:
• Model uses. • Geographic extent. • Time / spatial scale. • Model type / format.
One column of Table 1 shows Corps activity (planning, operations, regulatory) for which the model could be used or is similar. CONCEPTUAL MODEL REVIEW AND CATEGORIZATION –DESCRIPTOR CATEGORIES: Selecting models to review was based on applicability to Corps activities (planning, operations, regulatory) and to systemwide project applications (multiple stakeholders, limited data, large geographic extent). The six conceptual models (CMs) used for the categorization are representative of systemwide water resource applications of conceptual models. Based on the review of these six models and previous work, categories were identified for the four CM descriptors. The descriptor categories are explained below. MODEL USES: To put conceptual models in the context of current practice, there are four general activities in restoration, management and planning, planning, and management of natural resources. These activities are:
• Inventory, e.g., name what’s there. • Characterize, e.g., count and describe. • Assess and evaluate, e.g., determine trends. • Apply/use/decide/rank, e.g., specify Best Management Practices.
These activities are included in natural resource research and agency procedures, often given names more reflective of the specific task and agency mission. Objectives and uses of conceptual models (Henderson and O’Neil 2004) are related to these four activities (Table 2). From the model review of non-Corps applications, seven model uses were identified, organized into three broad uses: System Representation (SR), Simulation and Assessment (SA), and Sensitivity Analysis and Hypothesis Testing (SAHT).

ER
DC
TN-S
WW
RP
-07-4A
ugust 2007
7
Table 1. Categorization of conceptual model descriptors and components. Model Uses Geographic
Example Model CM Uses Example
Model Use CM
Level
Example Model Level
Corps Application
Model Type / Format
Time / Spatial Scale
National Park Service Monitoring Program Approach http://science.nature.nps.gov/im/monitor/docs/
• Comprehensive components and relationships • Measurement of endpoints, indicators
Organize system components to determine vital signs for monitoring of ecological effects
Landscape Region
Landscape Planning Ecosystem Restoration Operations
Influence System Graph
Time – Static Scale - Landscape
Groundwater Contaminant Conceptual Model (Meyer and Gee (1999))
• Measurement of changes in all model components • Alternative data sources
Calculation of tank and pathway contaminant doses using different models.
Site Site Planning Ecosystem Restoration
Influence System Graph
Time - Annual; Scale - Site
South Florida Conceptual Ecological Models http://www.sfrestore.org/crogee/ra13/ra13full.pdf
• Hypothesis testing • Measurement of changes in all model components
Organize system components to determine project performance by identifying monitoring measures for each endpoint. Assess changes in endpoints under different management alternatives. Test hypotheses of system relationships.
Region (e.g., Florida Bay 640 sq mi)
Wetland / Hydrolgic System
Planning Ecosystem Restoration
Numerical; Influence System Graph
Time - various time frames. Scale - Wetland Hydrologic Units, e.g., Lake Okeechobee
Wetland Prioritization Conceptual Model http://www.epa.gov/osp/presentations/critical/groskinsky.pdf
Prioritization Prioritization of watersheds based on criterion of marginal increase in risk avoided for species extirpation.
Region Hydrologic subasin
Planning Ecosystem Restoration Regulatory
Index Time – Static Scale - Subasin
Wetland Sediment Retention Conceptual Model (Vellifis et al. (2003))
Prioritization Prioritization of watersheds in eight states based on the criterion of reduction of sediment loading (wetland retention) per dollar of expenditures.
Region Watershed Planning Ecosystem Restoration Regulatory
Index Time – Static Scale - Watershed
Portland Harbor Sediment Contaminant Model http://www.deq.state.or.us/nwr/portlandharbor/phsmp/Appendix_G.pdf
• Measurement of endpoints, indicators • Hypothesis testing
Identification of assessment endpoints to test hypotheses on contaminant transport and bioaccumulation.
Site Harbor system; less than 30 river miles
Operations System Graph
Time -Static Scale -Land Unit

ERDC TN-SWWRP-07-4 August 2007
8
Table 2. Context of conceptual model uses. Natural Resources
Management Activities Conceptual Model Objectives (Henderson and O'Neil 2004) Conceptual Model Uses
Inventory Identify influence or cause-effect relationships
Comprehensive components and relationships (SR)
Hypothesis Testing (SAHT) Higher or lower scale application (SR) Characterize Communicate technical or complex
issues or systems to agency partners and stakeholders
Communication and common organizational framework (SR)
Alternative data sources comparison (SAHT)
Assess and evaluate Determine significant or critical changes to the system
Measurement of endpoints or their indicators(SA)
Measurement of changes in all model components (SA)
Sensitivity analysis (SAHT) Apply/use/decide/rank Simulation and Hypothesis Testing Prioritization (SAHT)
ORGANIZATION OF CONCEPTUAL MODEL USES System Representation
• Comprehensive components and relationships. • Communication and common organizational framework. • Higher or lower scale application.
Simulation and Assessment
• Measurement of endpoints, indicators. • Measurement of changes in all model components.
Sensitivity Analysis and Hypothesis Testing
• Alternative data sources. • Sensitivity analysis. • Hypothesis testing. • Prioritization.
MODEL USES – EXPLANATIONS System Representation Comprehensive components and relationships. Understanding a system requires identifying the constituent elements making up and affecting the system. Interactions of multiple resources and disciplines may not be considered in some discipline focused efforts, e.g., water quality,

ERDC TN-SWWRP-07-4 August 2007
9
versus watershed study. Discipline representatives and stakeholders develop the conceptual model, often in a workshop or collaborative setting. The developed model is reviewed, revised, and accepted or finalized as the recognized system model. Communication and Common Organizational Framework. Those involved in a watershed or system study recognize the need for communication of the system and potential changes, e.g., development, policy changes, or complex relationships among system components. Development of the comprehensive components and relationships (above) is the basis for a communication model. Figure 4 is a model to communicate the relationships of major factors in the analysis and planning of the South Florida Everglades restoration (South Florida Water Management District 1999). Each component of the model is composed of significant structure and information, worthy of its own model. The model shows how the separate components provide information to each other. System Model Development for Application to a Higher or Lower Scale or Level The conceptual model is developed for a particular scale or hierarchical level, usually at the level for which data are available, and then the model is used for evaluation at a higher or lower spatial or natural system level. Model assumptions and relationships must be examined for validity at the higher or lower application or for application at the same level in a different location. Examples:
• Subwatershed model used to assess watershed or basin. • Land unit or project level species habitat model used to assess landscape level habitat
suitability. • Open lake exotic plant growth model used for cove and embayment assessments.
Simulation and Assessment Measurement of endpoints and indicators. The conceptual model is developed with components and relationships. The endpoints, i.e., the system structures and processes that are ecologically significant and valued by humans, are evaluated. Indicators for the endpoints may be identified. Metrics for each endpoint or indicator are identified for quantification. Endpoints or indicators are assessed or measured.
Figure 4. South Florida landscape conceptual model (South
Florida Water Management District 1999).

ERDC TN-SWWRP-07-4 August 2007
10
Measurement of changes in all or a subset of system components. The conceptual model provides the framework to assess or measure the status of system components resulting from changes in drivers, stressors, and management of the system. This allows “what-if” alternative evaluations and rankings of system outcomes. Simulations are implemented using changes in the model drivers and stressors (such as increased nutrient flows or drought), to determine changes in the state of endpoints and essential ecosystem characteristics, as well as to identify changes in the state of the stressors and drivers. Changes to the system are evaluated in terms of changes to all system components, not just the endpoints as in the above use. Sensitivity Analysis and Hypotheses Testing Alternative Data Sources. Data collection and other implementation costs sometimes require choosing between alternative data sources. Development of conceptual models with different available data can result in models with different structural components and different mathematical or other (qualitative ratings) measurements for the endpoints. The costs of data collection must be evaluated against the decision-making needs for precision, variability, or accuracy of model assessments. It must be determined whether lower-cost data sources adequately support decision making. Conceptual models are developed based on alternative data sources. The endpoint and other measurements from the models are compared to the decision requirements, and a recommendation is made on data source use. Sensitivity Analysis. In sensitivity analysis, a conceptual model is developed. The sensitivity of system components to changes in a particular component or category of components is determined. Drivers or stressors are varied in magnitude, frequency, or other attributes to determine the amount of change resulting in the endpoints. Similarly, sensitivity to changes in endpoints can be determined for the driver and stressors. Hypotheses Testing. In the hypothesis testing phase, a conceptual model is developed with components and relationships. Hypothesis testing of the system model is accomplished either by using simulated or hypothetical data or by using available (e.g., monitoring) data. If model applications show errors in assumptions, cause-effect relationships, or mathematical calculations, then the conceptual model is revised. Prioritization. In this phase, a conceptual model is developed with components and relationships (structures, linked relationships, flow rates, and pathways). The conceptual model is used to assess the endpoints—e.g., ecological status, habitat, biota, function, services. Priorities are established either by decision criteria, e.g., risk, thresholds, standards, or priorities for a component. Geographic Extent. Part of planning for conceptual model construction is specifiying the physical extent of the model. Conceptual models are used for systems that range in size from single cells to global resources, but most agency applications are for study areas; lake, stream or wetland project sites; watersheds; and ecosystems. Selection of a geographic extent implies or dictates expectations of certain scale-appropriate structures, processes, detail, or comprehensiveness. Because conceptual models are not numerically calibrated, defining limits or ranges for site, landscape, and regional models is inexact, but general descriptions are

ERDC TN-SWWRP-07-4 August 2007
11
summarized in Table 3 below. Because of the role of conceptual models in integration of processes from different spatial locations and hierarchies, it is important to identify cross-boundary process and functional dynamics among structural elements; the cross-boundary locations and hierarchical levels may become the limits and scale for the study.
Table 3. Organizational level categories – Site, landscape, and region.
Category General Size Range (Avers et. al 1993) Mapping Scale
(O’Neil and Hill 2000) Site Variable Variable Landscape 100's to 1,000's of square miles 1:1000 – 5,000 Region 1,000,000's to 10,000's of square miles 1:25,000 – 50,000
Site models encompass a project or study area that is the focus for evaluating changes, such as a contaminant site, harbor, or wetland. This is where a problem manifests itself, but not necessarily where it originates. The range in size of site models is from less than an acre to thousands of acres (Table 3). Landscape level models represent systems where the changes are distributed over the system or the components of the system. Landscape models usually represent similar hydrological, land cover, or other characteristics, e.g., forest, river basin, and usually incorporate the integration of multiple forces and the transport and transformation of materials through the landscape and landscape features. Regional models represent systems larger than the landscape and may encompass the materials and processes transported between geographic or hydrologic units. Table 4 shows study area sizes based on the Hydrologic Units Codes (HUC) established by the U.S. Geological Survey and used in water resources mapping by Federal agencies. The United States is divided into 21 hydrologic regions with two-digit designations. Smaller sized hydrologic units have increasing numbers of HUC digits.
Table 4. HUC codes and corresponding spatial size. Hydrologic Unit Level Name Digits Size Units 1 Region 2 Average: 177,560 square
miles 21
2 Sub-Region 4 Average: 16,800 square miles
222
3 Basin (previously called Accounting Unit)
6 Average: 10,596 square miles
352
4 Sub-Basin (previously called Cataloguing Unit, EPA calls Watershed)
8 Average: 703 square miles 2,149
5 Watershed 10 63-391 square miles 22,000 (estimate) 6 Sub-Watershed 12 16-63 square miles 160,000 (estimate)
Time / Spatial Scale. The temporal and spatial scales of a conceptual model are in part determined by the objectives and uses of the model. The spatial and temporal time scales for a regulatory permit (e.g., less than a hectare and less than five years) are much different than the

ERDC TN-SWWRP-07-4 August 2007
12
spatial and time scales for an ecosystem restoration project. Similarly, a model developed at the seasonal scale of a river reach will differ from a model of decadal changes over the entire basin landscape. Differences will be in the type and scale of forces acting on the system, the number and scale of physical and chemical processes incorporated in the system, and the number and expanse of endpoints or target conditions desired for the system. Time and spatial scales do not have a set of categories as with Model Uses or Geographic Extent. Rather, each effort is self-defined. For instance, time scale may be static, seconds, seasonal, annual, or a similar designated time frame; time scale is identified as static or specified time scale. Spatial scale is also defined by the study, but is usually identified by hydrologic (e.g., watershed or ecological (e.g., community) designations. Time. Models are either developed as representations of a static system, without dynamics between model components, or developed to use for assessment of the status of model components at particular points in time, such as annually or at times specified by a simulation or planning scenario. Time scale categories are:
• Static. • Specified time scale, e.g., annual.
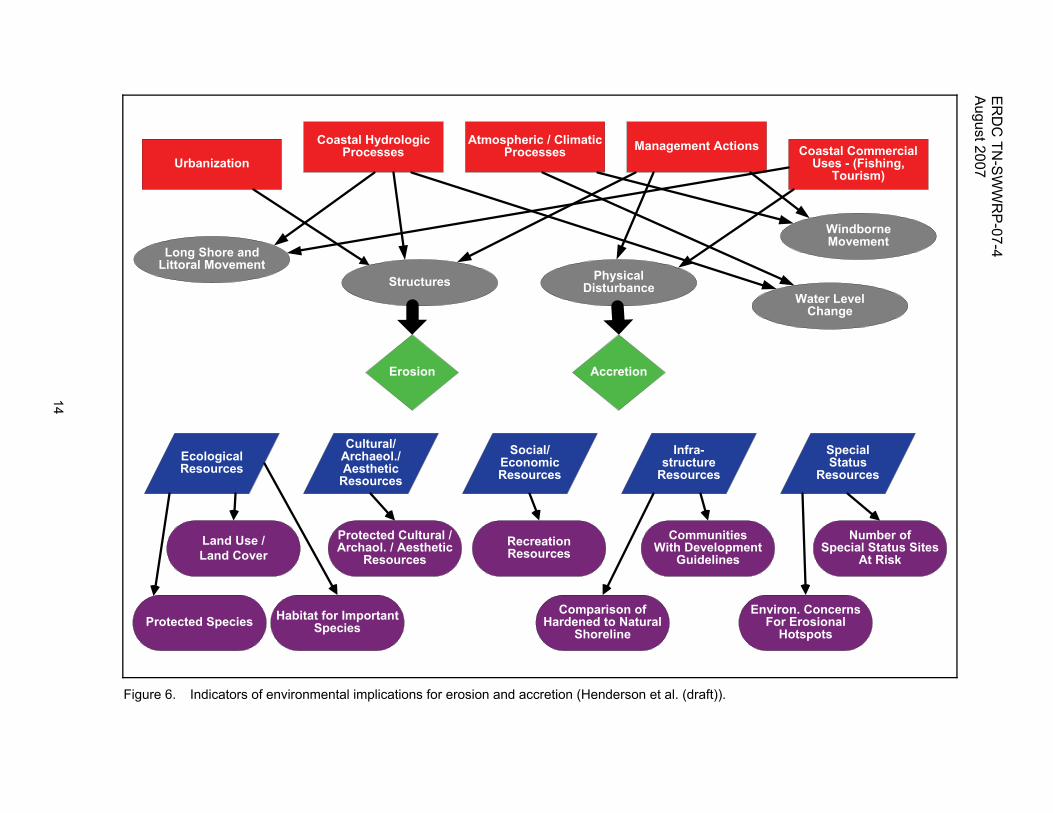
Models used to evaluate system conditions over time incorporate a time step, resulting in changes in the endpoints over time. Models for a specified time scale require that data be collected or estimated for each time step, as compared to the static conditions, using only one point in time. Spatial. Spatial scale is determined by such things as homogeneity of the system (e.g., subbasins) and the dimensions of the locations of the resource problem and management solutions. In this sense, spatial scale is similar to minimal mapping unit (habitat analysis) or unit of analysis such as outfall, catchment, subwatershed, watershed, or ecosystem. That is, if the intent is to model watershed interactions, the model should be developed with watershed level data and processes. If sources of sediment are basinwide, but the problem is loss of habitat in downstream estuary, the model should be at the basin level, i.e., where the solutions are, not limited to the estuary site level. Relationships of spatial scale should be recognized with the Geographical Extent (e.g., site) descriptor and with the Model Use descriptor for Application to a Higher or Lower Scale or Level. The spatial scale of reviewed models (Table 1) was identified for each model, rather than assigning them to a category. Model Type / Format. Conceptual models take on numerous types or formats, classified variously by different users. The typology shown below (Table 5) was developed from previous conceptual model work (Henderson and O’Neil 2004) and the current review of applications from the Corps and other sources. Straightforward word or picture models can communicate systemwide concepts. Figure 5 (from Australia) shows the natural resource inflows and human factors (numbered) affecting a tidal river: wastewater treatment plants (4), urbanization (1), stormwater discharges (5), and sediment resuspension (6) (Moreton Bay Waterway and Catchment Partnership 2006). The interactions of components, cause-effect relationships, and flows of energy and material are best demonstrated in influence system graphs. Figure 6 was developed for the National Shoreline Management Study, to identify the environmental

ERDC TN-SWWRP-07-4 August 2007
13
implications of shoreline erosion and accretion (Henderson et al. (draft)). The intent was to identify the environmental implications and to identify indicators (purple rounded rectangles in Figure 6) that could be measured to evaluate the environmental implications of shoreline erosion and accretion.
Figure 5. Lower Brisbane River conceptual model (Moreton Bay Waterway and Catchment Partnership
2006).
Table 5. Model types / format. Model Type Model Description
Word/Picture Identifies relationships or cause and effect; described by words in text, tables, pictures, or graphics.
Influence System Graph Identifies interactions between components, showing influence, cause-effect relationships, and flows of energy, material, and information; represented as symbols or boxes and linked by arcs, arrows, or other conventions to show direction and sometimes magnitude.
Index System relationships are used to calculate an endpoint; index is scaled and dimensionless.
Numerical Numerical models (formulae) are used to calculate endpoints in a metric or numerical value appropriate for the endpoint.
ER
DC
TN-S
WW
RP
-07-4 A
ugust 2007
14
Coastal HydrologicProcesses
Atmospheric / ClimaticProcesses
Structures PhysicalDisturbance
Erosion Accretion
Cultural/Archaeol./Aesthetic
Resources
Management ActionsUrbanization
Coastal CommercialUses - (Fishing,
Tourism)
Long Shore andLittoral Movement
WindborneMovement
Water LevelChange
EcologicalResources
Social/EconomicResources
Infra-structure
Resources
SpecialStatus
Resources
Protected Species
Land Use /Land Cover
Environ. ConcernsFor Erosional
Hotspots
RecreationResources
Comparison ofHardened to Natural
Shoreline
CommunitiesWith Development
Guidelines
Number ofSpecial Status Sites
At Risk
Protected Cultural /Archaol. / Aesthetic
Resources
Habitat for ImportantSpecies
Figure 6. Indicators of environmental implications for erosion and accretion (Henderson et al. (draft)).
ERDC TN-SWWRP-07-4 August 2007
15
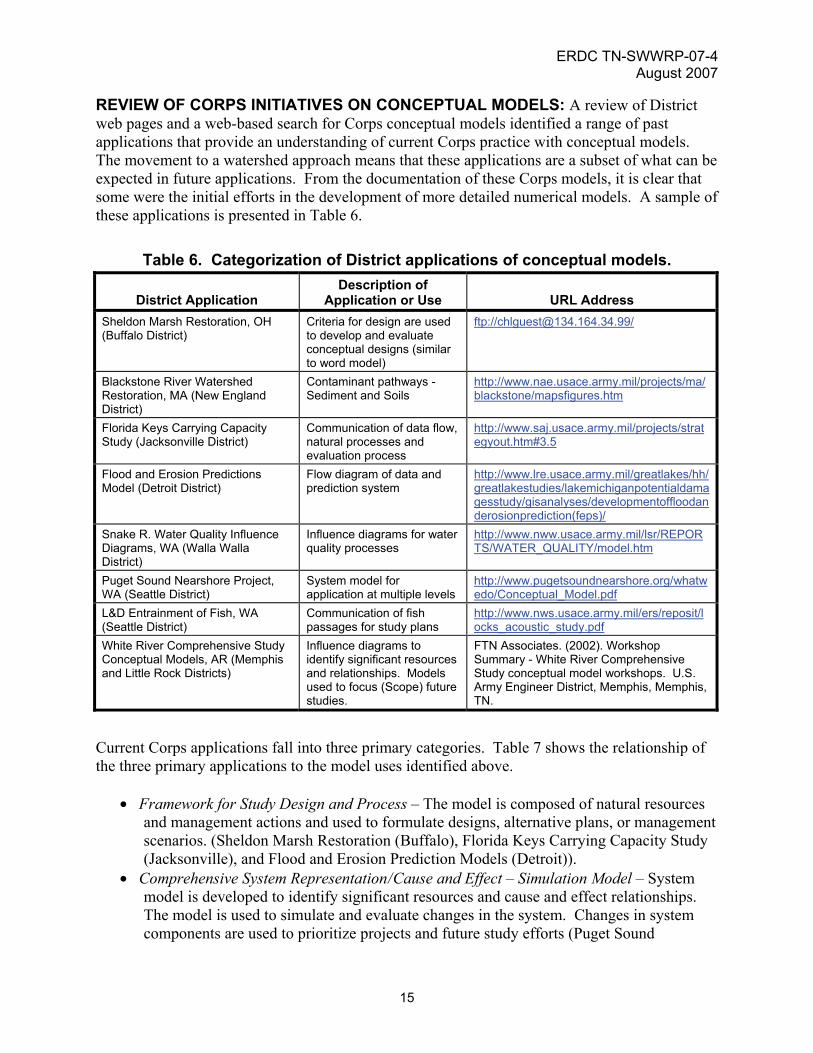
REVIEW OF CORPS INITIATIVES ON CONCEPTUAL MODELS: A review of District web pages and a web-based search for Corps conceptual models identified a range of past applications that provide an understanding of current Corps practice with conceptual models. The movement to a watershed approach means that these applications are a subset of what can be expected in future applications. From the documentation of these Corps models, it is clear that some were the initial efforts in the development of more detailed numerical models. A sample of these applications is presented in Table 6.
Table 6. Categorization of District applications of conceptual models.
District Application Description of
Application or Use URL Address Sheldon Marsh Restoration, OH (Buffalo District)
Criteria for design are used to develop and evaluate conceptual designs (similar to word model)
ftp://[email protected]/
Blackstone River Watershed Restoration, MA (New England District)
Contaminant pathways - Sediment and Soils
http://www.nae.usace.army.mil/projects/ma/blackstone/mapsfigures.htm
Florida Keys Carrying Capacity Study (Jacksonville District)
Communication of data flow, natural processes and evaluation process
http://www.saj.usace.army.mil/projects/strategyout.htm#3.5
Flood and Erosion Predictions Model (Detroit District)
Flow diagram of data and prediction system
http://www.lre.usace.army.mil/greatlakes/hh/greatlakestudies/lakemichiganpotentialdamagesstudy/gisanalyses/developmentoffloodanderosionprediction(feps)/
Snake R. Water Quality Influence Diagrams, WA (Walla Walla District)
Influence diagrams for water quality processes
http://www.nww.usace.army.mil/lsr/REPORTS/WATER_QUALITY/model.htm
Puget Sound Nearshore Project, WA (Seattle District)
System model for application at multiple levels
http://www.pugetsoundnearshore.org/whatwedo/Conceptual_Model.pdf
L&D Entrainment of Fish, WA (Seattle District)
Communication of fish passages for study plans
http://www.nws.usace.army.mil/ers/reposit/locks_acoustic_study.pdf
White River Comprehensive Study Conceptual Models, AR (Memphis and Little Rock Districts)
Influence diagrams to identify significant resources and relationships. Models used to focus (Scope) future studies.
FTN Associates. (2002). Workshop Summary - White River Comprehensive Study conceptual model workshops. U.S. Army Engineer District, Memphis, Memphis, TN.
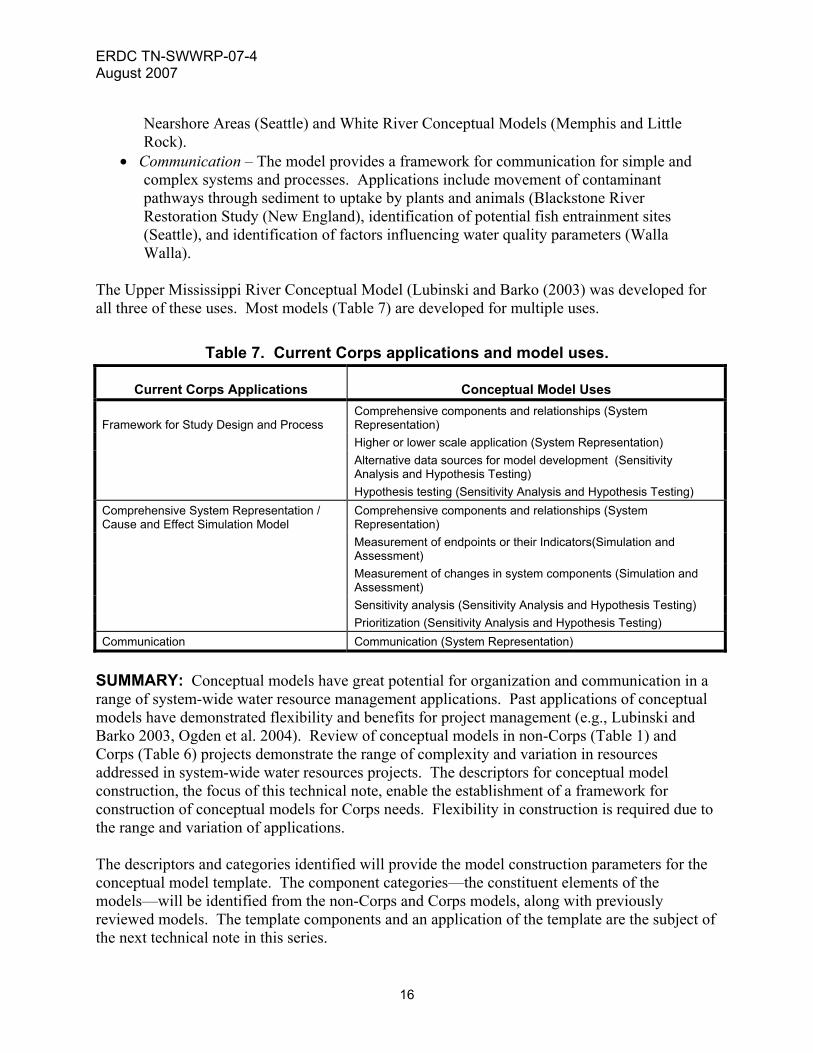
Current Corps applications fall into three primary categories. Table 7 shows the relationship of the three primary applications to the model uses identified above.
• Framework for Study Design and Process – The model is composed of natural resources and management actions and used to formulate designs, alternative plans, or management scenarios. (Sheldon Marsh Restoration (Buffalo), Florida Keys Carrying Capacity Study (Jacksonville), and Flood and Erosion Prediction Models (Detroit)).
• Comprehensive System Representation / Cause and Effect – Simulation Model – System model is developed to identify significant resources and cause and effect relationships. The model is used to simulate and evaluate changes in the system. Changes in system components are used to prioritize projects and future study efforts (Puget Sound
ERDC TN-SWWRP-07-4 August 2007
16
Nearshore Areas (Seattle) and White River Conceptual Models (Memphis and Little Rock).
• Communication – The model provides a framework for communication for simple and complex systems and processes. Applications include movement of contaminant pathways through sediment to uptake by plants and animals (Blackstone River Restoration Study (New England), identification of potential fish entrainment sites (Seattle), and identification of factors influencing water quality parameters (Walla Walla).
The Upper Mississippi River Conceptual Model (Lubinski and Barko (2003) was developed for all three of these uses. Most models (Table 7) are developed for multiple uses.
Table 7. Current Corps applications and model uses.
Current Corps Applications Conceptual Model Uses
Framework for Study Design and Process Comprehensive components and relationships (System Representation)
Higher or lower scale application (System Representation)
Alternative data sources for model development (Sensitivity Analysis and Hypothesis Testing)
Hypothesis testing (Sensitivity Analysis and Hypothesis Testing) Comprehensive System Representation / Cause and Effect Simulation Model
Comprehensive components and relationships (System Representation)
Measurement of endpoints or their Indicators(Simulation and Assessment)
Measurement of changes in system components (Simulation and Assessment)
Sensitivity analysis (Sensitivity Analysis and Hypothesis Testing) Prioritization (Sensitivity Analysis and Hypothesis Testing) Communication Communication (System Representation)
SUMMARY: Conceptual models have great potential for organization and communication in a range of system-wide water resource management applications. Past applications of conceptual models have demonstrated flexibility and benefits for project management (e.g., Lubinski and Barko 2003, Ogden et al. 2004). Review of conceptual models in non-Corps (Table 1) and Corps (Table 6) projects demonstrate the range of complexity and variation in resources addressed in system-wide water resources projects. The descriptors for conceptual model construction, the focus of this technical note, enable the establishment of a framework for construction of conceptual models for Corps needs. Flexibility in construction is required due to the range and variation of applications. The descriptors and categories identified will provide the model construction parameters for the conceptual model template. The component categories—the constituent elements of the models—will be identified from the non-Corps and Corps models, along with previously reviewed models. The template components and an application of the template are the subject of the next technical note in this series.
ERDC TN-SWWRP-07-4 August 2007
17
ACKNOWLEDGMENTS: The authors appreciate reviews and comments by Dr. Richard A. Cole, U.S. Army Engineer Institute for Water Resources, Alexandria, VA and Dr. Jan J. Hoover, Environmental Laboratory, U.S. Army Engineer Research and Development Center. Ms. Renee’ Caruthers, Bowhead Information Technology Services, Inc., Vicksburg, MS, provided graphic and processing support. ADDITIONAL INFORMATION: This technical note was written by Jim E. Henderson and L. Jean O’Neil, U.S. Army Engineer Research and Development Center, Vicksburg, MS. For information on the System-Wide Water Resources Program (SWWRP), please consult https://swwrp.usace.army.mil/ or contact the Program Manager, Dr. Steve L. Ashby (601-634-2387, [email protected]). This technical note should be cited as follows:
Henderson, J. E., and L. J. O’Neil. 2007. Template for conceptual model construction: Model review and Corps applications. ERDC TN-SWWRP-07-4. Vicksburg, MS: U.S. Army Engineer Research and Development Center. https://swwrp.usace.army.mil/
REFERENCES Avers, P., et al. 1993. National Hierarchical framework of ecological units ECOMAP. Washington, DC: U.S.
Forest Service.
Henderson, J. E., and L. J. O'Neil. 2004. Conceptual models to support environmental planning and operations. SMART Technical Notes Collection (ERDC/TN SMART-04-9). Vicksburg, MS: U.S. Army Engineer Research and Development Center.
Henderson , J. E., K.M. McGlynn, R.C. Nyc, and K.L. Finkelstein (draft) . Indicators for environmental implications – National Shoreline Management Study. Vicksburg, MS: U.S. Army Engineer Research and Development Center.
Lubinski, K. S., and J. W. Barko. 2003. Mississippi River–Illinois Waterway System navigation feasibility study: Environmental science panel report. ENV Report 52. U.S. Army Engineer Districts, Rock Island, St. Louis, and St. Paul. http://www2.mvr.usace.army.mil/umr-iwwsns/documents/ENV%20Report%2052.pdf
Meyer, P. D., and G. W. Gee. 1999. Information on hydrologic conceptual models, parameters, uncertainty analysis, and data sources for dose assessments at decommissioning sites. NRREG/CR-6656 PNNL-13091. Richland, WA: Pacific Northwest National Laboratory.
Moreton Bay Waterway and Catchment Partnership.2006. Lower Brisbane River conceptual model, Brisbane, Queensland, Australia. http://www.healthywaterways.org/PAGE180559PMQ4DF3S.html.
O’Neil, L. J., and A. Hill, ed. 2000. Guidelines for mapping vegetation on Army installations. ERDC TR-00-8., Vicksburg, MS: U.S. Army Engineer Research and Development Center.
Ogden, J. C., S. M. Davis, K. Jacobs, and T. Barnes, T. 2004. Conceptual ecological models as restoration planning tools for South Florida restoration. In Proceedings, first national conference on ecosystem restoration, Dec 6 -10, 2004, Orlando, FL.
South Florida Water Management District.1999. Watershed management-ecological components. http://www.sfwmd.gov/org/wrp/wrp_evg/2_wrp_evg_eco/2_wrp_evg_eco.html
U.S. Army Engineer District, New England. 2005. Blackstone River watershed restoration study. Waltham, MA.
U.S. Army Engineer Research and Development Center and Harwell Gentile and Assoc. 2001. Conceptual model for coastal Long Island ecosystems: Fire Island to Montauk Point reformulation study. Draft report, Vicksburg, MS.

ERDC TN-SWWRP-07-4 August 2007
18
Vellifis et al. 2003. Prioritizing wetland restoration for sediment yield reduction: A conceptual model. Environmental Management 31(2), 301-312.
NOTE: The contents of this technical note are not to be used for advertising, publication, or promotional purposes. Citation of trade names does not constitute an official endorsement or approval of the use of such products.

ERDC TN-SWWRP-07-4 August 2007
19
APPENDIX A: GLOSSARY Adaptive Management – An approach to natural resource management that incorporates
monitoring of project outcomes and uses the monitoring results to make revisions and refinements to ongoing management actions (adapted from National Academy of Science (2002)).
Assessment Endpoints – The actual environmental value that is the structure or function of interest or significance. Two things are defined - the specific endpoint valued, e.g., species, and the characteristic about the entity of concern this is important and at risk, e.g., nesting and feeding conditions (EPA 1998).
Benefits – Outcomes of management actions described in terms of relative value (adapted from O'Neil and Bartoldus (2002)).
Component – Constituent element; a discernable or distinct part that exists in the ecosystem, and together with other components, constitutes or encompasses the entirety of the ecosystem. Components may be organisms, physical structures, patterns, or processes.
Descriptor – A model development guideline, criterion, or parameter established to define and constrain the development of a conceptual model. Descriptors are Model Uses, Geographic Extent, Time / Spatial Scale, and Model Type / FormatA framework or bounds for conceptual model development set by model developers.
Driver – Human activities or natural forces that cause changes in the system, resulting in environmental stress on ecosystem components (adapted from U.S. Army Engineer Research and Development Center (ERDC) and Harwell Gentile and Associates (2001)).
Endpoints – The selected components of the ecosystem that are ecologically significant, reflect human or public values valued by human societies, and are used to evaluate changes in the ecosystem. Endpoints can be quantified using standard units of measurement (performance criteria, metrics).
Essential ecosystem characteristics – The categories of properties or attributes that describe the major ecological components in any type of ecosystem (e.g., habitat quality, biological integrity, ecological processes, water quality, hydrology, and disturbance) (Harwell et al. 1999).
Functions (Processes) – The systematic biological, physical, and chemical flows and transformations of energy and materials that occur in natural systems (O'Neil and Bartoldus 2002).
Goals – Articulation of societal values and desired ecosystem conditions. Goals are generally broad in nature (Harwell et al. 1999). Goals are further defined by objectives and endpoints. Goals are attained by implementation of management actions.
Management Actions – Human activities that are intended to improve the well-being of human society and ecosystems. Example actions are restoration, preservation, and vegetation manipulation, channel stabilization.

ERDC TN-SWWRP-07-4 August 2007
20
Model Construction Parameters – Specifications for composition of a conceptual model. Model Uses, Geographic Context, Time / Spatial Scale, and Type / Format are the parameters used herein. See Descriptor.
Objectives – Clear statements about desired future conditions of an ecosystem, for use in management and restoration. Objectives further define goals, using descriptions of target conditions for ecosystem components.
Pattern (Structure) – A characteristic, repeating, or predictable occurrence of ecosystem components.
Performance Criteria – Criteria for the endpoints, e.g., acceptable range, thresholds, or limits; based on scientific understanding of desired ecological conditions (adapted from Harwell et al. 1999).
Process (Function) – The biological, physical, and chemical flows of energy and material that result in changes in components of ecosystems (adapted from O'Neil and Bartoldus 2002).
Significant – Likely to have a material bearing on the decision-making process. Significance is based on institutional, technical, and public recognition. Resources and effects of alternative management actions are evaluated for significance (U.S. Water Resources Council 1983).
Stressor – A physical, chemical, or biological change that can affect an ecosystem or ecosystem component (ERDC and Harwell and Gentile and Assoc. 2001).
Structure – The spatial and temporal occurrence and arrangement of components in an ecosystem; the physical manifestation of patterns and processes (adapted from O'Neil and Bartoldus 2002).
Template – Suggested format, go-by to facilitate construction of conceptual models. Guide, mold, pattern (Roget 2006). In this case, the template is a guide/format/pattern to augment the thinking, judgments, and decisions of a study team or group developing a conceptual model.
GLOSSARY REFERENCES Environmental Protection Agency. 1998. Guidelines for ecological risk assessment. EPA/630/R-95/002F.
Washington, DC.
Harwell, M. A., V. Myers, T. Young, A. Bartuska, N. Gassman, J. H. Gentile, C. C. Harwell, S. Appelbaum, J. Barko, B. Causey, C. Johnson, A. McLean, R. Smola, P. Templet, and S. Tosini. 1999. A framework for an ecosystem integrity report card. Bioscience 49(7): 543-556.
National Academy of Science. 2002. The Missouri River Ecosystem: Exploring the prospects for recovery. Washington, DC.
O'Neil, L. J. and Bartoldous. 2002. Selected definitions for ecological evaluation. Glossary for Corps training courses. Vicksburg, MS.
Roget. 2006. Roget’s new millennium™ thesaurus. 1st ed. New York: Lexico Publishing Co.
U.S. Army Engineer Research and Development Center (ERDC) and Harwell Gentile and Associates. 2001. Conceptual models for coastal Long Island ecosystems: Fire Island to Montauk Point reformulation study. Draft report prepared for Army Engineer District, New York. Vicksburg, MS.

ERDC TN-SWWRP-07-4 August 2007
21
U.S. Water Resources Council. 1983. Economic and environmental principles and guidelines for water and related land resources implementation studies. Washington, DC.