temporal analysis of hippocampal ca3 gene co-expression...
TRANSCRIPT

© 2017. Published by The Company of Biologists Ltd. This is an Open Access article distributed under the terms of the Creative Commons Attribution License
(http://creativecommons.org/licenses/by/3.0), which permits unrestricted use, distribution and reproduction
in any medium provided that the original work is properly attributed.
Temporal analysis of hippocampal CA3 gene co-expression
networks in a rat model of febrile seizures
Hatylas Azevedo1*, Nathália Amato Khaled1, Paula Santos1, Fernanda Bernardi
Bertonha1, Carlos Alberto Moreira-Filho1*
1Department of Pediatrics, Faculdade de Medicina, University of São Paulo (FMUSP)
* Corresponding author:
Carlos Alberto Moreira-Filho
Abbreviations
MTLE: Mesial temporal lobe epilepsy; HS: hyperthermic seizures; FS: Febrile seizures;
WGCNA: weighted gene co-expression network analysis.
Keywords: febrile seizures; co-expression networks; epilepsy; microarray; gene
expression profile; network analysis
Dis
ease
Mo
dels
& M
echa
nism
s •
DM
M •
Acc
epte
d m
anus
crip
t
http://dmm.biologists.org/lookup/doi/10.1242/dmm.029074Access the most recent version at First posted online on 30 November 2017 as 10.1242/dmm.029074
Abstract
Complex febrile seizures during infancy constitute an important risk factor for epilepsy
development. However, little is known about the alterations induced by febrile seizures
that may turn the brain susceptible to epileptic activity. In this context, the use of animal
models of hyperthermic seizures (HS) could allow the temporal analysis of brain
molecular changes that arise after febrile seizures. Here, we investigated temporal
changes in hippocampal gene co-expression networks during the development of rats
submitted to HS. Total RNA samples were obtained from the ventral hippocampal CA3
region at four time points after HS at postnatal day 11 (P11) and later used for gene
expression profiling. Temporal endpoints were selected for investigating the acute (P12),
latent (P30 and P60) and chronic (P120) stages of the HS model. A weighted gene co-
expression network analysis was employed to characterize modules of co-expressed
genes, as these modules may contain genes with similar functions. The transcriptome
analysis pipeline consisted in building gene co-expression networks, identifying network
modules and hubs, performing gene-trait correlations and examining module connectivity
changes. Modules were functionally enriched to identify functions associated to HS. Our
data showed that HS induce changes in developmental, cell adhesion and immune
pathways, like Wnt, Hippo, Notch, JAK-STAT and MAPK. Interestingly, modules
involved in cell adhesion, neuronal differentiation and synaptic transmission were
activated as early as one day after HS. These results suggest that HS trigger transcriptional
alterations that may lead to persistent neurogenesis, tissue remodeling and inflammation
in the CA3 hippocampus, turning the brain prone to epileptic activity.
Dis
ease
Mo
dels
& M
echa
nism
s •
DM
M •
Acc
epte
d m
anus
crip
t

Introduction
Mesial temporal lobe epilepsy (MTLE) is the most common cause of drug-resistant
epilepsy (Engel, 2001). Surgical treatment has proved to be successful for
pharmacoresistant MTLE, but less than 1% of the patients are referred to surgery, and
usually too late for preventing psychological disabilities (Engel, 2011). Approximately
40% of MTLE patients have a history of febrile seizures (FS) (Chungath and Shorvon,
2008). Notably, MTLE patients with a history of complex FS (MTLE-FS) exhibit higher
hippocampal granule cell loss than patients without such antecedent (Alegro et al., 2012).
These patients may also experience increased cognitive deficits, since poor memory
acquisition correlates to granule cell loss in temporal lobe epilepsy (Pauli et al., 2006).
Moreover, the analysis of hippocampal CA3 explants obtained after surgery revealed
distinct transcriptional signatures between patients with MTLE-FS and those with no
history of complex FS (Bando et al., 2013).
Complex FS are defined as those lasting longer than 15 minutes, occurring more than
once over a 24-hour period, or associated with brain infection (French, 2012). They are
particular relevant because children experiencing them exhibit acute hippocampal injury
and also have abnormalities in hippocampal development (Shinnar et al., 2012). In
addition, around 7% of the children undergoing complex FS will develop epilepsy later
in life (Vestergaard et al., 2007).
Animal models have been used for investigating the mechanisms underlying complex FS
in humans, as they allow the temporal analysis of biological processes activated after the
initial seizures. In these models, immature animals are subjected to hyperthermia episodes
that promote the hyperexcitability of the limbic system and lead to prolonged seizures.
These models were already employed to characterize long-lasting histological, behavioral
and electrophysiological changes in brain after FS (Dubé et al., 2012). They reproduce
several features of human epilepsy with a history of febrile seizures, such as age
dependence, hyperthermia, duration of seizures and lack of immediate morbidity (Bender
et al., 2004). The synaptic reorganization of dentate granule cells is also observed in both
the model and in human epilepsy - a histological feature that is correlated with enhanced
hippocampal excitability (Bender et al., 2003). However, there is still a knowledge gap
Dis
ease
Mo
dels
& M
echa
nism
s •
DM
M •
Acc
epte
d m
anus
crip
t

about the persistent molecular changes in hippocampal neurons that may lead to MTLE
after complex FS (Dubé et al., 2012).
MTLE is considered to be multifactorial, with environmental factors and genetic
background contributing to the final outcome (Nakayama, 2009). Therefore, exploring
the mechanisms underlying MTLE-FS requires research not only focused on the
examination of individual genes, but also on the understanding of the interplay between
the genome and the FS insults. To this end, the use of a systems biology approach may
reveal how clusters of genes operate at a network level and contribute to the molecular
mechanisms of complex brain disorders (Gaiteri et al., 2014). More specifically, this
analysis could further clarify the molecular pathways involved in increased brain
excitability after FS.
Here, we investigated temporal alterations in hippocampal gene co-expression networks
in rats submitted to hyperthermia-induced seizures (HS). We sought to obtain further
insights into the hippocampal molecular changes elicited by HS that may contribute to
chronic epilepsy. The ventral region of rat hippocampus was selected for transcriptional
profiling because hippocampal hyperexcitability may occur preferentially in the ventral
CA3 circuitry (Wu et al., 2005). Moreover, the rat ventral hippocampus is homologous
to the human anterior hippocampus, which is the region related to histological changes in
patients with MTLE (Toyoda et al., 2013). Our rationale was to investigate transcriptional
pathways related to epileptogenesis to identify potential targets for therapeutic
interventions aimed at disrupting MTLE-FS onset or progression.
Materials and Methods
Animal model of hyperthermic seizures
The experimental model used here is similar to the original model of HS in immature rats
described by Baram (Baram et al., 1997). Briefly, Wistar rats were allowed to mate during
four consecutive days in a standard 12-hour light/ 12-hour dark cycle. The age of the pups
was determined from the day of birth (post-natal day P0). At the eleventh day of postnatal
life (P11), animals were subjected to hyperthermia (39.5 to 42.3 ° C) in a glass box with
Dis
ease
Mo
dels
& M
echa
nism
s •
DM
M •
Acc
epte
d m
anus
crip
t

incandescent lamps until they reached a body temperature of 39°C for 45 minutes. The
control group consisted of animals that were placed in the glass container but were not
exposed to the heat insult. Animals that underwent a 45-minutes hyperthermia interval
were subsequently monitored under euthermic conditions for one hour. The post-
induction interval was video recorded and behavioral seizures were classified according
to the Racine scale: orofacial automatisms (stage 1); head nodding (stage 2); forelimb
clonus (stage 3); forelimb clonus with rearing (stage 4); and forelimb clonus with rearing
and fallings (stage 5). The Ethics Committee of FMUSP approved this study under the
number 460/13.
Experimental design
Rat pups in equal male: female ratio (n = 6-8 per group and time interval) were divided
into two groups: controls (CTRL) and animals that developed seizures after the
hyperthermic treatment (HS). Only those animals that exhibited seizures classified as
stage 2 or higher in the Racine scale were assigned to the HS group. The selection of the
temporal endpoints was based on previous studies (see below) showing associations
between specific time intervals and seizure susceptibility or resistance after
pharmacological seizure induction. For instance, a decrease in the incidence of seizures
generated by pentylenetetrazole was observed after 24 hours (P12), and also after 20 days
of the hyperthermia episode (Gonzalez-Ramirez et al., 2009). Conversely, animals
submitted to hyperthermic seizures at P11 are prone to develop seizures at P60 (Zhao et
al., 1985) and P90 (Dube et al., 2000) when treated with a sub-convulsive dose of kainate.
In this experimental model, the majority (90%) of the animals exhibit interictal
epileptiform discharges (Dubé et al., 2006), and spontaneous seizures occur in 45% of the
animals, starting around 3 to 4 months (P120) of age (Dubé et al., 2010).
RNA extraction from ventral CA3 hippocampus
Brain tissue samples were collected from the ventral CA3 hippocampus at one (P12), 19
(P30), 49 (P60) and 109 (P120) days after hyperthermia-induced seizures. These time
intervals were selected for evaluating the acute (P12), latent (P30 and P60) and chronic
(P120) stages of the experimental model. Brain microdissection was performed as
previously described (Gorter et al., 2006). Briefly, after decapitation, the temporal lobe
Dis
ease
Mo
dels
& M
echa
nism
s •
DM
M •
Acc
epte
d m
anus
crip
t
and hippocampus were removed by incision at the ventrocaudal part underneath the rhinal
fissure, until 5 mm posterior to bregma. Then, the hippocampus was cut into smaller
pieces (200-300 uM) and the CA3 region was selected and removed in phosphate buffered
saline (PBS) at 4°C under a dissecting microscope. The CA3a and CA3b regions were
included in the analysis and the dentate gyrus was not sampled. The material obtained
from the ventral CA3 region was placed in Eppendorf tubes of 0.5 mL containing RNA
later (Qiagen) for subsequent total RNA extraction. Total RNA was extracted using
RNeasy® Mini Kit (Qiagen) and stored at -80oC until use in subsequent experiments.
RNA integrity was analyzed in all samples using Bioanalyzer 2100 (Agilent
Technologies, Santa Clara, CA, USA). The analysis performed by the Bioanalyzer
platform calculates an RNA integrity parameter (RIN), which is based on the ratio of
28S:18S bands (Schroeder et al., 2006). RIN values range from 10 (intact) to 1 (totally
degraded). We only used samples with RIN ≥ 7.
Oligonucleotide microarray data analysis
Microarray data was obtained as previously described (Correa-Costa et al., 2012). Gene
expression experiments were accomplished in the Agilent microarray platform, according
to manufacturer’s instructions. Agilent whole rat genome 4X44K v3 oligonucleotide
microarrays (G2519F-028 282) were used to examine the transcriptional profiles. The R
environment (http://www.r-project.org) was employed to analyze the data. The processed
signal (gProcessedSignal) generated by software Feature Expression (v9.5.3) was utilized
for further analyses. The mean expression value for each gene was calculated and then
the data was log2-transformed. Data was processed and normalized by quantile
normalization using the Limma package in R(Smyth, 2005). The differentially expressed
(DE) genes were identified using the significance analysis of microarrays algorithm
implemented in TMeV (Saeed et al., 2003), with a false discovery rate of 10% (Benjamini
Y, 1995). The microarray data set is available at the NCBI Gene Expression Omnibus,
through the accession number GSE84289.
Dis
ease
Mo
dels
& M
echa
nism
s •
DM
M •
Acc
epte
d m
anus
crip
t
Gene co-expression network analysis
The network analysis workflow employed here is depicted in Figure S1. We performed
an unsigned weighted gene co-expression network analysis (WGCNA) to identify clusters
of co-expressed genes, since genes with correlated expression levels may be associated
to common regulatory mechanisms. The WGCNA method calculates a matrix of pairwise
correlation coefficients from the expression data and transforms it into an adjacency
matrix that contains the co-expression values raised to a soft threshold beta. The beta
value is selected for maximizing the networks’ scale-free topology. The analysis was
implemented using the WGCNA package in R, which constructs networks by means of
maximizing the scale free topology fit (Langfelder and Horvath, 2008). The soft-
threshold of 10 was chosen to maximize the scale-free topology index. The resulted R2
for this function was larger than 0.8 in all generated networks.
The algorithms were applied for finding clusters (modules) of co-expressed genes,
summarizing clusters using the module eigengene, identifying hub genes, relating specific
modules to experimental groups or to other modules, and comparing module parameters
(e.g. module membership) between networks. In the WGCNA package different colors
are arbitrarily assigned to the modules in order to distinguish them. The modules are
summarized by the parameter module eigengene (ME), which corresponds to the first
principal component of gene expression variation in each module. The biweight mid-
correlation coefficient was used to calculate the expression similarities between all gene
pairs. Only the 5000 most variable genes in each time interval were analyzed in order to
reduce background noise. The minimum module size was set to 50 genes.
Gene significance was calculated by correlating each gene expression profile with a
sample trait. Module significance was calculated using eigengene significance
(correlation between sample trait and eigengene) and its corresponding p-value for each
module. Only genes with a p-value ≤ 0.05 and modules with a p-value ≤ 0.1 were
considered significantly correlated to a sample trait. Intramodular hubs were identified as
the10 top-ranked genes based on intramodular connectivity in each module. Genes were
ranked according to their intramodular connectivity and changes in ranking positions
Dis
ease
Mo
dels
& M
echa
nism
s •
DM
M •
Acc
epte
d m
anus
crip
t

were determined between networks for identifying nodes and modules associated with
gain or loss of connectivity.
Module preservation statistics (Langfelder et al., 2011) was implemented to evaluate the
degree of similarity between the same modules assigned in the networks. The permutation
Z score was used to assess module density and connectivity. Zsummary < 2 denotes no
preservation, 2 < Zsummary < 10 indicates weak to moderate evidence of preservation,
and Zsummary > 10 suggests strong module preservation (Langfelder et al., 2011). Genes
not clustered into any modules were assigned to grey modules in WGCNA package, i.e.
grey module may contain genes associated with traits that are not part of a WGCNA
module. The gold modules consisted of 1000 random genes selected for the module
preservation analyses. When the networks were constructed in separate for CTRL and HS
groups, modules were identified in the CTRL network and the correspondent genes for
each module were kept the same in the HS network in order to allow network comparison.
Gene lists enrichment analysis
The online softwares EnrichR (Chen et al., 2013) and PANTHER (Thomas et al., 2003)
were used to identify functions overrepresented by lists corresponding to DE genes or to
modules of co-expressed genes. The databases Gene Ontology, KEGG, WikiPathways,
Reactome and Biocarta were used for selecting enriched functions. Only functions
displaying a p-value ≤ 0.05 and encompassing at least three enriched genes were
considered significant. No background gene set was used for the functional enrichment
analysis. Similar functions were grouped together to facilitate the analysis of the
functional enrichment results. Pie charts were constructed to visualize enriched functions
with the highest number of genes at each time interval using META-CHART
(https://www.meta-chart.com/pie#/data).
Quantitative polymerase chain reaction (qPCR)
Validation of microarray results was performed by qPCR. This procedure was carried out
using the SuperScript® III Reverse Transcriptase (Life Technologies, USA) and
QuantiFast SYBR Green PCR (Qiagen, USA) kits. Samples were incubated at 95°C for
5 minutes and subjected to 40 cycles of 95°C for 30s and 60°C for 30s. Primers were
Dis
ease
Mo
dels
& M
echa
nism
s •
DM
M •
Acc
epte
d m
anus
crip
t

designed in the Primer 3 software (http://bioinfo.ut.ee/primer3-0.4.0/). Gene expression
was quantified by the 2-ΔΔCT method. Data was normalized by the expression of the
GAPDH housekeeping gene. Statistical significance was determined by Student's t-test,
with p <0.1. The list of primer sequences is displayed in Table S1.
Results
Hyperthermic seizures induction in immature rats
The post-induction behavioral alterations were analyzed after the animals were subjected
to a hyperthermic insult. Behavioral seizures were classified according to the Racine
scale. Around 60% of the animals exhibited seizures after hyperthermia. Among these
animals, 45% showed head nodding, (stage 2), 10% exhibited forelimb clonus (stage 3);
16% displayed forelimb clonus with rearing (stage 4), and the remaining 29% showed
forelimb clonus with rearing and fallings (stage 5).
Differentially expressed genes in the CA3 hippocampus of rats that displayed HS
Differentially expressed (DE) genes between were statistically determined at four post-
HS stages to determine individual gene expression changes between HS and CTRL
groups. The main DE genes in terms of fold changes and the enriched functions for each
time interval are displayed in Tables 1 to 3. Microarray results were validated using qPCR
experiments for selected genes (Figure S2). These genes were selected based on their
differential expression at specific time intervals and relevance for epileptic processes.
P12 analysis. 89 DE genes (80 up and 9 down-regulated) were observed between the
experimental groups at P12. These genes were found to be associated with Ras pathway,
amino acid metabolism, apoptosis and ion transmembrane transport. Among these genes,
the down-regulated gene Hes6 participates in neuronal differentiation (Bae et al., 2000)
whereas the up-regulated gene Nlk codes for a kinase that contributes to cell proliferation
and differentiation during nervous system development (Ishitani and Ishitani, 2013).
Dis
ease
Mo
dels
& M
echa
nism
s •
DM
M •
Acc
epte
d m
anus
crip
t
P30 analysis. The 83 DE genes (56 up and 27 down-regulated) at P30 were related to
organic anion transport, tissue morphogenesis and positive regulation of kinase activity.
Interestingly, the protein encoded by the down-regulated gene Gfra2 influences the
severity of kindling-evoked seizures in mice (Nanobashvili et al., 2003).
P60 analysis. The 263 DE genes (162 up and 101 down-regulated) at P60 were related
to Wnt, Rap1, Notch, HIF and interferon signaling pathways, platelet activation, focal
adhesion, mRNA processing, chromatin organization, regulation of cell migration and
cell differentiation. Among these genes, the up-regulated genes Sox9 (Guo et al., 2012)
and Tpt1 (Johansson and Simonsson, 2010) play a role in the self-renewal of stem cells.
P120 analysis. The 341 down-regulated genes were mostly associated with MAPK, JAK-
STAT and Wnt pathways, transport of ions and amino acids, cell morphogenesis and
neurotransmitters transport. In particular, the down-regulated genes Rhox8 (Artegiani et
al., 2015) and Mta2 (MuhChyi et al., 2013) are involved in neurogenesis.
Modules and hubs related to hyperthermic seizures at each time interval
We analyzed co-expression patterns in CA3 hippocampal transcriptome data to reveal
modules of co-expressed genes and their relationship with a seizure-related state. We
constructed two separate networks for each time interval using, respectively, the HS and
the CTRL samples. This analysis allowed the comparison of module preservation and
connectivity between CTRL and HS networks.
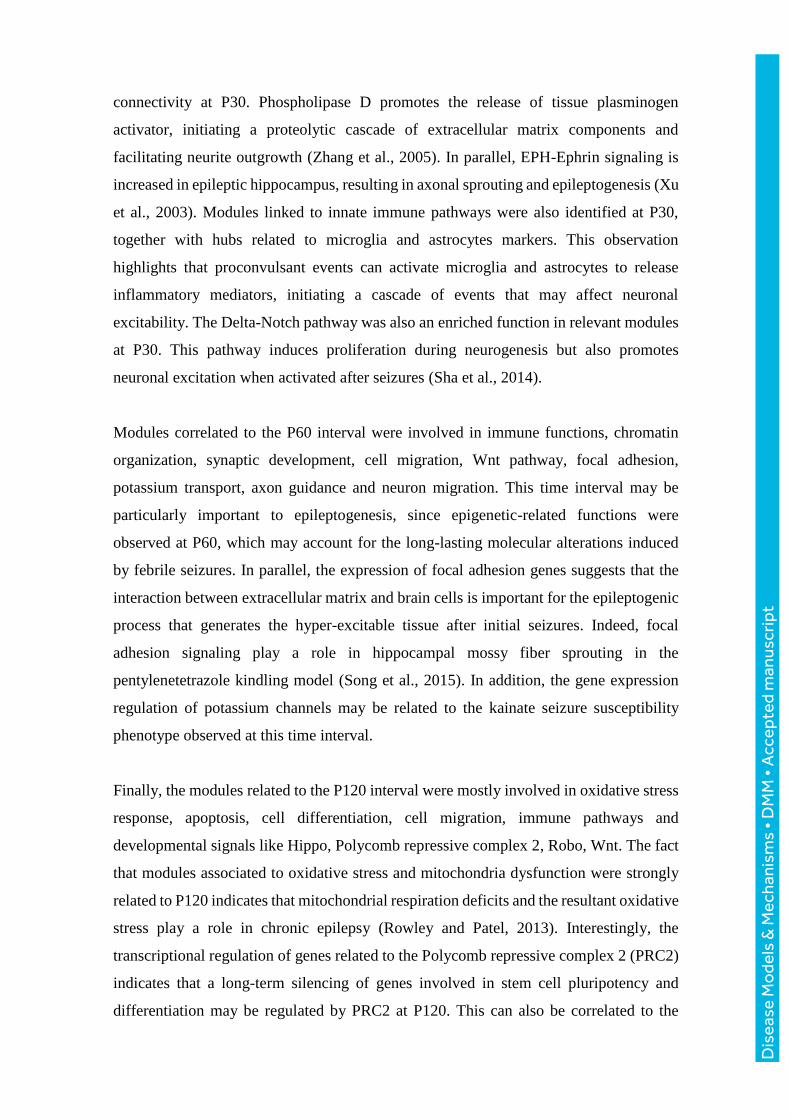
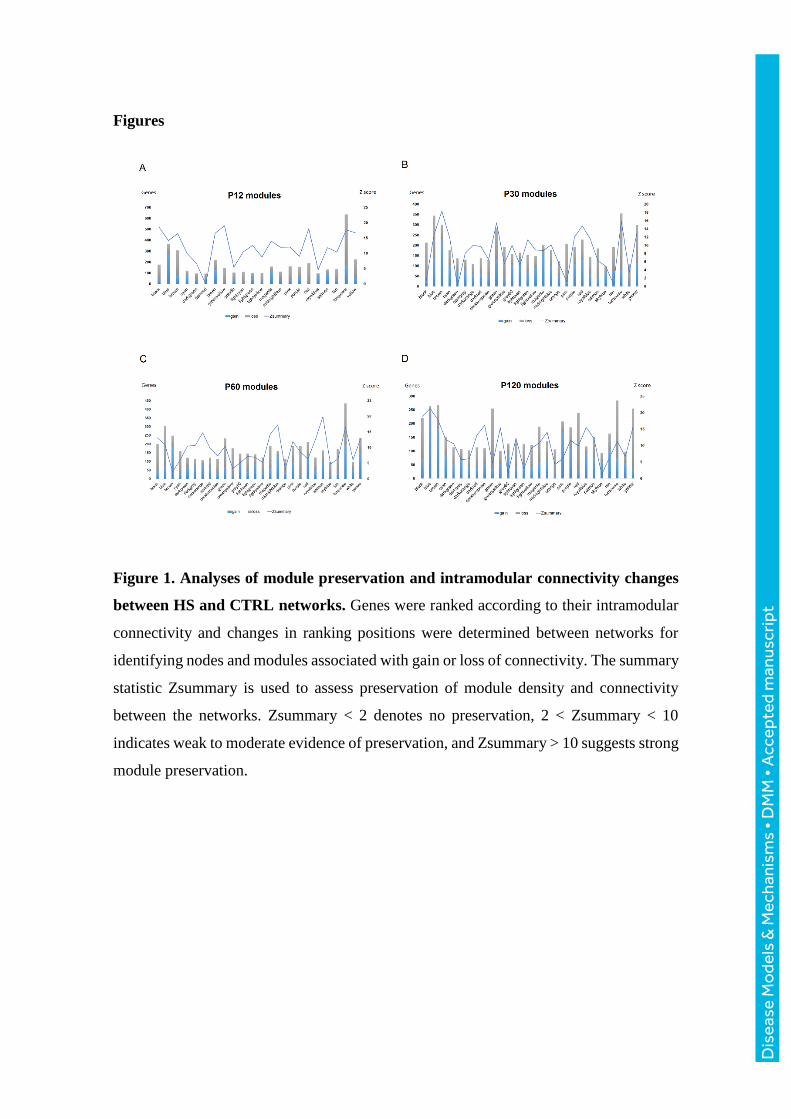
Nodes were rank-ordered by their intramodular connectivity and compared between the
HS and CTRL networks. This analysis allowed the evaluation of module preservation
between the networks and the identification of modules that gain connectivity in the HS
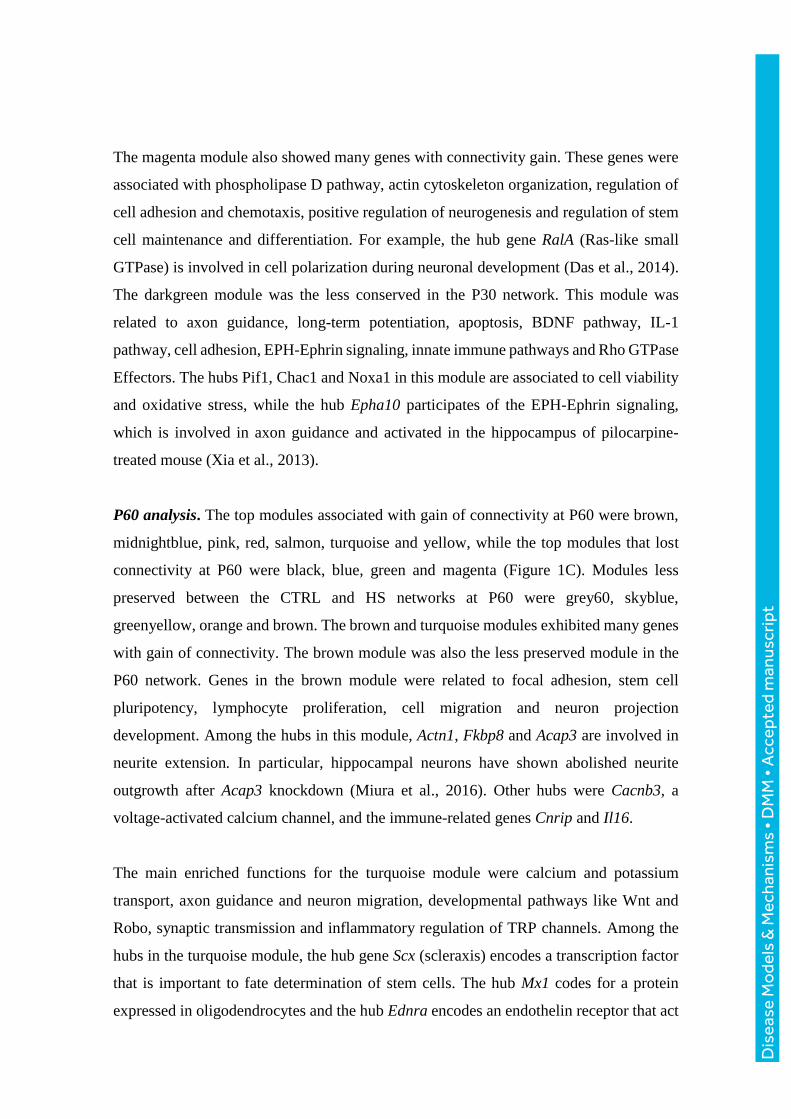
network (Figure 1). Modules that show increased connectivity are considered to be related
to gain of function in the HS group. The hubs and main functions enriched by the genes
in these modules are shown in Tables S2 to S5.
Dis
ease
Mo
dels
& M
echa
nism
s •
DM
M •
Acc
epte
d m
anus
crip
t

P12 analysis. The top modules associated with gain of connectivity in the P12
comparison were blue, green, magenta and salmon, while the top modules that lost
connectivity at P12 were brown, red and turquoise (Figure 1A). Modules less preserved
between the CTRL and HS networks at P12 were darkred, royalblue, grey60 and
darkgreen. Among these modules, the blue module showed the highest number of genes
with gain of connectivity. This module exhibited enriched functions related to apoptosis,
regulation of cell adhesion and migration, cellular response to stress and axonogenesis.
The hub Bcar1 in this module codes for an adaptor protein relevant to cell migration and
axon elongation (Huang et al., 2006), while the hub Entpd2 is a gene that controls
progenitor cell proliferation in brain neurogenic niches (Gampe et al., 2015).
The turquoise module also encompassed many genes showing gain of connectivity. This
module was associated with apoptosis, tight junction, synaptic transmission, neuron
differentiation, immune-related pathways, Hippo pathway and Wnt pathway. The hubs
Rtn2 and Rtn3 in the module turquoise are part of the reticulon protein family that play a
role in neuronal sprouting. Indeed, mice overexpressing Rtn3 were described to develop
neuritic abnormalities (Hu et al., 2007).The darkred module was the less preserved
module at P12. This module was related to pathways linked to neurotrophin, FGFR, HIF-
1 and Wnt, apoptosis, activation of NMDA receptors, cell differentiation and
axonogenesis. The hub Nefl in this module is a marker of differentiated neurons, while
the hub Ssbp3 encodes a protein that induces the differentiation of embryonic stem cells
into trophoblast-like cells (Liu et al., 2016).
P30 analysis. The top modules associated with gain of connectivity at P30 were brown,
green, lightcyan, magenta and red, while modules that lost connectivity at P30 were black,
blue, greenyellow, pink, turquoise and yellow (Figure 1B). Modules less preserved
between the CTRL and HS networks at P30 were darkred, turquoise, pink, darkturquoise
and green. Among the modules in the P30 network, the brown module showed the highest
number of genes with gain of connectivity. This module showed enriched functions
related to cellular metabolism, protein degradation pathways, cell differentiation,
apoptosis and synaptic transmission. The hub Osm in this module encodes oncostatin M,
that inhibits the proliferation of neural precursor cells (Beatus et al., 2011).
Dis
ease
Mo
dels
& M
echa
nism
s •
DM
M •
Acc
epte
d m
anus
crip
t
The magenta module also showed many genes with connectivity gain. These genes were
associated with phospholipase D pathway, actin cytoskeleton organization, regulation of
cell adhesion and chemotaxis, positive regulation of neurogenesis and regulation of stem
cell maintenance and differentiation. For example, the hub gene RalA (Ras-like small
GTPase) is involved in cell polarization during neuronal development (Das et al., 2014).
The darkgreen module was the less conserved in the P30 network. This module was
related to axon guidance, long-term potentiation, apoptosis, BDNF pathway, IL-1
pathway, cell adhesion, EPH-Ephrin signaling, innate immune pathways and Rho GTPase
Effectors. The hubs Pif1, Chac1 and Noxa1 in this module are associated to cell viability
and oxidative stress, while the hub Epha10 participates of the EPH-Ephrin signaling,
which is involved in axon guidance and activated in the hippocampus of pilocarpine-
treated mouse (Xia et al., 2013).
P60 analysis. The top modules associated with gain of connectivity at P60 were brown,
midnightblue, pink, red, salmon, turquoise and yellow, while the top modules that lost
connectivity at P60 were black, blue, green and magenta (Figure 1C). Modules less
preserved between the CTRL and HS networks at P60 were grey60, skyblue,
greenyellow, orange and brown. The brown and turquoise modules exhibited many genes
with gain of connectivity. The brown module was also the less preserved module in the
P60 network. Genes in the brown module were related to focal adhesion, stem cell
pluripotency, lymphocyte proliferation, cell migration and neuron projection
development. Among the hubs in this module, Actn1, Fkbp8 and Acap3 are involved in
neurite extension. In particular, hippocampal neurons have shown abolished neurite
outgrowth after Acap3 knockdown (Miura et al., 2016). Other hubs were Cacnb3, a
voltage-activated calcium channel, and the immune-related genes Cnrip and Il16.
The main enriched functions for the turquoise module were calcium and potassium
transport, axon guidance and neuron migration, developmental pathways like Wnt and
Robo, synaptic transmission and inflammatory regulation of TRP channels. Among the
hubs in the turquoise module, the hub gene Scx (scleraxis) encodes a transcription factor
that is important to fate determination of stem cells. The hub Mx1 codes for a protein
expressed in oligodendrocytes and the hub Ednra encodes an endothelin receptor that act
Dis
ease
Mo
dels
& M
echa
nism
s •
DM
M •
Acc
epte
d m
anus
crip
t
as an axonal guidance cue for sympathetic neurons (Makita et al., 2008). Finally, the
greenyellow module was also little preserved at P60. This module was related to Wnt
pathway, p53 pathway, Axonal guidance, neuron cell morphogenesis, protein
ubiquitination, synaptic transmission. Among the hubs in this module, the gene Ptprt
codes for a tyrosine kinase that regulates synaptic formation and neuronal
development(Lee, 2015). Another relevant hubs were Pomgnt1, which encodes an
enzyme that performs protein glycan modification during brain development (Dwyer et
al., 2015) and Taok2, whose encoded kinase is essential for dendrite morphogenesis (de
Anda et al., 2012).
P120 analysis. The top modules associated with gain of connectivity at P120 were blue,
brown, grey60, pink, purple, royalblue and tan, while the top modules that lost
connectivity at P120 were black, green, magenta, red, turquoise and yellow (Figure 1D).
Modules less preserved between the CTRL and HS networks at P120 were green, grey60,
lightgreen, orange and skyblue. Genes in blue module were associated with MAPK
pathway, extracellular matrix organization, synaptic transmission, apoptosis, cell
differentiation, regulation of neurogenesis, neuron projection guidance and response to
oxidative stress. Among the hub genes in this module, Ndufb3 and Ndufs5 participate in
the oxidative phosphorylation process, Npdc1 is a regulator of neuronal proliferation and
differentiation, and Shank3 modulates NMDA receptor levels at axon terminals (Halbedl
et al., 2016). The brown module was related to synaptic transmission, focal adhesion,
regulation of actin cytoskeleton, axon guidance, signaling by Wnt, Signaling by Robo and
neuron differentiation. Among the hubs in this module, Gria1 codes for a glutamate
AMPA receptor and Robo2 is part of the Robo pathway that regulates axon guidance.
The grey60 and skyblue modules were the less preserved in the P120 analysis. The grey60
module was associated with immune functions like Fc gamma R-mediated phagocytosis,
lymphocyte proliferation and activation, regulation of NF-κB signaling, as well with cell
projection organization and cell morphogenesis. Among the hubs in this module, Gatad2a
is part of the chromatin-remodeling complex NuRD, which regulates dendrite pruning
and neuronal connectivity (Yamada et al., 2014). In parallel, the skyblue module was
related to TNFα-NFκB pathway, hyaluronan metabolism, Wnt pathway, neuron
differentiation and cell migration. The hub Ska3, for example, encodes a spindle
checkpoint protein that promotes neurite outgrowth (Tong et al., 2013). Moreover, Hyal2
Dis
ease
Mo
dels
& M
echa
nism
s •
DM
M •
Acc
epte
d m
anus
crip
t
and Hmmr participate of hyaluronan metabolism, which is relevant for cell motility, while
Avl9 is also involved in cell migration.
Modules and genes associated to seizure susceptibility or resistance time intervals
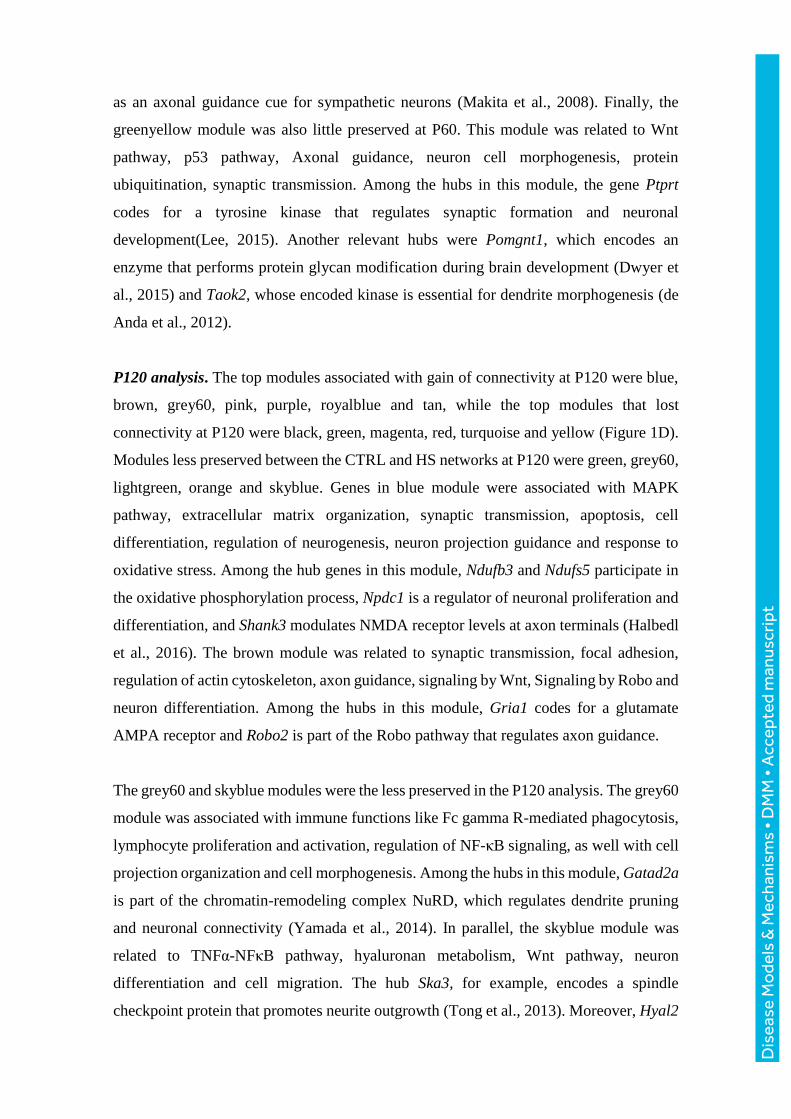
A single co-expression network was also constructed using the gene expression data from
all samples obtained in this study. The modules obtained in this network were then
correlated to each time interval for disclosing modules linked to specific time intervals
(Figure 2). This analysis allowed the identification of modules correlated to time intervals
involved in seizure resistance (P12 and P30) and susceptibility (P60 and P120). For
example, the blue module was positively correlated to P12 and the magenta and purple
modules were positively correlated to P30. The pink, greenyellow and turquoise modules
were in turn mainly related to P60. Finally, the green module was positively correlated to
P120, and the modules brown and red were correlated to P60 and P120.
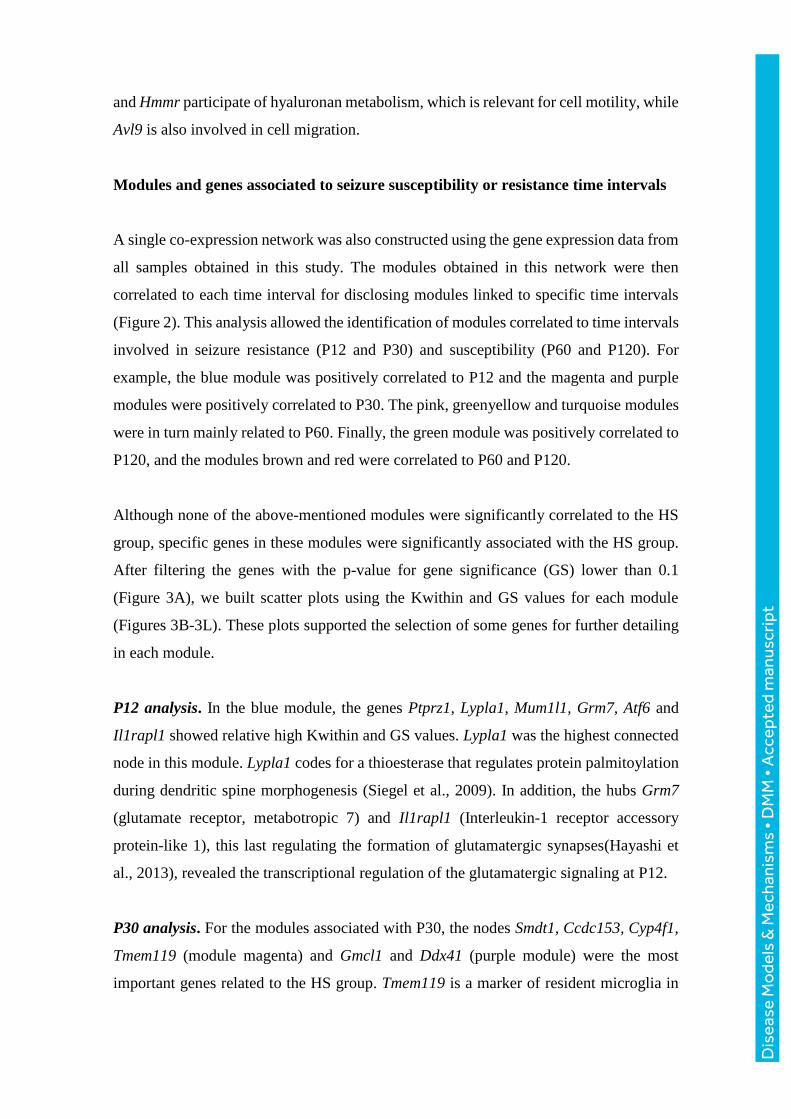
Although none of the above-mentioned modules were significantly correlated to the HS
group, specific genes in these modules were significantly associated with the HS group.
After filtering the genes with the p-value for gene significance (GS) lower than 0.1
(Figure 3A), we built scatter plots using the Kwithin and GS values for each module
(Figures 3B-3L). These plots supported the selection of some genes for further detailing
in each module.
P12 analysis. In the blue module, the genes Ptprz1, Lypla1, Mum1l1, Grm7, Atf6 and
Il1rapl1 showed relative high Kwithin and GS values. Lypla1 was the highest connected
node in this module. Lypla1 codes for a thioesterase that regulates protein palmitoylation
during dendritic spine morphogenesis (Siegel et al., 2009). In addition, the hubs Grm7
(glutamate receptor, metabotropic 7) and Il1rapl1 (Interleukin-1 receptor accessory
protein-like 1), this last regulating the formation of glutamatergic synapses(Hayashi et
al., 2013), revealed the transcriptional regulation of the glutamatergic signaling at P12.
P30 analysis. For the modules associated with P30, the nodes Smdt1, Ccdc153, Cyp4f1,
Tmem119 (module magenta) and Gmcl1 and Ddx41 (purple module) were the most
important genes related to the HS group. Tmem119 is a marker of resident microglia in
Dis
ease
Mo
dels
& M
echa
nism
s •
DM
M •
Acc
epte
d m
anus
crip
t
human brain (Satoh et al., 2016), while Cyp4f1 expression is increased in hippocampal
astrocytes of rats subjected to brain injury (Wang et al., 2008).
P60 analysis. The pink, greenyellow and turquoise modules in turn were mainly related
to P60. The main hubs associated to the HS group were Cyb5d2, Ubqln1, Rc3h1
(greenyellow), Cml1, Ralbp1 and Rab2b (pink), and Tma7, Sumo2, Apln, Foxm1
(turquoise). Among these genes, Ubqln1 (Zhang et al, 2015) and Ralbp1 (Bae et al., 2013)
regulate seizure threshold via the GABAergic signaling. In parallel, Rab2b (Ayala et al.,
1990) and Foxm1 (Ueno et al., 2008) play a role for neuronal differentiation. Finally, the
genes Cyb5d2, Sumo2 (Datwyler et al., 2011) and Apln (Zhang et al., 2011) participate
in injury protection mechanisms.
P120 analysis. The brown and red modules were also correlated to the late stages of the
experimental model (P60 and P120). Several of the hubs and genes with top GS values in
the brown module are closely related with epilepsy. Stim2 encodes a calcium sensor
protein that modulates neuronal activity in a model of chronic epilepsy (Steinbeck et al.,
2011). Plk2 is a gene required for plasticity of hippocampal neurons during epileptiform
activity (Seeburg and Sheng, 2008), whereas Cacng3 encodes a calcium channel
associated to childhood absence epilepsy (Everett et al., 2007). For the red module, some
of the relevant genes in terms of Kwithin or GS were Atmin, which is protective against
oxidative stress in the aging brain (Kanu et al., 2010), and Ndel1 that regulates neuronal
migration (Sasaki et al., 2005). Finally, the green module (linked to P120) exhibited many
genes significantly correlated to the HS group. Among the hubs in this module, Slc25a9,
Ucp2, Ndufv3, Mrpl9 and Hspd1 are all located in mitochondria.
Frequent functions related to hyperthermic seizures at different time points
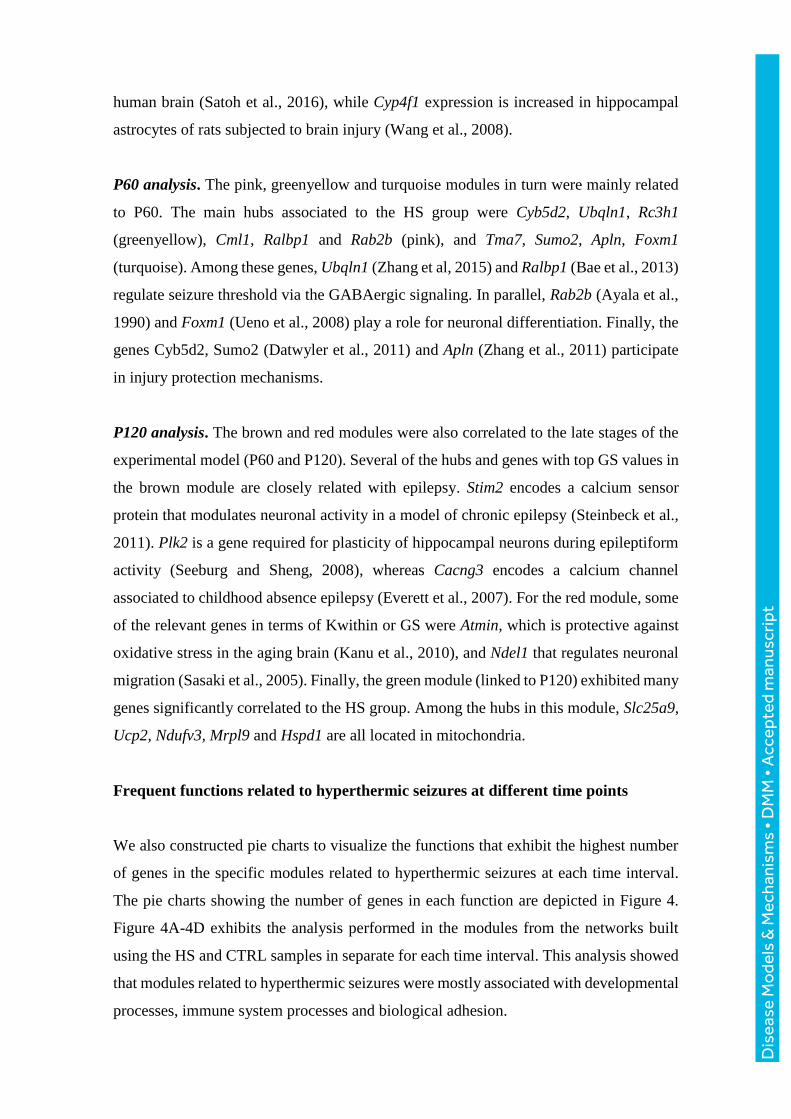
We also constructed pie charts to visualize the functions that exhibit the highest number
of genes in the specific modules related to hyperthermic seizures at each time interval.
The pie charts showing the number of genes in each function are depicted in Figure 4.
Figure 4A-4D exhibits the analysis performed in the modules from the networks built
using the HS and CTRL samples in separate for each time interval. This analysis showed
that modules related to hyperthermic seizures were mostly associated with developmental
processes, immune system processes and biological adhesion.
Dis
ease
Mo
dels
& M
echa
nism
s •
DM
M •
Acc
epte
d m
anus
crip
t

Discussion
In this study, we investigated the molecular pathways underlying the process by which
neonatal FS could contribute to seizure recurrence at a later age, using a rat model of HS.
The temporal analysis of hippocampal gene co-expression networks enabled the
identification of co-expression modules and hub genes relevant to the acute, latent and
chronic phases of the animal mode. In general, hub genes and HS-related modules were
mostly related to functions involved in immune response, cell adhesion and neurogenesis.
Inflammatory-related functions were enriched by relevant modules during the acute and
advanced stages of the experimental model. Previous experiments have disclosed
mechanisms by which inflammation mediates epileptogenesis, leading to the
development of MTLE after complex FS (Choy et al., 2014). Moreover, inflammatory
markers are increased in hippocampus and correlate to epilepsy development in the rat
model of HS (Patterson et al., 2015).
Cell adhesion functions were also frequently observed in relevant modules from
hippocampal gene co-expression networks of rats that displayed HS. Notably, cell
adhesion molecules participate in many biological functions relevant for epilepsy
development such as inflammatory processes, synaptic plasticity, signal transduction,
neuronal sprouting and cell migration (Engel et al., 2008). In fact, experimental FS trigger
a transcriptional response that leads to tissue structural remodeling in hippocampus
during the acute and latent phases of the HS model in mice (Jongbloets et al., 2015).
Genes and modules associated with neurogenesis were regulated in all evaluated time
intervals. Neurogenesis in hippocampal dentate gyrus was previously characterized after
neonatal FS (Scott RC, 2012). These cells are generated in the subgranular zone and
migrate to the dentate granular cell layer. The ectopic granule cells send their axons and
form excitatory connections with CA3, leading to enhanced hippocampal excitability
after FS (Scott RC, 2012). Nevertheless, neurogenesis is still poorly understood in the
CA3 region. Hippocampal neurogenesis was already shown to occur in CA3 following
kainic acid administration in neonatal rats at P7. In these animals, the number of BrdU-
Dis
ease
Mo
dels
& M
echa
nism
s •
DM
M •
Acc
epte
d m
anus
crip
t

positive cells increased in CA3 at P40 and P60, suggesting a late stimulation of
neurogenesis by kainic acid in neonatal rats (Dong et al., 2003). Neural stem cells from
CA3 are capable of differentiating in vitro to neurons, astrocytes, and oligodendrocytes.
Interestingly, postnatal age influences the extent to which progenitor cells give rise to
differentiated cells in CA3. It is observed that neuronal differentiation decreases whereas
oligodendrocyte differentiation increases with age (Shetty and Hattiangady, 2013).
Biological functions activated at P12 revealed the response to brain injury just after HS,
like amino acid metabolism, apoptosis, immune response, response to cellular stress and
ion transmembrane transport. Interestingly, many functions related to neuronal
differentiation, axonogenesis and regulation of cell migration were already activated one
day after the hyperthermia episode. In fact, recent data suggested that neurogenesis is
induced by acute seizures or precipitating insults, whereas the capacity of neuronal
recruitment and proliferation substantially decreases in the chronic phase of epilepsy
(Huang et al., 2015).
The regulation of several genes from the Hippo and Wnt pathways at P12 suggests that
seizure-induced injury may recapitulate pathways related to development and
homeostasis in the brain. These two pathways are interconnected and regulate one another
to promote a proper tissue response (Konsavage and Yochum, 2013). Moreover, the fact
that Wnt pathway modulates neuroimmune interactions after injury places this pathway
as an intersecting player between inflammation and neurogenesis (Marchetti and
Pluchino, 2013).
Modules involved in glycolysis and gluconeogenesis were related to the HS group at P30,
a time point linked to a seizure resistance phenotype. Previous studies have shown that
glycolysis increases during seizures, generating lactic acid and providing energy during
seizures. However, lactic acid reduces tissue pH and generates metabolic acidosis, which
ultimately terminates seizures (Yang et al., 2013). Therefore, one of the mechanisms
underlying seizure tolerance at P30 may be linked to the metabolic acidosis in the brain.
Relevant modules at P30 were also involved in neurogenesis, such as cell differentiation,
axon guidance, stem cell differentiation and regulation of cell adhesion. Indeed, genes
linked to the phospholipase D and EPH-Ephrin pathways were associated with gain of
Dis
ease
Mo
dels
& M
echa
nism
s •
DM
M •
Acc
epte
d m
anus
crip
t
connectivity at P30. Phospholipase D promotes the release of tissue plasminogen
activator, initiating a proteolytic cascade of extracellular matrix components and
facilitating neurite outgrowth (Zhang et al., 2005). In parallel, EPH-Ephrin signaling is
increased in epileptic hippocampus, resulting in axonal sprouting and epileptogenesis (Xu
et al., 2003). Modules linked to innate immune pathways were also identified at P30,
together with hubs related to microglia and astrocytes markers. This observation
highlights that proconvulsant events can activate microglia and astrocytes to release
inflammatory mediators, initiating a cascade of events that may affect neuronal
excitability. The Delta-Notch pathway was also an enriched function in relevant modules
at P30. This pathway induces proliferation during neurogenesis but also promotes
neuronal excitation when activated after seizures (Sha et al., 2014).
Modules correlated to the P60 interval were involved in immune functions, chromatin
organization, synaptic development, cell migration, Wnt pathway, focal adhesion,
potassium transport, axon guidance and neuron migration. This time interval may be
particularly important to epileptogenesis, since epigenetic-related functions were
observed at P60, which may account for the long-lasting molecular alterations induced
by febrile seizures. In parallel, the expression of focal adhesion genes suggests that the
interaction between extracellular matrix and brain cells is important for the epileptogenic
process that generates the hyper-excitable tissue after initial seizures. Indeed, focal
adhesion signaling play a role in hippocampal mossy fiber sprouting in the
pentylenetetrazole kindling model (Song et al., 2015). In addition, the gene expression
regulation of potassium channels may be related to the kainate seizure susceptibility
phenotype observed at this time interval.
Finally, the modules related to the P120 interval were mostly involved in oxidative stress
response, apoptosis, cell differentiation, cell migration, immune pathways and
developmental signals like Hippo, Polycomb repressive complex 2, Robo, Wnt. The fact
that modules associated to oxidative stress and mitochondria dysfunction were strongly
related to P120 indicates that mitochondrial respiration deficits and the resultant oxidative
stress play a role in chronic epilepsy (Rowley and Patel, 2013). Interestingly, the
transcriptional regulation of genes related to the Polycomb repressive complex 2 (PRC2)
indicates that a long-term silencing of genes involved in stem cell pluripotency and
differentiation may be regulated by PRC2 at P120. This can also be correlated to the
Dis
ease
Mo
dels
& M
echa
nism
s •
DM
M •
Acc
epte
d m
anus
crip
t
several down-regulated genes observed at P120 in this experimental model. Interestingly,
it was recently shown that PRC2 silences genes responsible for neurodegeneration in
mouse striatal neurons (von Schimmelmann et al., 2016).
Other interesting functions were also enriched in HS-related modules at P30, P60 and
P120. The CCK (Cholecystokinin) signaling pathway for example is inversely associated
with pharmacoresistance in epilepsy, because it controls the activity of hippocampal
inhibitory interneurons (Mirza et al., 2011). Another relevant function was the
gonadotropin releasing hormone (GnRH) pathway, that was involved in epileptogenesis
after enrichment analysis of microarray datasets (Subramanian et al., 2005).
This study has some limitations. The first one is related to the use of mixed cell
populations from hippocampal CA3 samples, which does not allow the determination of
specific cell-type roles among the identified transcriptional changes. The other limitation
comprises the inclusion of animals with distinct seizure behaviors in the same
experimental group. This approach was taken due to feasibility reasons, because
otherwise a much larger number of animals would be necessary, considering the mortality
inherent to the protocol, number of time points and phenotypic variability issues.
Conclusions
To our knowledge, this is the first study to provide a temporal network analysis of rat
CA3 hippocampal gene expression profiles after hyperthermia-induced seizures. The
analysis revealed transcriptional modules that may relate to epilepsy development after
febrile seizures, contributing to the identification of potential targets for the therapeutic
treatment of MTLE-FS. Our data suggest that drugs interfering with developmental and
immune pathways, like Wnt, Hippo, Notch, JAK-STAT and MAPK, could constitute the
basis of effective therapies for preventing MTLE onset after early-life febrile seizures.
Further studies using orthogonal methods like immunohistochemistry will help to identify
specific hippocampal cell types related to changes observed after hyperthermic seizures.
Dis
ease
Mo
dels
& M
echa
nism
s •
DM
M •
Acc
epte
d m
anus
crip
t
Acknowledgements
This work was supported by Fundação de Amparo à Pesquisa do Estado de São Paulo
(FAPESP), grant 2011/50761-2, and Conselho Nacional de Desenvolvimento Científico
e Tecnológico (CNPq), grant 307626/2014-8. This work was also supported by the NAP
e-Science USP.
Dis
ease
Mo
dels
& M
echa
nism
s •
DM
M •
Acc
epte
d m
anus
crip
t

References
Alegro, M., Silva, A. V., Bando, S. Y., De Deus Lopes, R., Martins De Castro, L. H., Hungtsu,
W., Moreira-Filho, C. A. and Amaro, E. (2012). Texture analysis of high resolution MRI
allows discrimination between febrile and afebrile initial precipitating injury in mesial
temporal sclerosis. Magn. Reson. Med. 68, 1647–1653.
Artegiani, B., de Jesus Domingues, A. M., Bragado Alonso, S., Brandl, E., Massalini, S.,
Dahl, A. and Calegari, F. (2015). Tox: a multifunctional transcription factor and novel
regulator of mammalian corticogenesis. EMBO J. 34, 896–910.
Ayala, J., Touchot, N., Zahraoui, A., Tavitian, A. and Prochiantz, A. (1990). The product of
rab2, a small GTP binding protein, increases neuronal adhesion, and neurite growth in vitro.
Neuron 4, 797–805.
Bae, S., Bessho, Y., Hojo, M. and Kageyama, R. (2000). The bHLH gene Hes6, an inhibitor of
Hes1, promotes neuronal differentiation. Development 127, 2933–2943.
Bae, Y. S., Chung, W., Han, K., Park, K. Y., Kim, H., Kim, E. and Kim, M. H. (2013). Down-
regulation of RalBP1 expression reduces seizure threshold and synaptic inhibition in mice.
Biochem. Biophys. Res. Commun. 433, 175–180.
Bando, S. Y., Silva, F. N., Costa, L. D. F., Silva, A. V., Pimentel-Silva, L. R., Castro, L. H.
M., Wen, H. T., Amaro, E. and Moreira-Filho, C. A. (2013). Complex network analysis
of CA3 transcriptome reveals pathogenic and compensatory pathways in refractory temporal
lobe epilepsy. PLoS One 8,.
Baram, T. Z., Gerth, A. and Schultz, L. (1997). Febrile seizures: An appropriate-aged model
suitable for long-term studies. Dev. Brain Res. 98, 265–270.
Beatus, P., Jhaveri, D. J., Walker, T. L., Lucas, P. G., Rietze, R. L., Cooper, H. M.,
Morikawa, Y. and Bartlett, P. F. (2011). Oncostatin M regulates neural precursor activity
in the adult brain. Dev. Neurobiol. 71, 619–633.
Bender, R. A., Dubé, C., Gonzalez-Vega, R., Mina, E. W. and Baram, T. Z. (2003). Mossy
fiber plasticity and enhanced hippocampal excitability, without hippocampal cell loss or
altered neurogenesis, in an animal model of prolonged febrile seizures. Hippocampus 13,
399–412.
Bender, R. A., Dubé, C. and Baram, T. Z. (2004). Febrile seizures and mechanisms of
epileptogenesis: insights from an animal model. Adv. Exp. Med. Biol. 548, 213–25.
Benjamini Y, H. Y. (1995). Controlling the false discovery rate: a practical and powerful
approach to multiple testing. J Roy Stat. Soc Ser B 10, 130–142.
Chen, E. Y., Tan, C. M., Kou, Y., Duan, Q., Wang, Z., Meirelles, G. V., Clark, N. R. and
Ma’ayan, A. (2013). Enrichr: interactive and collaborative HTML5 gene list enrichment
analysis tool. BMC Bioinformatics 14, 128.
Choy, M., Dubé, C. M., Ehrengruber, M. and Baram, T. Z. (2014). Inflammatory processes,
febrile seizures, and subsequent epileptogenesis. Epilepsy Curr. 14, 15–22.
Chungath, M. and Shorvon, S. (2008). The mortality and morbidity of febrile seizures. Nat.
Clin. Pract. Neurol. 4, 610–21.
Correa-Costa, M., Azevedo, H., Amano, M. T., Gonçalves, G. M., Hyane, M. I., Cenedeze,
M. A., Renesto, P. G., Pacheco-Silva, A., Moreira-Filho, C. A. and Câmara, N. O. S. (2012). Transcriptome Analysis of Renal Ischemia/Reperfusion Injury and Its Modulation
by Ischemic Pre-Conditioning or Hemin Treatment. PLoS One 7,.
Das, A., Gajendra, S., Falenta, K., Oudin, M. J., Peschard, P., Feng, S., Wu, B., Marshall,
C. J., Doherty, P., Guo, W., et al. (2014). RalA promotes a direct exocyst-Par6 interaction
to regulate polarity in neuronal development. J. Cell Sci. 127, 686–99.
Datwyler, A. L., Lättig-Tünnemann, G., Yang, W., Paschen, W., Lee, S. L. L., Dirnagl, U.,
Dis
ease
Mo
dels
& M
echa
nism
s •
DM
M •
Acc
epte
d m
anus
crip
t

Endres, M. and Harms, C. (2011). SUMO2/3 conjugation is an endogenous
neuroprotective mechanism. J. Cereb. Blood Flow Metab. 31, 2152–2159.
de Anda, F. C., Rosario, A. L., Durak, O., Tran, T., Gräff, J., Meletis, K., Rei, D., Soda, T.,
Madabhushi, R., Ginty, D. D., et al. (2012). Autism spectrum disorder susceptibility gene
TAOK2 affects basal dendrite formation in the neocortex. Nat. Neurosci. 15, 1022–31.
Dong, H., Csernansky, C. a, Goico, B. and Csernansky, J. G. (2003). Hippocampal
neurogenesis follows kainic acid-induced apoptosis in neonatal rats. J. Neurosci. 23, 1742–
1749.
Dube, C., Chen, K., Eghbal-Ahmadi, M., Brunson, K., Soltesz, I. and Baram, T. Z. (2000).
Prolonged febrile seizures in the immature rat model enhance hippocampal excitability long
term. Ann. Neurol. 47, 336–44.
Dubé, C., Richichi, C., Bender, R. A., Chung, G., Litt, B. and Baram, T. Z. (2006). Temporal
lobe epilepsy after experimental prolonged febrile seizures: prospective analysis. Brain 129,
911–22.
Dubé, C. M., Ravizza, T., Hamamura, M., Zha, Q., Keebaugh, A., Fok, K., Andres, A. L.,
Nalcioglu, O., Obenaus, A., Vezzani, A., et al. (2010). Epileptogenesis provoked by
prolonged experimental febrile seizures: mechanisms and biomarkers. J. Neurosci. 30,
7484–94.
Dubé, C. M., McClelland, S., Choy, M., Brewster, A. L., Noam, Y. and Baram, T. Z. (2012).
Fever, febrile seizures and epileptogenesis.
Dwyer, C. A., Katoh, T., Tiemeyer, M. and Matthews, R. T. (2015). Neurons and glia modify
receptor protein-tyrosine phosphatase ζ (RPTPζ)/phosphacan with cell-specific O-mannosyl
glycans in the developing brain. J. Biol. Chem. 290, 10256–10273.
Engel, J. (2001). Neuroscientist Mesial Temporal Lobe Epilepsy : What Have We Learned?
Neuroscientist 340–52.
Engel, J. J. (2011). Another good reason to consider surgical treatment for epilepsy more often
and sooner. Arch. Neurol. 68, 707–708.
Engel, J., Pedley, T. A. and Aicardi, J. (2008). Epilepsy : a comprehensive textbook.
Everett, K. V, Chioza, B., Aicardi, J., Aschauer, H., Brouwer, O., Callenbach, P., Covanis,
A., Dulac, O., Eeg-Olofsson, O., Feucht, M., et al. (2007). Linkage and association
analysis of CACNG3 in childhood absence epilepsy. Eur. J. Hum. Genet. 15, 463–472.
French, J. A. (2012). Febrile seizures: possible outcomes. Neurology 79, e80-2.
Gaiteri, C., Ding, Y., French, B., Tseng, G. C. and Sibille, E. (2014). Beyond modules and
hubs: The potential of gene coexpression networks for investigating molecular mechanisms
of complex brain disorders. Genes, Brain Behav. 13, 13–24.
Gampe, K., Stefani, J., Hammer, K., Brendel, P., Potzsch, A., Enikolopov, G., Enjyoji, K.,
Acker-Palmer, A., Robson, S. C. and Zimmermann, H. (2015). NTPDase2 and
purinergic signaling control progenitor cell proliferation in neurogenic niches of the adult
mouse brain. Stem Cells 33, 253–264.
Gonzalez-Ramirez, M., Salgado-Ceballos, H., Orozco-Suarez, S. A. and Rocha, L. (2009).
Hyperthermic seizures and hyperthermia in immature rats modify the subsequent
pentylenetetrazole-induced seizures. Seizure 18, 533–536.
Gorter, J. A., van Vliet, E. A., Aronica, E., Breit, T., Rauwerda, H., Lopes da Silva, F. H.
and Wadman, W. J. (2006). Potential new antiepileptogenic targets indicated by
microarray analysis in a rat model for temporal lobe epilepsy. J. Neurosci. 26, 11083–110.
Guo, W., Keckesova, Z., Donaher, J. L., Shibue, T., Tischler, V., Reinhardt, F., Itzkovitz,
S., Noske, A., Zurrer-Hardi, U., Bell, G., et al. (2012). Slug and Sox9 cooperatively
determine the mammary stem cell state. Cell 148, 1015–1028.
Halbedl, S., Schoen, M., Feiler, M. S., Boeckers, T. M. and Schmeisser, M. J. (2016). Shank3
is localized in axons and presynaptic specializations of developing hippocampal neurons
and involved in the modulation of NMDA receptor levels at axon terminals. J. Neurochem.
26–32.
Hayashi, T., Yoshida, T., Ra, M., Taguchi, R. and Mishina, M. (2013). IL1RAPL1 Associated
with Mental Retardation and Autism Regulates the Formation and Stabilization of
Glutamatergic Synapses of Cortical Neurons through RhoA Signaling Pathway. PLoS One
Dis
ease
Mo
dels
& M
echa
nism
s •
DM
M •
Acc
epte
d m
anus
crip
t

8,.
Hu, X., Shi, Q., Zhou, X., He, W., Yi, H., Yin, X., Gearing, M., Levey, A. and Yan, R. (2007).
Transgenic mice overexpressing reticulon 3 develop neuritic abnormalities. EMBO J. 26,
2755–67.
Huang, J., Sakai, R. and Furuichi, T. (2006). The docking protein Cas links tyrosine
phosphorylation signaling to elongation of cerebellar granule cell axons. Mol. Biol. Cell 17,
3187–96.
Huang, C., Fu, X.-H., Zhou, D. and Li, J.-M. (2015). The Role of Wnt/β-Catenin Signaling
Pathway in Disrupted Hippocampal Neurogenesis of Temporal Lobe Epilepsy: A Potential
Therapeutic Target? Neurochem. Res. 40, 1–14.
Ishitani, T. and Ishitani, S. (2013). Nemo-like kinase, a multifaceted cell signaling regulator.
Cell. Signal. 25, 190–197.
Johansson, H. and Simonsson, S. (2010). Core transcription factors, Oct4, Sox2 and Nanog,
individually form complexes with nucleophosmin (Npm1) to control embryonic stem (ES)
cell fate determination. Aging (Albany. NY). 2, 815–822.
Jongbloets, B. C., Van Gassen, K. L. I., Kan, A. A., Olde Engberink, A. H. O., De Wit, M.,
Wolterink-Donselaar, I. G., Groot Koerkamp, M. J. A., Van Nieuwenhuizen, O.,
Holstege, F. C. P. and De Graan, P. N. E. (2015). Expression profiling after prolonged
experimental febrile seizures in mice suggests structural remodeling in the hippocampus.
PLoS One 10,.
Kanu, N., Penicud, K., Hristova, M., Wong, B., Irvine, E., Plattner, F., Raivich, G. and
Behrens, A. (2010). The ATM cofactor ATMIN protects against oxidative stress and
accumulation of DNA damage in the aging brain. J. Biol. Chem. 285, 38534–38542.
Konsavage, W. M. and Yochum, G. S. (2013). Intersection of Hippo/YAP and Wnt/β-catenin
signaling pathways. Acta Biochim. Biophys. Sin. (Shanghai). 45, 71–79.
Langfelder, P. and Horvath, S. (2008). WGCNA: an R package for weighted correlation
network analysis. BMC Bioinformatics 9, 559.
Langfelder, P., Luo, R., Oldham, M. C. and Horvath, S. (2011). Is my network module
preserved and reproducible? PLoS Comput. Biol. 7, e1001057.
Lee, J.-R. (2015). Protein tyrosine phosphatase PTPRT as a regulator of synaptic formation and
neuronal development. BMB Rep. 48, 249–55.
Liu, J., Luo, X., Xu, Y., Gu, J., Tang, F., Jin, Y. and Li, H. (2016). Single-stranded DNA
binding protein Ssbp3 induces differentiation of mouse embryonic stem cells into
trophoblast-like cells. Stem Cell Res. Ther. 7, 79.
Makita, T., Sucov, H. M., Gariepy, C. E., Yanagisawa, M. and Ginty, D. D. (2008).
Endothelins are vascular-derived axonal guidance cues for developing sympathetic neurons.
Nature 452, 759–763.
Marchetti, B. and Pluchino, S. (2013). Wnt your brain be inflamed? Yes, it Wnt! Trends Mol.
Med. 19, 144–156.
Masuda, T., Tsuda, M., Yoshinaga, R., Tozaki-Saitoh, H., Ozato, K., Tamura, T. and Inoue,
K. (2012). IRF8 Is a Critical Transcription Factor for Transforming Microglia into a
Reactive Phenotype. Cell Rep. 1, 334–340.
Mirza, N., Vasieva, O., Marson, A. G. and Pirmohamed, M. (2011). Exploring the genomic
basis of pharmacoresistance in epilepsy: An integrative analysis of large-scale gene
expression profiling studies on brain tissue from epilepsy surgery. Hum. Mol. Genet. 20,
4381–4394.
Miura et al., Y. (2016). ACAP3 regulates neurite outgrowth through its GAP activity specific to
Arf6 in mouse hippocampal neurons. Biochem J.
Mochida, G. H., Ganesh, V. S., de Michelena, M. I., Dias, H., Atabay, K. D., Kathrein, K.
L., Huang, H.-T., Hill, R. S., Felie, J. M., Rakiec, D., et al. (2012). CHMP1A encodes an
essential regulator of BMI1-INK4A in cerebellar development. Nat. Genet. 44, 1260–4.
Moreno, N., Schmidt, C., Ahlfeld, J., Poschl, J., Dittmar, S., Pfister, S. M., Kool, M., Kerl,
K. and Schuller, U. (2014). Loss of Smarc proteins impairs cerebellar development. J
Neurosci 34, 13486–13491.
MuhChyi, C., Juliandi, B., Matsuda, T. and Nakashima, K. (2013). Epigenetic regulation of
Dis
ease
Mo
dels
& M
echa
nism
s •
DM
M •
Acc
epte
d m
anus
crip
t

neural stem cell fate during corticogenesis. Int. J. Dev. Neurosci. 31, 424–433.
Nakayama, J. (2009). Progress in searching for the febrile seizure susceptibility genes. Brain
Dev. 31, 359–65.
Nanobashvili, A., Kokaia, Z. and Lindvall, O. (2003). Generalization of rapidly recurring
seizures is suppressed in mice lacking glial cell line-derived neurotrophic factor family
receptor alpha-2. Neuroscience 118, 845–852.
Patterson, K. P., Brennan, G. P., Curran, M., Kinney-lang, E., Dubé, C., Ly, C., Obenaus,
A. and Baram, T. Z. (2015). Rapid, Coordinate Inflammatory Responses after
Experimental Febrile Status Epilepticus: Implications for Epileptogenesis. eNeuro 2, 1–12.
Pauli, E., Hildebrandt, M., Romstock, J., Stefan, H. and Blumcke, I. (2006). Deficient
memory acquisition in temporal lobe epilepsy is predicted by hippocampal granule cell loss.
Neurology 67, 1383–1389.
Perrier, A. L., Tabar, V., Barberi, T., Rubio, M. E., Bruses, J., Topf, N., Harrison, N. L. and
Studer, L. (2004). Derivation of midbrain dopamine neurons from human embryonic stem
cells. Proc. Natl. Acad. Sci. U. S. A. 101, 12543–12548.
Pettem, K., Yokomaku, D., Luo, L., Linhoff, M., Prasad, T., Connor, S., Siddiqui, T.,
Kawabe, H., Chen, F., Zhang, L., et al. (2013). The Specific α-Neurexin Interactor
Calsyntenin-3 Promotes Excitatory and Inhibitory Synapse Development. Neuron 80, 113–
128.
Rowley, S. and Patel, M. (2013). Mitochondrial involvement and oxidative stress in temporal
lobe epilepsy. Free Radic. Biol. Med. 62, 121–131.
Saeed, A. I., Sharov, V., White, J., Li, J., Liang, W., Bhagabati, N., Braisted, J., Klapa, M.,
Currier, T., Thiagarajan, M., et al. (2003). TM4: a free, open-source system for
microarray data management and analysis. Biotechniques 34, 374–8.
Sasaki, S., Mori, D., Toyo-oka, K., Chen, A., Garrett-beal, L., Muramatsu, M., Miyagawa,
S., Hiraiwa, N., Yoshiki, A., Wynshaw-boris, A., et al. (2005). Complete Loss of Ndel1
Results in Neuronal Migration Defects and Early Embryonic Lethality. Mol. Cell. Biol. 25,
7812–7827.
Satoh, J. ichi, Kino, Y., Asahina, N., Takitani, M., Miyoshi, J., Ishida, T. and Saito, Y. (2016).
TMEM119 marks a subset of microglia in the human brain. Neuropathology 36, 39–49.
Schroeder, A., Mueller, O., Stocker, S., Salowsky, R., Leiber, M., Gassmann, M., Lightfoot,
S., Menzel, W., Granzow, M. and Ragg, T. (2006). The RIN: an RNA integrity number
for assigning integrity values to RNA measurements. BMC Mol. Biol. 7, 3.
Scott RC, H. G. (2012). Febrile seizures and the wandering granule cell. Nat. Med. 18, 1180–2.
Seeburg, D. P. and Sheng, M. (2008). Activity-induced Polo-like kinase 2 is required for
homeostatic plasticity of hippocampal neurons during epileptiform activity. J. Neurosci. 28,
6583–6591.
Sha, L., Wu, X., Yao, Y., Wen, B., Feng, J., Sha, Z., Wang, X., Xing, X., Dou, W., Jin, L., et
al. (2014). Notch signaling activation promotes seizure activity in temporal lobe epilepsy.
Mol. Neurobiol. 49, 633–644.
Shetty, A. K. and Hattiangady, B. (2013). Postnatal age governs the extent of differentiation of
hippocampal CA1 and CA3 subfield neural stem/progenitor cells into neurons and
oligodendrocytes. Int. J. Dev. Neurosci. 31, 646–656.
Shi, J., Li, H., Jin, G., Zhu, P., Tian, M., Qin, J., Tan, X., Zhao, S., Wang, F., Hua, Y., et al. (2012). Lhx8 promote differentiation of hippocampal neural stem/progenitor cells into
cholinergic neurons in vitro. Vitr. Cell. Dev. Biol. - Anim. 48, 603–609.
Shinnar, S., Bello, J. A., Chan, S., Hesdorffer, D. C., Lewis, D. V, Macfall, J., Pellock, J. M.,
Nordli, D. R., Frank, L. M., Moshe, S. L., et al. (2012). MRI abnormalities following
febrile status epilepticus in children: the FEBSTAT study. Neurology 79, 871–7.
Siegel, G., Obernosterer, G., Fiore, R., Oehmen, M., Bicker, S., Christensen, M.,
Khudayberdiev, S., Leuschner, P. F., Busch, C. J. L., Kane, C., et al. (2009). A
functional screen implicates microRNA-138-dependent regulation of the depalmitoylation
enzyme APT1 in dendritic spine morphogenesis. Nat. Cell Biol. 11, 705-U36.
Smyth, G. K. (2005). limma: Linear Models for Microarray Data. In Bioinformatics and
Computational Biology Solutions Using R and Bioconductor, pp. 397–420. New York:
Dis
ease
Mo
dels
& M
echa
nism
s •
DM
M •
Acc
epte
d m
anus
crip
t

Springer-Verlag.
Song, M. Y., Tian, F. F., Wang, Y. Z., Huang, X., Guo, J. L. and Ding, D. X. (2015). Potential
roles of the RGMa-FAK-Ras pathway in hippocampal mossy fiber sprouting in the
pentylenetetrazole kindling model. Mol. Med. Rep. 11, 1738–1744.
Steinbeck, J. A., Henke, N., Opatz, J., Gruszczynska-Biegala, J., Schneider, L., Theiss, S.,
Hamacher, N., Steinfarz, B., Golz, S., Brüstle, O., et al. (2011). Store-operated calcium
entry modulates neuronal network activity in a model of chronic epilepsy. Exp. Neurol. 232,
185–194.
Subramanian, A., Tamayo, P., Mootha, V. K., Mukherjee, S., Ebert, B. L., Gillette, M. a,
Paulovich, A., Pomeroy, S. L., Golub, T. R., Lander, E. S., et al. (2005). Gene set
enrichment analysis: a knowledge-based approach for interpreting genome-wide expression
profiles. Proc. Natl. Acad. Sci. U. S. A. 102, 15545–50.
Thomas, P. D., Campbell, M. J., Kejariwal, A., Mi, H., Karlak, B., Daverman, R., Diemer,
K., Muruganujan, A. and Narechania, A. (2003). PANTHER: A library of protein
families and subfamilies indexed by function. Genome Res. 13, 2129–2141.
Tong, C. W., Wang, J. L., Jiang, M. S., Hsu, C. H., Chang, W. T. and Huang, A. M. (2013).
Novel genes that mediate nuclear respiratory factor 1-regualted neurite outgrowth in
neuroblastoma IMR-32 cells. Gene 515, 62–70.
Toyoda, I., Bower, M. R., Leyva, F. and Buckmaster, P. S. (2013). Early activation of ventral
hippocampus and subiculum during spontaneous seizures in a rat model of temporal lobe
epilepsy. J. Neurosci. 33, 11100–15.
Ueno, H., Nakajo, N., Watanabe, M., Isoda, M. and Sagata, N. (2008). FoxM1-driven cell
division is required for neuronal differentiation in early Xenopus embryos. Development
135, 2023–30.
Vestergaard, M., Pedersen, C. B., Sidenius, P., Olsen, J. and Christensen, J. (2007). The long-
term risk of epilepsy after febrile seizures in susceptible subgroups. Am. J. Epidemiol. 165,
911–918.
von Schimmelmann, M., Feinberg, P. A., Sullivan, J. M., Ku, S. M., Badimon, A., Duff, M.
K., Wang, Z., Lachmann, A., Dewell, S., Ma’ayan, A., et al. (2016). Polycomb repressive
complex 2 (PRC2) silences genes responsible for neurodegeneration. Nat. Neurosci. 2, 1–
14.
Wang, Y., Zhao, J., Kalsotra, A., Turman, C. M., Grill, R. J., Dash, P. K. and Strobel, H.
W. (2008). CYP4Fs expression in rat brain correlates with changes in LTB4 levels after
traumatic brain injury. J. Neurotrauma 25, 1187–94.
Wu, C. P., Cheung, G., Rakhshani, N., Parvardeh, S., Asl, M. N., Huang, H. L. and Zhang,
L. (2005). Ca3 neuronal activities of dorsal and ventral hippocampus are differentially
altered in rats after prolonged post-ischemic survival. Neuroscience 130, 527–39.
Xia, Y., Luo, C., Dai, S. and Yao, D. (2013). Increased EphA/ephrinA expression in
hippocampus of pilocarpine treated mouse. Epilepsy Res. 105, 20–29.
Xu, B., Li, S., Brown, A., Gerlai, R., Fahnestock, M. and Racine, R. J. (2003). EphA/ephrin-
A interactions regulate epileptogenesis and activity-dependent axonal sprouting in adult rats.
Mol. Cell. Neurosci. 24, 984–999.
Yamada, T., Yang, Y., Hemberg, M., Yoshida, T., Cho, H. Y., Murphy, J. P., Fioravante,
D., Regehr, W. G., Gygi, S. P., Georgopoulos, K., et al. (2014). Promoter
decommissioning by the NuRD chromatin remodeling complex triggers synaptic
connectivity in the mammalian brain. Neuron 83, 122–134.
Yang, H., Wu, J., Guo, R., Peng, Y., Zheng, W., Liu, D. and Song, Z. (2013). Glycolysis in
energy metabolism during seizures. Neural Regen. Res. 8, 1316–1326.
Zhang, Y., Kanaho, Y., Frohman, M. A. and Tsirka, S. E. (2005). Phospholipase D1-promoted
release of tissue plasminogen activator facilitates neurite outgrowth. J. Neurosci. 25, 1797–
805.
Zhang, X., Peng, X., Fang, M., Zhou, C., Zhao, F., Zhang, Y., Xu, Y., Zhu, Q., Luo, J., Chen,
G., et al. (2011). Up-regulation of apelin in brain tissue of patients with epilepsy and an
epileptic rat model. Peptides 32, 1793–1799.
Zhang et al, Y. (2015). Plic-1, a new target in repressing epileptic seizure by regulation of
Dis
ease
Mo
dels
& M
echa
nism
s •
DM
M •
Acc
epte
d m
anus
crip
t

GABAAR function in patients and a rat model of epilepsy. Clin Sci 1207–23.
Zhao, D. Y., Wu, X. R., Pei, Y. Q. and Zuo, Q. H. (1985). Long-term effects of febrile
convulsion on seizure susceptibility in P77PMC rat--resistant to acoustic stimuli but
susceptible to kainate-induced seizures. Exp. Neurol. 88, 688–95.
Dis
ease
Mo
dels
& M
echa
nism
s •
DM
M •
Acc
epte
d m
anus
crip
t
Figures
Figure 1. Analyses of module preservation and intramodular connectivity changes
between HS and CTRL networks. Genes were ranked according to their intramodular
connectivity and changes in ranking positions were determined between networks for
identifying nodes and modules associated with gain or loss of connectivity. The summary
statistic Zsummary is used to assess preservation of module density and connectivity
between the networks. Zsummary < 2 denotes no preservation, 2 < Zsummary < 10
indicates weak to moderate evidence of preservation, and Zsummary > 10 suggests strong
module preservation.
Dis
ease
Mo
dels
& M
echa
nism
s •
DM
M •
Acc
epte
d m
anus
crip
t
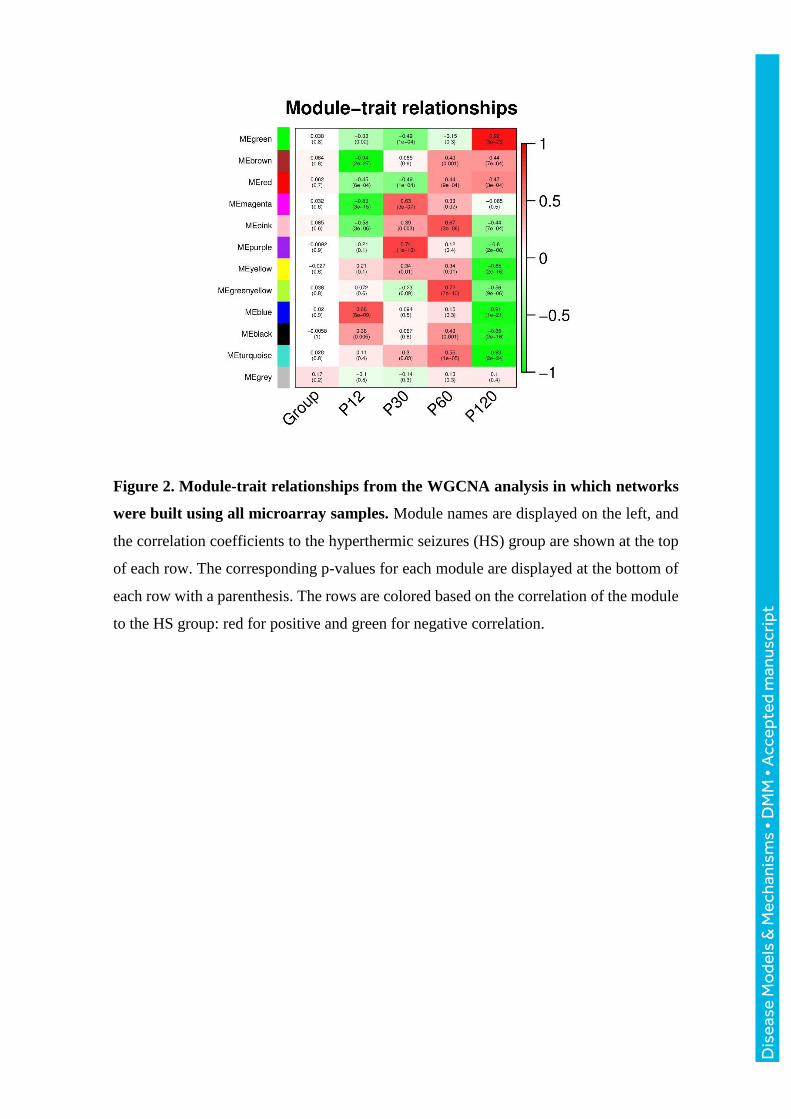
Figure 2. Module-trait relationships from the WGCNA analysis in which networks
were built using all microarray samples. Module names are displayed on the left, and
the correlation coefficients to the hyperthermic seizures (HS) group are shown at the top
of each row. The corresponding p-values for each module are displayed at the bottom of
each row with a parenthesis. The rows are colored based on the correlation of the module
to the HS group: red for positive and green for negative correlation.
Dis
ease
Mo
dels
& M
echa
nism
s •
DM
M •
Acc
epte
d m
anus
crip
t
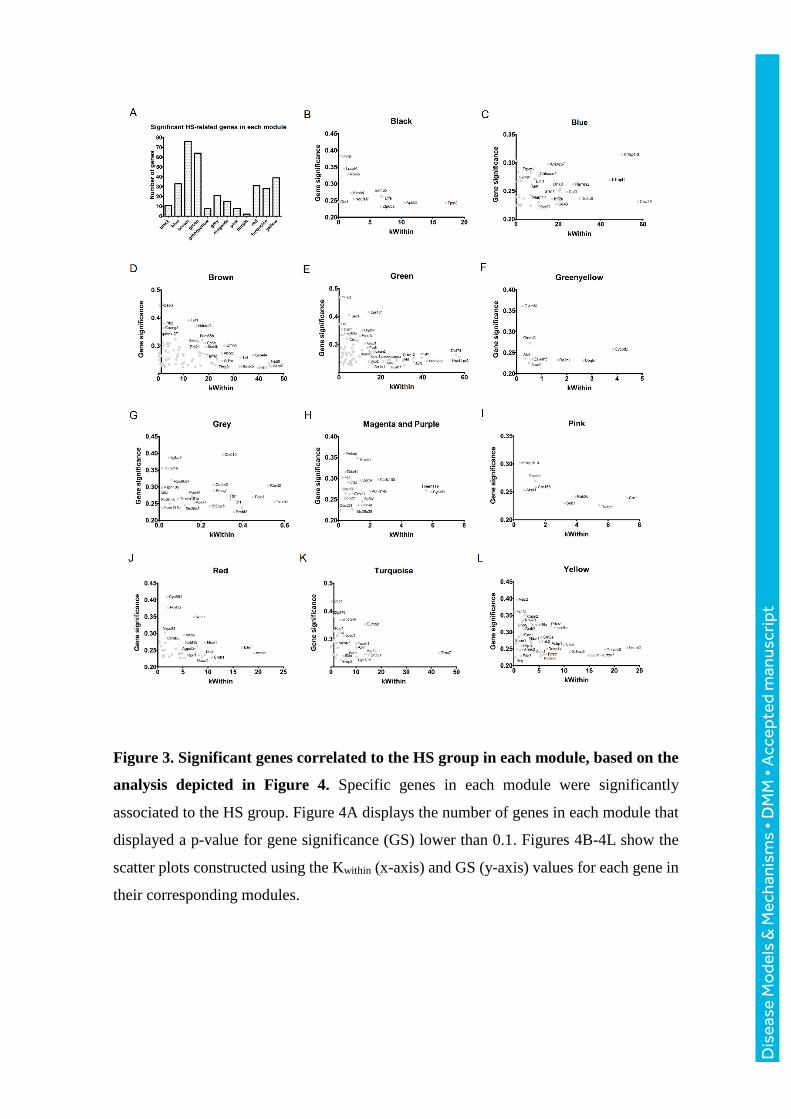
Figure 3. Significant genes correlated to the HS group in each module, based on the
analysis depicted in Figure 4. Specific genes in each module were significantly
associated to the HS group. Figure 4A displays the number of genes in each module that
displayed a p-value for gene significance (GS) lower than 0.1. Figures 4B-4L show the
scatter plots constructed using the Kwithin (x-axis) and GS (y-axis) values for each gene in
their corresponding modules.
Dis
ease
Mo
dels
& M
echa
nism
s •
DM
M •
Acc
epte
d m
anus
crip
t

Figure 4. Pie charts showing the percentage of genes for selected enriched biological
functions and pathways at different time points after hyperthermic seizures. Figures
6A-6D display the functions identified in the modules that gain connectivity in the HS
networks. Networks were constructed using the HS and CTRL samples in separate for
allowing the comparison between HS and CTRL networks at each time point.
D
isea
se M
ode
ls &
Mec
hani
sms
• D
MM
• A
ccep
ted
man
uscr
ipt
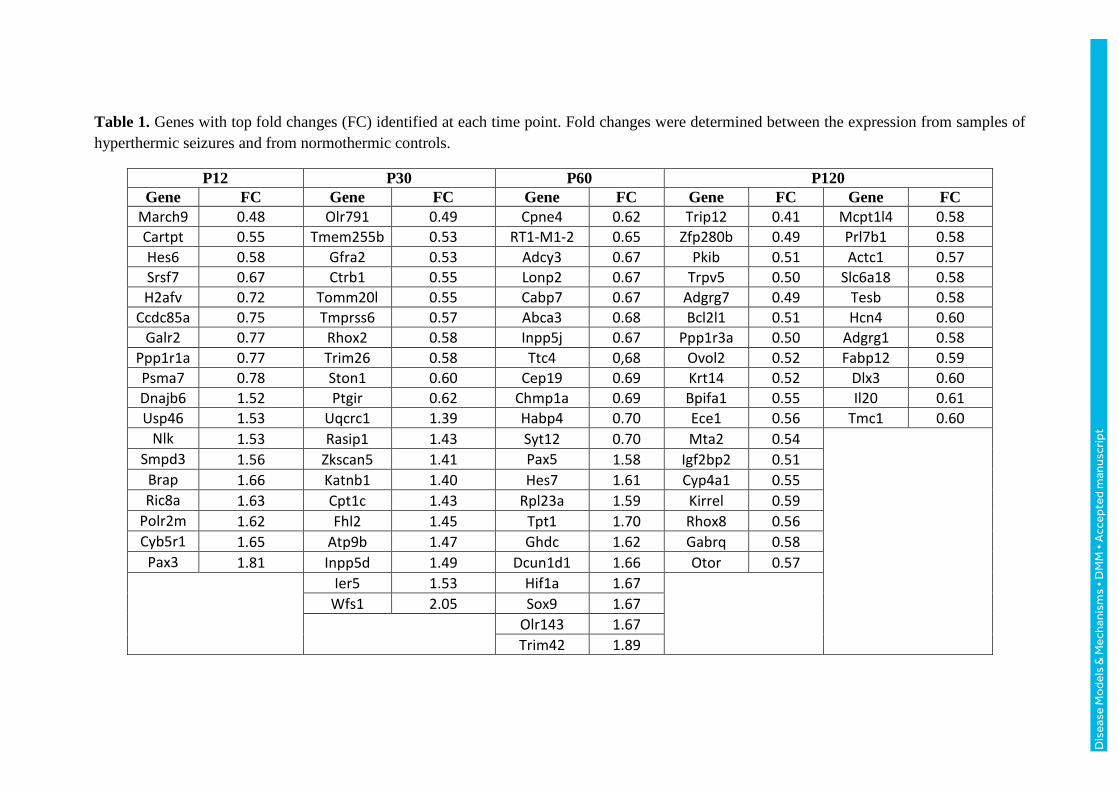
Table 1. Genes with top fold changes (FC) identified at each time point. Fold changes were determined between the expression from samples of
hyperthermic seizures and from normothermic controls.
P12 P30 P60 P120
Gene FC Gene FC Gene FC Gene FC Gene FC
March9 0.48 Olr791 0.49 Cpne4 0.62 Trip12 0.41 Mcpt1l4 0.58
Cartpt 0.55 Tmem255b 0.53 RT1-M1-2 0.65 Zfp280b 0.49 Prl7b1 0.58
Hes6 0.58 Gfra2 0.53 Adcy3 0.67 Pkib 0.51 Actc1 0.57
Srsf7 0.67 Ctrb1 0.55 Lonp2 0.67 Trpv5 0.50 Slc6a18 0.58
H2afv 0.72 Tomm20l 0.55 Cabp7 0.67 Adgrg7 0.49 Tesb 0.58
Ccdc85a 0.75 Tmprss6 0.57 Abca3 0.68 Bcl2l1 0.51 Hcn4 0.60
Galr2 0.77 Rhox2 0.58 Inpp5j 0.67 Ppp1r3a 0.50 Adgrg1 0.58
Ppp1r1a 0.77 Trim26 0.58 Ttc4 0,68 Ovol2 0.52 Fabp12 0.59
Psma7 0.78 Ston1 0.60 Cep19 0.69 Krt14 0.52 Dlx3 0.60
Dnajb6 1.52 Ptgir 0.62 Chmp1a 0.69 Bpifa1 0.55 Il20 0.61
Usp46 1.53 Uqcrc1 1.39 Habp4 0.70 Ece1 0.56 Tmc1 0.60
Nlk 1.53 Rasip1 1.43 Syt12 0.70 Mta2 0.54
Smpd3 1.56 Zkscan5 1.41 Pax5 1.58 Igf2bp2 0.51
Brap 1.66 Katnb1 1.40 Hes7 1.61 Cyp4a1 0.55
Ric8a 1.63 Cpt1c 1.43 Rpl23a 1.59 Kirrel 0.59
Polr2m 1.62 Fhl2 1.45 Tpt1 1.70 Rhox8 0.56
Cyb5r1 1.65 Atp9b 1.47 Ghdc 1.62 Gabrq 0.58
Pax3 1.81 Inpp5d 1.49 Dcun1d1 1.66 Otor 0.57
Ier5 1.53 Hif1a 1.67
Wfs1 2.05 Sox9 1.67
Olr143 1.67
Trim42 1.89
Dis
ease
Mo
dels
& M
echa
nism
s •
DM
M •
Acc
epte
d m
anus
crip
t
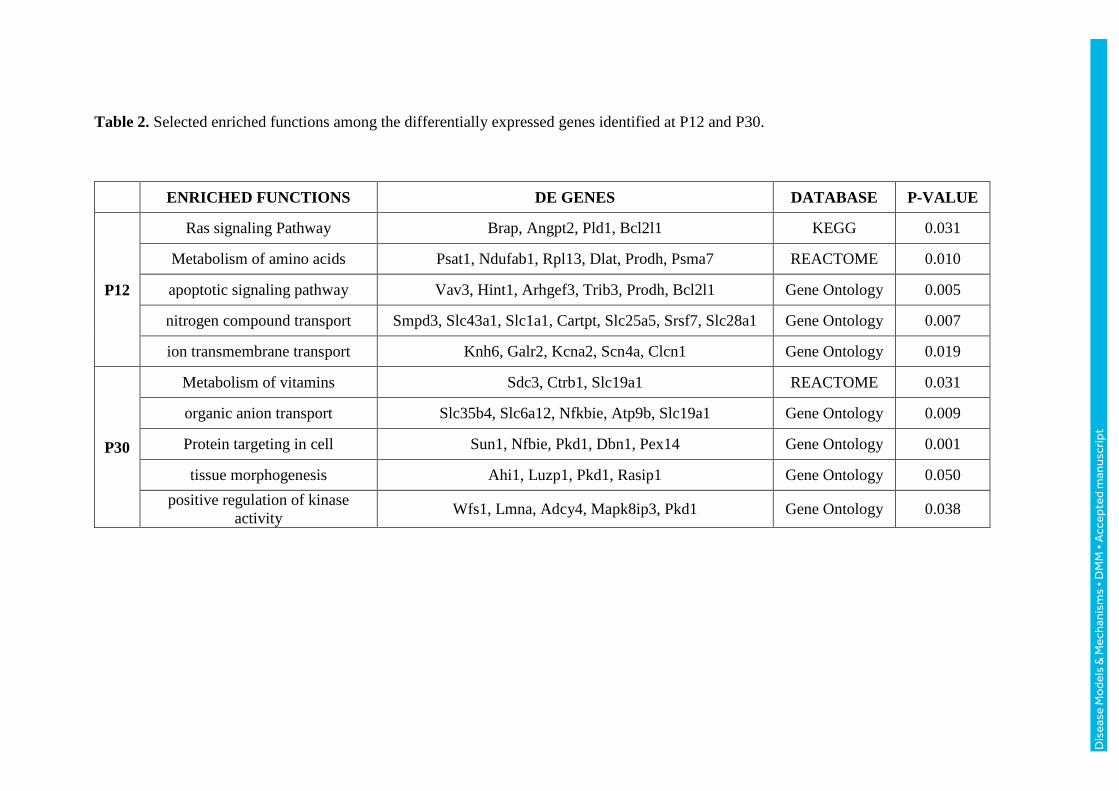
Table 2. Selected enriched functions among the differentially expressed genes identified at P12 and P30.
ENRICHED FUNCTIONS DE GENES DATABASE P-VALUE
P12
Ras signaling Pathway Brap, Angpt2, Pld1, Bcl2l1 KEGG 0.031
Metabolism of amino acids Psat1, Ndufab1, Rpl13, Dlat, Prodh, Psma7 REACTOME 0.010
apoptotic signaling pathway Vav3, Hint1, Arhgef3, Trib3, Prodh, Bcl2l1 Gene Ontology 0.005
nitrogen compound transport Smpd3, Slc43a1, Slc1a1, Cartpt, Slc25a5, Srsf7, Slc28a1 Gene Ontology 0.007
ion transmembrane transport Knh6, Galr2, Kcna2, Scn4a, Clcn1 Gene Ontology 0.019
P30
Metabolism of vitamins Sdc3, Ctrb1, Slc19a1 REACTOME 0.031
organic anion transport Slc35b4, Slc6a12, Nfkbie, Atp9b, Slc19a1 Gene Ontology 0.009
Protein targeting in cell Sun1, Nfbie, Pkd1, Dbn1, Pex14 Gene Ontology 0.001
tissue morphogenesis Ahi1, Luzp1, Pkd1, Rasip1 Gene Ontology 0.050
positive regulation of kinase
activity Wfs1, Lmna, Adcy4, Mapk8ip3, Pkd1 Gene Ontology 0.038
Dis
ease
Mo
dels
& M
echa
nism
s •
DM
M •
Acc
epte
d m
anus
crip
t
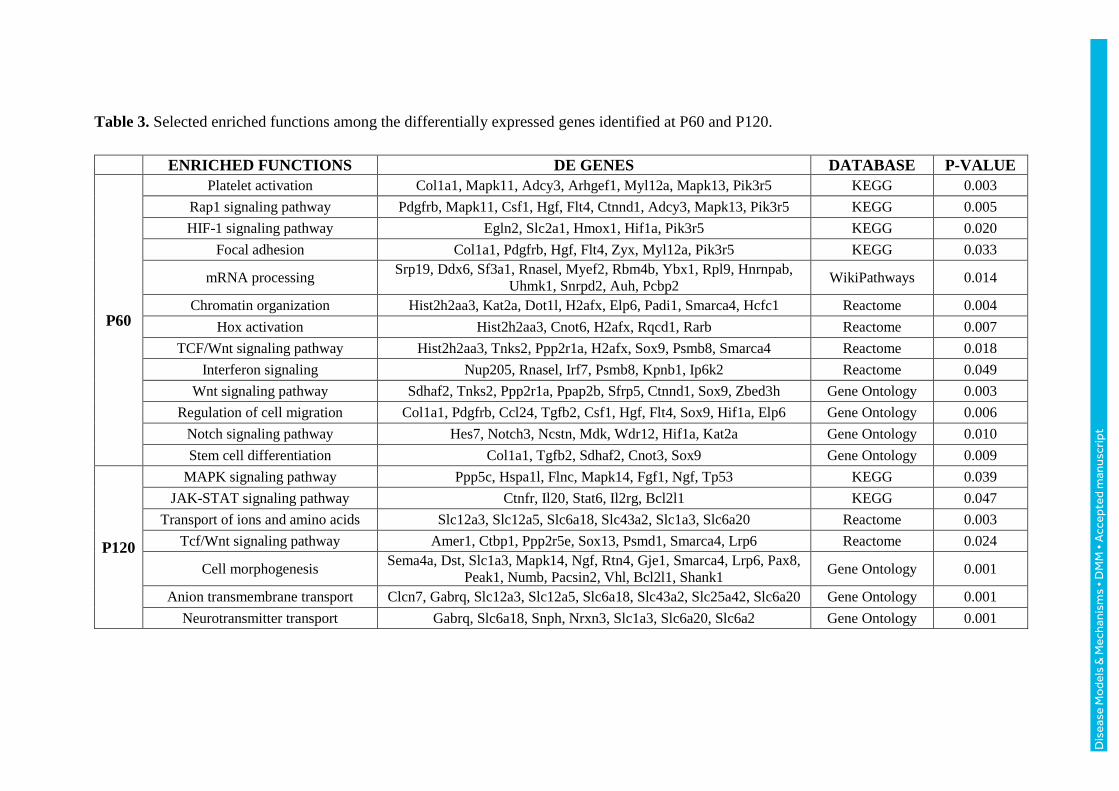
Table 3. Selected enriched functions among the differentially expressed genes identified at P60 and P120.
ENRICHED FUNCTIONS DE GENES DATABASE P-VALUE
P60
Platelet activation Col1a1, Mapk11, Adcy3, Arhgef1, Myl12a, Mapk13, Pik3r5 KEGG 0.003
Rap1 signaling pathway Pdgfrb, Mapk11, Csf1, Hgf, Flt4, Ctnnd1, Adcy3, Mapk13, Pik3r5 KEGG 0.005
HIF-1 signaling pathway Egln2, Slc2a1, Hmox1, Hif1a, Pik3r5 KEGG 0.020
Focal adhesion Col1a1, Pdgfrb, Hgf, Flt4, Zyx, Myl12a, Pik3r5 KEGG 0.033
mRNA processing Srp19, Ddx6, Sf3a1, Rnasel, Myef2, Rbm4b, Ybx1, Rpl9, Hnrnpab,
Uhmk1, Snrpd2, Auh, Pcbp2 WikiPathways 0.014
Chromatin organization Hist2h2aa3, Kat2a, Dot1l, H2afx, Elp6, Padi1, Smarca4, Hcfc1 Reactome 0.004
Hox activation Hist2h2aa3, Cnot6, H2afx, Rqcd1, Rarb Reactome 0.007
TCF/Wnt signaling pathway Hist2h2aa3, Tnks2, Ppp2r1a, H2afx, Sox9, Psmb8, Smarca4 Reactome 0.018
Interferon signaling Nup205, Rnasel, Irf7, Psmb8, Kpnb1, Ip6k2 Reactome 0.049
Wnt signaling pathway Sdhaf2, Tnks2, Ppp2r1a, Ppap2b, Sfrp5, Ctnnd1, Sox9, Zbed3h Gene Ontology 0.003
Regulation of cell migration Col1a1, Pdgfrb, Ccl24, Tgfb2, Csf1, Hgf, Flt4, Sox9, Hif1a, Elp6 Gene Ontology 0.006
Notch signaling pathway Hes7, Notch3, Ncstn, Mdk, Wdr12, Hif1a, Kat2a Gene Ontology 0.010
Stem cell differentiation Col1a1, Tgfb2, Sdhaf2, Cnot3, Sox9 Gene Ontology 0.009
P120
MAPK signaling pathway Ppp5c, Hspa1l, Flnc, Mapk14, Fgf1, Ngf, Tp53 KEGG 0.039
JAK-STAT signaling pathway Ctnfr, Il20, Stat6, Il2rg, Bcl2l1 KEGG 0.047
Transport of ions and amino acids Slc12a3, Slc12a5, Slc6a18, Slc43a2, Slc1a3, Slc6a20 Reactome 0.003
Tcf/Wnt signaling pathway Amer1, Ctbp1, Ppp2r5e, Sox13, Psmd1, Smarca4, Lrp6 Reactome 0.024
Cell morphogenesis Sema4a, Dst, Slc1a3, Mapk14, Ngf, Rtn4, Gje1, Smarca4, Lrp6, Pax8,
Peak1, Numb, Pacsin2, Vhl, Bcl2l1, Shank1 Gene Ontology 0.001
Anion transmembrane transport Clcn7, Gabrq, Slc12a3, Slc12a5, Slc6a18, Slc43a2, Slc25a42, Slc6a20 Gene Ontology 0.001
Neurotransmitter transport Gabrq, Slc6a18, Snph, Nrxn3, Slc1a3, Slc6a20, Slc6a2 Gene Ontology 0.001
Dis
ease
Mo
dels
& M
echa
nism
s •
DM
M •
Acc
epte
d m
anus
crip
t
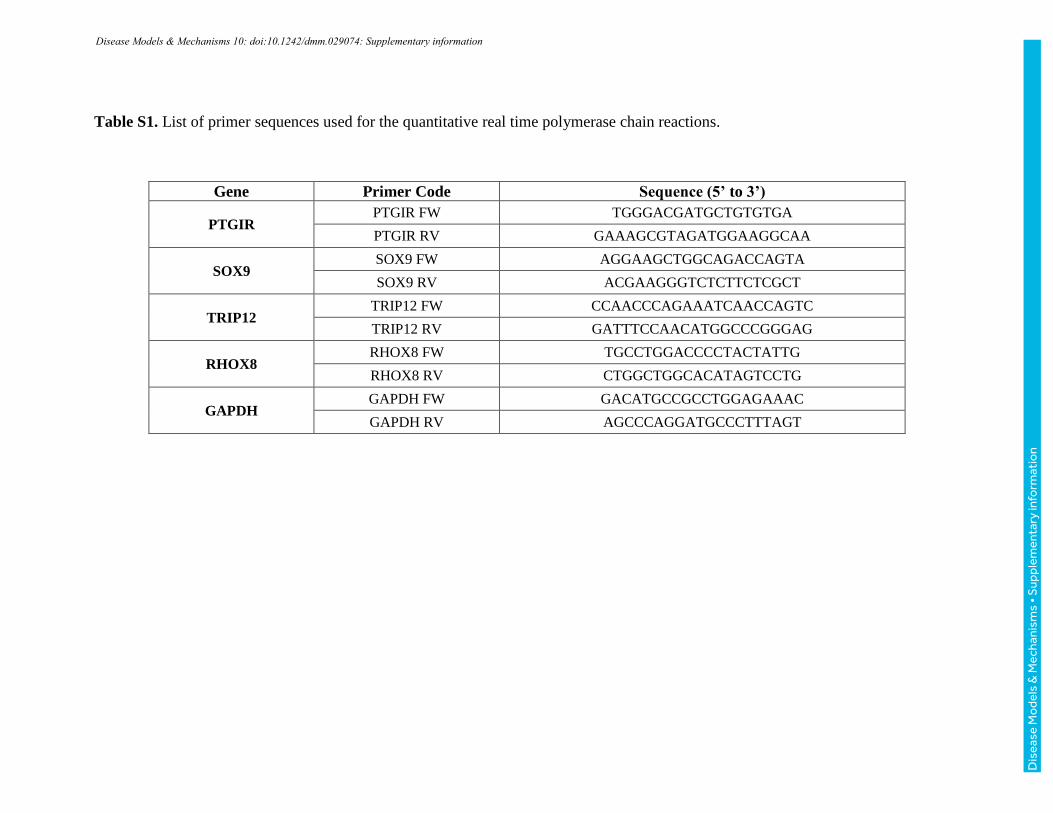
Table S1. List of primer sequences used for the quantitative real time polymerase chain reactions.
Gene Primer Code Sequence (5’ to 3’)
PTGIR PTGIR FW TGGGACGATGCTGTGTGA
PTGIR RV GAAAGCGTAGATGGAAGGCAA
SOX9 SOX9 FW AGGAAGCTGGCAGACCAGTA
SOX9 RV ACGAAGGGTCTCTTCTCGCT
TRIP12 TRIP12 FW CCAACCCAGAAATCAACCAGTC
TRIP12 RV GATTTCCAACATGGCCCGGGAG
RHOX8 RHOX8 FW TGCCTGGACCCCTACTATTG
RHOX8 RV CTGGCTGGCACATAGTCCTG
GAPDH GAPDH FW GACATGCCGCCTGGAGAAAC
GAPDH RV AGCCCAGGATGCCCTTTAGT
Disease Models & Mechanisms 10: doi:10.1242/dmm.029074: Supplementary information
Dis
ease
Mo
dels
& M
echa
nism
s •
Sup
plem
enta
ry in
form
atio
n

Table S2. Functional enrichment analysis in modules that gain or lose connectivity after hyperthermic seizures at P12.
MODULE
(GENES)
MODULE
TYPE HUBS MAIN ENRICHED FUNCTIONS
Blue
(367)
Gain of
connectivity
Bcar1, Slc25a5, Entpd2, Zfp148,
Gimap9, Srp72, Rarres1, Hspa9, Rassf2,
Romo1
Cell cycle, Endocytosis, Focal Adhesion, Regulation of Actin Cytoskeleton, EGFR
Pathway, Apoptosis, Cellular response to stress, Autophagy, DNA replication,
axonogenesis, neuron cell-cell adhesion
Green
(215)
Gain of
connectivity
Abcb6, Exosc5, Rbm7, C1ql1, Uri1,
Pycr2, Mpdz, Hdgfrp3, Cstf2, Nudt16l1
Endocannabinoid signaling, Proteoglycans in cancer, PI3K-Akt pathway,
GABAergic synapse, Focal Adhesion, Class I MHC mediated antigen processing,
EPH-ephrin mediated repulsion of cells, oxidative phosphorylation, cell projection
organization, positive regulation of neuron differentiation
Magenta
(160)
Gain of
connectivity
Slc4a2, Zfp407, Nes, Etv3, Cd6, Glrx2,
Phb, Clrn2, Ccnf, Kcnk2
Proteoglycans, FoxO pathway, MAPK pathway, Chromatin organization, Gastrin-
CREB signaling pathway via PKC and MAPK, Regulation of synaptic
transmission, regulation of membrane potential
Salmon
(132)
Gain of
connectivity
Cct5, Col1a2, Mien1, Mettl2b, Mxi1,
Foxe1, Cfl1, Rreb1, Hyal3, Cdhr1
Oxidative phosphorylation, TGF-β Pathway, Cell cycle, NF-κB activation, Ion
channel transport, response to IL-1, Wnt pathway, apoptosis, actin cytoskeleton
organization, stem cell maintenance
Darkred
(97)
Less
preserved
Nefl, Ssbp3, Epm2aip1, Sat1, Psmg4,
Cmas, Srgap3, Zc3h18, Ctss, Scml4
p53 pathway, HIF-1 pathway, Neurotrophin pathway, Wnt pathway,
Apoptosis, Activation of NMDA receptor, Hemostasis, Signaling by FGFR, Cell
differentiation, axonogenesis
Royalblue
(98)
Less
preserved
Tmem212, Tbkbp1, Nxph1, Adcyap1,
Fcgr1a, Tspyl4, Eif4ebp1, Aars, Mal2,
Apex1
PI3K-Akt-mTOR-signaling, EPH-Ephrin signaling, Axon guidance, SLC-mediated
transmembrane transport, Signaling by VEGF, negative regulation of neuron death, neuron projection development, neurogenesis
grey60
(106)
Less
preserved
Ddx39b, Ap2s1, Ddx24, Atg16l1,
Commd4, Acin1, Bloc1s2, Eif3e, Tpm3,
Chmp4b
Calcium Regulation, Integrin-mediated cell adhesion, Focal Adhesion, PI3K-Akt-
mTOR-signaling, Signaling by EGFR, vesicle-mediated transport, cellular response
to stress, regulation of vasculature development
Darkgreen
(97)
Less
preserved
Prpf40a, Sort1, Cd33, Uqcrc1, Smarca4,
Ubc, Rnf187, Gdi1, Cript, Otx1
Cholinergic synapse, potassium channels, Signaling by Wnt, mitotic cell cycle
phase transition, T cell activation, neuron differentiation
Disease Models & Mechanisms 10: doi:10.1242/dmm.029074: Supplementary information
Dis
ease
Mo
dels
& M
echa
nism
s •
Sup
plem
enta
ry in
form
atio
n

Table S3. Functional enrichment analysis in modules that gain or lose connectivity after hyperthermic seizures at P30.
MODULE
(GENES)
MODULE
TYPE HUBS MAIN ENRICHED FUNCTIONS
Blue
(345)
Gain of
connectivity
Slc30a5, Hypk, Ankrd33b, Axin1,
Arv1, Inip, Dscr3, Ptp4a3, Zfyve1,
Acy3
Protein processing in endoplasmic reticulum, Hippo pathway, Wnt pathway, apoptosis,
Chemokine receptors bind chemokines, L1CAM interactions, myeloid cell
differentiation, actin filament organization, regulation of neuron apoptotic process
Brown
(301)
Gain of
connectivity
Osm, B2m, Wbp4, Spata18, Retsat,
Pomt1, Olr546, Stra6,
Pcdhga7, Usp5
Parkinson's disease, Dopaminergic and cholinergic synapses, long term potentiation,
TCA cycle, cellular metabolism, proteasome, autophagy, negative regulation of
apoptosis, nervous system development, negative regulation of cell differentiation
Green
(282)
Gain of
connectivity
Chac2, Tmed7, Ivd, Tmx3, Smarcb1,
Gmpr, Sav1, Ndufb2, Cpt1a, Sqstm1
Glutamatergic synapse, GABAergic synapse, Ubiquitin-mediated proteolysis,
Metabolic pathways, Oncostatin M Pathway, DNA damage response, Class I MHC
mediated antigen processing, cell junction assembly, neuron projection development,
synaptic transmission
Lightcyan
(165)
Gain of
connectivity
Tmem171, R3hdml, Chd5, Pth2, Eif1,
Foxp3, Gja8, Rap2a, Polr1b, Pik3r5
Electron Transport Chain, Glutathione conjugation, DNA Repair, regulation of neuron
differentiation, neurogenesis, calcium ion homeostasis
Magenta
(202)
Gain of
connectivity
Sapcd1, RalA, Olr567, Gpr137,
Lace1, Creb3, Rabggta, Mum1,
Med25
Phospholipase D signaling pathway, Actin cytoskeleton organization, Gastrin-CREB
signaling pathway, positive regulation of cell adhesion and chemotaxis, stem cell
maintenance, positive regulation of neurogenesis, stem cell differentiation
Red
(228)
Gain of
connectivity
Tmem246, Sult4a1, Vps11, Psmd8,
Armc9, Dopey2, Prkar1b, Dctn2,
Ankrd46, Pcyox1
Synaptic vesicle, lysosome, Leukocyte transendothelial migration, glutamatergic
synapse, Regulation of Actin Cytoskeleton, Neuronal System, MHC class II antigen
presentation, signaling by VEGF, signaling by EGFR, synaptic transmission, neuron
projection development, neuron apoptosis, neuron differentiation
Darkgreen
(137)
Less
preserved
Chac1, Pif1, Hpcal4, Noxa1, Defb24,
Epha10, Atp6ap1l, Zfp516, Htr5b,
Ncf1
Axon guidance, Ras pathway, Long-term potentiation, Apoptosis, BDNF signaling
pathway, IL-1 pathway, Cell Adhesion, EPH-Ephrin signaling, Innate immune
pathway, Rho GTPase Effectors
Pink
(207)
Less
preserved
Sectm1b, Ube3d, Fam134b, Idh3g,
Anapc13, S100b, Cpne8, Pgam1,
Dpysl2, Itgb3bp
Synaptic transmission, glycolysis, oxidative phosphorylation, metabolism of amino
acids, immune system, iron ion homeostasis, neuron migration, organic acid transport
Tan
(191)
Less
preserved
Wfdc10, Gpd1l, Sfrp5, Baiap2,
Myo5b, Tmem229b, Bsdc1, Nup62,
Thop1, Cacna1e
Wnt signaling pathway, MAPK pathway, Calcium signaling, Axon guidance, Neural
Crest Differentiation, neuronal System, synaptic transmission, regulation of ion
membrane transport, actin cytoskeleton organization, axon guidance
Disease Models & Mechanisms 10: doi:10.1242/dmm.029074: Supplementary information
Dis
ease
Mo
dels
& M
echa
nism
s •
Sup
plem
enta
ry in
form
atio
n

Table S4. Functional enrichment analysis in modules that gain or lose connectivity after hyperthermic seizures at P60.
MODULE
(GENES) MODULE TYPE HUBS MAIN ENRICHED FUNCTIONS
Brown
(249)
Gain of connectivity
and Less preserved
Rmnd5b, Bop1, Actn1, Sec14l5,
Tmem25, Fkbp8, Acap3, Cacnb3,
Cnrip1, Il16
Focal adhesion, stem cell pluripotency, metabolism of lipids, positive
regulation of lymphocyte proliferation, negative regulation of cell migration,
neuron projection development
Midnightblue
(160) Gain of connectivity
Anxa7, Snd1, Klhdc3, C5ar1,
Gosr2, Bpifb6, Or10ad1, Rpp30,
Rps19, Atp6v0a1
Synaptic vesicle, Glutamatergic synapse, BDNF signaling pathway, Neuronal
System, Antigen processing: Ubiquitination & Proteasome degradation, Ion
channel transport, synaptic transmission, neuronal plasticity
Red
(212) Gain of connectivity
Dctn1, Dapk3, Dgat1, Mus81,
Unc45a, Rnft2, Dcaf15, Pomgnt2,
Abcb8, Ogdh
Hippo pathway, interleukin signaling, neural crest differentiation, Extracellular matrix organization, hippocampus development, innate immune
response
Turquoise
(438) Gain of connectivity
Tpd52l1, Scx, Mx1, Ednra, Ano3,
Dleu7, Slc7a3, Nr2f2, Epha5,
Gpr155
Calcium ion transport, cholinergic synapse, axon guidance, Wnt pathway,
inflammatory regulation of TRP channels, Neuronal system, gastrin-CREB
signaling pathway, Signaling by Robo, Potassium Channels, neuron
migration, synaptic transmission
Yellow
(235) Gain of connectivity
Bckdk, Rmdn1, Ninj1, Robo1, Tst,
Dchs1, Galt, Lsm3, Olr733, Gja10
Metabolic pathways, neuroactive ligand-receptor interaction, GABAergic
synapse, Extracellular matrix organization, neuron projection development,
synaptic transmission, neuron differentiation, neurogenesis
Greenyellow
(176) Less preserved
Ptprt, Armcx1, Tpcn1, Ube2m,
Acbd5, Mta2, Celf4, Taok2,
Pomgnt1, Slc16a13
Wnt pathway, p53 pathway, Axonal guidance, regulation of RNA splicing,
neuron cell morphogenesis, regulation of protein ubiquitination, synaptic
transmission
Orange
(114) Less preserved
Olr1516, March9, Ache, Abcc6,
Dusp9, Dynlt1, Sin3b, Sept2,
Rnf182, Gltp
Long-term potentiation, cholinergic synapse, axon guidance, Kit receptor
signaling pathway, signaling by EGF, cell junction assembly, cell
differentiation, positive regulation of cell migration
Skyblue
(97) Less preserved
Calr, Sobp, Acin1, Rabgap1, Nrgn,
Epn1, Sstr4, Ring1, Scaf1, Sncb
Endocytosis, Notch Pathway, Sphingolipid metabolism, ERBB signaling,
nervous system development, small GTPase mediated signal transduction
Disease Models & Mechanisms 10: doi:10.1242/dmm.029074: Supplementary information
Dis
ease
Mo
dels
& M
echa
nism
s •
Sup
plem
enta
ry in
form
atio
n
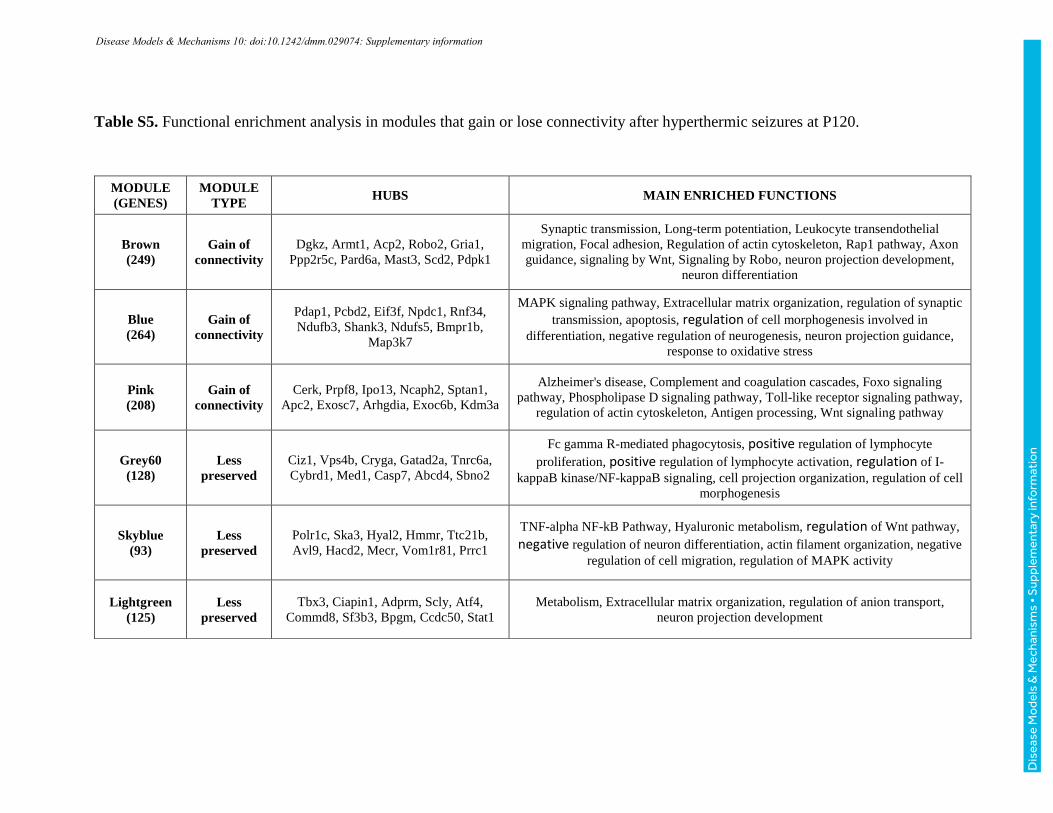
Table S5. Functional enrichment analysis in modules that gain or lose connectivity after hyperthermic seizures at P120.
MODULE
(GENES)
MODULE
TYPE HUBS MAIN ENRICHED FUNCTIONS
Brown
(249)
Gain of
connectivity
Dgkz, Armt1, Acp2, Robo2, Gria1,
Ppp2r5c, Pard6a, Mast3, Scd2, Pdpk1
Synaptic transmission, Long-term potentiation, Leukocyte transendothelial
migration, Focal adhesion, Regulation of actin cytoskeleton, Rap1 pathway, Axon
guidance, signaling by Wnt, Signaling by Robo, neuron projection development,
neuron differentiation
Blue
(264)
Gain of
connectivity
Pdap1, Pcbd2, Eif3f, Npdc1, Rnf34,
Ndufb3, Shank3, Ndufs5, Bmpr1b,
Map3k7
MAPK signaling pathway, Extracellular matrix organization, regulation of synaptic
transmission, apoptosis, regulation of cell morphogenesis involved in
differentiation, negative regulation of neurogenesis, neuron projection guidance,
response to oxidative stress
Pink
(208)
Gain of
connectivity
Cerk, Prpf8, Ipo13, Ncaph2, Sptan1,
Apc2, Exosc7, Arhgdia, Exoc6b, Kdm3a
Alzheimer's disease, Complement and coagulation cascades, Foxo signaling
pathway, Phospholipase D signaling pathway, Toll-like receptor signaling pathway,
regulation of actin cytoskeleton, Antigen processing, Wnt signaling pathway
Grey60
(128)
Less
preserved
Ciz1, Vps4b, Cryga, Gatad2a, Tnrc6a,
Cybrd1, Med1, Casp7, Abcd4, Sbno2
Fc gamma R-mediated phagocytosis, positive regulation of lymphocyte
proliferation, positive regulation of lymphocyte activation, regulation of I-
kappaB kinase/NF-kappaB signaling, cell projection organization, regulation of cell
morphogenesis
Skyblue
(93)
Less
preserved
Polr1c, Ska3, Hyal2, Hmmr, Ttc21b,
Avl9, Hacd2, Mecr, Vom1r81, Prrc1
TNF-alpha NF-kB Pathway, Hyaluronic metabolism, regulation of Wnt pathway,
negative regulation of neuron differentiation, actin filament organization, negative
regulation of cell migration, regulation of MAPK activity
Lightgreen
(125)
Less
preserved
Tbx3, Ciapin1, Adprm, Scly, Atf4,
Commd8, Sf3b3, Bpgm, Ccdc50, Stat1
Metabolism, Extracellular matrix organization, regulation of anion transport,
neuron projection development
Disease Models & Mechanisms 10: doi:10.1242/dmm.029074: Supplementary information
Dis
ease
Mo
dels
& M
echa
nism
s •
Sup
plem
enta
ry in
form
atio
n

Figure S1. Schematic representation of the network analysis workflow. Microarray data was log2-transformed and normalized using
lowess normalization. This data was used for weighted correlation network analysis. The network analysis consisted in building gene
co-expression networks, identifying network modules and hubs, performing gene-trait correlations and examining module preservation
and connectivity changes. Relevant modules were also functionally enriched to identify functions associated to hyperthermic seizures.
Disease Models & Mechanisms 10: doi:10.1242/dmm.029074: Supplementary information
Dis
ease
Mo
dels
& M
echa
nism
s •
Sup
plem
enta
ry in
form
atio
n

Figure S2. Comparison of microarray and qPCR results for selected genes. The genes Trip12, Rhox8, Ptgir and Sox9 were selected
for validating microarray results using qPCR analysis.
Disease Models & Mechanisms 10: doi:10.1242/dmm.029074: Supplementary information
Dis
ease
Mo
dels
& M
echa
nism
s •
Sup
plem
enta
ry in
form
atio
n