temporal expression changes during differentiation of neural stem cells derived from mouse embryonic...
TRANSCRIPT
Journal of Cellular Biochemistry 93:563–578 (2004)
Temporal Expression Changes During Differentiationof Neural Stem Cells Derived From Mouse EmbryonicStem Cell
Joon-Ik Ahn,1 Ki-Hwan Lee,1 Dong-Mi Shin,1 Jae-Won Shim,1 Chang-mee Kim,2 Hyun Kim,2
Sang-Hun Lee,1 and Yong-Sung Lee1*1Department of Biochemistry, College of Medicine, Hanyang University, Seoul 133-791, South Korea2Department of Anatomy, College of Medicine, Korea University, Seoul 136-705, South Korea
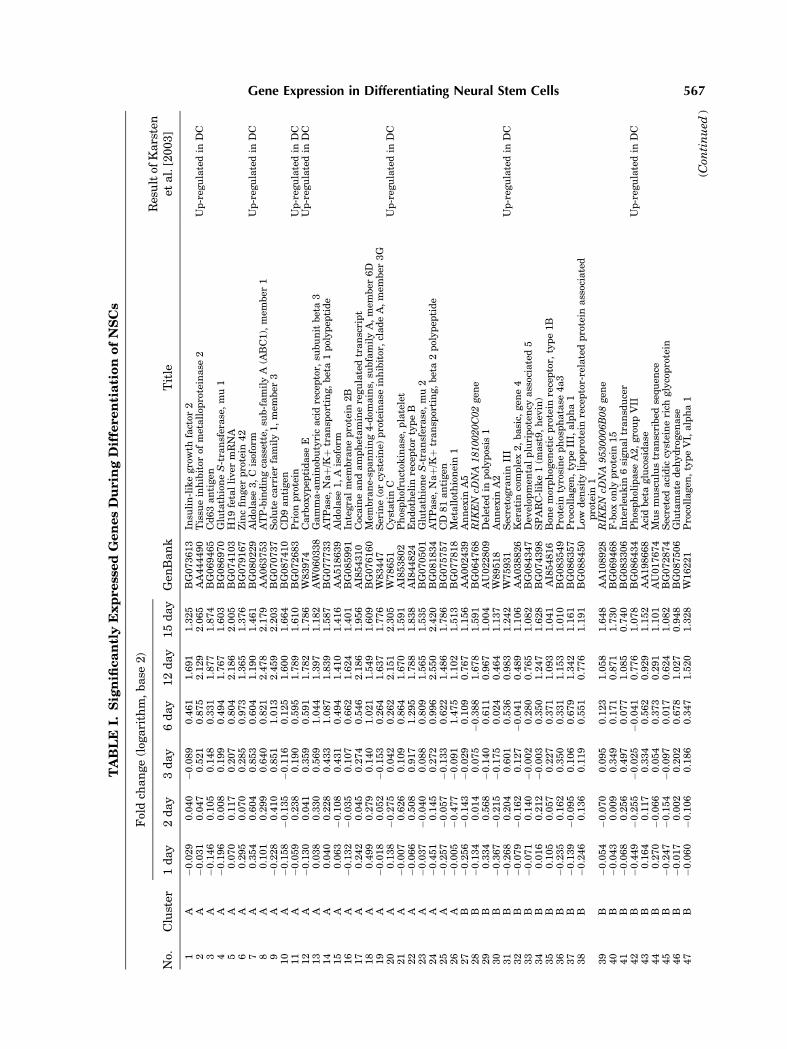
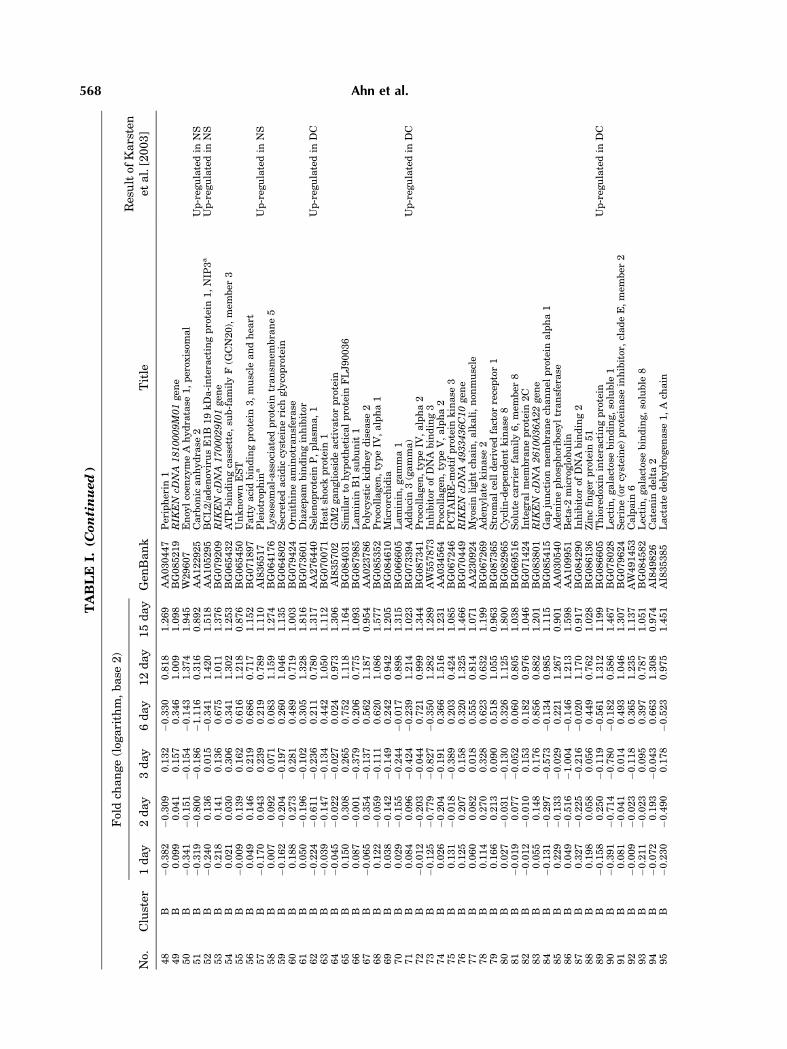
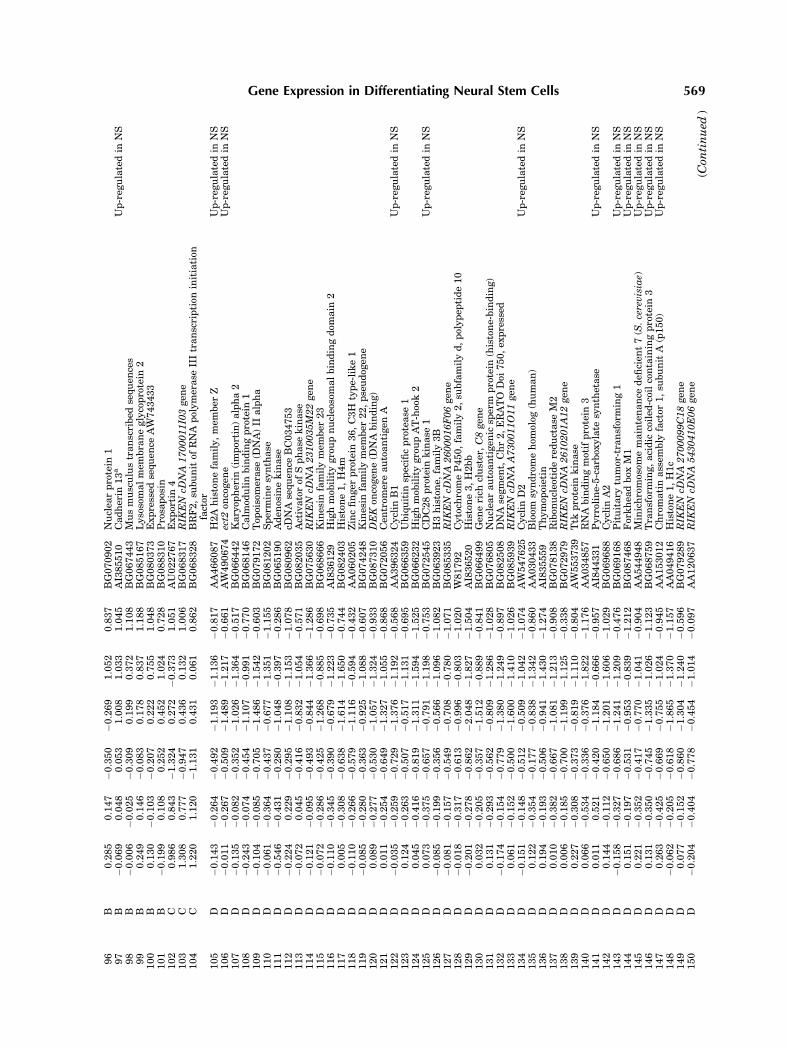
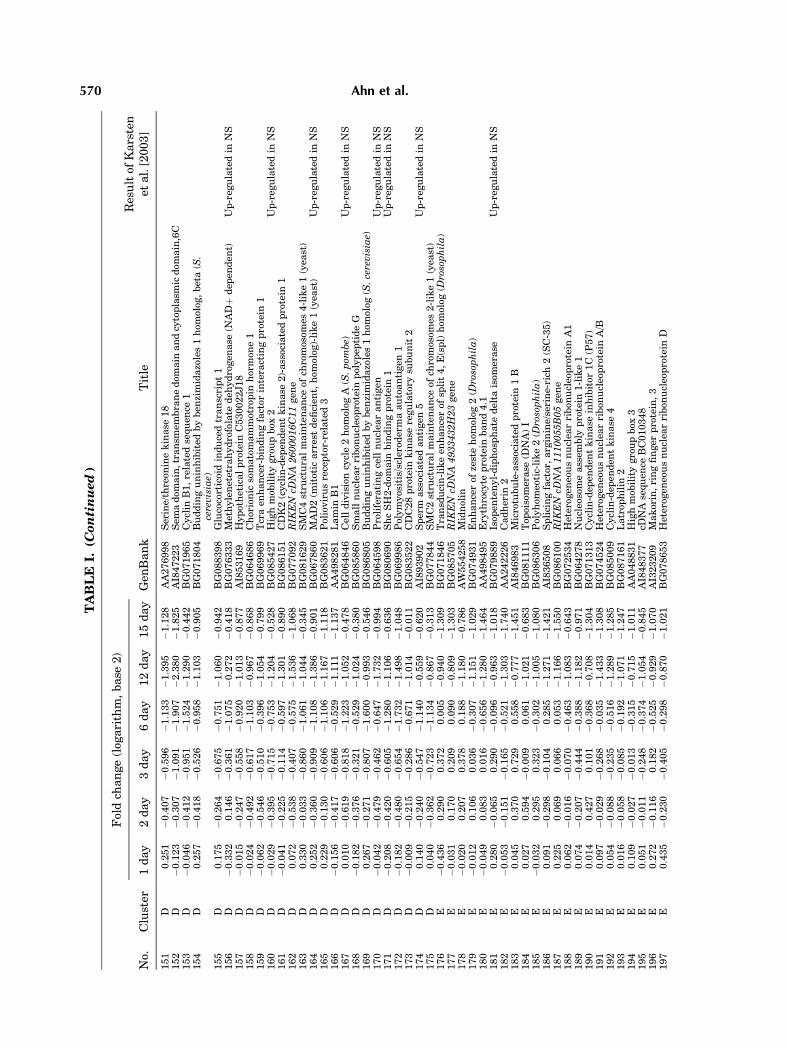
Abstract Temporal analysis in gene expression during differentiation of neural stem cells (NSCs) was performed byusing in-housemicroarrays composed of 10,368 genes. The changes inmRNA level weremeasured during differentiationday 1, 2, 3, 6, 12, and 15. Out of 10,368 genes analyzed, 259 genes were up-regulated or down-regulated by 2-fold ormore at least at one time-point during differentiation, and were classified into six clusters based on their expressionpatterns by K-means clustering. Clusters characterized by gradual increase have large numbers of genes involved intransport and cell adhesion; those which showed gradual decrease have much of genes in nucleic acid metabolism, cellcycle, transcription factor, and RNA processing. In situ hybridization (ISH) validated microarray data and it also showedthat Fox M1, cyclin D2, and CDK4 were highly expressed in CNS germinal zones and ectonucleotide pyrophosphatase/phosphodiesterase 2 (Enpp2) was highly expressed in choroid plexus where stem/progenitor cells are possibly located.Together, this clustering analysis of expressionpatterns of functionally classified genesmaygive insight intounderstandingof CNS development and mechanisms of NSCs proliferation and differentiation. J. Cell. Biochem. 93: 563–578, 2004.� 2004 Wiley-Liss, Inc.
Key words: microarray; proliferation; in situ hybridization; germinal zone; choroid plexus
Neural stem cells (NSCs) are multipotentand self-renewing cell population able to gene-rate the three major central nervous system(CNS) lineages neurons, astrocytes, and oligo-dendrocytes. Therefore, NSCs is thought of as areservoirwith thepotential to becomeanyone ofthe thousands of cell types within the CNS[McKay, 1997; Ross et al., 2003].Analyses of a variety of mammalian model
systems have identified helix-loop-helix (HLH)transcription factors as a regulator of earlydifferentiation of NSCs. The different classes
of HLH factors cross-regulate one another tomediate the effect of several signaling systemson a large number of target genes. HLH tran-scription factors participate at different stagesof NSC differentiation, such as formation ofprogenitor cells, initiation of differentiation,cell fate determination, neurite outgrowth,and synaptogenesis, and the timing of differ-entiation is regulated by the balance of thesefactors [Morrison, 2001; Ross et al., 2003].
The signaling molecules that regulate thetransition of NSCs from proliferation to differ-entiation are beginning to be identified, withseveral growth factors, including basic fibro-blast growth factor, epidermal growth factor,brain-derived neurotrophic factor, and notchligands [Vescovi et al., 1993; Zigova et al., 1998;Benraiss et al., 2001; Caldwell et al., 2001].In addition to these factors on the stem cellproliferation and differentiation, identificationof other factors will advance the understandingof CNS development and the potential for theuse of stem cells as therapeutic agents [Karstenet al., 2003].
� 2004 Wiley-Liss, Inc.
Grant sponsor: Korean Ministry of Health & Welfare;Grant number: 01-PJ10-PG8-01EC01-0023.
*Correspondence to: Dr. Yong-Sung Lee, Department ofBiochemistry, College of Medicine, Hanyang University,Seoul 133-791, South Korea.E-mail: [email protected]
Received 10 February 2004; Accepted 20 April 2004
DOI 10.1002/jcb.20168
To identify regulatory genes that are involvedin NSCs proliferation and differentiation, wehave performed in-house-made cDNA micro-array, which allows simultaneous assessmentof the expression of potentially thousands ofgenes. Recently, some microarray analyseswere performed to investigate the molecularmechanism underlying NSC proliferation andpluripotency [Geschwind et al., 2001; Luo et al.,2002]. However, most genes identified in thesemicroarrays do not overlap with each other.Elucidation of common genetic factor in variousstem cell populations is hampered by differentexperimental design and analysis. To highlightconserved genes expressed during differen-tiation in NSCs, we compared list of genesidentified in this embryonic stem cell (ES)-derived NSCs population with genes identifiedin other stem cell populations, such as primaryneural progenitor cells [Karsten et al., 2003].
MATERIALS AND METHODS
ES Cell-Derived Neural Stem Cellsand Differentiation
The NSCs were generated through five-stagemethod as described [Lee et al., 2000]. Nestin-positive cells (NSCs, stage 4) were expanded for4 days. The medium was changed every 2 days.Differentiation (stage 5) was induced byremoval of bFGF. The cells were incubatedunder differentiation conditions for 1, 2, 3, 6, 12,and 15 days. The total RNA of each time-pointwas extracted using Tri-Reagent (MRC, Inc.,Cincinnati, OH) according to the manufac-turer’s instructions.
Microarray Fabrication and Hybridization
A total of 10,368 cDNA clones were spottedonto SuperAldehyde slides (Telechem, Sunnyvale,CA) using a MicroGrid TAS arrayer (Genomicsolutions, Huntingdon, United Kingdom) aspreviously described [Lee et al., 2002]. Themicroarray consisted of 6,531 clones from theNational Institute of Aging (NIA), 1,243 clonesfrom the Brain Molecular Anatomy Project(BMAP), 2,060 clones from Incyte, and hous-keeping genes and yeast DNA as negativecontrols.
Probes were made from 2 mg of total RNAfromNSCs (stage 4) for control and 2 mg of RNAfrom each differentiated cells RNA (stages 5),using a dendrimer labeling kit (3DNA 350RP;Genisphere, Hatfield, PA). For each experiment,
at least four replicates were performed, and twoof these were repeated with the fluorophoresreversed to eliminate false-positive results.
Scanning and Data Analysis
The two fluorescent images from each slidewere scanned separately using a GMS 418scanner (Affymetrix, Santa Clara, CA). Theimages were analyzed using ImaGene 4.2(Biodiscovery, El Segundo, CA) and MAAS(Gaiagene, Seoul, Korea) software. Cy3:Cy5intensity ratios from each gene were calculatedand subsequently normalized with nonlinearlowess normalization. To filter out unreliabledata, spots with signal-to-noise ratios below 2were flagged. The non-flagged genes in at leastthree out of four experiments were used forfurther analysis. We took the median valuefrom the gene expression ratio of each of fourindependent experiments and selected geneswhose expression level differed from theirmeanexpression level by at least 2-fold at one ormoredifferentiation time. K-means clustering wasapplied to genesusing theEuclidean distance asa similarity measurement, as implemented inthe software program Genesis (http://genome.tugraz.at, Sturn et al. [2002]). Genes showingmore than a 2-fold difference in expression levelwere divided into categories according to theirmolecular function using the classificationscheme in Gene OntologyTM. To examine sta-tistical significance for frequencies of genes ofeach functional group in each cluster, two-sidedFisher’s exact test was performed.
Immunocytochemistry
The cells were grown on polyornithine (15 mg/ml, Sigma, St. Louis, MO)/fibronectin (1 mg/ml,Sigma) coated coverslips and fixed with 4%paraformaldehyde/0.15% picric acid in 0.1%bovine serum albumin (BSA)/phosphate-buf-fered saline (PBS). Subsequently, the cells werewashed three-times with BSA/PBS and per-meabilized with Triton X-100/PBS. The cellswere incubated for 12 h at 48C with polyclonalnestin antibodies (1:50) (Matha Marvin andRon McKay, National Institute of Health,Bethesda,MD), polyclonal neuron-specific classIII b-tubulin (Tuj1) antibodies (1:2,000) (Babco,Richmond, CA) and polyclonal glial fibrillaryacidic protein (GFAP)antibodies (1:400) (DAKO,Glostrup, Denmark). For detection of primaryantibodies, fluorescence labeled (FITC or Cy3)secondary antibodies (Jackson Immunore-
564 Ahn et al.
search Laboratories, West Grove, PA) were usedaccording to the specifications of the manufac-turer. Cells were mounted in Vectashield con-taining 40, 6-diamidino-2-phenylindole (DAPI;Vector Laboratories, Burlingame, CA) andanalyzed under an epifluorescence microscope(Nikon, Tokyo, Japan).
Semi-Quantitative andReal-Time Quantitative RT-PCR
For semi-quantitative and real-time quanti-tative RT-PCR, beta-actin was used as aninternal control with the following primer sets;50-ctt tat ggt gtggtc gcaga-30 and50-tca ggg tag tcagcc atg tg-30. For each sample from each time-point, the same total RNAused for cDNAmicro-array hybridization was reverse-transcribedusing 1 mM oligo (dT) primer with SuperscriptII reverse transcriptase (Invitrogen, Carlsbad,CA). The thermal profiles consisted of 958C for5 min for initial denaturing, followed by 25–30 cycles of 958C for 30 s, 588C for 30 s, and 728Cfor 30 s. All RT-PCR reactions were repeatedat least three-times. Triplicate real-time RT-PCR experiments were performed using iCycleriQ system (Bio-Rad, Hercules, CA) and theSYBR Green I dye (Molecular probes, Eugene,OR). Amelting curvewas obtained for eachPCRproduct after each run to confirm that the signalcorresponded to a unique amplicon of theproduct size. The following primers were used:50-ggagtgtcgcttagaggtgc-30 and 50-tccagaaagc-caagagaagc-30 for nestin; 50-tgtcagaggagccc-gaggtc-30 and 50-ccaagagcagcccatcaaag-30 fortyrosine hydroxylase (TH); 50-aaggtagccgtgtgt-gacatc-30 and 50-accaggtcattcatgttgctc-30 for Tuj1;50-ccaaactggctgatgtctacc-30 and 50-gcttcatgtgc-ctcctgtcta-30 for GFAP; 50-tccctacataacgggagc-ag-30 and 50-aactcaggccaagcgataga-30 for insu-lin-like growth factor 2 (Igf2); 50-ttttcatcttgg-cagctgtg-30 and 50-acactccactgccattctcc-30 forpleiotrophin; 50-ttccccagaagcgaaatatg-30 and50-tgaccccattcctttctgac-30 for ectonucleotide pyr-ophosphatase/phosphodiesterase 2 (Enpp2); 50-gatgatttccgagggagaca-30 and 50-catgaggaatgt-cagccaga-30 for N-myc downstream regulated2 (Ndr2); 50-gaggaaacagcaccttcagc-30and 50-ag-gcaatgtctccttgatgg-30 for forkhead box M1(FoxM1); 50-ggaagagactgttggaagagga-30and 50-ctgataagcccaggctagaaga-30 for thymopoietin.
In Situ Hybridization
ISH were performed on E13.5, E18.5, P0, P7,and P14 BL6 mouse brains and embryos sec-
tioned at 12 mm. Sections were thaw-mountedonto gelatin-coated slides, fixed in 4% parafor-maldehyde, treated with 0.25% acetic anhy-dride in 0.1 M triethanolamine/0.9% NaCl(pH 8.0), dehydrated and defatted in ethanoland chloroform, and finally air-dried. Tran-scription of antisense probes was carried outusing the Riboprobe (Promega, Madison, WI) inthe presence of a-35S-UTP (Amersham, Buck-inghamshire, England). Sections were hybri-dized overnight at 538C with 5� 105 cpm oflabeled probe per slide, treated with RNase A(20 mg/ml, Boehringer-Mannheim, Mannheim,Germany) for 30 min at 258C, washed sequen-tially for 60 min in 2� SSC (1� SSC is 0.15 Msodium chloride, 0.015 M sodium citrate, pH7.2) at 508C, 60 min in 0.2� SSC at 558C, and60 min in 0.2� SSC at 60� 8C, briefly rinsed ina graded series of ethanol containing 0.3 Mammonium acetate and dried. Hybridizedradioactivity was visualized after 6 days’ expo-sure using-max film (Amersham, ArlingtonHeights, IL).
RESULTS
Generation and Differentiation ofNeural Stem Cells
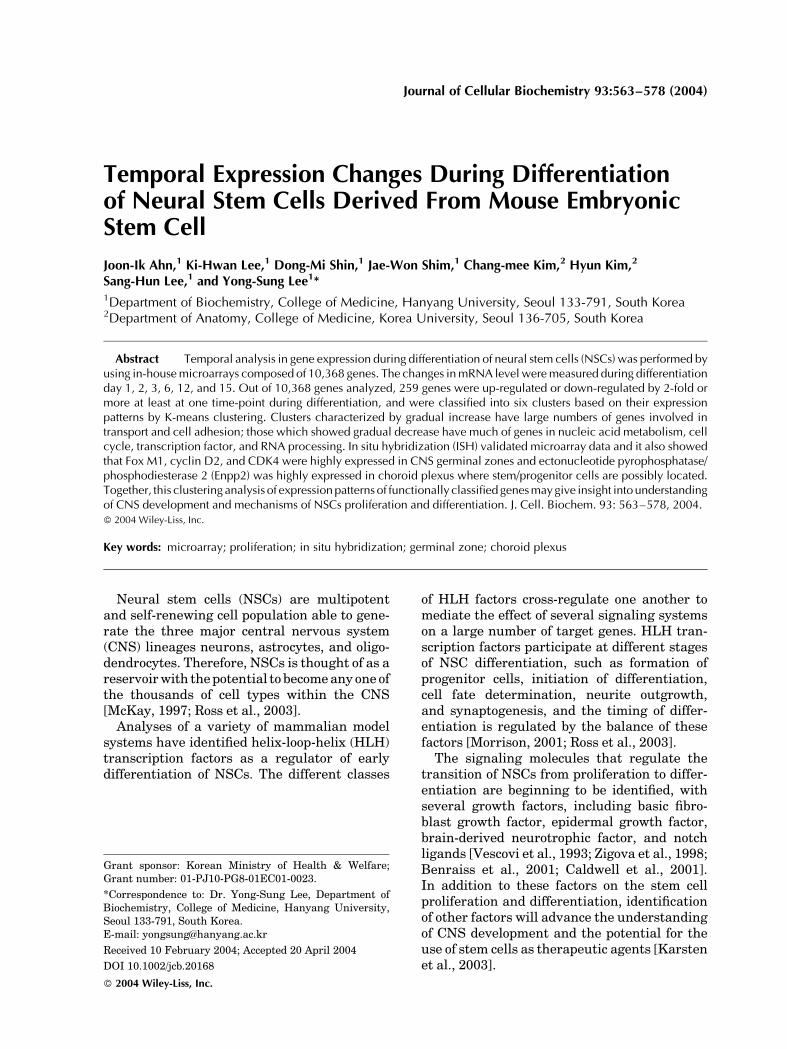
To generate NSCs, we adopted lineage selec-tion (five-stage) method that leads to theefficient selection and proliferation of NSCsfrom ES cell. We performed immunocytochem-istry to evaluate generation and differentiationof NSCs. As shown in Figure 1A, a majority ofcells in the stage 4 were labeled with nestin,which is commonly used marker for NSCs.After 6 day of bFGF removal, differentiatedcells were immunostained with Tuj1 and GFAPwhich is specific marker for neurons andastrocytes, respectively. Furthermore, morpho-logical changes were observed. TheNSCs beganextension of neurite-like structures at day 2after removal bFGF. The number and length ofneurite-like structures were increased as thedifferentiation time of cultures evolves (Fig. 1B).We also performed semiquantitative RT-PCRanalysis for neuronal and glial phenotypicgenes (Fig. 1C). Nestin showed little expres-sion since differentiation day 12. Tuj1 andGFAP were gradually increased during differ-entiation. Additionally, TH was also graduallyexpressed, because our culture method gene-rates dopaminergic neurons in high yield [Leeet al., 2000].
Gene Expression in Differentiating Neural Stem Cells 565
Identification of Significantly Expressed Genes
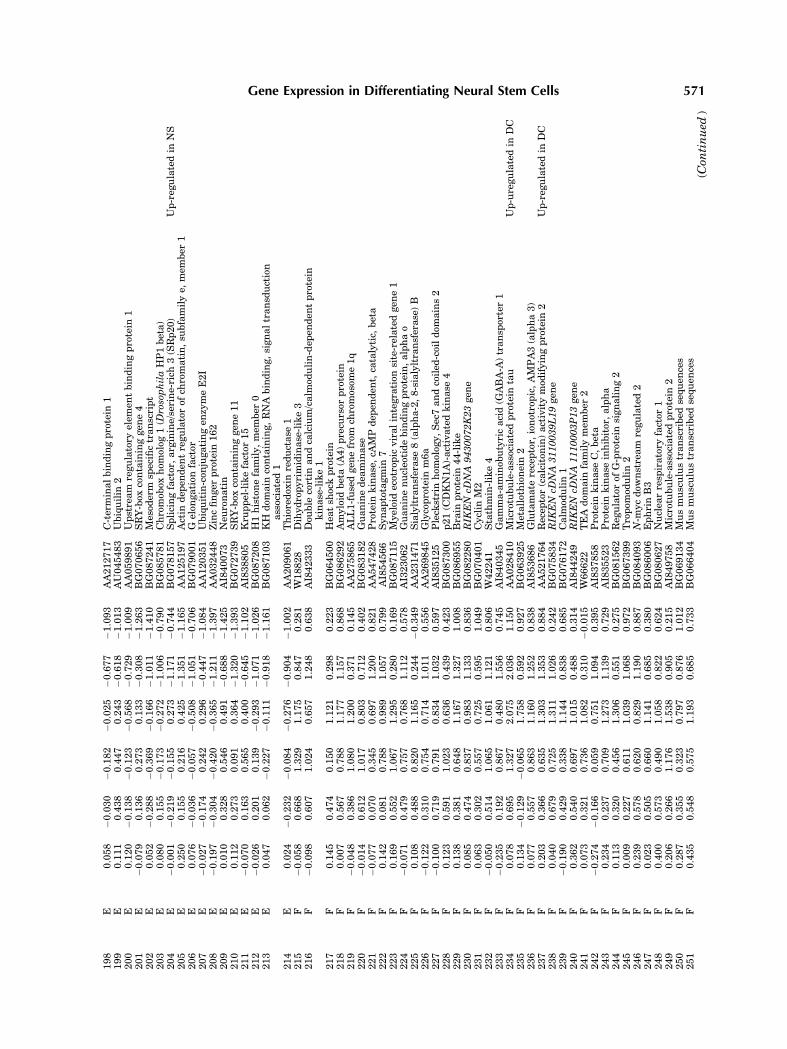
To examine the temporal changes in geneexpression during differentiation comprehen-sively, we performed gene expression profiling.Total RNA derived from differentiated cell at 1,2, 3, 6, 12, or 15 days and the control (NSCs)were subjected to cDNA synthesis. Both cDNAswere subsequentlymixed and hybridizedwith amicroarray. After hybridization, specific Cy3and Cy5 dye labeling for each cDNA (NSCs vs.differentiating cells) were carried out in chips.The flagged genes at more than one time-pointwere not subjected to further analysis (K-meansclustering). The data set of differentially ex-pressed genes including missing value is avail-able at; http://neurogenomics.hanyang.ac.kr.Out of the 10,368 genes represented on the chip,259 genes were up- or down-regulated 2-foldor more at least at one time-point during thedifferentiation (Table I).
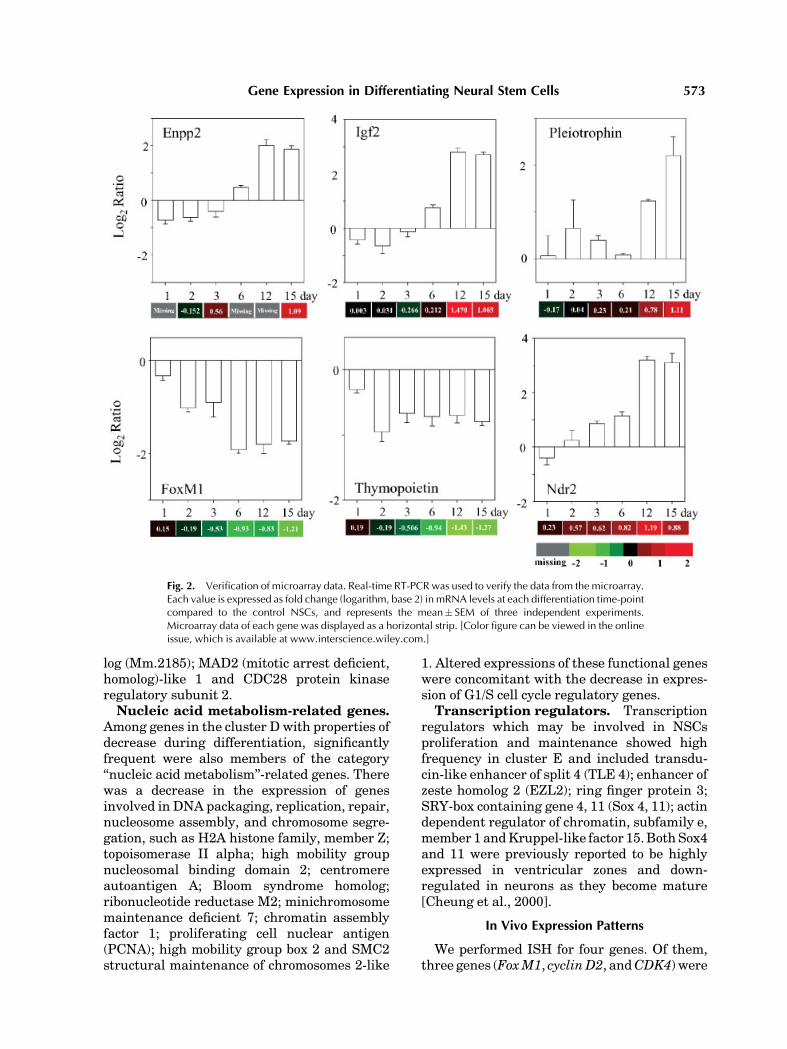
To determine the validity of results obtain-ed by the microarray analysis, six randomlyselected genes (Igf2,pleiotrophin, thymopoietin,
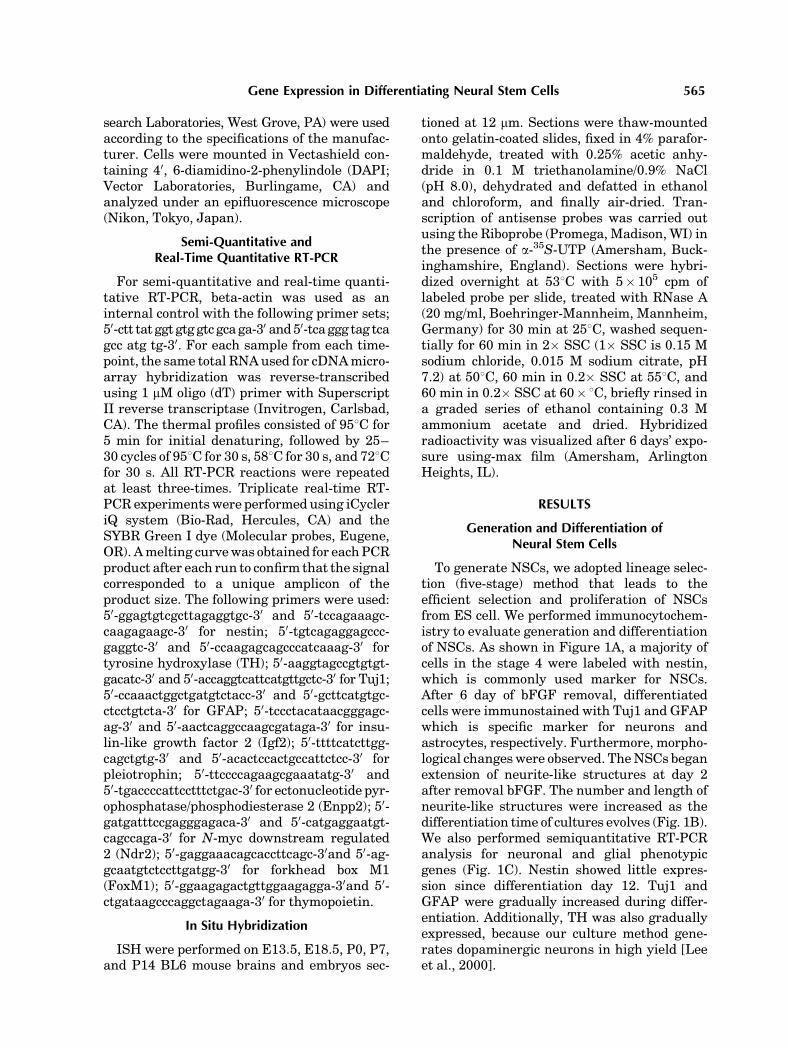
Enpp2, FoxM1, Ndr2) were subjected to real-time quantitative PCR analysis. These expres-sion pattern observed by PCR showed a goodconcordance with the pattern assayed bymicro-array (Fig. 2).
Temporal Cluster Analysis
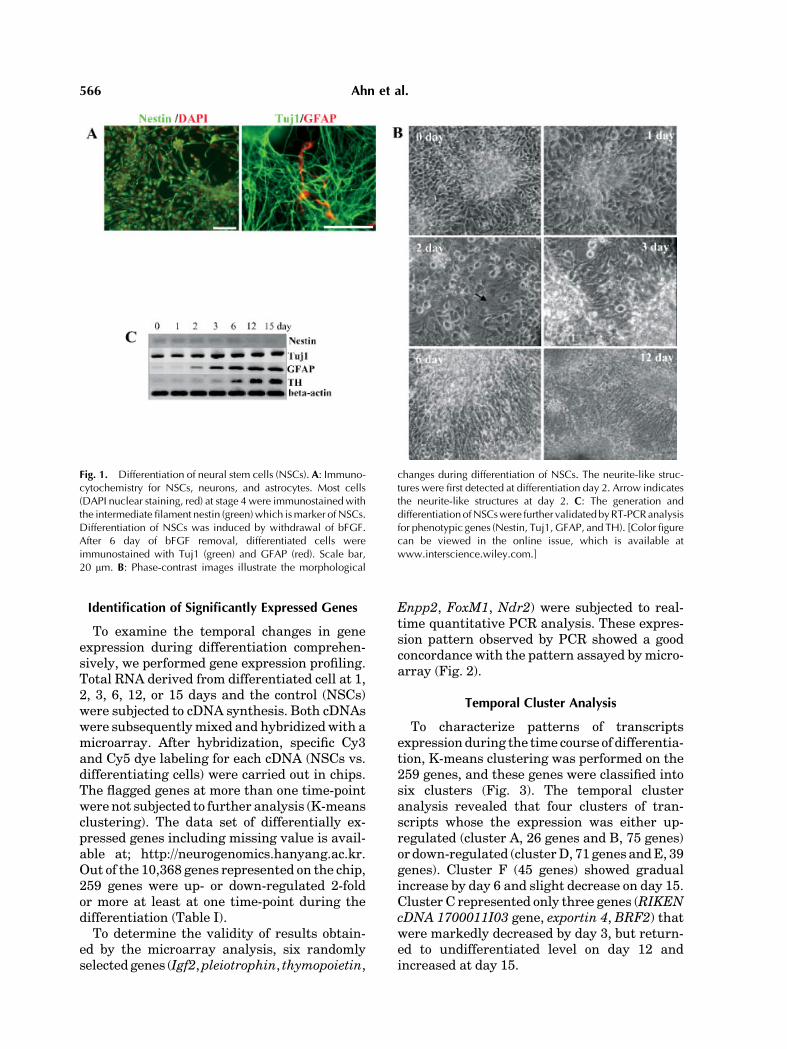
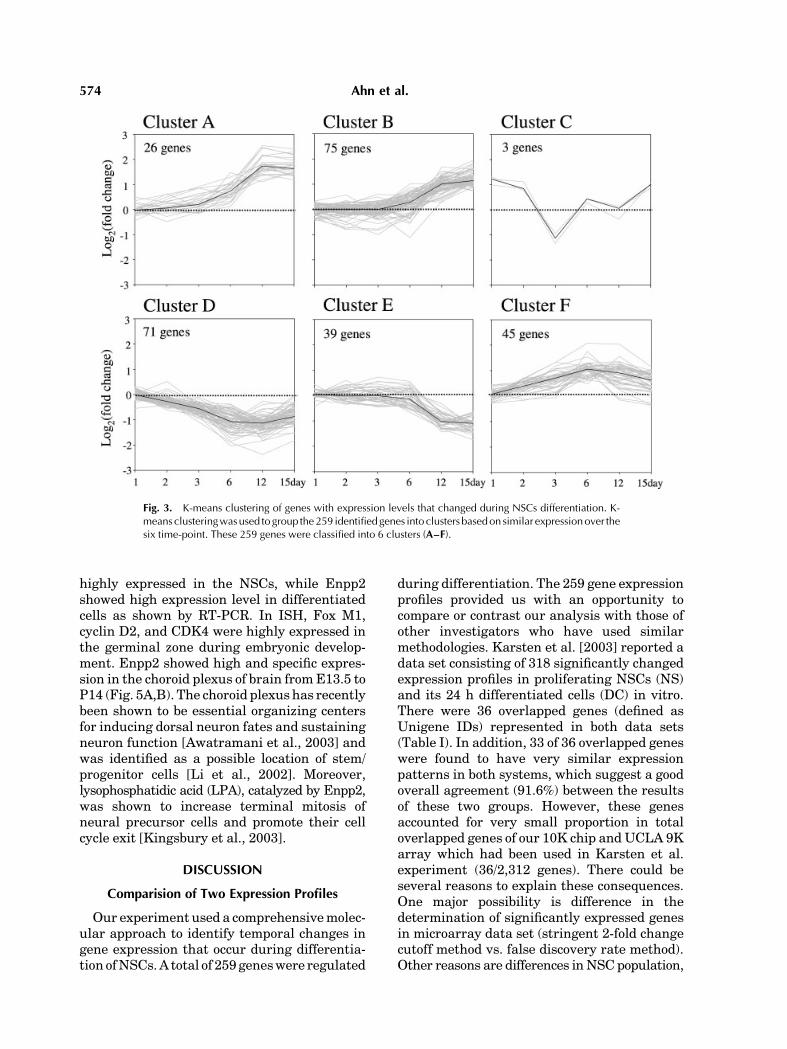
To characterize patterns of transcriptsexpressionduring the time course of differentia-tion, K-means clustering was performed on the259 genes, and these genes were classified intosix clusters (Fig. 3). The temporal clusteranalysis revealed that four clusters of tran-scripts whose the expression was either up-regulated (cluster A, 26 genes and B, 75 genes)or down-regulated (clusterD, 71genes andE, 39genes). Cluster F (45 genes) showed gradualincrease by day 6 and slight decrease on day 15.Cluster C represented only three genes (RIKENcDNA 1700011I03 gene, exportin 4, BRF2) thatwere markedly decreased by day 3, but return-ed to undifferentiated level on day 12 andincreased at day 15.
Fig. 1. Differentiation of neural stem cells (NSCs). A: Immuno-cytochemistry for NSCs, neurons, and astrocytes. Most cells(DAPI nuclear staining, red) at stage 4 were immunostained withthe intermediate filament nestin (green)which ismarker of NSCs.Differentiation of NSCs was induced by withdrawal of bFGF.After 6 day of bFGF removal, differentiated cells wereimmunostained with Tuj1 (green) and GFAP (red). Scale bar,20 mm. B: Phase-contrast images illustrate the morphological
changes during differentiation of NSCs. The neurite-like struc-tures were first detected at differentiation day 2. Arrow indicatesthe neurite-like structures at day 2. C: The generation anddifferentiationofNSCswere further validatedbyRT-PCRanalysisfor phenotypic genes (Nestin, Tuj1, GFAP, and TH). [Color figurecan be viewed in the online issue, which is available atwww.interscience.wiley.com.]
566 Ahn et al.
TABLE
I.Signifi
cantlyExpressedGenesDurin
gDifferentiationofNSCs
No.
Cluster
Foldch
ange(log
arithm,base
2)
Gen
Bank
Title
Resultof
Karsten
etal.[2003]
1day
2day
3day
6day
12day
15day
1A
�0.029
0.040
�0.089
0.461
1.691
1.325
BG073613
Insu
lin-likegrowth
factor
22
A�0.031
0.047
0.521
0.875
2.129
2.065
AA444490
Tissu
einhibitor
ofmetallop
roteinase
2Up-reg
ulatedin
DC
3A
�0.146
0.105
0.148
0.331
1.877
1.874
BG069465
Cd63antigen
4A
�0.196
0.008
0.199
0.494
1.767
1.603
BG086970
GlutathioneS-transferase,mu1
5A
0.070
0.117
0.207
0.804
2.186
2.005
BG074103
H19fetalliver
mRNA
6A
0.295
0.070
0.285
0.973
1.365
1.376
BG079167
Zincfinger
protein
42
7A
0.354
0.604
0.853
0.604
1.190
1.461
BG080229
Aldolase
3,C
isoform
Up-reg
ulatedin
DC
8A
0.101
0.299
0.640
0.821
2.478
2.179
AA063753
ATP-bindingcassette,su
b-familyA
(ABC1),mem
ber
19
A�0.228
0.410
0.851
1.013
2.459
2.203
BG070737
Solute
carrierfamily1,mem
ber
310
A�0.158
�0.135
�0.116
0.125
1.600
1.664
BG087410
CD9antigen
11
A�0.059
0.238
0.190
0.595
1.789
1.610
BG072683
Prion
protein
Up-reg
ulatedin
DC
12
A�0.130
0.041
0.359
0.591
1.782
1.786
W83974
Carbox
ypep
tidase
EUp-reg
ulatedin
DC
13
A0.038
0.330
0.569
1.044
1.397
1.182
AW060338
Gamma-aminob
utyricacidreceptor,
subunit
beta3
14
A0.040
0.228
0.433
1.087
1.839
1.587
BG077733
ATPase,Naþ/K
þtransp
orting,beta1polypep
tide
15
A0.063
�0.108
0.431
0.494
1.410
1.416
AA518639
Aldolase
1,A
isoform
16
A�0.132
�0.035
0.107
0.662
1.624
1.401
BG085991
Integralmem
braneprotein
2B
17
A0.242
0.045
0.274
0.546
2.186
1.956
AI854310
Cocaineandamphetamineregulatedtranscript
18
A0.499
0.279
0.140
1.021
1.549
1.609
BG076160
Mem
brane-sp
anning4-dom
ains,
subfamilyA,mem
ber
6D
19
A�0.018
0.052
�0.153
0.264
1.637
1.776
W83447
Serine(orcysteine)
proteinase
inhibitor,cladeA,mem
ber
3G
20
A0.138
�0.275
0.042
0.262
2.151
2.305
W78651
CystatinC
Up-reg
ulatedin
DC
21
A�0.007
0.626
0.109
0.864
1.670
1.591
AI853802
Phosphofru
ctok
inase,platelet
22
A�0.066
0.508
0.917
1.295
1.788
1.838
AI844824
Endothelin
receptortypeB
23
A�0.037
�0.040
0.088
0.809
1.565
1.535
BG070501
GlutathioneS-transferase,mu2
24
A�0.451
0.145
0.272
0.996
2.550
2.420
BG081834
ATPase,Naþ/K
þtransp
orting,beta2polypep
tide
25
A�0.257
�0.057
�0.133
0.622
1.486
1.786
BG075757
CD
81antigen
26
A�0.005
�0.477
�0.091
1.475
1.102
1.513
BG077818
Metallothionein1
27
B�0.256
�0.143
�0.029
0.109
0.767
1.156
AA002439
Annex
inA5
28
B�0.134
0.014
0.075
�0.388
1.678
1.591
BG064768
RIK
EN
cDNA
1810020C02gen
e29
B0.334
0.568
�0.140
0.611
0.967
1.004
AU022809
Deleted
inpolyposis
130
B�0.367
�0.215
�0.175
0.024
0.464
1.137
W89518
Annex
inA2
31
B�0.268
0.204
0.601
0.536
0.983
1.242
W75931
Secretogranin
III
Up-reg
ulatedin
DC
32
B�0.079
�0.162
0.127
�0.041
0.489
1.106
AA038826
Keratincomplex2,basic,
gen
e4
33
B�0.071
0.140
�0.002
0.280
0.765
1.082
BG084347
Dev
elop
men
talpluripoten
cyassociated5
34
B0.016
0.212
�0.003
0.350
1.247
1.628
BG074398
SPARC-like1(m
ast9,hev
in)
35
B0.105
0.057
0.227
0.371
1.093
1.041
AI854816
Bon
emorphog
enetic
protein
receptor,
type1B
36
B�0.235
0.162
0.350
0.331
1.153
1.010
BG083549
Protein
tyrosinephosphatase
4a3
37
B�0.139
�0.095
0.106
0.679
1.342
1.161
BG086357
Procollagen
,typeIII,alpha1
38
B�0.246
0.136
0.119
0.551
0.776
1.191
BG088450
Low
den
sity
lipop
rotein
receptor-relatedprotein
associated
protein
139
B�0.054
�0.070
0.095
0.123
1.058
1.648
AA108928
RIK
EN
cDNA
9530006B08gen
e40
B�0.043
0.009
0.349
0.171
0.871
1.730
BG069468
F-box
only
protein
15
41
B�0.068
0.256
0.497
0.077
1.085
0.740
BG083306
Interleu
kin
6signaltransd
ucer
42
B�0.449
�0.255
�0.025
�0.041
0.776
1.078
BG086434
Phospholipase
A2,groupVII
Up-reg
ulatedin
DC
43
B0.164
0.117
0.334
0.562
0.929
1.152
AA198668
Acidbetaglucosidase
44
B0.270
�0.066
0.054
0.373
0.291
1.101
AU017674
Musmusculustranscribed
sequen
ce45
B�0.247
�0.154
�0.097
0.017
0.624
1.082
BG072874
Secretedacidic
cysteinerich
glycoprotein
46
B�0.017
0.002
0.202
0.678
1.027
0.948
BG087506
Glutamate
deh
ydrogen
ase
47
B�0.060
�0.106
0.186
0.347
1.520
1.328
W16221
Procollagen
,typeVI,alpha1
(Con
tinued
)
Gene Expression in Differentiating Neural Stem Cells 567
TABLE
I.(C
ontinued
)
No.
Cluster
Foldch
ange(log
arithm,base
2)
Gen
Bank
Title
Resultof
Karsten
etal.[2003]
1day
2day
3day
6day
12day
15day
48
B�0.382
�0.309
0.132
�0.330
0.818
1.269
AA030447
Peripherin
149
B0.099
0.041
0.157
0.346
1.009
1.098
BG085219
RIK
EN
cDNA
1810009M01gen
e50
B�0.341
�0.151
�0.154
�0.143
1.374
1.945
W29607
Enoy
lcoen
zymeA
hydratase
1,perox
isom
al
51
B�0.319
�0.800
�0.186
�1.116
0.316
0.892
AA122925
Carbon
icanhydrase
2Up-reg
ulatedin
NS
52
B�0.240
0.136
0.015
�0.341
1.420
1.518
AA105295
BCL2/aden
ovirusE1B
19kDa-interactingprotein
1,NIP
3a
Up-reg
ulatedin
NS
53
B0.218
0.141
0.136
0.675
1.011
1.376
BG079209
RIK
EN
cDNA
1700029I01gen
e54
B0.021
0.030
0.306
0.341
1.302
1.253
BG065432
ATP-bindingcassette,su
b-familyF(G
CN20),mem
ber
355
B�0.009
0.139
0.162
0.616
1.218
0.876
BG065450
Unknow
nEST
56
B0.049
0.146
0.219
0.686
0.717
1.152
BG071897
Fattyacidbindingprotein
3,muscle
andhea
rt57
B�0.170
0.043
0.239
0.219
0.789
1.110
AI836517
Pleiotrop
hin
aUp-reg
ulatedin
NS
58
B0.007
0.092
0.071
0.083
1.159
1.274
BG064176
Lysosomal-associatedprotein
transm
embrane5
59
B�0.162
�0.204
�0.197
0.260
1.046
1.135
BG064802
Secretedacidic
cysteinerich
glycoprotein
60
B0.188
0.273
0.281
0.489
0.719
1.003
BG079424
Orn
ithineaminotransferase
61
B0.050
�0.196
�0.102
0.305
1.328
1.816
BG073601
Diazepam
bindinginhibitor
62
B�0.224
�0.611
�0.236
0.211
0.780
1.317
AA276440
Selen
oprotein
P,plasm
a,1
Up-reg
ulatedin
DC
63
B�0.039
�0.147
�0.134
0.442
1.050
1.112
BG070071
Hea
tsh
ockprotein
164
B�0.045
�0.022
�0.027
0.024
0.973
1.306
AI835702
GM2gangliosideactivatorprotein
65
B0.150
0.308
0.265
0.752
1.118
1.164
BG084031
Sim
ilarto
hypotheticalprotein
FLJ90036
66
B0.087
�0.001
�0.379
0.206
0.775
1.093
BG087985
Laminin
B1su
bunit
167
B�0.065
0.354
�0.137
0.562
1.187
0.954
AA023786
Polycystic
kidney
disea
se2
68
B0.122
�0.059
�0.111
0.620
1.086
1.577
BG085352
Procollagen
,typeIV
,alpha1
69
B0.038
�0.142
�0.149
0.242
0.942
1.205
BG084610
Microrchidia
70
B0.029
�0.155
�0.244
�0.017
0.898
1.315
BG066605
Laminin,gamma1
71
B0.084
0.096
�0.424
�0.239
1.214
1.023
BG073394
Adducin3(gamma)
Up-reg
ulatedin
DC
72
B�0.012
�0.203
�0.044
0.721
0.999
1.344
BG087341
Procollagen
,typeIV
,alpha2
73
B�0.125
�0.779
�0.827
�0.350
1.282
1.289
AW557873
Inhibitor
ofDNA
binding3
74
B0.026
�0.204
�0.191
0.366
1.516
1.231
AA034564
Procollagen
,typeV,alpha2
75
B0.131
�0.018
�0.389
0.203
0.424
1.085
BG067246
PCTAIR
E-m
otifprotein
kinase
376
B0.125
0.207
0.158
0.320
1.325
1.466
BG070449
RIK
EN
cDNA
4933436C10gen
e77
B0.060
0.082
0.018
0.555
0.814
1.071
AA230924
Myosin
lightch
ain,alkali,non
muscle
78
B0.114
0.270
0.328
0.623
0.632
1.199
BG067269
Aden
ylate
kinase
279
B0.166
0.213
0.090
0.518
1.055
0.963
BG087365
Strom
alcellderived
factor
receptor1
80
B0.027
�0.031
�0.130
0.326
1.125
1.800
BG082965
Cyclin-dep
enden
tkinase
881
B�0.019
0.077
�0.052
0.060
0.805
1.038
BG069516
Solute
carrierfamily6,mem
ber
882
B�0.012
�0.010
0.153
0.182
0.976
1.046
BG071424
Integralmem
braneprotein
2C
83
B0.055
0.148
0.176
0.856
0.882
1.201
BG083801
RIK
EN
cDNA
2610036A22gen
e84
B�0.131
�0.297
�0.573
�0.134
0.985
1.115
BG085415
Gapjunctionmem
branech
annel
protein
alpha1
85
B0.229
�0.133
�0.029
0.221
1.267
0.901
AA030540
Aden
inephosphoribosyltransferase
86
B0.049
�0.516
�1.004
�0.146
1.213
1.598
AA109951
Beta-2
microglobulin
87
B0.327
�0.225
�0.216
�0.020
1.170
0.917
BG084290
Inhibitor
ofDNA
binding2
88
B0.198
0.058
0.056
0.449
0.762
1.028
BG086136
Zincfinger
protein
51
89
B�0.158
0.250
�0.119
�0.561
1.312
1.199
BG086605
Thioredox
ininteractingprotein
Up-reg
ulatedin
DC
90
B�0.391
�0.714
�0.780
�0.182
0.586
1.467
BG078028
Lectin,galactosebinding,soluble
191
B0.081
�0.041
0.014
0.493
1.046
1.307
BG079624
Serine(orcysteine)
proteinase
inhibitor,cladeE,mem
ber
292
B�0.009
�0.023
�0.118
0.365
1.235
1.137
AW491453
Calpain
693
B�0.211
�0.023
0.095
0.397
0.787
1.051
BG084582
Lectin,galactosebinding,soluble
894
B�0.072
0.193
�0.043
0.663
1.308
0.974
AI849826
Catenin
delta
295
B�0.230
�0.490
0.178
�0.523
0.975
1.451
AI835385
Lactate
deh
ydrogen
ase
1,A
chain
568 Ahn et al.
96
B0.285
0.147
�0.350
�0.269
1.052
0.837
BG070902
Nuclea
rprotein
197
B�0.069
0.048
0.053
1.008
1.033
1.045
AI385510
Cadherin
13a
Up-reg
ulatedin
NS
98
B�0.006
�0.025
�0.309
0.199
0.372
1.108
BG067443
Musmusculustranscribed
sequen
ces
99
B0.249
0.146
�0.083
0.178
0.837
1.188
BG085167
Lysosomalmem
braneglycoprotein
2100
B0.130
�0.103
�0.207
0.222
0.755
1.048
BG080373
Expressed
sequen
ceAW743433
101
B�0.199
0.108
0.252
0.452
1.024
0.728
BG088310
Prosa
posin
102
C0.986
0.843
�1.324
0.272
�0.373
1.051
AU022767
Exportin4
103
C1.308
0.777
�0.947
0.436
0.132
1.006
BG068317
RIK
EN
cDNA
1700011I03gen
e104
C1.220
1.120
�1.131
0.431
0.061
0.862
BG068328
BRF2,su
bunit
ofRNA
polymerase
IIItranscription
initiation
factor
105
D�0.143
�0.264
�0.492
�1.193
�1.136
�0.817
AA466087
H2A
histonefamily,mem
ber
ZUp-reg
ulatedin
NS
106
D�0.011
�0.267
�0.509
�1.489
�1.217
�0.661
AW490674
ect2
oncogen
eUp-reg
ulatedin
NS
107
D�0.135
�0.082
�0.352
�1.026
�1.364
�0.517
BG066442
Karyop
herin
(importin)alpha2
108
D�0.243
�0.074
�0.454
�1.107
�0.991
�0.770
BG068146
Calm
odulinbindingprotein
1109
D�0.104
�0.085
�0.705
�1.486
�1.542
�0.603
BG079172
Top
oisomerase
(DNA)II
alpha
110
D�0.061
�0.364
�0.437
�0.677
�1.351
�1.155
BG081202
Sperminesynthase
111
D�0.546
�0.431
�0.280
�1.048
�0.397
�0.286
BG065190
Aden
osinekinase
112
D�0.224
0.229
�0.295
�1.108
�1.153
�1.078
BG080962
cDNA
sequen
ceBC034753
113
D�0.072
0.045
�0.416
�0.832
�1.054
�0.571
BG082035
Activatorof
Sphase
kinase
114
D�0.121
�0.095
�0.493
�0.844
�1.366
�1.286
BG075630
RIK
EN
cDNA
2310035M22gen
e115
D�0.072
�0.286
�0.425
�1.268
�0.885
�0.698
BG068666
Kinesin
familymem
ber
23
116
D�0.110
�0.345
�0.390
�0.679
�1.223
�0.735
AI836129
Highmob
ilitygroupnucleosomalbindingdom
ain
2117
D0.005
�0.308
�0.638
�1.614
�1.650
�0.744
BG082403
Histone1,H4m
118
D�0.110
�0.266
�0.579
�1.116
�0.594
�0.432
AA060205
Zincfinger
protein
36,C3H
type-like1
119
D�0.085
�0.280
�0.363
�0.925
�1.088
�0.607
BG074248
Kinesin
familymem
ber
22,pseudog
ene
120
D0.089
�0.277
�0.530
�1.057
�1.324
�0.933
BG087310
DEK
oncogen
e(D
NA
binding)
121
D0.011
�0.254
�0.649
�1.327
�1.055
�0.868
BG072056
Cen
trom
ereautoantigen
A122
D�0.035
�0.259
�0.729
�1.376
�1.192
�0.568
AA396324
Cyclin
B1
Up-reg
ulatedin
NS
123
D0.124
�0.263
�0.507
�0.517
�1.131
�0.695
BG066359
Ubiquitin
specificprotease
1124
D0.045
�0.416
�0.819
�1.311
�1.594
�1.525
BG066232
Highmob
ilitygroupAT-hook2
125
D0.073
�0.375
�0.657
�0.791
�1.198
�0.753
BG072545
CDC28protein
kinase
1Up-reg
ulatedin
NS
126
D�0.085
�0.199
�0.356
�0.566
�1.096
�1.082
BG063923
H3histone,
family3B
127
D�0.081
�0.157
�0.549
�0.708
�0.780
�1.071
BG085335
RIK
EN
cDNA
2600016F06gen
e128
D�0.018
�0.317
�0.613
�0.996
�0.803
�1.020
W81792
Cytoch
romeP450,family2,su
bfamilyd,polypep
tide10
129
D�0.201
�0.278
�0.862
�2.048
�1.827
�1.504
AI836520
Histone3,H2bb
130
D0.032
�0.205
�0.357
�1.512
�0.889
�0.841
BG066499
Gen
erich
cluster,C8gen
e131
D0.131
�0.293
�0.562
�0.809
�1.286
�1.028
BG076805
Nuclea
rautoantigen
icsp
erm
protein
(histone-binding)
132
D�0.174
�0.154
�0.779
�1.380
�1.249
�0.897
BG082508
DNA
segmen
t,Chr2,ERATO
Doi
750,ex
pressed
133
D0.061
�0.152
�0.500
�1.600
�1.410
�1.026
BG085939
RIK
EN
cDNA
A730011O11gen
e134
D�0.151
�0.148
�0.512
�0.509
�1.042
�1.074
AW547625
Cyclin
D2
Up-reg
ulatedin
NS
135
D0.122
�0.354
�0.177
�0.838
�1.342
�0.860
AA030433
Bloom
syndromehom
olog
(human)
136
D0.194
�0.193
�0.506
�0.941
�1.430
�1.274
AI835559
Thymop
oietin
137
D0.010
�0.382
�0.667
�1.081
�1.213
�0.908
BG078138
Ribon
ucleotidereductase
M2
138
D0.006
�0.185
�0.700
�1.199
�1.125
�0.338
BG072979
RIK
EN
cDNA
2610201A12gen
e139
D0.227
�0.308
�0.373
�0.819
�1.110
�0.804
AW553739
Ttk
protein
kinase
140
D0.066
�0.534
�0.336
�0.376
�1.822
�1.176
AA034857
RNA
bindingmotifprotein
3141
D0.011
0.521
�0.420
�1.184
�0.666
�0.957
AI844331
Pyrroline-5-carbox
ylate
synthetase
Up-reg
ulatedin
NS
142
D0.144
�0.112
�0.650
�1.201
�1.606
�1.029
BG069688
Cyclin
A2
143
D�0.158
�0.327
�0.686
�1.241
�1.209
�0.476
BG069168
Pituitary
tumor-transforming1
Up-reg
ulatedin
NS
144
D0.151
�0.197
�0.531
�0.953
�0.839
�1.212
BG087468
Forkhea
dbox
M1
Up-reg
ulatedin
NS
145
D0.221
�0.352
�0.417
�0.770
�1.041
�0.904
AA544948
Minichromosom
emaintenance
defi
cien
t7(S
.cerevisiae)
Up-reg
ulatedin
NS
146
D0.131
�0.350
�0.745
�1.335
�1.026
�1.123
BG068759
Transforming,acidic
coiled
-coilcontainingprotein
3Up-reg
ulatedin
NS
147
D0.263
�0.425
�0.669
�0.755
�1.024
�0.945
AA153012
Chromatinassem
bly
factor
1,su
bunit
A(p150)
Up-reg
ulatedin
NS
148
D�0.062
�0.205
�0.618
�1.865
�1.370
�1.157
AA049416
Histone1,H1c
149
D0.077
�0.152
�0.860
�1.304
�1.240
�0.596
BG079289
RIK
EN
cDNA
2700099C18gen
e150
D�0.204
�0.404
�0.778
�0.454
�1.014
�0.097
AA120637
RIK
EN
cDNA
5430410E06gen
e(C
ontinued
)
Gene Expression in Differentiating Neural Stem Cells 569
TABLE
I.(C
ontinued
)
No.
Cluster
Foldch
ange(log
arithm,base
2)
Gen
Bank
Title
Resultof
Karsten
etal.[2003]
1day
2day
3day
6day
12day
15day
151
D0.251
�0.407
�0.596
�1.133
�1.395
�1.128
AA276998
Serine/threon
inekinase
18
152
D�0.123
�0.307
�1.091
�1.907
�2.380
�1.825
AI847223
Sem
adom
ain,transm
embranedom
ain
andcytoplasm
icdom
ain,6C
153
D�0.046
�0.412
�0.951
�1.524
�1.290
�0.442
BG071965
Cyclin
B1,relatedsequen
ce1
154
D0.257
�0.418
�0.526
�0.958
�1.103
�0.905
BG071804
Buddinguninhibited
byben
zimidazoles1hom
olog
,beta(S.
cerevisiae)
155
D0.175
�0.264
�0.675
�0.751
�1.060
�0.942
BG088398
Glucocorticoidinducedtranscript1
156
D�0.332
0.146
�0.361
�1.075
�0.272
�0.418
BG076333
Methylenetetrahydrofolate
deh
ydrogen
ase
(NADþ
dep
enden
t)Up-reg
ulatedin
NS
157
D�0.015
�0.247
�0.558
�0.920
�1.013
�0.877
AI853169
Hypotheticalprotein
C530022J18
158
D�0.024
�0.492
�0.617
�1.103
�0.967
�0.868
BG064686
Chorionic
somatomammotropin
hormon
e1
159
D�0.062
�0.546
�0.510
�0.396
�1.054
�0.799
BG069969
Tcraen
hancer-bindingfactor
interactingprotein
1160
D�0.029
�0.395
�0.715
�0.753
�1.204
�0.528
BG085427
Highmob
ilitygroupbox
2Up-reg
ulatedin
NS
161
D�0.041
�0.225
�0.114
�0.597
�1.301
�0.890
BG086151
CDK2(cyclin-dep
enden
tkinase
2)-associatedprotein
1162
D0.072
�0.538
�0.407
�0.575
�1.536
�1.068
BG077092
RIK
EN
cDNA
2600016C11gen
e163
D0.330
�0.033
�0.860
�1.061
�1.044
�0.345
BG081629
SMC4stru
cturalmaintenance
ofch
romosom
es4-like1(yea
st)
164
D0.252
�0.360
�0.909
�1.108
�1.386
�0.901
BG067860
MAD2(m
itotic
arrestdefi
cien
t,hom
olog
)-like1(yea
st)
Up-reg
ulatedin
NS
165
D0.229
�0.130
�0.606
�1.106
�1.167
�1.118
BG083621
Poliovirusreceptor-related3
166
D�0.156
�0.417
�0.606
�0.529
�1.111
�1.137
AA498281
Lamin
B1
167
D0.010
�0.619
�0.818
�1.223
�1.052
�0.478
BG064846
Celldivisioncycle2hom
olog
A(S
.pom
be)
Up-reg
ulatedin
NS
168
D�0.182
�0.376
�0.321
�0.529
�1.024
�0.380
BG085860
Smallnuclea
rribon
ucleoprotein
polypep
tideG
169
D0.267
�0.271
�0.807
�1.600
�0.993
�0.546
BG086805
Buddinguninhibited
byben
zimidazoles1hom
olog
(S.cerevisiae)
170
D�0.042
�0.479
�0.462
�0.647
�1.732
�0.994
BG064598
Proliferatingcellnuclea
rantigen
Up-reg
ulatedin
NS
171
D�0.208
�0.420
�0.605
�1.280
�1.106
�0.636
BG080690
ShcSH2-dom
ain
bindingprotein
1Up-reg
ulatedin
NS
172
D�0.182
�0.480
�0.654
�1.732
�1.498
�1.048
BG069986
Polymyositis/sclerod
ermaautoantigen
1173
D�0.009
�0.215
�0.286
�0.671
�1.014
�0.011
BG083522
CDC28protein
kinase
regulatory
subunit
2174
D0.140
�0.240
�0.547
�1.140
�0.559
�0.620
AI893902
Sperm
associatedantigen
5Up-reg
ulatedin
NS
175
D0.040
�0.362
�0.723
�1.134
�0.867
�0.313
BG077844
SMC2stru
cturalmaintenance
ofch
romosom
es2-like1(yea
st)
176
E�0.436
0.290
0.372
0.005
�0.940
�1.309
BG071846
Transd
ucin-likeen
hancerof
split4,E(spl)hom
olog
(Drosophila)
177
E�0.031
0.170
0.209
0.090
�0.809
�1.303
BG085705
RIK
EN
cDNA
4933432H23gen
e178
E�0.020
0.207
0.378
0.188
�1.180
�0.786
AW554258
Midnolin
179
E�0.012
0.106
0.036
�0.307
�1.151
�1.029
BG074931
Enhancerof
zestehom
olog
2(D
rosophila)
180
E�0.049
0.083
0.016
�0.656
�1.280
�1.464
AA498495
Erythrocyte
protein
band4.1
181
E0.280
�0.065
0.290
�0.096
�0.963
�1.018
BG079889
Isop
entenyl-diphosphate
delta
isom
erase
Up-reg
ulatedin
NS
182
E�0.053
�0.151
�0.165
�0.521
�1.303
�1.740
AA242226
Cadherin
2183
E0.045
0.370
0.729
0.558
�0.777
�1.451
AI846983
Microtubule-associatedprotein
1B
184
E0.027
0.594
�0.009
0.061
�1.021
�0.683
BG081111
Top
oisomerase
(DNA)I
185
E�0.032
0.295
0.323
�0.302
�1.005
�1.080
BG086306
Polyhom
eotic-like2(D
rosophila)
186
E0.091
�0.298
�0.104
0.285
�1.271
�1.421
AI836508
Splicingfactor,arginine/serine-rich
2(SC-35)
187
E0.225
0.069
0.066
0.053
�1.166
�1.550
BG086100
RIK
EN
cDNA
1110055B05gen
e188
E0.062
�0.016
�0.070
�0.463
�1.083
�0.643
BG072534
Heterog
eneousnuclea
rribon
ucleoprotein
A1
189
E0.074
�0.207
�0.444
�0.388
�1.182
�0.971
BG064278
Nucleosomeassem
bly
protein
1-like1
190
E0.014
0.427
0.101
�0.368
�0.708
�1.304
BG071313
Cyclin-dep
enden
tkinase
inhibitor
1C
(P57)
191
E0.097
�0.029
�0.268
�0.035
�1.433
�1.308
BG074524
Heterog
eneousnuclea
rribon
ucleoprotein
A/B
192
E0.054
�0.088
�0.235
�0.516
�1.289
�1.285
BG085009
Cyclin-dep
enden
tkinase
4193
E0.016
�0.058
�0.085
�0.192
�1.071
�1.247
BG087161
Latrop
hilin
2194
E0.109
�0.027
�0.013
�0.315
�0.715
�1.011
AA048831
Highmob
ilitygroupbox
3195
E0.051
�0.011
�0.248
�0.374
�1.054
�0.845
AI848377
cDNA
sequen
ceBC010348
196
E0.272
�0.116
0.182
�0.525
�0.929
�1.070
AI323209
Makorin,ringfinger
protein,3
197
E0.435
�0.230
�0.405
�0.298
�0.870
�1.021
BG078653
Heterog
eneousnuclea
rribon
ucleoprotein
D
570 Ahn et al.
198
E0.058
�0.030
�0.182
�0.025
�0.677
�1.093
AA212717
C-terminalbindingprotein
1199
E0.111
0.438
0.447
0.243
�0.618
�1.013
AU045483
Ubiquilin
2200
E0.120
�0.138
�0.123
�0.568
�0.729
�1.009
AA059891
Upstream
regulatory
elem
entbindingprotein
1201
E�0.079
0.136
0.273
0.133
�0.308
�1.263
BG070656
SRY-box
containinggen
e4
202
E0.052
�0.288
�0.369
�0.166
�1.011
�1.410
BG087241
Mesod
erm
specifictranscript
203
E0.080
0.155
�0.173
�0.272
�1.006
�0.790
BG085781
Chromob
oxhom
olog
1(D
rosophilaHP1beta)
204
E�0.001
�0.219
�0.155
0.273
�1.171
�0.744
BG078157
Splicingfactor,arginine/serine-rich
3(SRp20)
Up-reg
ulatedin
NS
205
E0.250
0.155
0.216
0.425
�1.351
�1.165
AA125197
Actin
dep
enden
tregulatorof
chromatin,su
bfamilye,
mem
ber
1206
E0.076
�0.036
�0.057
�0.508
�1.051
�0.706
BG079001
Gelon
gation
factor
207
E�0.027
�0.174
0.242
0.296
�0.447
�1.084
AA120351
Ubiquitin-con
jugatingen
zymeE2I
208
E�0.197
�0.304
�0.420
�0.365
�1.211
�1.397
AA032448
Zincfinger
protein
162
209
E0.010
0.328
0.546
0.491
�0.688
�1.425
AI840073
Neu
ronatin
210
E0.112
0.273
0.091
0.364
�1.320
�1.393
BG072739
SRY-box
containinggen
e11
211
E�0.070
0.163
0.565
0.400
�0.645
�1.102
AI838805
Kru
ppel-likefactor
15
212
E�0.026
0.201
0.139
�0.293
�1.071
�1.026
BG087208
H1histonefamily,mem
ber
0213
E0.047
0.062
�0.227
�0.111
�0.918
�1.161
BG087103
KH
dom
ain
containing,RNA
binding,signaltransd
uction
associated1
214
E0.024
�0.232
�0.084
�0.276
�0.904
�1.002
AA209061
Thioredox
inreductase
1215
F�0.058
0.668
1.329
1.175
0.847
0.281
W18828
Dihydropyrimidinase-like3
216
F�0.098
0.607
1.024
0.657
1.248
0.638
AI842333
Dou
ble
cortin
andcalcium/calm
odulin-dep
enden
tprotein
kinase-like1
217
F0.145
0.474
0.150
1.121
0.298
0.223
BG064500
Hea
tsh
ockprotein
218
F0.007
0.567
0.788
1.177
1.157
0.868
BG086292
Amyloid
beta(A
4)precu
rsor
protein
219
F�0.048
0.386
1.080
1.200
0.371
0.145
AA275865
ALL1-fusedgen
efrom
chromosom
e1q
220
F�0.014
0.612
1.017
0.803
0.712
0.402
BG083182
Guaninedea
minase
221
F�0.077
0.070
0.345
0.697
1.200
0.821
AA547428
Protein
kinase,cA
MPdep
enden
t,catalytic,
beta
222
F0.142
0.081
0.788
0.989
1.057
0.799
AI854566
Synaptotagmin
7223
F0.169
0.552
1.067
1.295
0.280
0.169
BG087115
Myeloidecotropic
viralintegration
site-relatedgen
e1
224
F�0.071
0.479
0.757
0.768
1.112
0.578
AI323062
Guaninenucleotidebindingprotein,alphao
225
F0.108
0.488
0.820
1.165
0.244
�0.349
AA231471
Sialyltransferase
8(alpha-2,8-sialyltransferase)B
226
F�0.122
0.310
0.754
0.714
1.011
0.556
AA269845
Glycoprotein
m6a
227
F�0.100
0.719
0.791
0.834
1.032
0.597
AI835125
Pleck
strinhom
olog
y,Sec7andcoiled
-coildom
ains2
228
F0.123
0.591
1.023
0.636
0.439
0.423
BG087300
p21(C
DKN1A)-activatedkinase
4229
F0.138
0.381
0.648
1.167
1.327
1.008
BG086955
Brain
protein
44-like
230
F0.085
0.474
0.837
0.983
1.133
0.836
BG082280
RIK
EN
cDNA
9430072K23gen
e231
F0.063
0.302
0.557
0.725
0.595
1.049
BG070401
Cyclin
M2
232
F�0.050
0.514
1.065
1.061
1.121
0.806
W42241
Stathmin-like4
233
F�0.235
0.192
0.867
0.480
1.556
0.745
AI840345
Gamma-aminob
utyricacid(G
ABA-A
)transp
orter1
234
F0.078
0.695
1.327
2.075
2.036
1.150
AA028410
Microtubule-associatedprotein
tau
Up-uregulatedin
DC
235
F0.134
�0.129
�0.065
1.758
0.592
0.927
BG063925
Metallothionein2
236
F0.077
0.557
0.863
1.160
1.252
0.838
AI853686
Glutamate
receptor,
ionotropic,AMPA3(alpha3)
237
F0.203
0.366
0.635
1.303
1.353
0.884
AA521764
Recep
tor(calciton
in)activitymod
ifyingprotein
2Up-reg
ulatedin
DC
238
F0.040
0.679
0.725
1.311
1.026
0.242
BG075834
RIK
EN
cDNA
3110039L19gen
e239
F�0.190
0.429
0.338
1.144
0.838
0.685
BG076172
Calm
odulin1
240
F0.362
0.540
0.697
1.015
0.488
0.314
AI844249
RIK
EN
cDNA
1110003P13gen
e241
F0.073
0.321
0.736
1.082
0.310
�0.015
W66622
TEA
dom
ain
familymem
ber
2242
F�0.274
�0.166
0.059
0.751
1.094
0.395
AI837858
Protein
kinase
C,beta
243
F0.234
0.237
0.709
1.273
1.139
0.729
AI835523
Protein
kinase
inhibitor,alpha
244
F0.113
0.320
0.456
1.306
0.551
0.275
BG081562
Reg
ulatorof
G-protein
signaling2
245
F0.009
0.227
0.611
1.039
1.068
0.972
BG067399
Tropom
odulin2
246
F0.239
0.578
0.620
0.829
1.190
0.887
BG084093
N-m
ycdow
nstream
regulated2
247
F0.023
0.505
0.660
1.141
0.685
0.380
BG086006
EphrinB3
248
F0.400
0.573
0.490
1.058
0.822
0.624
BG080627
Nuclea
rresp
iratory
factor
1249
F0.206
0.266
1.176
1.538
0.905
0.215
AI849758
Microtubule-associatedprotein
2250
F0.287
0.355
0.323
0.797
0.876
1.012
BG069134
Musmusculustranscribed
sequen
ces
251
F0.435
0.548
0.575
1.193
0.685
0.733
BG066404
Musmusculustranscribed
sequen
ces
(Con
tinued
)
Gene Expression in Differentiating Neural Stem Cells 571
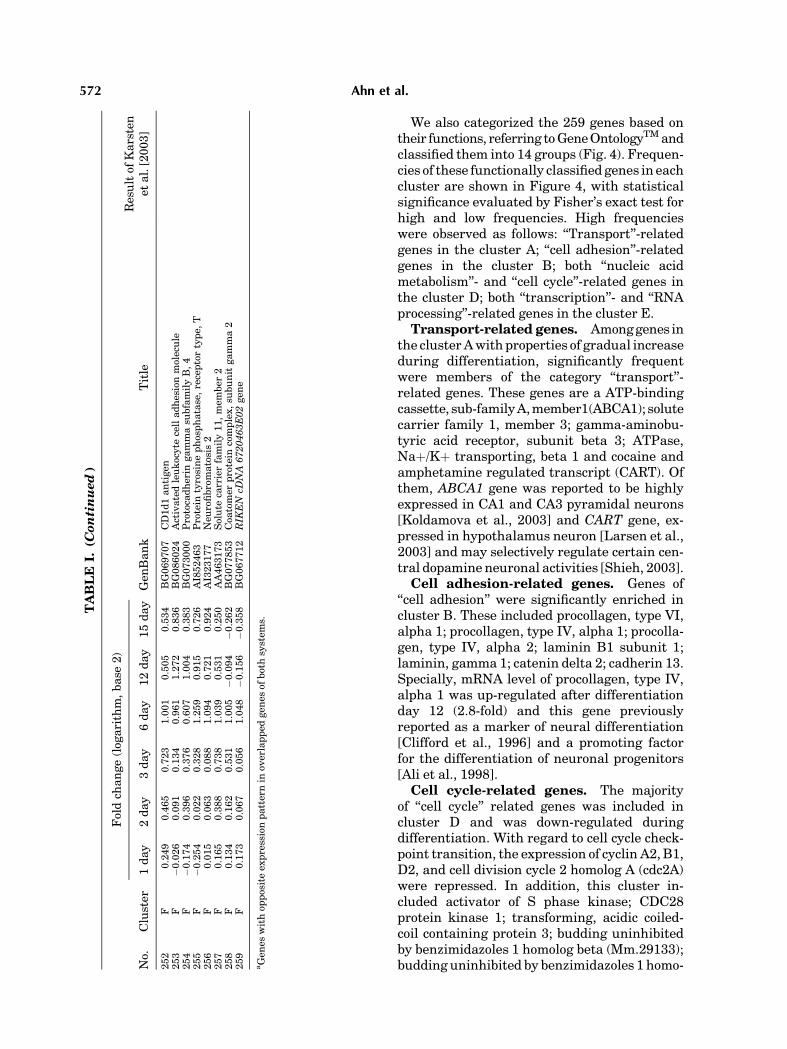
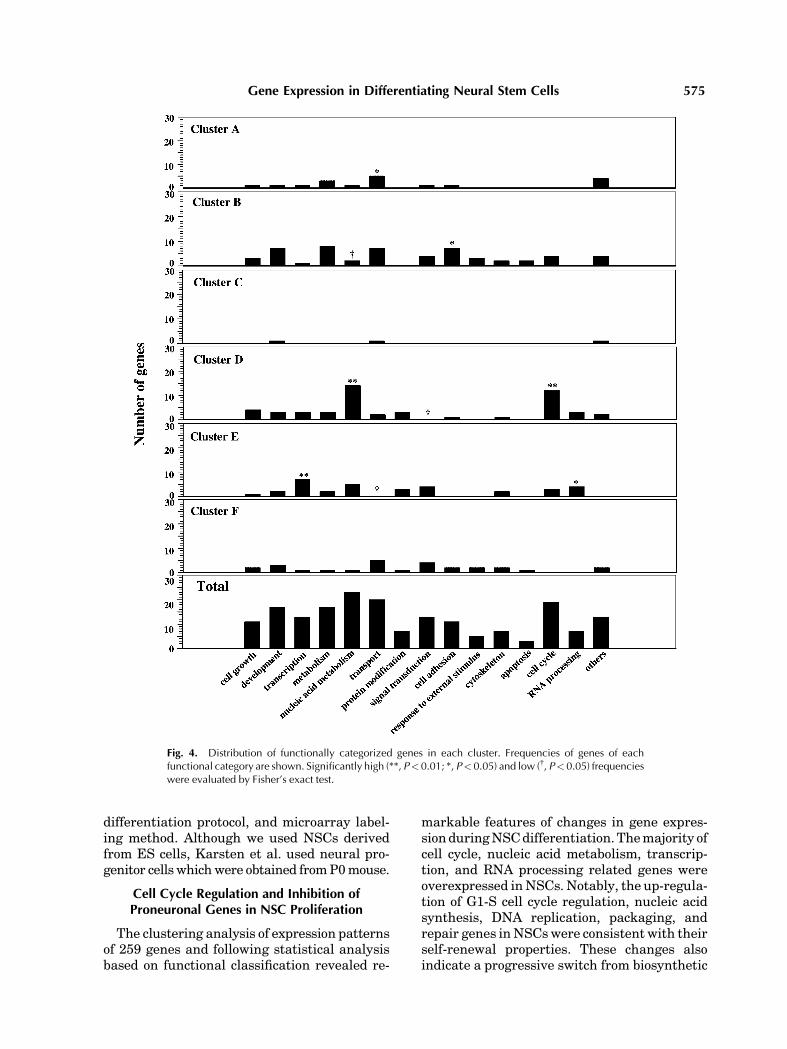
We also categorized the 259 genes based ontheir functions, referring toGeneOntologyTMandclassified them into 14 groups (Fig. 4). Frequen-cies of these functionally classified genes in eachcluster are shown in Figure 4, with statisticalsignificance evaluated by Fisher’s exact test forhigh and low frequencies. High frequencieswere observed as follows: ‘‘Transport’’-relatedgenes in the cluster A; ‘‘cell adhesion’’-relatedgenes in the cluster B; both ‘‘nucleic acidmetabolism’’- and ‘‘cell cycle’’-related genes inthe cluster D; both ‘‘transcription’’- and ‘‘RNAprocessing’’-related genes in the cluster E.
Transport-related genes. Amonggenes inthe clusterAwith properties of gradual increaseduring differentiation, significantly frequentwere members of the category ‘‘transport’’-related genes. These genes are a ATP-bindingcassette, sub-familyA,member1(ABCA1); solutecarrier family 1, member 3; gamma-aminobu-tyric acid receptor, subunit beta 3; ATPase,Naþ/Kþ transporting, beta 1 and cocaine andamphetamine regulated transcript (CART). Ofthem, ABCA1 gene was reported to be highlyexpressed in CA1 and CA3 pyramidal neurons[Koldamova et al., 2003] and CART gene, ex-pressed in hypothalamus neuron [Larsen et al.,2003] and may selectively regulate certain cen-tral dopamine neuronal activities [Shieh, 2003].
Cell adhesion-related genes. Genes of‘‘cell adhesion’’ were significantly enriched incluster B. These included procollagen, type VI,alpha 1; procollagen, type IV, alpha 1; procolla-gen, type IV, alpha 2; laminin B1 subunit 1;laminin, gamma 1; catenin delta 2; cadherin 13.Specially, mRNA level of procollagen, type IV,alpha 1 was up-regulated after differentiationday 12 (2.8-fold) and this gene previouslyreported as a marker of neural differentiation[Clifford et al., 1996] and a promoting factorfor the differentiation of neuronal progenitors[Ali et al., 1998].
Cell cycle-related genes. The majorityof ‘‘cell cycle’’ related genes was included incluster D and was down-regulated duringdifferentiation. With regard to cell cycle check-point transition, the expression of cyclin A2, B1,D2, and cell division cycle 2 homolog A (cdc2A)were repressed. In addition, this cluster in-cluded activator of S phase kinase; CDC28protein kinase 1; transforming, acidic coiled-coil containing protein 3; budding uninhibitedby benzimidazoles 1 homolog beta (Mm.29133);budding uninhibited by benzimidazoles 1 homo-
TABLE
I.(C
ontinued
)
No.
Cluster
Foldch
ange(log
arithm,base
2)
Gen
Bank
Title
Resultof
Karsten
etal.[2003]
1day
2day
3day
6day
12day
15day
252
F0.249
0.465
0.723
1.001
0.505
0.534
BG069707
CD1d1antigen
253
F�0.026
0.091
0.134
0.961
1.272
0.836
BG086024
Activatedleukocyte
celladhesionmolecule
254
F�0.174
0.396
0.376
0.607
1.004
0.383
BG073000
Protocadherin
gammasu
bfamilyB,4
255
F�0.254
0.022
0.328
1.259
0.915
0.726
AI852463
Protein
tyrosinephosphatase,receptortype,
T256
F0.015
0.063
0.088
1.094
0.721
0.924
AI323177
Neu
rofibromatosis2
257
F0.165
0.388
0.738
1.039
0.531
0.250
AA463173
Solute
carrierfamily11,mem
ber
2258
F0.134
0.162
0.531
1.005
�0.094
�0.262
BG077853
Coa
tomer
protein
complex,su
bunit
gamma2
259
F0.173
0.067
0.056
1.048
�0.156
�0.358
BG067712
RIK
EN
cDNA
6720463E02gen
e
aGen
eswithop
positeex
pressionpatternin
overlapped
gen
esof
bothsystem
s.
572 Ahn et al.
log (Mm.2185); MAD2 (mitotic arrest deficient,homolog)-like 1 and CDC28 protein kinaseregulatory subunit 2.Nucleic acid metabolism-related genes.
Among genes in the cluster D with properties ofdecrease during differentiation, significantlyfrequent were also members of the category‘‘nucleic acid metabolism’’-related genes. Therewas a decrease in the expression of genesinvolved in DNA packaging, replication, repair,nucleosome assembly, and chromosome segre-gation, such as H2A histone family, member Z;topoisomerase II alpha; high mobility groupnucleosomal binding domain 2; centromereautoantigen A; Bloom syndrome homolog;ribonucleotide reductase M2; minichromosomemaintenance deficient 7; chromatin assemblyfactor 1; proliferating cell nuclear antigen(PCNA); high mobility group box 2 and SMC2structural maintenance of chromosomes 2-like
1. Altered expressions of these functional geneswere concomitant with the decrease in expres-sion of G1/S cell cycle regulatory genes.
Transcription regulators. Transcriptionregulators which may be involved in NSCsproliferation and maintenance showed highfrequency in cluster E and included transdu-cin-like enhancer of split 4 (TLE 4); enhancer ofzeste homolog 2 (EZL2); ring finger protein 3;SRY-box containing gene 4, 11 (Sox 4, 11); actindependent regulator of chromatin, subfamily e,member 1 andKruppel-like factor 15. BothSox4and 11 were previously reported to be highlyexpressed in ventricular zones and down-regulated in neurons as they become mature[Cheung et al., 2000].
In Vivo Expression Patterns
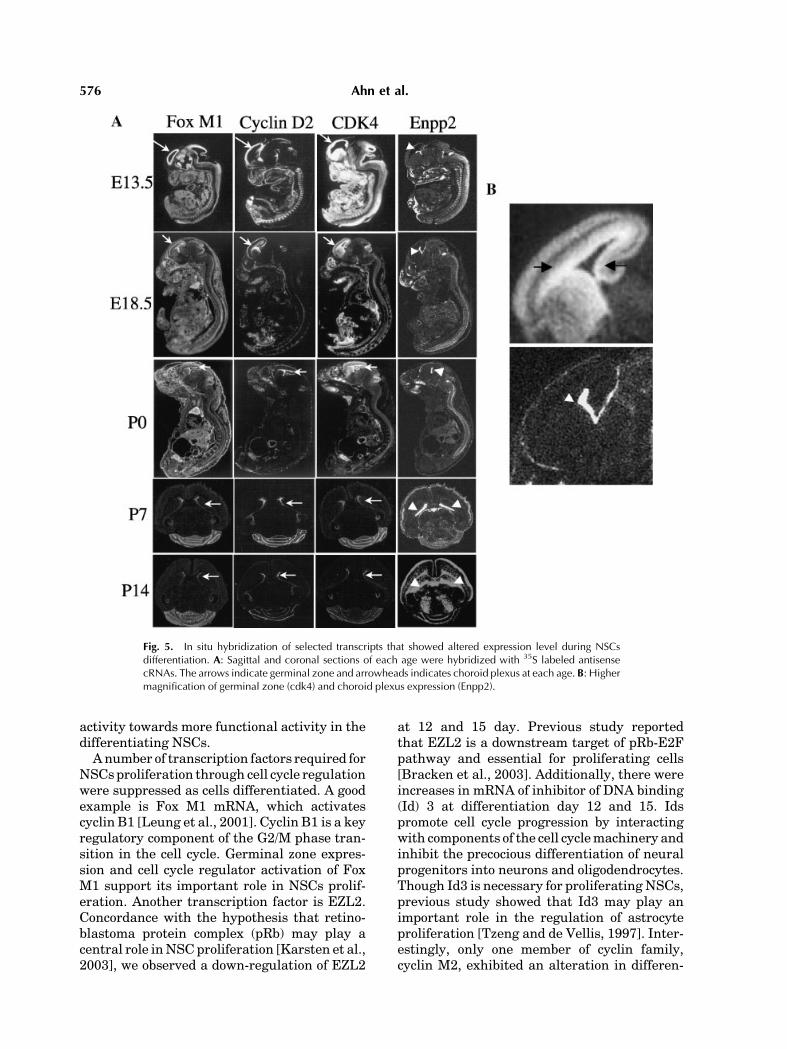
We performed ISH for four genes. Of them,three genes (FoxM1, cyclinD2, andCDK4) were
Fig. 2. Verification of microarray data. Real-time RT-PCRwas used to verify the data from the microarray.Each value is expressed as fold change (logarithm, base 2) in mRNA levels at each differentiation time-pointcompared to the control NSCs, and represents the mean� SEM of three independent experiments.Microarray data of each gene was displayed as a horizontal strip. [Color figure can be viewed in the onlineissue, which is available at www.interscience.wiley.com.]
Gene Expression in Differentiating Neural Stem Cells 573
highly expressed in the NSCs, while Enpp2showed high expression level in differentiatedcells as shown by RT-PCR. In ISH, Fox M1,cyclin D2, and CDK4 were highly expressed inthe germinal zone during embryonic develop-ment. Enpp2 showed high and specific expres-sion in the choroid plexus of brain fromE13.5 toP14 (Fig. 5A,B). The choroid plexus has recentlybeen shown to be essential organizing centersfor inducing dorsal neuron fates and sustainingneuron function [Awatramani et al., 2003] andwas identified as a possible location of stem/progenitor cells [Li et al., 2002]. Moreover,lysophosphatidic acid (LPA), catalyzed by Enpp2,was shown to increase terminal mitosis ofneural precursor cells and promote their cellcycle exit [Kingsbury et al., 2003].
DISCUSSION
Comparision of Two Expression Profiles
Our experiment used a comprehensivemolec-ular approach to identify temporal changes ingene expression that occur during differentia-tion ofNSCs.A total of 259geneswere regulated
during differentiation. The 259 gene expressionprofiles provided us with an opportunity tocompare or contrast our analysis with those ofother investigators who have used similarmethodologies. Karsten et al. [2003] reported adata set consisting of 318 significantly changedexpression profiles in proliferating NSCs (NS)and its 24 h differentiated cells (DC) in vitro.There were 36 overlapped genes (defined asUnigene IDs) represented in both data sets(Table I). In addition, 33 of 36 overlapped geneswere found to have very similar expressionpatterns in both systems, which suggest a goodoverall agreement (91.6%) between the resultsof these two groups. However, these genesaccounted for very small proportion in totaloverlapped genes of our 10K chip and UCLA 9Karray which had been used in Karsten et al.experiment (36/2,312 genes). There could beseveral reasons to explain these consequences.One major possibility is difference in thedetermination of significantly expressed genesin microarray data set (stringent 2-fold changecutoff method vs. false discovery rate method).Other reasons are differences in NSC population,
Fig. 3. K-means clustering of genes with expression levels that changed during NSCs differentiation. K-means clusteringwasused to group the259 identifiedgenes into clusters basedon similar expressionover thesix time-point. These 259 genes were classified into 6 clusters (A–F).
574 Ahn et al.
differentiation protocol, and microarray label-ing method. Although we used NSCs derivedfrom ES cells, Karsten et al. used neural pro-genitor cells whichwere obtained fromP0mouse.
Cell Cycle Regulation and Inhibition ofProneuronal Genes in NSC Proliferation
The clustering analysis of expression patternsof 259 genes and following statistical analysisbased on functional classification revealed re-
markable features of changes in gene expres-sionduringNSCdifferentiation. Themajority ofcell cycle, nucleic acid metabolism, transcrip-tion, and RNA processing related genes wereoverexpressed inNSCs. Notably, the up-regula-tion of G1-S cell cycle regulation, nucleic acidsynthesis, DNA replication, packaging, andrepair genes inNSCswere consistent with theirself-renewal properties. These changes alsoindicate a progressive switch from biosynthetic
Fig. 4. Distribution of functionally categorized genes in each cluster. Frequencies of genes of eachfunctional category are shown. Significantly high (**, P<0.01; *, P<0.05) and low ({, P<0.05) frequencieswere evaluated by Fisher’s exact test.
Gene Expression in Differentiating Neural Stem Cells 575
activity towards more functional activity in thedifferentiating NSCs.
Anumber of transcription factors required forNSCsproliferation through cell cycle regulationwere suppressed as cells differentiated. A goodexample is Fox M1 mRNA, which activatescyclin B1 [Leung et al., 2001]. Cyclin B1 is a keyregulatory component of the G2/M phase tran-sition in the cell cycle. Germinal zone expres-sion and cell cycle regulator activation of FoxM1 support its important role in NSCs prolif-eration. Another transcription factor is EZL2.Concordance with the hypothesis that retino-blastoma protein complex (pRb) may play acentral role inNSC proliferation [Karsten et al.,2003], we observed a down-regulation of EZL2
at 12 and 15 day. Previous study reportedthat EZL2 is a downstream target of pRb-E2Fpathway and essential for proliferating cells[Bracken et al., 2003]. Additionally, there wereincreases in mRNA of inhibitor of DNA binding(Id) 3 at differentiation day 12 and 15. Idspromote cell cycle progression by interactingwith components of the cell cyclemachinery andinhibit the precocious differentiation of neuralprogenitors into neurons and oligodendrocytes.Though Id3 is necessary for proliferating NSCs,previous study showed that Id3 may play animportant role in the regulation of astrocyteproliferation [Tzeng and de Vellis, 1997]. Inter-estingly, only one member of cyclin family,cyclin M2, exhibited an alteration in differen-
Fig. 5. In situ hybridization of selected transcripts that showed altered expression level during NSCsdifferentiation. A: Sagittal and coronal sections of each age were hybridized with 35S labeled antisensecRNAs. The arrows indicate germinal zone and arrowheads indicates choroid plexus at each age. B: Highermagnification of germinal zone (cdk4) and choroid plexus expression (Enpp2).
576 Ahn et al.
tiated cells and an opposite expression patternagainst other cyclins. The precise role of thisgene during differentiation remains to be con-firmed through function-based assays.In addition to cell cycle regulation, our
analysis showed that inhibition of proneuronalgenes is continued during proliferation (beforeterminal differentiation). TLE 4, a mammalianhomologue of Drosophila groucho, was signifi-cantly down-regulated at differentiation day 15.Notch stimulation leads to activation of the ex-pression of Enhancer of split complex [E (spl)-C]ranscripts. Their protein products thenmediatethe negative regulation of the expression ofproneural genes. The transcriptional repres-sor function of E (spl)-C proteins requiresthe activity of the product of groucho [Grbavecet al., 1998]. Taken together, these alteredexpression levels strongly suggest that cell cycleregulation and negative regulation of prone-uronal genes have high influences on NSCproliferation.
Up-Regulation of Neurite Outgrowth and AxonGuidance Related Genes in Differentiated Cells
A variety of extracellular cues, consisting ofsecreted molecules, cell–cell contact and cell–extracellular matrix (ECM) interaction, areresponsible for neurite outgrowth and axonguidance [Wei et al., 2002]. Genes encodingmembers of a number of these signaling path-ways are up-regulated. Pleiotrophin, a cytokinethat induce neurite outgrowth [Deuel et al.,2002], is overexpressed during differentiationand also reported to exhibit a trophic effect onsurvival of dopaminergic neurons [Hida et al.,2003]. Another secreted molecule, annexin A2,induce neuritogenesis and differentiation of thecell line PC12, suggesting involvement in NSCdifferentiation [Jacovina et al., 2001]. EphrinB3, guidance cue molecule, was also expressed.Ephrin-Eph receptor system has been shown tomediate contact-dependent repulsion involvedin axon guidance [Cook et al., 1998].Many molecules have been isolated from the
ECM and found to be very good at supportingneurite out growth. ECM proteins, such aslaminins and various forms of collagens in ourchip, are also up-regulated. Most growth cones,especially those in the CNS, grow along thesurfaces of other cells and axons. In thisfunction, they are supported largely by class ofgrowth-promotingmolecules that are expressed
on the cell surfaces and known as cell adhesionmolecules (CAM) [Walsh and Doherty, 1997].mRNA for activated leukocyte CAM (Alcam)in the cluster F was also up-regulated. Neuriteformation requires extensive cytoskeletonremodeling. Microtubules provide structuralsupport and act as substrate for the fast axonaltransport of vesicles [Signor and Scholey, 2000].Microtubule proteins including microtubuleassociated protein (MAP) 2 and MAP tau, wereoverexpressed.
Cellular signaling pathways thatmake use ofCAMs, repulsive factors, attractive factors, andgrowth factors are received by receptors on thesurface of the growth cone. Receptors that havetyrosine phosphatase activity have been foundin abundance on growth cones [Holland et al.,1998]. Tyrosine phosphatase 4a3 in the clusterB was up-regulated at differentiation day 12and 15 and tyrosine phosphatase, receptor typeT in the cluster F was up-regulated at day 6.
In conclusion, we used microarray analysisduring differentiation of NSCs to identify re-gulatory molecules. We identified 259 modu-lated genes, which could be divided into 14functional groups. The further statistical ana-lysis showed that cell cycle regulation, nucleicacid metabolism, and negative regulation ofproneuronal genes play crucial roles in NSCsproliferation and its self-renewal. Also, in dif-ferentiated cells, a variety of neurite outgrowthand axon guidance related genes were detectedas significantly expressed genes. Genes thatwe identified in this study will advance theunderstanding of mechanisms underlying pro-liferation/differentiation of NSCs and thepotential for the use of stem cells as therapeuticagents.
REFERENCES
Ali SA, Pappas IS, Parnavelas JG. 1998. Collagen type IVpromotes the differentiation of neuronal progenitors andinhibits astroglial differentiation in cortical cell cultures.Brain Res Dev Brain Res 110:31–38.
Awatramani R, Soriano P, Rodriguez C, Mai JJ, DymeckiSM. 2003. Cryptic boundaries in roof plate and choroidplexus identified by intersectional gene activation. NatGenet 35:70–75.
Benraiss A, Chmielnicki E, Lerner K, Roh D, Goldman SA.2001. Adenoviral brain-derived neurotrophic factorinduces both neostriatal and olfactory neuronal recruit-ment from endogenous progenitor cells in the adultforebrain. J Neurosci 21:6718–6731.
Bracken AP, Pasini D, Capra M, Prosperini E, Colli E,Helin K. 2003. EZH2 is downstream of the pRB-E2F
Gene Expression in Differentiating Neural Stem Cells 577
pathway, essential for proliferation and amplified incancer. EMBO J 22:5323–5335.
Caldwell MA, He X, Wilkie N, Pollack S, Marshall G,Wafford KA, Svendsen CN. 2001. Growth factors re-gulate the survival and fate of cells derived from humanneurospheres. Nat Biotechnol 19:475–479.
Cheung M, Abu-Elmagd M, Clevers H, Scotting PJ. 2000.Roles of Sox4 in central nervous system development.Brain Res Mol Brain Res 79:180–191.
Clifford J, Chiba H, Sobieszczuk D, Metzger D, Chambon P.1996. RXRalpha-null F9 embryonal carcinoma cells areresistant to the differentiation, anti-proliferative andapoptotic effects of retinoids. EMBO J 15:4142–4155.
CookG, Tannahill D, Keynes R. 1998. Axon guidance to andfrom choice points. Curr Opin Neurobiol 8:64–72.
Deuel TF, Zhang N, Yeh HJ, Silos-Santiago I, Wang ZY.2002. Pleiotrophin: A cytokine with diverse functions anda novel signaling pathway. Arch Biochem Biophys397:162–171.
Geschwind DH, Ou J, Easterday MC, Dougherty JD,Jackson RL, Chen Z, Antoine H, Terskikh A, WeissmanIL, Nelson SF, Kornblum HI. 2001. A genetic analysisof neural progenitor differentiation. Neuron 29:325–339.
Grbavec D, Lo R, Liu Y, Stifani S. 1998. Transducin-likeEnhancer of split 2, a mammalian homologue of Droso-phila groucho, acts as a transcriptional repressor,interacts with Hairy/Enhancer of split proteins, and isexpressed during neuronal development. Eur J Biochem258:339–349.
Hida H, Jung CG, Wu CZ, Kim HJ, Kodama Y, Masuda T,Nishino H. 2003. Pleiotrophin exhibits a trophic effect onsurvival of dopaminergic neurons in vitro. Eur J Neurosci17:2127–2134.
Holland SJ, Peles E, Pawson T, Schlessinger J. 1998. Cell-contact-dependent signalling in axon growth and gui-dance: Eph receptor tyrosine kinases and receptorprotein tyrosine phosphatase beta. Curr Opin Neurobiol8:117–127.
Jacovina AT, Zhong F, Khazanova E, Lev E, Deora AB,Hajjar KA. 2001. Neuritogenesis and the nerve growthfactor-induced differentiation of PC-12 cells requireannexin II-mediated plasmin generation. J Biol Chem276:49350–49358.
Karsten SL, Kudo LC, Jackson R, Sabatti C, Kornblum HI,Geschwind DH. 2003. Global analysis of gene expressionin neural progenitors reveals specific cell-cycle, signal-ing, and metabolic networks. Dev Biol 261:165–182.
Kingsbury MA, Rehen SK, Contos JJ, Higgins CM, Chun J.2003. Non-proliferative effects of lysophosphatidic acidenhance cortical growth and folding. Nat Neurosci6:1292–1299.
Koldamova RP, Lefterov IM, Ikonomovic MD, Skoko J,Lefterov PI, Isanski BA, DeKosky ST, Lazo JS. 2003.22R-hydroxycholesterol and 9-cis-retinoic acid induceATP-binding cassette transporter A1 expression andcholesterol efflux in brain cells and decrease amyloidbeta secretion. J Biol Chem 278:13244–13256.
Larsen PJ, Seier V, Fink-Jensen A, Holst JJ, Warberg J,Vrang N. 2003. Cocaine- and amphetamine-regulatedtranscript is present in hypothalamic neuroendocrineneurones and is released to the hypothalamic-pituitaryportal circuit. J Neuroendocrinol 15:219–226.
Lee SH, Lumelsky N, Studer L, Auerbach JM, McKay RD.2000. Efficient generation of midbrain and hindbrainneurons frommouse embryonic stem cell. Nat Biotechnol18:675–679.
Lee KH, Chang MY, Ahn JI, Yu DH, Jung SS, Choi JH,Noh YH, Lee YS, Ahn MJ. 2002. Differential geneexpression in retinoic acid-induced differentiation ofacute promyelocytic leukemia cells, NB4 and HL-60cells. Biochem Biophys Res Commun 296:1125–1133.
Leung TW, Lin SS, Tsang AC, Tong CS, Ching JC, LeungWY, Gimlich R, Wong GG, Yao KM. 2001. Over-expression of FoxM1 stimulates cyclin B1 expression.FEBS Lett 507:59–66.
Li Y, Chen J, Chopp M. 2002. Cell proliferation and dif-ferentiation from ependymal, subependymal and choroidplexus cells in response to stroke in rats. J Neurol Sci193:137–146.
Luo Y, Cai J, Liu Y, Xue H, Chrest FJ, Wersto RP, Rao M.2002. Microarray analysis of selected genes in neuralstem and progenitor cells. J Neurochem 83:1481–1497.
McKay RD. 1997. Stem cells in the central nervous system.Science 276:66–71.
Morrison SJ. 2001. Neuronal potential and lineage deter-mination by neural stem cells. Curr Opin Cell Biol13:666–672.
Ross SE, Greenberg ME, Stiles CD. 2003. Basic helix-loop-helix factors in cortical development. Neuron 39:13–25.
Shieh KR. 2003. Effects of the cocaine- and amphetamine-regulated transcript peptide on the turnover of centraldopaminergic neurons. Neuropharmacology 44:940–948.
Signor D, Scholey JM. 2000. Microtubule-based transportalong axons, dendrites and axonemes. Essays Biochem35:89–102.
Sturn A, Quackenbush J, Trajanoski Z. 2002. Genesis:Cluster analysis of microarray data. Bioinformatics18:207–208.
Tzeng SF, de Vellis J. 1997. Expression and functional roleof the Id HLH family in cultured astrocytes. Brain ResMol Brain Res 46:136–142.
Vescovi AL, Reynolds BA, Fraser DD, Weiss S. 1993. bFGFregulates the proliferative fate of unipotent (neuronal)and bipotent (neuronal/astroglial) EGF-generated CNSprogenitor cells. Neuron 11:951–966.
Walsh FS, Doherty P. 1997. Neural cell adhesion moleculesof the immunoglobulin superfamily: Role in axon growthand guidance. Annu Rev Cell Dev Biol 13:425–456.
Wei Y, Harris T, Childs G. 2002. Global gene expressionpatterns during neural differentiation of P19 embryoniccarcinoma cells. Differentiation 70:204–219.
Zigova T, Pencea V, Wiegand SJ, Luskin MB. 1998.Intraventricular administration of BDNF increases thenumber of newly generated neurons in the adult olfactorybulb. Mol Cell Neurosci 11:234–245.
578 Ahn et al.