temporal latent embedding for clinical events - lmu munich
TRANSCRIPT

Predicting Sequences of Clinical Events byusing a Personalized Temporal Latent Embedding
Model
Cristobal EstebanSiemens AG and
Ludwig MaximilianUniversity of Munich
Munich, [email protected]
Danilo SchmidtCharite
University Hospital of BerlinBerlin, Germany
Denis KrompaßSiemens AG
Munich, [email protected]
Volker TrespSiemens AG and
Ludwig MaximilianUniversity of Munich
Munich, [email protected]
Abstract—As a result of the recent trend towards digi-tization —which increasingly affects evidence-based medicine,accountable care, personalized medicine, and medical “Big Data”analysis— growing amounts of clinical data are becoming avail-able for analysis. In this paper, we follow the idea that one canmodel clinical processes based on clinical data, which can thenbe the basis for many useful applications. We model the wholeclinical evolution of each individual patient, which is composedof thousands of events such as ordered tests, lab results anddiagnoses. Specifically, we base our work on a dataset providedby the Charite University Hospital of Berlin which is composedof patients that suffered from kidney failure and either obtainedan organ transplant or are still waiting for one. These patientsface a lifelong treatment and periodic visits to the clinic. Ourgoal is to develop a system to predict the sequence of eventsrecorded in the electronic medical record of each patient, andthus to develop the basis for a future clinical decision supportsystem. For modelling, we use machine learning approacheswhich are based on a combination of the embedding of entitiesand events in a multidimensional latent space, in combinationwith Neural Network predictive models. Similar approaches havebeen highly successful in statistical models for recommendationsystems, language models, and knowledge graphs. We extendexisting embedding models to the clinical domain, in particularwith respect to temporal sequences, long-term memories andpersonalization. We compare the performance of our proposedmodels with standard approaches such as K-nearest neighborsmethod, Naive Bayes classifier and Logistic Regression, andobtained favorable results with our proposed model.
I. INTRODUCTION
It is well known that data observed in clinical practice canlead to important insights and can complement informationgathered from controlled clinical studies [1]. One argumentis that data from clinical practice reflects the natural mixof patients whereas patients participating in clinical studiestypically have another composition: they are carefully selected,they should not have other problems as the one under study,and they should not receive any other treatment. Also, a futurepersonalized medicine needs to be based on many attributesfrom a large number of patients, information that can becollected from data recorded during the clinical practice [2],[3].
In this paper we focus on the prediction of clinical events,
such as decisions, procedures, measurements and other ob-servations. We model the whole evolution of each individualpatient, which is composed of thousands of single events.A good predictive system could have many applications, forexample, as part of a decision support system that predictscommon practice in a clinical setting and which could alertin case of unusual orders. Eventually, a predictive systemcould also be used to optimize decisions, although here,confounding variables can be a problem. If many dimensionsare measured, the available information might include director indirect information on important confounders, alleviatingthe problem [4], [3].
We are addressing the issue from a “Big Data” perspectiveand use a large data set collected from patients that sufferedfrom kidney failure. The data was collected in the Charitehospital in Berlin and it is the largest data collection of its kindin Europe. Once the kidney has failed, patients face a lifelongtreatment and periodic visits to the clinic for the rest of theirlives. Until the hospital finds a new kidney for the patient, thepatient must attend to the clinic multiple times per week inorder to receive dialysis, which is a treatment that replacesmany of the functions of the kidney. After the transplanthas been performed, the patient receives immunosuppressivetherapy to avoid the rejection of the transplanted kidney. Thepatient must be periodically controlled to check the status ofthe kidney, adjust the treatment and take care of associateddiseases, such as those that arise due to the immunosuppressivetherapy. The usual procedure at the Charite University Hospitalof Berlin for these periodic evaluations is that the visitingpatient undergoes some laboratory testing in the morning,followed by the prescription of pertinent medications in theafternoon based on the results of the test.
The dataset contains every event that happened to each pa-tient concerning the kidney failure and all its associated events:medications prescribed, hospitalizations, diagnoses, laboratorytests, etc. [5], [6]. The dataset started being recorded more than30 years ago and it is composed of more than 4000 patientsthat underwent a renal transplantation or are waiting for it. Forexample, the database contains more than 1200 medicationsthat have been prescribed more than 250000 times, and theresults of more than 450000 laboratory analysis. The database
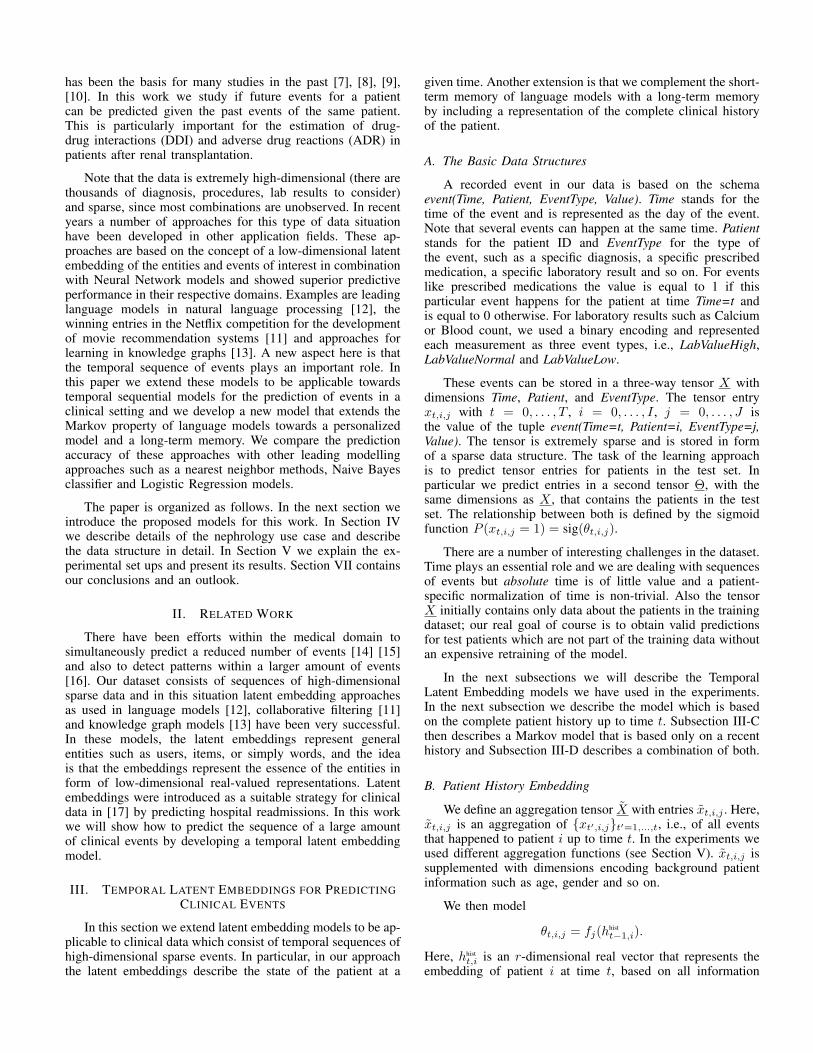
has been the basis for many studies in the past [7], [8], [9],[10]. In this work we study if future events for a patientcan be predicted given the past events of the same patient.This is particularly important for the estimation of drug-drug interactions (DDI) and adverse drug reactions (ADR) inpatients after renal transplantation.
Note that the data is extremely high-dimensional (there arethousands of diagnosis, procedures, lab results to consider)and sparse, since most combinations are unobserved. In recentyears a number of approaches for this type of data situationhave been developed in other application fields. These ap-proaches are based on the concept of a low-dimensional latentembedding of the entities and events of interest in combinationwith Neural Network models and showed superior predictiveperformance in their respective domains. Examples are leadinglanguage models in natural language processing [12], thewinning entries in the Netflix competition for the developmentof movie recommendation systems [11] and approaches forlearning in knowledge graphs [13]. A new aspect here is thatthe temporal sequence of events plays an important role. Inthis paper we extend these models to be applicable towardstemporal sequential models for the prediction of events in aclinical setting and we develop a new model that extends theMarkov property of language models towards a personalizedmodel and a long-term memory. We compare the predictionaccuracy of these approaches with other leading modellingapproaches such as a nearest neighbor methods, Naive Bayesclassifier and Logistic Regression models.
The paper is organized as follows. In the next section weintroduce the proposed models for this work. In Section IVwe describe details of the nephrology use case and describethe data structure in detail. In Section V we explain the ex-perimental set ups and present its results. Section VII containsour conclusions and an outlook.
II. RELATED WORK
There have been efforts within the medical domain tosimultaneously predict a reduced number of events [14] [15]and also to detect patterns within a larger amount of events[16]. Our dataset consists of sequences of high-dimensionalsparse data and in this situation latent embedding approachesas used in language models [12], collaborative filtering [11]and knowledge graph models [13] have been very successful.In these models, the latent embeddings represent generalentities such as users, items, or simply words, and the ideais that the embeddings represent the essence of the entities inform of low-dimensional real-valued representations. Latentembeddings were introduced as a suitable strategy for clinicaldata in [17] by predicting hospital readmissions. In this workwe will show how to predict the sequence of a large amountof clinical events by developing a temporal latent embeddingmodel.
III. TEMPORAL LATENT EMBEDDINGS FOR PREDICTINGCLINICAL EVENTS
In this section we extend latent embedding models to be ap-plicable to clinical data which consist of temporal sequences ofhigh-dimensional sparse events. In particular, in our approachthe latent embeddings describe the state of the patient at a
given time. Another extension is that we complement the short-term memory of language models with a long-term memoryby including a representation of the complete clinical historyof the patient.
A. The Basic Data Structures
A recorded event in our data is based on the schemaevent(Time, Patient, EventType, Value). Time stands for thetime of the event and is represented as the day of the event.Note that several events can happen at the same time. Patientstands for the patient ID and EventType for the type ofthe event, such as a specific diagnosis, a specific prescribedmedication, a specific laboratory result and so on. For eventslike prescribed medications the value is equal to 1 if thisparticular event happens for the patient at time Time=t andis equal to 0 otherwise. For laboratory results such as Calciumor Blood count, we used a binary encoding and representedeach measurement as three event types, i.e., LabValueHigh,LabValueNormal and LabValueLow.
These events can be stored in a three-way tensor X withdimensions Time, Patient, and EventType. The tensor entryxt,i,j with t = 0, . . . , T , i = 0, . . . , I , j = 0, . . . , J isthe value of the tuple event(Time=t, Patient=i, EventType=j,Value). The tensor is extremely sparse and is stored in formof a sparse data structure. The task of the learning approachis to predict tensor entries for patients in the test set. Inparticular we predict entries in a second tensor Θ, with thesame dimensions as X , that contains the patients in the testset. The relationship between both is defined by the sigmoidfunction P (xt,i,j = 1) = sig(θt,i,j).
There are a number of interesting challenges in the dataset.Time plays an essential role and we are dealing with sequencesof events but absolute time is of little value and a patient-specific normalization of time is non-trivial. Also the tensorX initially contains only data about the patients in the trainingdataset; our real goal of course is to obtain valid predictionsfor test patients which are not part of the training data withoutan expensive retraining of the model.
In the next subsections we will describe the TemporalLatent Embedding models we have used in the experiments.In the next subsection we describe the model which is basedon the complete patient history up to time t. Subsection III-Cthen describes a Markov model that is based only on a recenthistory and Subsection III-D describes a combination of both.
B. Patient History Embedding
We define an aggregation tensor X with entries xt,i,j . Here,xt,i,j is an aggregation of {xt′,i,j}t′=1,...,t, i.e., of all eventsthat happened to patient i up to time t. In the experiments weused different aggregation functions (see Section V). xt,i,j issupplemented with dimensions encoding background patientinformation such as age, gender and so on.
We then model
θt,i,j = fj(hhistt−1,i).
Here, hhistt,i is an r-dimensional real vector that represents the
embedding of patient i at time t, based on all information

observed for that patient until time t. We call r the rank of theembedding.
Since we want to apply the learned model easily to newpatients, we assume that the embeddings can be calculated asa linear function of the events that are associated with patienti up to time t, with
hhistt,i = Axt,i,:
where xt,i,: is a J-dimensional vector and A ∈ Rr×J is amatrix of learned weights. Thus hhist
t,i is a latent representationof the history of the patient i until time t. In a related butslightly different interpretation, we can also think of the j-th column of A as the latent embedding representation ofevent type j. As in other embedding approaches, the modelhas the ability to form similar latent representations for eventtypes which have a similar semantics, i.e. for medications withcomparable effects.
Note, that if fj(·) is a linear map, we obtain a factorizationapproach, as used in collaborative filtering. In our experiments,the functions fj(·) are nonlinear maps and are modelled by amulti-layer Perceptron (MLP) with J outputs, as also usedin [12] and [13].
C. Markov Embeddings
In a K-th order Markov model, the events in the lastK time steps are used to predict the event in the next timestep. Markov models are used in language models where anevent would correspond to an observed word [12]. Some ofthe leading approaches in computational linguistics [18], [19]are then using learned word embeddings to realize a numberof applications and we will also pursue this approach in thispaper.
More precisely, our model is
θt,i,j = fj(hMart−1,i, h
Mart−2,i, . . . , h
Mart−K,i).
Note that in this model h Mari,t is an an r-dimensional embedding
of all the observed events for patient i at time t. Note also that,in contrast to the situation in language models, several eventscan happen at the same time.
As before, we assume that there is a linear map of the form
h Mart,i = Bxt,i,:
where xt,i,: is a J-dimensional vector that contains all ob-served events for patient i at time t.
We can think of h Mart,i as the latent representation of patient
i at time t based on all events that happened to the patient attime t. In contrast, hhist
t,i was the presentation of all events thathappened to patient i until time t.
Again the j − th column of B is representing latentembedding of event type j. The overall architecture in shownin Figure 1.
D. Personalized Markov Embeddings
The Markov model so far is independent of the individualpatient history but it makes sense to assume that this history
Fig. 1. Markov embedding model for predicting sequences of clinical eventsby taking the previous time steps as inputs.
would be relevant for predicting events. Thus, we include hhistt,i
in the Markov model in the form
θt,i,j = fj(hhist
t,i , hMar
i,t−1, hMar
i,t−2, . . . , hMari,t−K).
The overall architecture is shown in Figure 2.
E. Modelling the Function
In the language models of [12], fj(·) was modelled as astandard multi-layer Perceptron neural network (MLP) withone hidden layer. A similar representation was used in mod-elling knowledge graphs as described in [13]. We use the sameMLP structure here, where we also experimented with differentnumbers of hidden layers. In the following, the set of all MLPparameters is denoted by W = {w}.
F. Cost Function
We derive a cost function based on the Bernoulli likelihoodfunction, also known as Binary Cross Entropy, which has theform:
cost(A,B,W ) =∑t,i,j∈Tr
−xt,i,j log(sig(θt,i,j))− (1−xt,i,j) log(1− sig(θt,i,j))
+λw∑w∈W
w2 + λa
r∑l=1
J∑j=1
a2i,j + λb
r∑l=1
J∑j=1
b2i,j
Note that we added regularization terms to penalize large MLPparameters w and large embedding parameters ai,j and bi,j .Here, λw, λa, and λb are regularization parameters. Tr standsfor the training data set and sig is the sigmoid function.
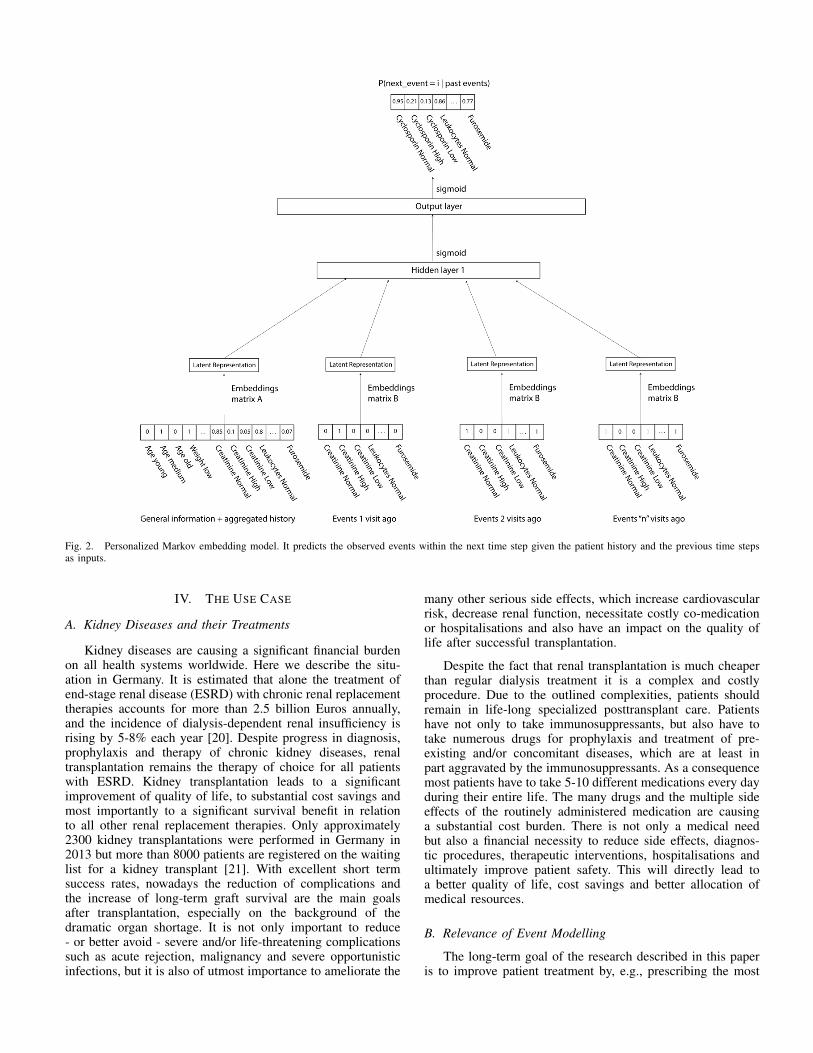
Fig. 2. Personalized Markov embedding model. It predicts the observed events within the next time step given the patient history and the previous time stepsas inputs.
IV. THE USE CASE
A. Kidney Diseases and their Treatments
Kidney diseases are causing a significant financial burdenon all health systems worldwide. Here we describe the situ-ation in Germany. It is estimated that alone the treatment ofend-stage renal disease (ESRD) with chronic renal replacementtherapies accounts for more than 2.5 billion Euros annually,and the incidence of dialysis-dependent renal insufficiency isrising by 5-8% each year [20]. Despite progress in diagnosis,prophylaxis and therapy of chronic kidney diseases, renaltransplantation remains the therapy of choice for all patientswith ESRD. Kidney transplantation leads to a significantimprovement of quality of life, to substantial cost savings andmost importantly to a significant survival benefit in relationto all other renal replacement therapies. Only approximately2300 kidney transplantations were performed in Germany in2013 but more than 8000 patients are registered on the waitinglist for a kidney transplant [21]. With excellent short termsuccess rates, nowadays the reduction of complications andthe increase of long-term graft survival are the main goalsafter transplantation, especially on the background of thedramatic organ shortage. It is not only important to reduce- or better avoid - severe and/or life-threatening complicationssuch as acute rejection, malignancy and severe opportunisticinfections, but it is also of utmost importance to ameliorate the
many other serious side effects, which increase cardiovascularrisk, decrease renal function, necessitate costly co-medicationor hospitalisations and also have an impact on the quality oflife after successful transplantation.
Despite the fact that renal transplantation is much cheaperthan regular dialysis treatment it is a complex and costlyprocedure. Due to the outlined complexities, patients shouldremain in life-long specialized posttransplant care. Patientshave not only to take immunosuppressants, but also have totake numerous drugs for prophylaxis and treatment of pre-existing and/or concomitant diseases, which are at least inpart aggravated by the immunosuppressants. As a consequencemost patients have to take 5-10 different medications every dayduring their entire life. The many drugs and the multiple sideeffects of the routinely administered medication are causinga substantial cost burden. There is not only a medical needbut also a financial necessity to reduce side effects, diagnos-tic procedures, therapeutic interventions, hospitalisations andultimately improve patient safety. This will directly lead toa better quality of life, cost savings and better allocation ofmedical resources.
B. Relevance of Event Modelling
The long-term goal of the research described in this paperis to improve patient treatment by, e.g., prescribing the most

Fig. 3. TBase R©architecture
effective drugs to the patient my minimizing side effects. Par-ticularly in focus are drug-drug interaction (DDI) and adversedrug reactions (ADR) in patients after renal transplantation.Of high interest are the effects of decisions on key outcomeparameters such as patient and graft survival, renal functionas well as hospitalisations. Lastly, the goal is to implementa clinical decision support system directly into the electronicpatient file, in order to prevent dangerous DDI, reduce dosingerrors and provide the physician and patient with timely andadequate information on new prescriptions.
C. TBase R©
In close collaboration with the department of ArtificialIntelligence of the Humboldt University, the Charite - Uni-versitatsmedizin Berlin developed an electronic patient record(TBase R©) for renal allograft recipients in 1999. The main ideawas to combine a database for the daily patient care on theone hand with a validated database for medical research ofthe other hand. The combination of daily medical routine witha research database was the key concept, in order to collectdata of high quality, which are constantly validated by theuser. Due to clinical needs only accurate and reliable datacan be used in daily routine practice. By this means, we havecreated a continuous internal validation process and almostcompletely avoid missing data. Since 2000 TBase R©is usedin the clinical routine of the Charite and all relevant patientdata is automatically transferred. Due to the increase of theoptions of medical diagnostics, the extent of the informationof the clinical data has also increased dramatically. Theelaborate and flexible structure (see Figure 3) of the patientrecord and the database made it possible to integrate a largenumber of electronic data of several subsystems with differentdata structures over the years. Currently TBase R©automaticallyintegrates essential data from the laboratory, clinical pharma-cology, nuclear medicine, findings from radiology and admin-istrative data from the SAP-system of the Charite. TBase R©isnow under patronage of Deutsche Transplantationsgesellschaft(DTG) and Eurotransplant, Leiden, The Netherlands, and wasimplemented in 8 German transplant centres. Figure 4 providesan impression of the schema of TBase R©.
Fig. 4. View on the TBase R©Schema
V. EXPERIMENTS
A. Setup of the Experiments
The data contains every event that happened to each patientconcerning the kidney failure and all its associated effects,including prescribed medications, hospitalizations, diagnosis,laboratory tests and so on. In this paper we will consider eventsfrom year 2005 and onwards due to the improvement of thedata quality from that year. Also, in order to have a bettercontrol of the experiments, we will work with a subset of thevariables available in the dataset. Specifically, we will try tomodel three aspects of the patient evolution:
1) Medication prescriptions: which medications are pre-scribed in each situation.
2) Ordered laboratory tests: which laboratory tests areordered in each situation.
3) Laboratory test results: which will be the outcome ofthe ordered laboratory tests.
Each entry in the database is labelled with the date in whichthe event happened. Our task will consist in predicting all theevents that will happen to a patient on his or her next visit tothe clinic given his past visits, as illustrated in Figure 5.
A very common situation is that the patient gets somelaboratory tests done during the morning, and then based on theresults of those tests, the doctor prescribes some medicationsto the patient in the afternoon. Therefore, we can define asecond type of experiment by only considering days that haveboth laboratory tests performed and medications prescribed,and assuming that the laboratory tests always happen beforethe medications. Specifically, we will try to predict which willbe the medications prescribed in the afternoon given the resultsof the laboratory tests performed in the morning and the eventsthat happened in the previous visits. This way we can see howthe model behaves in intra-day predictions. Figure 6 shows arepresentation of the experiment.
After selecting the subset of the dataset that we will useand performing the binary encoding, our pre-processed datasetconsists of a table where each row represents one visit tothe clinic. Each of these rows belongs to a patient, has anassociated date and contains all the events that occurred during

Fig. 5. Full visit predictions. We predict all the events that will happen within the next visit given the previous visits.
Fig. 6. Intra-day predictions. We predict the medications that will be prescribed in the afternoon given the laboratory analysis that were performed in themorning and the previous visits.
Fig. 7. Example of pre-processed data.
that visit in binary format. An example of how our pre-processed data look like can be found in Figure 7.
B. Hyperparameter Fitting
The model contains several hyperparameters that needto be optimized, being the most relevant ones the rank rof the embeddings, the order of the Markov model K, thenumber of hidden units in the Neural Network, the learningrate and the regularization parameters. In order to fit thesehyperparameters, we randomly split the data into three subsets:60% of the patients were assigned to the training set withtotally about 100 thousand visits, 20% of the patients wereassigned to the validation set and another 20% to the test set,with approximately 33 thousand visits each. Note that, underthis configuration, we evaluate the performance of the model
by predicting the future events of patients that the model hasnever seen before, and therefore increasing the difficulty of thetask.
In Figure 8 we can see how the area under the Precision-Recall curve on the validation set improves as we increasethe order of the Markov model K. We observe that theperformance stabilizes with an input window of size six. A6-th order Markov model (without the personalization) hasaround 28 thousand inputs (4666 input events multiplied by6 time steps). The number of outputs of the Neural Networkis 2383, i.e. 2383 events are predicted.
C. Baseline Models
We will compare the performance of our model withvarious classic Machine Learning algorithms. Specifically, ourbaseline models will be: Naive Bayes classifier, K-nearestneighbor classifier and Logistic Regression. Additionally, wewill also use what we named “constant predictor”, whichconsists in predicting always for each event the occurrencerate of such event (thus the most common event is giventhe highest probability of happening, followed by the secondmost common event, and so on). Random Forests were alsoconsidered to be included in this work, but after some trialsthey were discarded due to the excessive amount of time theyrequired to be trained with this dataset, due to the large numberof events to be predicted (nevertheless in the few experimentswe performed with them, they never got to outperform our

Fig. 8. Area Under the Precision Recall Curve improves as we increasethe number of past visits (order of the Markov model K) used to predict theevents that will be observed in the next visit.
proposed models). When comparing the performance betweenthese models, we report for each model the mean area underthe Precision-Recall curve (AUPRC) and mean area under Re-ceiver Operating Characteristics curve (AUROC) together withtheir associated standard errors after repeating each experimentten times with different random splits of the data. We madesure that these ten random splits were identical for each model.Most of these baseline models were taken from Scikit-learn[22], which is the main open source machine learning libraryfor the Python programming language.
D. Model Training and Evaluation
We trained the proposed models by using mini-batchAdaptive Gradient Descent (AdaGrad) [23] combined with anearly stopping strategy and using a mini-batch size of 128samples. Our main goal will be to maximize the area under thePrecision-Recall curve (AUPRC) of our predictions. We chosethis score due to the high sparsity of the data (the density ofones is around 1%) and because we are mainly interested inpredicting the very small amount of events that will happen,as opposed to the task of predicting which events will notbe observed. Nevertheless, we will also report the area underReceiver Operating Characteristics curve (AUROC) because itis often reported in related scenarios.
The proposed models were implemented in Theano [25],[24], which is a graph-based computation library, especiallywell suited for training Neural Networks. The experimentswere conducted using a Intel(R) Xeon(R) CPU E7-4850 v2processor with 1TB of RAM and 48 cores at 1.2 Ghz with2 threads per core. The reported computation times were allachieved using one thread.
E. Full Visit Predictions
As explained earlier in this section, our first experimentalsetting consists in predicting all the events that will happen tothe patients during their next visit to the clinic given the eventsthat were observed in their previous visits, as it is illustratedin Figure 5.
Therefore, we predict the events that will happen to apatient in her or his next visit to the clinic given the eventsthat were observed in her or his six previous visits to the
clinic, i.e. K = 6. Table I shows the results obtained afterrepeating the experiments with ten different random splits ofthe data. We can see that the Markov embedding model, whichcorresponds to the architecture shown in Figure 1, outperformsall our baseline models. Our proposed Markov embeddingmodel obtained an AUPRC score of 0.574, being LogisticRegression the second best model with an AUPRC score of0.554. We can also see how the random predictor achieved avery low AUPRC score due to the high sparsity of the data,which means that optimizing the AUPRC for this dataset is ahard task.
In the last column of Table I we also report the timethat it took to train for each model with the best set ofhyperparameters in the first random split. Note that one ofthe advantages of the proposed model is that the rank ofthe embeddings matrix B can always be reduced in order todecrease the computational cost required to train the model.Besides, given constant hyperparameters, the parameters ofthe model will increase linearly with the amount of differentevent types present in our dataset (e.g. number of medications,number of diseases...), whereas the parameters of other modelssuch us the Logistic Regression will grow quadratically in thissituation since for every additional event that we include weare adding both one input and one output.
TABLE I. SCORES FOR FULL VISIT PREDICTIONS. AUPRC STANDSFOR AREA UNDER PRECISION-RECALL CURVE. AUROC STANDS FOR
AREA UNDER ROC CURVE.
AUPRC AUROC Time (hours)
Markov Embeddings 0.574 ± 0.0014 0.977 ± 0.0001 6.11Logistic Regression 0.554 ± 0.0020 0.970 ± 0.0005 4.31KNN 0.482 ± 0.0012 0.951 ± 0.0002 17.74Naive Bayes 0.432 ± 0.0019 0.843 ± 0.0015 39.1Constant predictions 0.350 ± 0.0011 0.964 ± 0.0001 0.001Random 0.011 ± 0.0001 0.5 -
We repeated the same experiment with the PersonalizedMarkov Embedding model as represented in Figure 2. Theadditional information that we input to the model is composedof the aggregated history and general information of eachpatient. In order to create the aggregated history, for eachsample that we input to the model we create a vector composedof the sum of all the events that are recorded for that particularpatient until the date of the visit we want to predict. Ourexperiments showed that instead of directly using this count ofthe data as long term memory, we have two options that workbetter. The first option consists in computing the frequencyof appearance of each event by dividing each row of thememory by the number of visits used to make the count. Thesecond option consists in normalizing the count between 0and 1. We will use both the appearance frequency of eachevent and the normalized count as our long term memory.Regarding the background information, it is composed of staticor slow changing variables that we also converted to a binaryformat. Specifically, the background information is composedof the following variables: age, gender, blood type, time fromfirst dialysis, time from the first time the patient was seen,weight and primary disease. We can see in Table II how thepersonalization of the Markov embedding model improved itsperformance. During our experiments, we observed that amongall the variables that compose the additional information used

in this experiment, the inclusion of the frequency of appearanceof each event is the factor that contributed most to theimprovement of the performance of the model. Last row inII shows the performance of the model when making thepredictions using just the aggregated patient history as input,as described in Section III-B.
TABLE II. SCORES FOR FULL VISIT PREDICTIONS WITH ANDWITHOUT LONG TERM MEMORY AND BACKGROUND INFORMATION.
AUPRC STANDS FOR AREA UNDER PRECISION-RECALL CURVE. AUROCSTANDS FOR AREA UNDER ROC CURVE.
AUPRC AUROC
Personalized Markov embeddings 0.584 ± 0.0011 0.978 ± 0.0001Markov embeddings 0.574 ± 0.0014 0.977 ± 0.0001Patient history embedding 0.487 ± 0.0016 0.974 ± 0.0002
Regarding the architecture of the personalized Markovembedding model, we also tested the option of having justone embeddings matrix shared between the long term memoryand the visits within the time window, i.e. A = B, butwe found that the best strategy for our use case is to useseparate embeddings matrix for the long term memory andthe background information as it is shown in Figure 2.
We also tried to initialize the embedding matrices by usingan autoencoder. This brought a speed up of around 30% to theoptimization process of the model. However, this advantagevanished when we considered both the model optimizationtime and the training time of the autoencoder.
F. Intra-day Predictions
Our second experiment type consists in predicting whichmedications will be prescribed in the afternoon given theresults of the laboratory tests performed in the morning andthe events that happened in the six previous visits. Figure 6shows a representation of the experiment. The architecture ofthe model will be similar to the one for the Markov embeddingmodel (Figure 1), but including one more time step in theinput window that will contain the information regarding allthe observed events in the present day. Therefore, for thisexperiment the order of the Markov model K will be equalto seven, instead of six as it was in the case of full visitpredictions. We can see the result of the experiment in TableIII, which shows that also in this setting our proposed modeloutperforms the baseline models. The Markov embeddingmodel for intra-day predictions achieved an AUPRC score of0.277, which is lower than the score achieved when doing fullvisit predictions because the dataset is even more sparse whenwe only take into account the medications. Logistic Regressionis again the second best result, and we can also observe howin this case the performance of the constant predictor is almostas bad as the random predictor, which means that this is evena harder task than the full visit predictions.
Another interesting experiment is to compare this resultwith the one obtained when doing full visit predictions. Thatis, we will measure the performance of predicting medicationprescriptions both considering the laboratory tests performedin the same day and not considering them. Table IV showsthat incorporating intra-day information actually improves theperformance of the predictions.
TABLE III. SCORES FOR INTRA-DAY PREDICTIONS. AUPRC STANDSFOR AREA UNDER PRECISION-RECALL CURVE. AUROC STANDS FOR
AREA UNDER ROC CURVE.
AUPRC AUROC
Markov embeddings intra-day 0.277 ± 0.0026 0.935 ± 0.0007Logistic Regression intra-day 0.238 ± 0.0041 0.916 ± 0.0014KNN 0.184 ± 0.0027 0.873 ± 0.0002Naive Bayes intra-day 0.231 ± 0.0013 0.686 ± 0.0020Constant predictions intra-day 0.008 ± 0.0013 0.564 ± 0.0064Random intra-day 0.006 ± 0.0064 0.5
TABLE IV. SCORES FOR INTRA-DAY PREDICTIONS WITH ANDWITHOUT CONSIDERING THE PRESENT DAY. AUPRC STANDS FOR AREA
UNDER PRECISION-RECALL CURVE. AUROC STANDS FOR AREA UNDERROC CURVE.
AUPRC AUROC
Markov embeddings intra-day 0.277 ± 0.0026 0.935 ± 0.0007Markov embeddings 0.250 ± 0.0022 0.931 ± 0.0006
Besides, as we did with full visit predictions, we willmake intra-day predictions incorporating a long term memoryand background information of the patients. Table V showshow we improved the performance of the predictions with thepersonalized Markov embedding model.
TABLE V. SCORES FOR INTRA-DAY PREDICTIONS WITH ANDWITHOUT MEMORY AND BACKGROUND INFORMATION. AUPRC STANDS
FOR AREA UNDER PRECISION-RECALL CURVE. AUROC STANDS FORAREA UNDER ROC CURVE.
AUPRC AUROC
Personalized Markov embeddingsintra-day 0.289 ± 0.0027 0.938 ± 0.0005
Markov embeddings intra-day 0.277 ± 0.0026 0.935 ± 0.0007
G. Sensitivity Analysis
We performed a sensitivity analysis in order to evaluatehow the model reacts to changes in the inputs. We performedthis analysis using the medication named Tacrolimus, becauseit is one of the main immunosuppressants used in our databasebut it is not as frequent as other immunosuppressants such asCyclosporin.
When doing the intra-day predictions as illustrated inFigure 6, and if we look exclusively at the score obtainedin the prediction of Tacrolimus prescription (i.e. predictingwhether or not Tacrolimus prescription will be observed next),we obtain an AUPRC score of 0.629, whereas the randomprediction score 0.160. The sensitivity analysis will consist insuppressing one by one the events in the input and check howthe absence of such input affects to the AUPRC score.
After performing this analysis we rank our input variablesaccording to how much the AUPRC score of predictingTacrolimus prescription was degraded when suppressing eachof them. Even though this is a simplified analysis since wedo not analyze how each variable influences the output whencombined with other variables, we can infer that the higher avariable is ranked, the higher is the importance that has beenassigned to it by our model for this task.

Most of the prescriptions of Tacrolimus present in ourdatabase correspond to an increase or decrease of the amountof medication that a patient is taking. The dosage of Tacrolimusthat a patient takes has to be adjusted when certain criteria aremet. The factors that the physicians take into account to decidewhether or not the dosage of Tacrolimus has to be changedare the amount of Tacrolimus in blood and the excess ofCreatinine in blood. Out of almost 5000 events, the laboratoryresults for “Low Tacrolimus”, “High Tacrolimus” and “NormalTacrolimus” occupy the positions second, third and fourthrespectively in our sensitivity ranking. The laboratory result of“High Creatinine” occupies the position number 27. Thereforewe can see how the model has learnt to predict the prescriptionof Tacrolimus giving a very high importance to the sameobservations that the physicians use. Moreover, other factorsthat are also correlated with the prescription of Tacrolimus arealso present in the top 10 entries of the sensitivity ranking. Forexample in the position number 8 we find “High C-reactiveprotein”, which is an infection marker that, when observed,indicates that the Tacrolimus dosage has to be reduced. Alsoin position 10 we find “High Glucose” which is a side effect ofTacrolimus that often leads to the reduction of the Tacrolimusdosage.
VI. FUTURE WORK
We will try to improve the model by introducing otherelements that proved to be successful in deep Neural Networkssuch as drop out regularization and temporal convolutional lay-ers. We will also explore the possibility of including additionalinformation in the model such as the size of the time gapbetween the visits.
Besides, [19] showed that Recurrent Neural Networks pro-vide the best performance in the task of language modelling.Therefore we will explore such models for our use case.
Regarding the data, we will extend our model to predictmore event types within this dataset, and we will also applyour model to other datasets and use cases.
Our project also serves to encourage the TBase system tocollect more information that would be valuable for decisionsupport, such as patient symptoms and a precise time stampfor each event. Future work will also include the incorporationof textual information as present in pathology reports andinformation from molecular tests, e.g., genetics. Finally, weplan to make more extensive use of background ontologieswhich for example can be used to map different medicationswith identical active components to a common representation.
VII. CONCLUSION
We presented a model capable of predicting clinical eventsthat is scalable and provides an acceptable performance forour current use case, which consist of modelling a subset ofthe variables that compose the evolution of the patients in ourdataset.
Our work already lead to new requirements for improvingthe medical documentation. For example a detailed documen-tation of the patients symptoms would be a very valuableinformation for improving the model.
We showed how the proposed model performed better thanour baseline models both making full visit predictions andintra-day predictions. We also showed how to integrate boththe background information of each patient and a long termmemory in order to improve the performance of the model.
Our model currently predicts common practice in a clinicwhich can already be useful in many ways, for example inalerting staff in case of unusual decisions. Of course the ulti-mate goal of a clinical decision support system should be notjust replicating the decisions that are most often taken by thephysicians in each situation, but to provide recommendationsthat lead to the best outcome possible. The basis for achievingthis goal is a predictive model as presented in this paper.
ACKNOWLEDGMENTS
This work was supported by the European Union 7thFramework Programme through the Marie Curie Initial Train-ing Network Machine Learning for Personalized MedicineMLPM2012, Grant No. 316861. We also acknowledge supportby the German Federal Ministry of Economics and Technologyunder the program “Smart Data”, grant number 01MT14001.
REFERENCES
[1] Charles Safran, Meryl Bloomrosen, Edward Hammond, Steven Labkoff,Suzanne Markel-Fox, Paul C. Tang, Don E. Detmer. Toward a NationalFramework for the Secondary Use of Health Data: An AmericanMedical Informatics Association White Paper. Journal of the AmericanMedical Informatics Association, 2007.
[2] Travis B. Murdoch, Allan S. Detsky. The Inevitable Application of BigData to Health Care JAMA, 2013.
[3] Volker Tresp, Sonja Zillner, Maria J. Costa, Yi Huang, AlexanderCavallaro, Peter A. Fasching, Andre Reis, Martin Sedlmayr, ThomasGanslandt, Klemens Budde, Carl Hinrichs, Danilo Schmidt, PhilippDaumke, Daniel Sonntag, Thomas Wittenberg, Patricia G. Oppelt,and Denis Krompass. Towards a New Science of a Clinical DataIntelligence. NIPS 2013 Workshop on Machine Learning for ClinicalData Analysis and Healthcare, 2013.
[4] Sebastian Schneeweiss. Learning from Big Health Care Data. N EnglJ Med, 2014.
[5] The Resource Description Framework (RDF) as a modern Struc-ture for Medical Data Gabriela Lindemann, Danilo Schmidt, ThomasSchrader, Dietmar Keune World Academy of Science, Engineering andTechnology International Journal of Medical, Health, Biomedical andPharmaceutical Engineering Vol:1, No:7, 2007.
[6] K. Schrter, G. Lindemann, L. Fritsche: TBase2 A web-based ElectronicPatient Record. Fundamenta Informaticae 43, 343-353, IOS Press,Amsterdam, 2000.
[7] Huber L., Naik M., Budde K., Desensitization of HLA-incompatiblekidney recipients. N Engl J Med. 27;365(17):1643, Oct 2011.
[8] Budde K. et al., Everolimus-based, calcineurin-inhibitor-free regimenin recipients of de-novo kidney transplants: an open-label, randomised,controlled trial. The Lancet. 5;377(9768):837-47, Mar 2011.
[9] Budde K. et al., Conversion from cyclosporine to everolimus at 4.5months posttransplant: 3-year results from the randomized ZEUS study.Am J Transplant. 12(6):1528-40, Jun 2012.
[10] Bissler JJ, Kingswood JC, Radzikowska E, Zonnenberg BA, Frost M,Belousova E, Sauter M, Nonomura N, Brakemeier S, de Vries PJ,Whittemore VH, Chen D, Sahmoud T, Shah G, Lincy J, Lebwohl D,Budde K. Everolimus for angiomyolipoma associated with tuberoussclerosis complex or sporadic lymphangioleiomyomatosis: a multicen-tre, randomised, double-blind, placebo-controlled trial. The Lancet,2012
[11] Yehuda Koren, Robert M. Bell and Chris Volinsky. Matrix FactorizationTechniques for Recommender Systems, IEEE Computer, 2009.
[12] Yoshua Bengio, Rejean Ducharme, Pascal Vincent and Christian Jauvin,A Neural Probabilistic Language Model, Journal of Machine LearningResearch, 3(1137–1155), 2003.
[13] Maximilian Nickel, Kevin Murphy, Volker Tresp, and EvgeniyGabrilovich. A Review of Relational Machine Learning for KnowledgeGraphs: From Multi-Relational Link Prediction to Automated Knowl-edge Graph Construction. To appear in the Proceedings of the IEEE,(invited paper), 2015.
[14] MW. Lorenz, HS. Markus, ML. Bots, M. Rosvall, M. Sitzer, Predictionof Clinical Cardiovascular Events With Carotid Intima-Media Thick-ness. Circulation in American Heart Association, 2006.
[15] DH. O’Leary, JF. Polak, Intima-media thickness: a tool for atherosclero-sis imaging and event prediction. The American Journal of cardiology,2002.
[16] F. Wang, N. Lee, J. Hu, J. Sun, S. Ebadollahi, Towards heterogeneoustemporal clinical event pattern discovery: a convolutional approach.Proceedings of the 18th ACM SIGKDD international conference onKnowledge discovery and data mining, 2012.
[17] Denis Krompaß, Cristobal Esteban, Volker Tresp, Martin Sedlmayr andThomas Ganslandt. Exploiting Latent Embeddings of Nominal ClinicalData for Predicting Hospital Readmission. KI - Kunstliche Intelligenz,December 2014.
[18] Ronan Collobert and Jason Weston and Leon Bottou and MichaelKarlen and Koray Kavukcuoglu and Pavel P. Kuksa. Natural LanguageProcessing (Almost) from Scratch. Journal of Machine Learning Re-search, 2012.
[19] Mikolov Tomas. Statistical Language Models based on Neural Net-works. PhD thesis, Brno University of Technology, 2012.
[20] Lysaght MJ. Maintenance dialysis population dynamics: current trendsand long-term implications. J Am Soc Nephrol, 2002.
[21] Nierentransplantation, http://www.dso.de/organspende-und-transplantation/transplantation/ nierentransplantation.html.
[22] Pedregosa, F. and Varoquaux, G. and Gramfort, A. and Michel, V.and Thirion, B. and Grisel, O. and Blondel, M. and Prettenhofer, P.and Weiss, R. and Dubourg, V. and Vanderplas, J. and Passos, A.and Cournapeau, D. and Brucher, M. and Perrot, M. and Duchesnay,E. Scikit-learn: Machine Learning in Python, in Journal of MachineLearning Research 12 (2825–2830), 2011.
[23] J. Duchi, E. Hazan, and Y. Singer. Adaptive subgradient methods foronline learning and stochastic optimization. The Journal of MachineLearning Research, pages 2121-2159, 2011.
[24] F. Bastien, P. Lamblin, R. Pascanu, J. Bergstra, I. Goodfellow, A.Bergeron, N. Bouchard, D. Warde-Farley and Y. Bengio. Theano: newfeatures and speed improvements. NIPS deep learning workshop, 2012.
[25] J. Bergstra, O. Breuleux, F. Bastien, P. Lamblin, R. Pascanu, G.Desjardins, J. Turian, D. Warde-Farley and Y. Bengio. Theano: A CPUand GPU Math Expression Compiler. Proceedings of the Python forScientific Computing Conference (SciPy), 2010.