tendency scale for technology use in class:...
TRANSCRIPT

Eğitimde Kuram ve Uygulama Articles /Makaleler
Journal of Theory and Practice in Education 2014, 10(4): 863-884
ISSN: 1304-9496
© Çanakkale Onsekiz Mart University, Faculty of Education. All rights reserved.
© Çanakkale Onsekiz Mart Üniversitesi, Eğitim Fakültesi. Bütün hakları saklıdır.
TENDENCY SCALE FOR TECHNOLOGY USE IN
CLASS: DEVELOPMENT, RELIABILITY AND
VALIDITY*
(DERSTE TEKNOLOJİ KULLANIMINA YÖNELİK EĞİLİM ÖLÇEĞİ: GELİŞTİRME,
GÜVENİRLİK ve GEÇERLİK)
Selim GUNUC1
Abdullah KUZU2
ABSTRACT In related literature, there is a need for a measurement tool to examine students’ tendencies towards technology.
For this reason, the present study aimed at developing a scale for the tendency towards technology use in class.
As there is limited research in literature, the item pool was developed mostly based on the data collected via the
interviews and the written compositions. The participants of the study were 796 student teachers attending the
Education Faculty at Anadolu University in Turkey in the Spring Term of the academic year of 2013-2014. EFA
and CFA were conducted with different samples, and a five-point Likert-type scale made up of 16 items and two
factors (emotional and behavioral tendencies) was developed. The total explained variance for the two factors of
TSTUC was calculated as around 60%. The Cronbach’s Alpha (α) internal consistency reliability coefficient of
the total scale was calculated as .93 as a result of EFA and .953 as a result of CFA. Higher scores to be produced
by TSTUC refer to the fact that there is a higher tendency towards technology use in classes or that technology
use is favored more by students in classes.
Key Words: Tendency; Technology; Scale Development; Higher education.
ÖZET Alanyazında, öğrencilerin teknolojiye yönelik eğilimlerini incelemek için bir ölçme aracına ihtiyaç
duyulmaktadır. Bu nedenle, bu çalışmada derste teknoloji kullanımına yönelik eğilim ölçeğinin geliştirilmesi
amaçlanmıştır. Alanyazındaki sınırlı araşmalar nedeniyle, madde havuzu önemli ölçüde katılımcılarla yapılan
görüşme ve yazdırılan kompozisyonlardan elde edilen verilerle geliştirilmiştir. Araştırmanın katılımcılarını 2013-
2014 öğretim yılı bahar döneminde Anadolu Üniversitesi Eğitim Fakültesi’nde öğrenim gören 796 öğretmen
adayı oluşturmuştur. AFA ve DFA farklı örneklem gruplarla gerçekleştirilmiştir. Analizler sonucunda, iki faktör
(duyuşşal ve davranışsal eğilim) ve toplam 16 maddeden oluşsan beşli likert tipinde bir ölçek geliştirilmiştir. İki
faktöre ilişkin toplam açıklanan varyans %60 olarak hesaplanmıştır. Ölçeğe ilişkin Cronbach Alfa iç tutarlılık
güvenirlik katsayısı AFA sonucunda .93 ve DFA sonucunda .953 olarak hesaplanmıştır. Ölçekten alınan yüksek
puan, derste teknoloji kullanımına yönelik yüksek eğilime ya da derste teknoloji kullanımının daha çok tercih
edildiğine işaret etmektedir.
Anahtar kelimeler: Eğilim; Teknoloji; Ölçek geliştirme; Yüksek öğretim.
1 Assistant Professor (Corr. Aut.), Yuzuncu Yil University Faculty of Education, [email protected]
2 Associate Professor, Anadolu University Faculty of Education, [email protected]
* This study is a part of the first author’s doctoral dissertation.

Gunuc & Kuzu 864
© Çanakkale Onsekiz Mart University, Faculty of Education. All rights reserved.
© Çanakkale Onsekiz Mart Üniversitesi, Eğitim Fakültesi. Bütün hakları saklıdır.
INTRODUCTION
Today, while technology continues its rapid development, its effects are still a
matter of debate. Especially between different generations, there are various usages and
preferences regarding technology. It is seen that this situation occurs between teachers
and students in educational environments and that these generations are against each
other regarding a number of issues (Naish, 2008; Sheard, Carbone and Hurst, 2010;
Waycott, Bennett, Kennedy, Dalgarno and Gray, 2010; Weiß and Bader, 2010).
Prensky (2001) refers to children and adolescents born into technology culture as
digital natives. In this respect, teachers could be regarded as digital immigrants.
According to Palfrey and Gasser (2008), digital immigrants constitute the generation
born in the analog World but shaped with the digital culture. Digital natives own and
use technological devices more than digital immigrants (Kvavik, Caruso and Morgan,
2004; Margaryan, Littlejohn and Vojt, 2011). It could be stated that digital natives have
different life styles and behavior when compared to previous generations and that the
most important difference is more apparent in technology use (Brown, 2000; Frand,
2000; Jukes and Dosaj, 2003; McMahon and Pospisil, 2005; Oblinger and Oblinger,
2005; Prensky, 2004). For this reason, it should be remembered that individuals grown
up in two different cultures (teachers and students) are likely to have different
perceptions and preferences regarding technology use in education.
Students of the 21st century claim that schools should be arranged in line with
their demands and needs (Kolikant, 2010). When educational environments are not
arranged considering students’ demands and needs and when technology is not
effectively integrated into educational environments, several situations can be seen: the
attractiveness of schools decreases; students get bored in courses at school; students’
absenteeism in class increases; and their interest in learning decreases (Pedró, 2006;
Yazzie-Mintz, 2010). In this respect, students’ interests, perceptions and demands are
quite important for such outcomes as academic achievement, attendance in classes and
attitudes towards learning and school (Fredricks, Blumenfeld and Paris, 2004).
Regarding this, the contributions of technology into the education process could be said
to include effective and permanent learning, student engagement, motivation,
participation, interaction, communication, cooperation and so on (DeWitt and Siraj,
2010; Gibbs and Poskitt, 2010; Golubski, 2012; Hussain and Safdar, 2008; Liburd and
Christensen, 2013; Nelson Laird and Kuh, 2005; (Parker, Bianchi ve Cheah, 2008).
However, students' perceptions and attitudes towards technology are very important to
increase the contribution of technology to the educational settings and learning.
Technology-related positive experiences are likely to lead to positive
perceptions regarding technology; on the other hand, lack of experience in technology
or having negative experiences may cause negative attitudes towards technology
(Reynolds and Rucker, 2002). In other words, even if they demonstrate positive
attitudes towards the use of technology in instructional activities, students may develop

Tendency scale for technology use in class: Development, reliability and validity 865
Journal of Theory and Practice in Education / Eğitimde Kuram ve Uygulama
Articles /Makaleler - 2014, 10(4): 863-884
negative perceptions and attitudes towards the use of technology in class due to
lecturers’ wrong or ineffective use of technology. In some studies, it was revealed that
there were differences between the perceptions of students and faculty members
regarding the influence of technology use in class (Doppelt, 2006; Parker, Bianchi and
Cheah, 2008). Students’ lack of tendency towards technology use in class may lead to
their disengagement with class. In other words, while effective use of technology will
bring about benefits, it may also result in an adverse effect due to the deficiency in the
infrastructure or incompetent faculty members (Gunuc, 2013). Previous studies
revealed that both primary/secondary and higher education students have positive
attitudes towards the use of technology in education (Adifib, 2007; Gunuc, 2013). On
the other hand, students reported that they did not favor the use of all kinds of
technology in educational settings (DeWitt and Siraj, 2010). For the purpose of helping
students make efficient use of school and gain positive school outcomes, it is quite
important to make class environments attractive using technology and to arrange the
class environments considering students’ preferences.
Especially in higher education, it is quite difficult to say that all students are
digital natives (Kolikant, 2009). It is important to determine whether digital native
students prefer technology usage in classes because the tendency towards the use of
technology in class is also related to such factors as effective integration of technology,
teacher competency, teacher’s technology attitude and technological infrastructure
(Marzilli et al. 2014). Especially digital native students may not prefer technology use
in class in cases of incompetent faculty members or deficiencies in the infrastructure
(Gunuc, 2013). Determining whether students have a tendency towards the use of
technology in class is also important not only to organize educational environments
accordingly but also to revise technological competencies of faculty members. It will
be possible to investigate the underlying reasons why students who do not tend to use
technology in class lack such tendency. For whatever reason, students' attitudes and
perceptions are influenced by all of these factors and problems, and it may cause a
change in the tendency towards technology use in class (Teo and Zhou, 2014; Wong,
Teo and Russo, 2013). Even if students in a class are assumed to be digital natives,
their tendencies towards technology should be determined by using a measurement
tool, and the teaching process should be planned accordingly. In this respect, in related
literature, there is a need for a measurement tool to examine students’ tendencies
towards technology. For this reason, the present study aimed at developing a scale for
the tendency towards technology use in class.
In this study, technology is referred to as instructional hardware and software
technologies such as laptop, Internet, tablet PC, interactive whiteboard, smart phone,
projector and slideware presentations utilized in class and in instructional activities in
higher education institutions in Turkey. Also, what technology use refers to is
especially the faculty member’s use of this technology in class. However, the scale
items were determined not only by taking the faculty member’s technology use into

Gunuc & Kuzu 866
© Çanakkale Onsekiz Mart University, Faculty of Education. All rights reserved.
© Çanakkale Onsekiz Mart Üniversitesi, Eğitim Fakültesi. Bütün hakları saklıdır.
account but also by considering the students’ technology use in class during the
instructional activities as well as their out-of-class communication with the faculty
member and their fulfilling the task-related responsibilities (e.g. homework, research,
project, etc.).
METHOD
Sample
The participants of the study were 796 student teachers attending the Education
Faculty at Anadolu University, a state university, in the Spring Term of the academic
year of 2013-2014. The participants were determined with the convenience and
stratified sampling methods, which are among sampling methods for exploratory factor
analysis (EFA) and confirmatory factor analysis (CFA). In this respect, first, the data
for EFA were collected. After determining the factor structure, for CFA, the data were
collected from a different group of participants (Table 1), and the factor structure of the
scale was confirmed.
Table 1. Samples for EFA and CFA EFA CFA
Variable ƒ % ƒ %
Gender
Female 269 65,0 217 65,4
Male 145 35,0 115 34,6
Total 414 100,0 332 100,0
Department
Computer Education and Instructional Technology 59 14,3 54 16,3
Special Education 69 16,7 35 10,5
Foreign Language Education 100 24,1 107 32,2
Primary Education 123 29,7 59 17,8
Fine Arts Education 28 6,8 46 13,9
Educational Sciences 35 8,4 31 9,3
Total 414 100,0 332 100,0
Grade
1 127 30,7 51 15,4
2 109 26,3 145 43,7
3 109 26,3 86 25,9
4 69 16,7 50 15,1
Total 414 100,0 332 100,0
As shown in Table 1, when the distributions of the participants were examined
for EFA, it was seen that the data were collected from 414 student teachers. For CFA,
the data were collected from 382 student teachers. As CFA is quite sensitive to missing

Tendency scale for technology use in class: Development, reliability and validity 867
Journal of Theory and Practice in Education / Eğitimde Kuram ve Uygulama
Articles /Makaleler - 2014, 10(4): 863-884
values, 50 participants with missing data were not included in the data set. Thus, as
shown in Table 1, the analyses were conducted for 332 individuals.
Data Collection Tools
Semi-Structured Interview and Composition Form: While developing the
item pool, besides, studies reported in literature, the composition data and semi-
structured interviews were used. In this respect, semi-structured interviews were held
with 25 students, and 20 students were asked to write down compositions regarding the
subject given to them. The interview questions were directed to determine the role of
technology in students’ attendance and participation in classes. In addition, the students
were asked to write down a composition regarding “their preferences and tendencies
towards technology use in class”.
Tendency Scale for Technology Use in Class (TSTUC) Initial Form: Prior to
analysis, the items related to the initial form of “Tendency Scale for Technology Use in
Class (TSTUC)” were developed. The scale aimed at measuring the extent of the
students’ tendency towards technology use in class. In other words, the purpose of this
scale was to examine the extent to which the students preferred technology use in class.
As shown in Table 2, the item pool made up of 21 items was developed with the help
of the interviews held with the participants, the compositions they wrote down and the
related literature. The items related to the students’ tendencies and perceptions
regarding technology were developed considering such themes as preferring
technology use in class, using technology in course-related activities out of class,
attending classes and participating in lessons more which involved technology use,
learning better and becoming more successful in classes which involved technology
use and preferring technology use in course-related tasks and responsibilities.
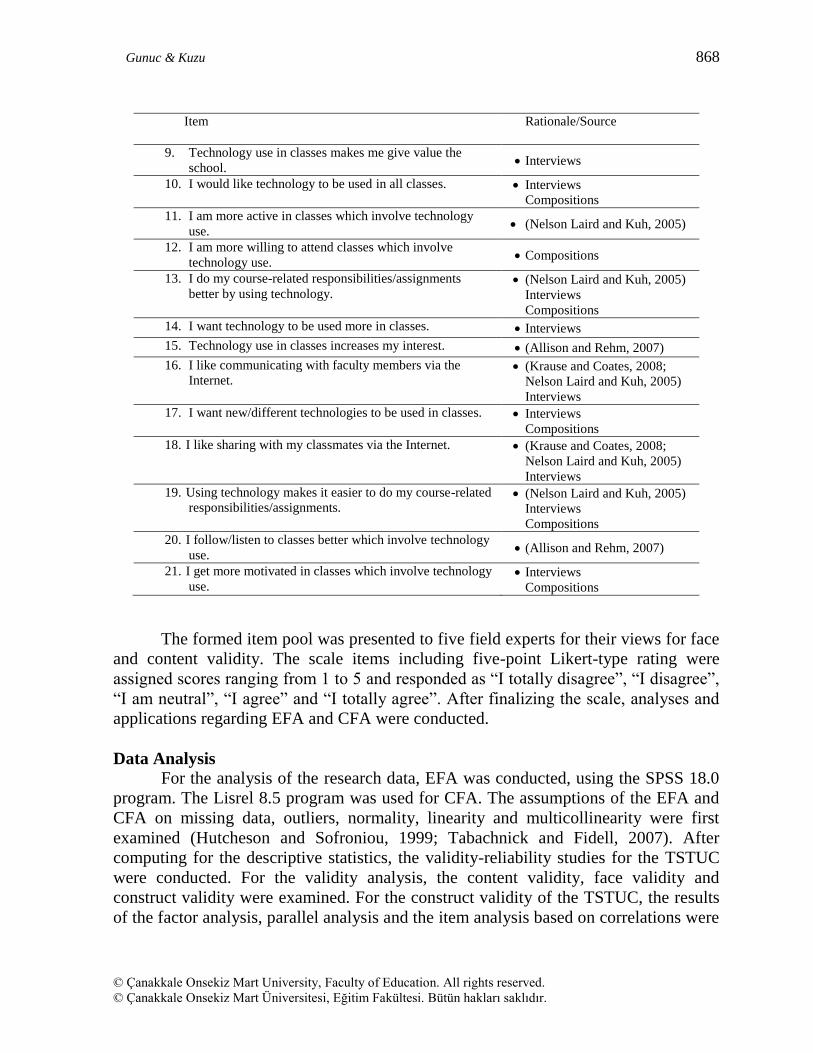
Table 2. Items, Sources and Scale Items
Item Rationale/Source
1. I learn better in classes which involve technology use. Interviews
Compositions
2. I pay more attention to classes when technology is used. Interviews
3. Technology use in classes makes me feel as if I am a part
of my school. Interviews
4. I enjoy learning with technology. Interviews
Compositions
5. Classes involving technology use are more entertaining. Interviews
Compositions
6. I attend classes more which involve technology use. Compositions
7. I am better prepared for classes which involve
technology use. Compositions
8. I give more importance to classes which involve
technology use. Compositions
Gunuc & Kuzu 868
© Çanakkale Onsekiz Mart University, Faculty of Education. All rights reserved.
© Çanakkale Onsekiz Mart Üniversitesi, Eğitim Fakültesi. Bütün hakları saklıdır.
Item Rationale/Source
9. Technology use in classes makes me give value the
school. Interviews
10. I would like technology to be used in all classes. Interviews
Compositions
11. I am more active in classes which involve technology
use. (Nelson Laird and Kuh, 2005)
12. I am more willing to attend classes which involve
technology use. Compositions
13. I do my course-related responsibilities/assignments
better by using technology. (Nelson Laird and Kuh, 2005)
Interviews
Compositions
14. I want technology to be used more in classes. Interviews
15. Technology use in classes increases my interest. (Allison and Rehm, 2007)
16. I like communicating with faculty members via the
Internet. (Krause and Coates, 2008;
Nelson Laird and Kuh, 2005)
Interviews
17. I want new/different technologies to be used in classes. Interviews
Compositions
18. I like sharing with my classmates via the Internet. (Krause and Coates, 2008;
Nelson Laird and Kuh, 2005)
Interviews
19. Using technology makes it easier to do my course-related
responsibilities/assignments. (Nelson Laird and Kuh, 2005)
Interviews
Compositions
20. I follow/listen to classes better which involve technology
use. (Allison and Rehm, 2007)
21. I get more motivated in classes which involve technology
use. Interviews
Compositions
The formed item pool was presented to five field experts for their views for face
and content validity. The scale items including five-point Likert-type rating were
assigned scores ranging from 1 to 5 and responded as “I totally disagree”, “I disagree”,
“I am neutral”, “I agree” and “I totally agree”. After finalizing the scale, analyses and
applications regarding EFA and CFA were conducted.
Data Analysis
For the analysis of the research data, EFA was conducted, using the SPSS 18.0
program. The Lisrel 8.5 program was used for CFA. The assumptions of the EFA and
CFA on missing data, outliers, normality, linearity and multicollinearity were first
examined (Hutcheson and Sofroniou, 1999; Tabachnick and Fidell, 2007). After
computing for the descriptive statistics, the validity-reliability studies for the TSTUC
were conducted. For the validity analysis, the content validity, face validity and
construct validity were examined. For the construct validity of the TSTUC, the results
of the factor analysis, parallel analysis and the item analysis based on correlations were

Tendency scale for technology use in class: Development, reliability and validity 869
Journal of Theory and Practice in Education / Eğitimde Kuram ve Uygulama
Articles /Makaleler - 2014, 10(4): 863-884
evaluated together. The method of Principal Components Analysis was used for factor
analysis.
The appropriateness of the structure of the TSTUC obtained through EFA and
other item analyses were confirmed using the CFA method. The indices of 2 (Chi-
Square Goodness of Fit), GFI (Goodness of Fit Index), AGFI (Adjusted Goodness of
Fit Index), CFI (Comparative Fit Index), NFI (Normed Fit Index), NNFI (Not-Normed
Fit Index), RMR (Root Mean Square Residuals), SRMR (Standardized Root Mean
Square Residuals) and RMSEA (Root Mean Square Error of Approximation) helped in
determining the appropriateness of the model. For the reliability analysis of the items
obtained as a result of these analyses, the Cronbach’s Alpha (α) value, which is also
called the internal-consistency coefficient, was calculated.
FINDINGS
Data Screening and Examining the Assumptions
For EFA, regarding the data collected from 414 participants found in the
sample, z-scores for the univariable outliers and Mahalanobis distances for the
multivariate outliers were calculated (Huck, 2012; Kline, 2011). The z-scores are
suggested to be in the range of ±3 (Hutcheson and Sofroniou, 1999; Kline, 2011). It
was found out that the Z scores regarding the initial form of TSTUC ranged between
+2,000 and -2,711. As the values of both Z points and Mahalanobis output for the
remaining 414 students were in acceptable range, no other outliers were observed in
the data set. As for CFA, the participants with missing data were not included in the
data set, and the outliers in the data set of a total of 332 participants were determined.
In this respect, three outliers (z=-4,030; z=-3,451 and z=-3,244) were excluded from
the data set. As the values of the Mahalanobis output for the remaining 328 participants
were in acceptable range, it was seen that there were no multivariate outliers in the data
set. In addition, normality, linearity, multicollinearity and singularity, which are all
assumptions of multivariate analyses, were examined (Hutcheson and Sofroniou, 1999;
Kline, 2011; Tabachnick and Fidell, 2007). The values of skewness (-.368; ±1) and
kurtosis (-.331; ±1) for EFA and those of skewness (-.415; ±1) and kurtosis (.088; ±1)
for CFA were found to be in acceptable range. In addition, when the histogram, P-P
and Q-Q graphics for EFA and the histogram, P-P and Q-Q graphics for CFA were
examined, it was seen that the distributions were normal (Huck, 2012; Pallant, 2007;
Kline, 2009).
Multivariate normality and linearity were examined with scatter plot matrix
(Tabachnick and Fidell, 2007), and all the variables were observed to demonstrate an
oval scatter in between. Finally, whether there were multicollinearity and singularity
problems between the variables were examined. In this respect, the item-item
correlations of the 21 items found in the item pool were examined, and the Pearson
correlation coefficients of all the items were found to be lower than .90 (Field, 2009;

Gunuc & Kuzu 870
© Çanakkale Onsekiz Mart University, Faculty of Education. All rights reserved.
© Çanakkale Onsekiz Mart Üniversitesi, Eğitim Fakültesi. Bütün hakları saklıdır.
Kline, 2011; Tabachnick and Fidell, 2007). Also, in order to determine the
multicollinearity problem, the tolerance and VIF values were examined. The tolerance
values for the EFA participants were found to range between .273 and .575 and the VIF
between 11,738 and 3,665; in addition, the tolerance values for the CFA participants
ranged between .251 and .648 and the VIF values between 1,543 and 3,977. In this
respect, it was seen that the tolerance value for each item was higher than .10, which is
suggested in related literature, and that the VIF value was lower than 10, which is
suggested in related literature (Kline, 2011). Based on these results, it was concluded
that there was no multicollinearity or singularity problem for the EFA and CFA
participants.
Item Analysis
Regarding the item analyses, Table 3 and Table 4 present not only the scale-
total statistics but also the descriptive statistics for each item. After the total-scale
scores and the item statistics were examined, the EFA calculations were done. The
Cronbach Alpha (α) internal consistency reliability coefficient of the initial scale was
found to be .94. If the internal consistency reliability coefficient is higher than .90, then
the value is considered to be highly reliable (DeVellis, 2003).
Table 3. Descriptive Statistics Regarding the TSTUC Total Scores
N X Var. sd Min. Max. Skewness Kurtosis
Statistic 414 74,703 214,510 14,646 35 104 -.368 -.331
Std. error .120 .239
Table 4. Descriptive Statistics Regarding the Items
Item N X sd
Skewness
Kurtosis
Item-total scale cor.
I1 414 3,965 .940 -1,072 1,119 .670*
I2 414 3,845 .946 -.755 .286 .669*
I3 414 3,102 1,085 .043 -.714 .587*
I4 414 3,925 .895 -.813 .388 .716*
I5 414 3,874 .963 -.822 .273 .671*
I6 414 3,247 1,135 -.228 -.853 .665*
I7 414 3,062 1,080 .013 -.769 .622*
I8 414 3,003 1,089 -.093 -.796 .590*
I9 414 3,121 1,157 -.121 -.920 .538*
I10 414 3,453 1,158 -.420 -.681 .556*
I11 414 3,328 1,063 -.242 -.637 .690*
I12 414 3,287 1,110 -.346 -.628 .722*
I13 414 3,647 1,072 -.696 -.104 .540*
I14 414 3,724 1,043 -.760 .031 .769*
Tendency scale for technology use in class: Development, reliability and validity 871
Journal of Theory and Practice in Education / Eğitimde Kuram ve Uygulama
Articles /Makaleler - 2014, 10(4): 863-884
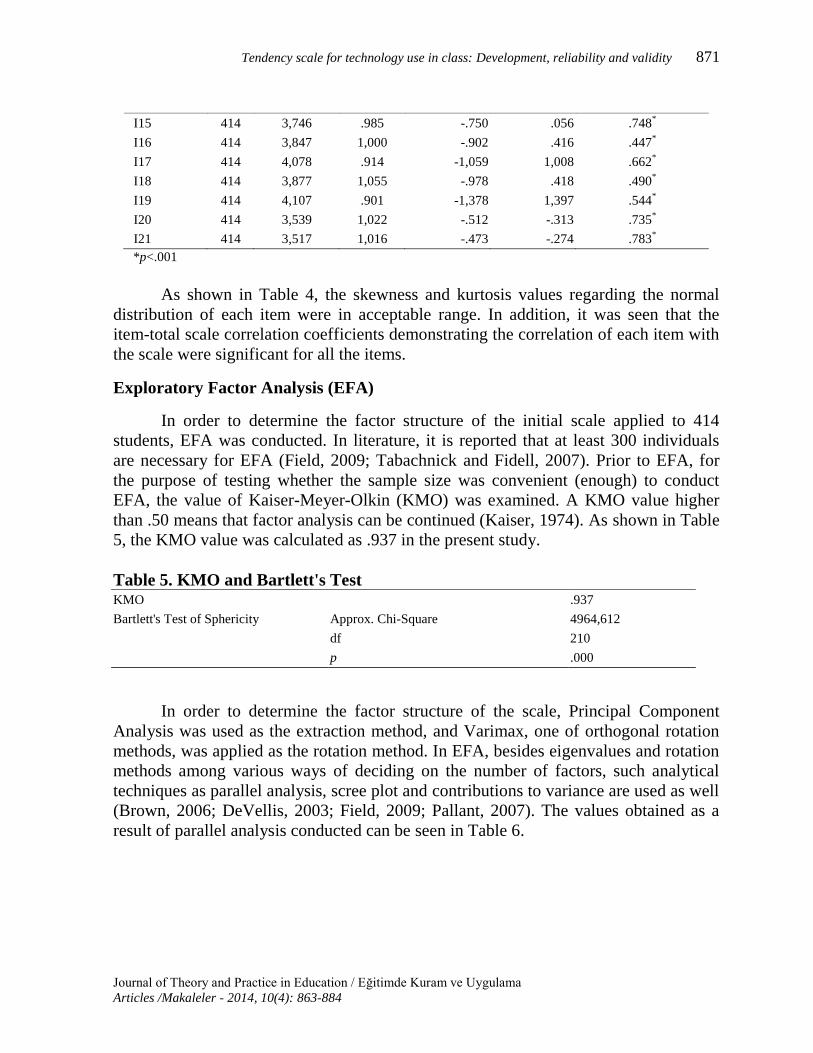
I15 414 3,746 .985 -.750 .056 .748*
I16 414 3,847 1,000 -.902 .416 .447*
I17 414 4,078 .914 -1,059 1,008 .662*
I18 414 3,877 1,055 -.978 .418 .490*
I19 414 4,107 .901 -1,378 1,397 .544*
I20 414 3,539 1,022 -.512 -.313 .735*
I21 414 3,517 1,016 -.473 -.274 .783*
*p<.001
As shown in Table 4, the skewness and kurtosis values regarding the normal
distribution of each item were in acceptable range. In addition, it was seen that the
item-total scale correlation coefficients demonstrating the correlation of each item with
the scale were significant for all the items.
Exploratory Factor Analysis (EFA)
In order to determine the factor structure of the initial scale applied to 414
students, EFA was conducted. In literature, it is reported that at least 300 individuals
are necessary for EFA (Field, 2009; Tabachnick and Fidell, 2007). Prior to EFA, for
the purpose of testing whether the sample size was convenient (enough) to conduct
EFA, the value of Kaiser-Meyer-Olkin (KMO) was examined. A KMO value higher
than .50 means that factor analysis can be continued (Kaiser, 1974). As shown in Table
5, the KMO value was calculated as .937 in the present study.
Table 5. KMO and Bartlett's Test KMO .937
Bartlett's Test of Sphericity Approx. Chi-Square 4964,612
df 210
p .000
In order to determine the factor structure of the scale, Principal Component
Analysis was used as the extraction method, and Varimax, one of orthogonal rotation
methods, was applied as the rotation method. In EFA, besides eigenvalues and rotation
methods among various ways of deciding on the number of factors, such analytical
techniques as parallel analysis, scree plot and contributions to variance are used as well
(Brown, 2006; DeVellis, 2003; Field, 2009; Pallant, 2007). The values obtained as a
result of parallel analysis conducted can be seen in Table 6.
Gunuc & Kuzu 872
© Çanakkale Onsekiz Mart University, Faculty of Education. All rights reserved.
© Çanakkale Onsekiz Mart Üniversitesi, Eğitim Fakültesi. Bütün hakları saklıdır.
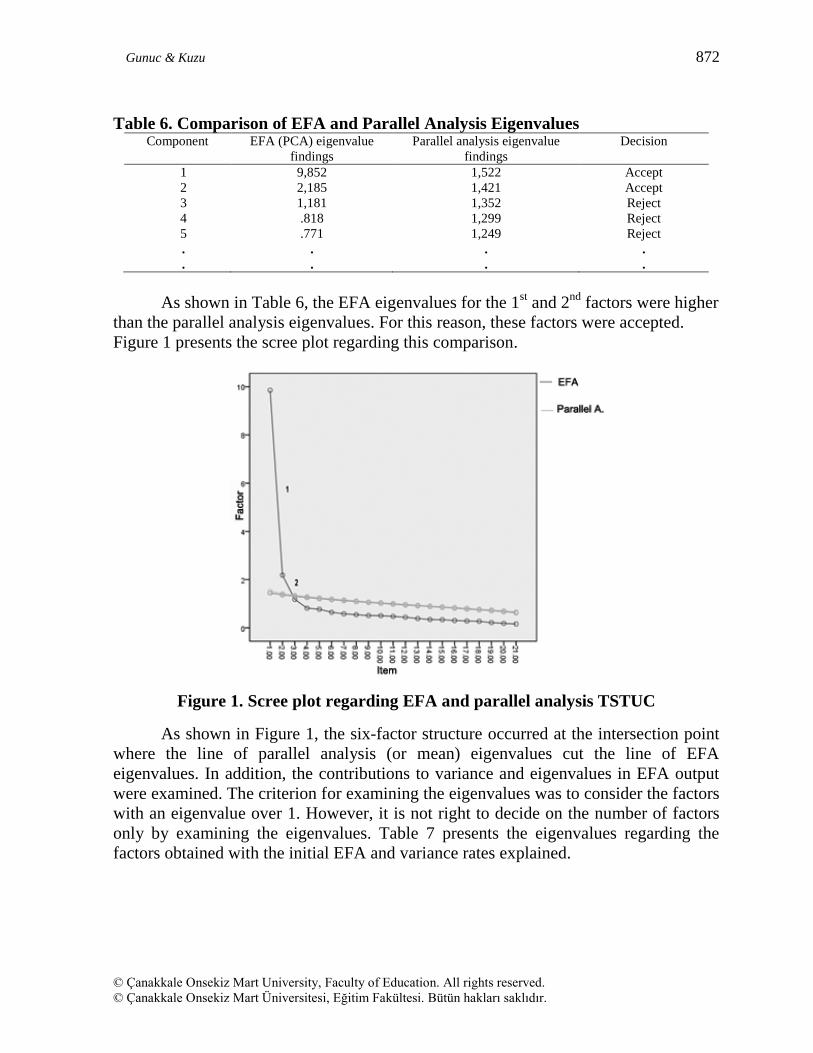
Table 6. Comparison of EFA and Parallel Analysis Eigenvalues Component EFA (PCA) eigenvalue
findings
Parallel analysis eigenvalue
findings
Decision
1 9,852 1,522 Accept
2 2,185 1,421 Accept
3 1,181 1,352 Reject
4 .818 1,299 Reject
5 .771 1,249 Reject
.
.
.
.
.
.
.
.
As shown in Table 6, the EFA eigenvalues for the 1st and 2
nd factors were higher
than the parallel analysis eigenvalues. For this reason, these factors were accepted.
Figure 1 presents the scree plot regarding this comparison.
Figure 1. Scree plot regarding EFA and parallel analysis TSTUC
As shown in Figure 1, the six-factor structure occurred at the intersection point
where the line of parallel analysis (or mean) eigenvalues cut the line of EFA
eigenvalues. In addition, the contributions to variance and eigenvalues in EFA output
were examined. The criterion for examining the eigenvalues was to consider the factors
with an eigenvalue over 1. However, it is not right to decide on the number of factors
only by examining the eigenvalues. Table 7 presents the eigenvalues regarding the
factors obtained with the initial EFA and variance rates explained.

Tendency scale for technology use in class: Development, reliability and validity 873
Journal of Theory and Practice in Education / Eğitimde Kuram ve Uygulama
Articles /Makaleler - 2014, 10(4): 863-884
Table 7. Extraction and Rotation Eigenvalues Regarding EFA
Comp.
Initial Eigenvalues
Extraction Sums of Squared
Loadings Rotation Sums of Squared Loadings
Total
% of
Variance
Cumulati
ve % Total
% of
Variance
Cumulati
ve % Total
% of
Variance
Cumulative
%
1 9,852 46,916 46,916 9,852 46,916 46,916 5,158 24,560 24,560
2 2,185 10,404 57,320 2,185 10,404 57,320 5,150 24,524 49,083
3 1,181 5,622 62,942 1,181 5,622 62,942 2,910 13,859 62,942
4 .818 3,895 66,837
5 .771 3,672 70,509
As shown in Table 7, there were 3 factors with an eigenvalue higher than 1.
However, especially in rotated eigenvalues, an important decrease or difference was
observed after the second factor. Taking all these results, particularly the parallel
analysis results, and the theoretical structure into consideration, the initial TSTUC was
determined to have a two-factor structure. After EFA was determined as a two-factor
structure, the analysis was repeated (Table 8).
Table 8. Extraction and Rotation Eigenvalues Regarding EFA with the Factor
Number Determined
Com.
Initial Eigenvalues
Extraction Sums of Squared
Loadings
Rotation Sums of Squared
Loadings
Total
% of
Variance
Cumulativ
e % Total
% of
Variance
Cumulati
ve %
Total
% of
Variance
Cumulati
ve %
1 9,852 46,916 46,916 9,852 46,916 46,916 6,236 29,696 29,696
2 2,185 10,404 57,320 2,185 10,404 57,320 5,801 27,625 57,320
3 1,181 5,622 62,942
4 .818 3,895 66,837
5 .771 3,672 70,509
As shown in Table 8, the results of EFA revealed that the total variance
explained by the two-factor structure was 57,320%. Table 9 demonstrates the two-
factor structure and the related factor loadings.
Table 9. Rotated Component Matrix Item Dimension 1 2
I8 Emotional .823
I17 Emotional .769
I14 Emotional .756
I19 Emotional .750

Gunuc & Kuzu 874
© Çanakkale Onsekiz Mart University, Faculty of Education. All rights reserved.
© Çanakkale Onsekiz Mart Üniversitesi, Eğitim Fakültesi. Bütün hakları saklıdır.
I1 Emotional .709
I5 Emotional .666
I16 Emotional .660
I15 Emotional .649
I4 Emotional .627
I2 Behavioral .623* .593
*
I10 Emotional .617
I18 Emotional .605
I13 Behavioral .571* .511
*
I6 Behavioral .769
I12 Behavioral .749
I7 Behavioral .743
I3 Emotional .655* .730
*
I9 Emotional .636* .724
*
I21 Emotional .584* .677
*
I11 Behavioral .645
I20 Behavioral .633 * Cross-loading item
The interview and the composition data were evaluated, and it was found out
that the students’ tendencies towards technology were perceived within the scope of
the faculty member’s technology use in class, students’ sharing with their peers and
faculty members via the Internet and students’ use of technology while fulfilling their
course-related responsibilities/assignments. In other words, the students’ technology-
related tendencies could be said to occur within the scope of the faculty member’s
technology use and students’ in-class and out-of-class use of technology. However, the
items and the factor structure obtained as a result of EFA were evaluated by two
experts, and the students’ tendencies towards technology were named as the
dimensions of emotional tendency and behavioral tendency.
The cut-off point for the factor loadings of the items was taken as .40 (Stevens,
2002). As shown in Table 9, the cross-loading problem with I2, I3, I9, I13 and I21 was
found. These five items received values over the cut-off point of .40 factor loading for
both factors, and a difference lower than .10 was found between these values (I2: .623-
.593=.030; I13: .571-.511=.060; I3: .730-.655=.075; I9: .724-.636=.088; I21: .677-
.584=.093; <.10). Thus, the items were excluded from the scale one-by-one starting
from the most cross-loading one. In other words, these items were deleted from the
scale because the cross-loading problem with the remaining items continued. These
items were excluded one by one from the scale. In the process of all these analyses,
considering the theoretical framework and item-item and item-total scale correlations, a
total of 5 items were deleted from the scale. After EFA was completed, it was seen that
the variance explained by the remaining 16 two-factor items was 59,540%.

Tendency scale for technology use in class: Development, reliability and validity 875
Journal of Theory and Practice in Education / Eğitimde Kuram ve Uygulama
Articles /Makaleler - 2014, 10(4): 863-884
Reliability Analysis Findings as a Result of EFA
As a result of EFA, a total of two factors, which were Emotional Tendency and
Behavioral Tendency were obtained, and the total variance explained was calculated as
60%. The Cronbach Alpha (α) internal consistency reliability coefficient for the total-
scale was calculated as α=.930, while it was α=.894 for the factor of Emotional
Tendency and α=.869 for the factor of Behavioral Tendency.
Confirmatory Factor Analysis (CFA)
The SES structure made up of 16 two-factor items obtained via EFA was confirmed
with CFA. As the data set demonstrated a normal distribution, the Maximum
Likelihood Method as the parameter estimation method and Covariance Matix as the
data matrix were used in CFA. As shown in Table 10, as a result of CFA conducted,
the outputs were examined, and primarily the t values, factor loadings and error
variances were evaluated.
Table 10. Item Statistics Regarding the CFA Findings
Item t Factor
loading
Error
variance
Item-Total
Scale cor. (r)
Item-Factor
cor. (r) X sd
Emotional Tendency α= .928
I give more importance to
classes which involve
technology use.
16,56 .78 .40 .712* .753
* 3,967 .968
I want new/different
technologies to be used in
classes.
18,84 .84 .29 .791* .826
* 3,884 1,025
I want technology to be used
more in classes.
13,82 .68 .54 .609* .688
* 4,131 .887
Using technology makes it
easier to do my course-related
responsibilities/assignments.
15,15 .73 .47 .737* .692
* 3,433 1,104
I learn better in classes which
involve technology use.
6,36 .35 .88 .418* .412
* 3,613 1,025
Classes involving technology
use are more entertaining.
19,27 .86 .27 .838* .824
* 3,610 .996
I like communicating with
faculty members via the
Internet.
17,55 .81 .35 .749* .780
* 4,012 .902
Technology use in classes
increases my interest.
7,98 .43 .82 .410* .427
* 3,845 .930
I enjoy learning with
technology.
20,61 .89 .20 .851* .843
* 3,762 .951
I would like technology to be
used in all classes.
19,76 .87 .24 .818* .795
* 3,701 1,027

Gunuc & Kuzu 876
© Çanakkale Onsekiz Mart University, Faculty of Education. All rights reserved.
© Çanakkale Onsekiz Mart Üniversitesi, Eğitim Fakültesi. Bütün hakları saklıdır.
Item t Factor
loading
Error
variance
Item-Total
Scale cor. (r)
Item-Factor
cor. (r) X sd
I like sharing with my
classmates via the Internet.
20,14 .88 .23 .839* .807
* 3,765 1,033
Behavioral Tendency α= .945
I attend classes more which
involve technology use.
19,25 .86 .27 .761* .838
* 3,390 1,098
I am more willing to attend
classes which involve
technology use.
21,83 .92 .15 .838* .877
* 3,467 1,037
I am better prepared for classes
which involve technology use.
22,52 .94 .12 .841* .884
* 3,460 1,077
I am more active in classes
which involve technology use.
21,39 .91 .17 .828* .877
* 3,564 1,033
I follow/listen to classes better
which involve technology use.
16,69 .78 .39 .690* .770
* 3,262 1,100
Scale-Total Reliability α= .953
*p<.001; α= Cronbach’s Alpha
As shown in Table 10, the t value for each item was higher than ±1.96, and the
error variance was lower than .90. The t value for each indicator in the scale is
suggested to be out of the range of ±1.96 (p<.05) (Kline, 2011; Raykov and
Marcoulides, 2006; Tabachnick and Fidell, 2007). Accordingly, it was seen that the
items had a high level of t value and that the error variance was not much high. The
path diagram regarding the model can be seen in Figure 2.

Tendency scale for technology use in class: Development, reliability and validity 877
Journal of Theory and Practice in Education / Eğitimde Kuram ve Uygulama
Articles /Makaleler - 2014, 10(4): 863-884
Figure 2. Standardized path diagram
When the fit indices of the model were taken into consideration, the p level for
the 2 value was examined. If this value is p>.05, then it shows good fit. However, as
this value is likely to be significant (p< .05) for large sizes of samples, it is suggested
that the ratio of 2/df and other fit indices should be evaluated (Tabachnick and Fidell,
2007). The Chi-square value was calculated as 2 = 369,62 and degree of freedom as
df= 100. If this value is lower than 3, then it shows good fit (Tabachnick and Fidell,
2007). In this respect, the ratio of 2/df (1632,57/762) was calculated as 3,69
(acceptable or poor fit). In addition, the other fit indices are presented in Table 11 and
evaluated in line with related literature.
Gunuc & Kuzu 878
© Çanakkale Onsekiz Mart University, Faculty of Education. All rights reserved.
© Çanakkale Onsekiz Mart Üniversitesi, Eğitim Fakültesi. Bütün hakları saklıdır.
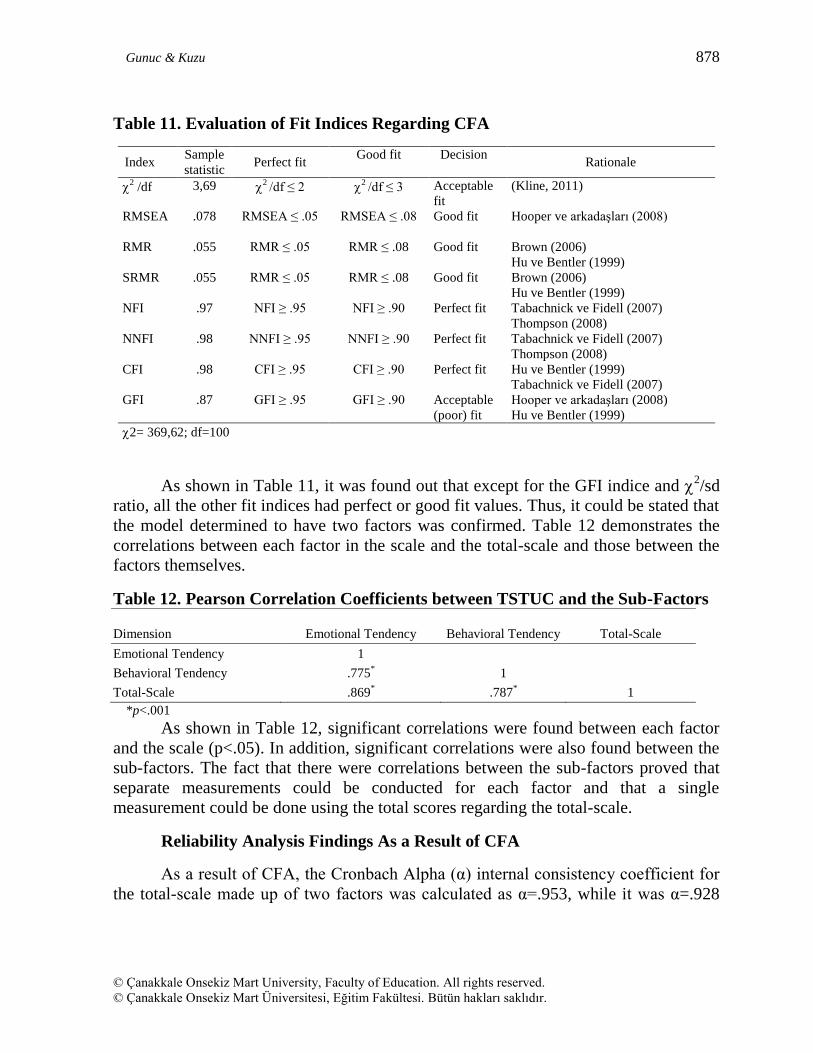
Table 11. Evaluation of Fit Indices Regarding CFA
Index Sample
statistic Perfect fit
Good fit Decision Rationale
2 /df 3,69
2 /df ≤ 2
2 /df ≤ 3 Acceptable
fit
(Kline, 2011)
RMSEA .078 RMSEA ≤ .05 RMSEA ≤ .08 Good fit Hooper ve arkadaşları (2008)
RMR .055 RMR ≤ .05 RMR ≤ .08 Good fit Brown (2006)
Hu ve Bentler (1999)
SRMR .055 RMR ≤ .05 RMR ≤ .08 Good fit Brown (2006)
Hu ve Bentler (1999)
NFI .97 NFI ≥ .95 NFI ≥ .90 Perfect fit Tabachnick ve Fidell (2007)
Thompson (2008)
NNFI .98 NNFI ≥ .95 NNFI ≥ .90 Perfect fit Tabachnick ve Fidell (2007)
Thompson (2008)
CFI .98 CFI ≥ .95 CFI ≥ .90 Perfect fit Hu ve Bentler (1999)
Tabachnick ve Fidell (2007)
GFI .87 GFI ≥ .95 GFI ≥ .90 Acceptable
(poor) fit
Hooper ve arkadaşları (2008)
Hu ve Bentler (1999)
2= 369,62; df=100
As shown in Table 11, it was found out that except for the GFI indice and 2/sd
ratio, all the other fit indices had perfect or good fit values. Thus, it could be stated that
the model determined to have two factors was confirmed. Table 12 demonstrates the
correlations between each factor in the scale and the total-scale and those between the
factors themselves.
Table 12. Pearson Correlation Coefficients between TSTUC and the Sub-Factors
Dimension Emotional Tendency Behavioral Tendency Total-Scale
Emotional Tendency 1
Behavioral Tendency .775* 1
Total-Scale .869* .787
* 1
*p<.001
As shown in Table 12, significant correlations were found between each factor
and the scale (p<.05). In addition, significant correlations were also found between the
sub-factors. The fact that there were correlations between the sub-factors proved that
separate measurements could be conducted for each factor and that a single
measurement could be done using the total scores regarding the total-scale.
Reliability Analysis Findings As a Result of CFA
As a result of CFA, the Cronbach Alpha (α) internal consistency coefficient for
the total-scale made up of two factors was calculated as α=.953, while it was α=.928

Tendency scale for technology use in class: Development, reliability and validity 879
Journal of Theory and Practice in Education / Eğitimde Kuram ve Uygulama
Articles /Makaleler - 2014, 10(4): 863-884
for the factor of Emotional Tendency and α=.945 for the factor of Behavioral
Tendency.
DISCUSSION and CONCLUSIONS
Depending on such a need in related literature, in the present study, a scale was
developed to measure the students’ tendencies towards technology in class. As there is
limited research in literature, the item pool was developed mostly based on the data
collected via the interviews and the written compositions. Regarding TSTUC, EFA and
CFA were conducted with different samples, and a five-point Likert-type scale made
up of 16 items and two factors was developed. As a result of EFA, the factor structures
regarding the scale were confirmed with CFA. The results of the factor analysis
conducted revealed that the factors obtained were related to the dimensions of
emotional tendency and behavioral tendency. The total explained variance for the two
factors of TSTUC was calculated as around 60%. The Cronbach Alpha (α) internal
consistency reliability coefficient of the total scale was calculated as .93 as a result of
EFA and .953 as a result of CFA.
TSTUC was a scale which was related to emotional and behavioral responses
and which aimed at measuring the tendencies towards technology use in class. When
the 16 items obtained as a result of the validity and reliability analyses of the scale
were examined, it was seen that the students’ tendencies occurred within the scope of
the faculty member’s use of technology in class, the students’ sharing with their peers
and faculty members via the Internet and the students’ use of technology while
fulfilling their course-related responsibilities/assignments. While the items were
formed within this scope, it was seen as a result of the examination of the factor
structure that the items belonged to the emotional and behavioral dimensions and that
the factors were named as emotional tendency and behavioral tendency. Depending on
these dimensions, it could be stated that the students developed two types of tendency
towards technology. Using the causal research method, future studies could investigate
whether emotional tendency triggers behavioral tendency or whether emotional
tendency occurs as a result of behavioral tendency. However, it could be stated that
before the development of students’ behavioral tendency, the emotional tendency
should occur as a prerequisite condition, and the causal or path design can be formed
and tested in this way. When the scale items within the scope of the emotional and
behavioral dimensions were examined, it was seen that some of the items especially
within the scope of emotional tendency also included the cognitive process. However,
due to the fact that the cognitive dimension did not occur as a factor and that it is
difficult to define the factor of cognitive tendency and to determine its scope, the
cognitive process was found under the emotional dimension.

Gunuc & Kuzu 880
© Çanakkale Onsekiz Mart University, Faculty of Education. All rights reserved.
© Çanakkale Onsekiz Mart Üniversitesi, Eğitim Fakültesi. Bütün hakları saklıdır.
The analysis of the interview and composition data helped determine the
participants’ preferences and perceptions regarding technology use in instructional
activities. Accordingly, it was seen that what the participants perceived regarding the
concept of “technology use” was “the faculty member’s use of technology in class”.
Therefore, while generating the item pool, especially the students’ perceptions and the
meanings they thought the concepts conveyed were taken into consideration. In
addition, although the statements in the scale were related to technology use, the
comparative structures (-er, more) included in the statements allowed the students to
respond to the scale by making comparisons between the classes which involved
technology use and those which did not. Higher scores to be produced by TSTUC refer
to the fact that there is a higher tendency towards technology use in classes or that
technology use is favored more by students in classes; and lower scores refer to the fact
that there is a lower level of tendency towards technology use in classes or that
students do not prefer (or give much importance to) technology use in classes at all.
According to the results, as each factor correlated significantly with each other as well
as with the total scale, measurements can be done by using the total scores related to
each factor or by using the total scores regarding the total scale. Consequently, a scale
with a good level of validity-reliability was obtained.
Certain issues regarding the structure of the measurement tool developed in the
study should be taken into consideration. In this respect, one important point to be
considered is the fact that TSTUC does not have any measurement purpose for
effective technology integration. In other words, while effective technology integration
may increase students’ tendency towards technology use, the faculty member’s
incompetency in technology integration is likely to change students’ perceptions. In
this case, TSTUC aims at measuring students’ tendency that occurs as a result of their
perceptions. Lower scores to be received from TSTUC could not only indicate that
students have negative attitudes towards technology use in class or that they do not
give importance to technology use in class but also demonstrate that the technology
currently in use has not been effectively integrated. Therefore, in cases of low tendency
scores, it is also necessary to examine the causes of these low scores. However, for
individual reasons or without considering the technology integration factor, this scale
focuses on whether, in both cases, students have tendency towards the use of
technology in class or not. On the other hand, effective integration of technology into
education could contribute to students’ tendencies towards technology use.
Another point regarding the limitations of TSTUC was the fact that the
technologies used in class were examined in general. Thus, it could be stated that
students may give more positive responses to the use of technologies or environments
they like while they may fail to give detailed response to technology use in general. For
instance, not all students may have a positive tendency towards the use of Twitter
technology in class. Therefore, only the students who like using Twitter or those who
have experience in Twitter are likely to have increased tendencies (Welch and Bonnan-

Tendency scale for technology use in class: Development, reliability and validity 881
Journal of Theory and Practice in Education / Eğitimde Kuram ve Uygulama
Articles /Makaleler - 2014, 10(4): 863-884
White, 2012). However, in this study, no discrimination was made between the
technologies liked or those disliked, and individual differences were thus ignored. For
this reason, future studies could focus on students’ tendencies towards the technologies
they like as well as on the role and influence of effective technology integration on
technology use in class.
REFERENCES
Allison, B. and Rehm, M. (2007). Effective teaching strategies for middle school
learners in multicultural, multilingual classrooms. Middle School Journal,
39(2), 12-18.
Brown, J. (2000). Growing up digital: How the web changes work, education, and the
way people learn. Journal of the United States Distance Learning Association,
16(2), 31-36.
Brown, T. A. (2006). Confirmatory factor analysis for applied research. NY: Guilford
Publications, Inc.
DeVellis, R.F. (2003). Scale development: Theory and applications (2. ed.). Sage.
DeWitt, D. and Siraj, S. (2010). Learners’ perceptions of technology for design of a
collaborative m-learning module. World Journal on Educational Technology,
2(3), 169-185.
Doppelt, Y. (2006). Teachers’ and pupils’ perceptions of science–technology learning
environments. Learning Environ Res, 9, 163–178.
Field, A. P. (2009). Discovering statistics using SPSS: And sex and drugs and rock ‘n’
roll (3. ed.). London: Sage Publications.
Frand, J. L. (2000). The ınformation-age mindset: changes in students and implications
for higher education. Educause Review, 35(5), 14-24.
Fredricks, J. A., Blumenfeld, P.C. and Paris, A.H. (2004). School engagement:
Potential of the concept, state of the evidence. Review of Educational Research,
74(1), 59-109.
Gibbs, R and Poskitt, J. (2010). Student engagement in the middle years of schooling
(years 7-10): A literature review. Wellington: Ministry of Education.
Golubski, P. M. (2012). Utilizing Interactive Technologies to Engage, Integrate,
Involve, and Increase Community amongst College Students. V. Wang, L.
Farmer, J. Parker, and P. Golubski (Eds.) In Pedagogical and Andragogical
Teaching and Learning with Information Communication Technologies (pp.13-
27). Hershey, PA: Information Science Publishing.
Gunuc, S. (2013). Determining the role of technology in student engagement and
examining of the relationships between student engagement and technology use
in class. Unpublished doctoral dissertation, The Graduate School of Educational
Sciences, Anadolu University, Turkey.

Gunuc & Kuzu 882
© Çanakkale Onsekiz Mart University, Faculty of Education. All rights reserved.
© Çanakkale Onsekiz Mart Üniversitesi, Eğitim Fakültesi. Bütün hakları saklıdır.
Hooper, D., Coughlan, J. and Mullen, M. (2008). Structural equation modelling:
guidelines for determining model fit. Th Electronic Journal of Business
Research Methods, 6(1), 53-60.
Hu, L.T. and Bentler, P.M. (1999), Cutoff criteria for fit indexes in covariance
structure analysis: conventional criteria versus new alternatives. Structural
Equation Modeling, 6(1), 1-55.
Huck, S. (2012). Reading statistics and research (6. ed.). Boston: Pearson.
Hussain, I. and Safdar, M. (2008). Role of information technologies in teaching
learning process: perception of the faculty. Turkish Online Journal of Distance
Education – TOJDE, 9(2), 46-56.
Hutcheson, G. D. and Sofroniou, N. (1999). The multivariate social scientist: An
introduction to generalized linear models. Sage Publications.
Jukes, I. and Dosaj, A. (2003). The differences between digital native learners and
digital immigrant teachers. The InfoSavvy Group, 12.01.2013
http://www.apple.com/au/education/digitalkids/disconnect/landscape.html
adresinden elde edilmiştir.
Kaiser, H. F. (1974). An index of factorial simplicity. Psychometrika, 39, 31-36.
Kline, R. B. (2011). Principles and practice of structural equation modeling (3.ed.).
New York: The Guilford Press.
Kline, R. B. (2009). Becoming a behavioral science researcher: A guide to producing
research that matters. New York: GuildfordPress.
Kolikant, Y.B.D. (2009). Digital students in a book-oriented school: Students’
perceptions of school and the usability of digital technology in schools.
Educational Technology & Society, 12(2), 131-143.
Kolikant, Y.B.D. (2010). Digital natives, better learners? Students’ beliefs about how
the Internet influenced their ability to learn. Computers in Human Behavior, 26,
1384-1391.
Krause, K. and Coates, H. (2008). Students’ engagement in first-year university.
Assessment and Evaluation in Higher Education, 33(5), 493-505.
Kvavik, R. B., Caruso, J. B. and Morgan, G. (2004). ECAR study of students and
information technology 2004: convenience, connection, and control. Boulder,
CO: EDUCAUSE Center for Applied Research.
Liburd, J.J. and Christensen, I. F. (2013). Using web 2.0 in higher tourism education.
Journal of Hospitality, Leisure, Sport and Tourism Education,12(1), 99-108.
Margaryan, A., Littlejohn, A. and Vojt, G. (2011). Are digital natives a myth or
reality? University students’ use of digital Technologies. Computers &
Education, 56, 429-440.
Marzilli, C., Delello, J., Marmion, S., McWhorter, R., Roberts, P. and Marzilli, T. S.
(2014). Faculty attitudes towards integrating technology and innovation.
International Journal on Integrating Technology in Innovation, 3(1).

Tendency scale for technology use in class: Development, reliability and validity 883
Journal of Theory and Practice in Education / Eğitimde Kuram ve Uygulama
Articles /Makaleler - 2014, 10(4): 863-884
McMahon, M. and Pospisil, R. (2005). Laptops for a digital lifestyle: Millennial
students and wireless mobile technologies. Proceedings of ASCILITE 2005.
Naish, R. (2008). The digital ages of man. E-learning Age, ABI/FORM Global, 10-11.
Nelson Laird, T. F. and Kuh, G. D. (2005). Student experiences with information
technology and their relationship to other aspects of student
engagement. Research in Higher Education, 46(2), 211-233.
Oblinger, D. and Oblinger, J. (2005). Is it age or IT: First steps towards understanding
the net generation. D. Oblinger and J. Oblinger (Eds.). In Educating the Net
Generation (pp.2.1–2.20). Boulder, CO: EDUCAUSE.
Palfrey, J. and Gasser, U. (2008). Born digital: Understanding the first generation of
digital natives. NY: Basic Books.
Pallant, J. (2007). SPSS survival manual: A step by step guide to data analysis using
SPSS for Windows. Maidenhead: Open University Press.
Parker, R. E., Bianchi, A., ve Cheah, T. Y. (2008). Perceptions of Instructional
Technology: Factors of Influence and Anticipated Consequences. Educational
Technology & Society, 11(2), 274-293.
Pedró, F. (2006). The new millennium learners: Challenging our views on ICT and
learning. Paris: OECD-CERI.
Pickens, M. and Eick, C. (2009). Studying motivational strategies used by two
teachers in differently tracked science courses. The Journal of Educational
Research, 102(5), 349-362.
Prensky, M. (2001). Digital natives, digital immigrants. On the Horizon, 9(5), 1-5.
Prensky, M. (2004). The emerging online life of the digital native: What they do
differently because of technology, and how they do it. Aralık 03, 2010 tarihinde
http://www.marcprensky.com/writing/Prensky-
The_Emerging_Online_Life_of_the_Digital_ Native-03.pdf adresinden
alınmıştır.
Raykov, T. and Marcoulides, G.A. (2006). A first course in structural equation
modeling (2. ed.). Lawrence Erlbaum Associates, Inc: Publishers.
Reynolds, S, ve Rucker, J. 2002. “Technology, methodology, and business education.”
National Business Year Book (number 4), NBEA Association Publishers.
Sheard, J., Carbone, A. and Hurst, A.J. (2010). Student engagement in first year of an
ICT degree: staff and student perceptions. Computer Science Education, 20(1),
1-16.
Stevens, J. P. (2002). Applied multivariate statistics for the social sciences (4. ed.).
Hillsdale, NJ: Erlbaum.
Tabachnick, G. G. and Fidell, L. S. (2007). Experimental designs using ANOVA.
Belmont, CA: Duxbury.
Teo, T. and Zhou, M. (2014). Explaining the intention to use technology among
university students: a structural equation modeling approach. Journal of
Computing In Higher Education, 26(2), 124-143.

Gunuc & Kuzu 884
© Çanakkale Onsekiz Mart University, Faculty of Education. All rights reserved.
© Çanakkale Onsekiz Mart Üniversitesi, Eğitim Fakültesi. Bütün hakları saklıdır.
Thompson, B. (2008). Exploratory and confirmatory factor analysis: Understanding
concepts and applications (3. Ed.). Washington, DC: American Psychological
Association.
Waycott, J., Bennett, S., Kennedy, G., Dalgarno, B. and Gray, K. (2010). Digital
divides Student and staff perceptions of information and communication
Technologies. Computers & Education, 54, 1202–1211.
Weiß, S. and Bader, H. J. (2010). How to improve media literacy and media skills of
secondary school teachers in order to prepare them for the next generation of
learners: A new type of in-service training for teachers. M. Ebner and M.
Schiefner (Eds.), Looking toward the future of technology-enhanced education:
ubiquitous learning and the digital native İçinde (pp.37-54). Hershey. PA:
Information Science Reference.
Welch, B.K. and Bonnan-White, J. (2012). Twittering to increase student engagement
in the university classroom. Knowledge Management & E-Learning: An
International Journal, 4(3), 325-345.
Wong, K.T., Teo, T. and Russo, S. (2013). Interactive whiteboard acceptance:
Applicability of the UTAUT model among student teachers. The Asia Pacific
Education Researcher, 22(1), 1-10.
Yazzie-Mintz, E. (2010). Charting the path from engage-ment to achievement: A
report on the 2009 High School Survey of Student Engagement. Bloomington,
IN: Center for Evaluation & Education Policy.