tensile shear strength of laser welded lap jointsfig. 4 deformation of lap joint under tensile shear...
TRANSCRIPT
NIPPON STEEL TECHNICAL REPORT No. 95 January 2007
- 28 -
UDC 621 . 791 . 9 . 052 . 2 : 539 . 415
Tensile Shear Strength of Laser Welded Lap JointsYasunobu MIYAZAKI*1 Seiji FURUSAKO*2
Abstract
The dependency of fracture position and maximum load of laser welded lap joints
on the weld-bead length and width was clarified through tensile shear test of joints,
and a mechanical prediction model for the test results was developed. Joints showed
the strength proportional to base metal tensile strength, which have the weld length
over 60% of specimen width or the weld width of 2 times of sheet thickness. The
developed model, which considers a joint dividing it into the base metal under uniaxial
tensile stress, a portion R under stretch bending and the weld metal under shear
stress, proved capable of qualitatively predicting the fracture behavior of laser welded
lap joints of mild steel sheets at tensile shear test.
1. IntroductionResistance spot welding has long been employed as a principal
welding method for assembling automobile bodies, but somecarmakers, mainly in Europe, recently use laser welding in place ofresistance spot welding1,2). Laser welding is a non-contact weldingmethod and capable of joining materials by one-side access. Whilethe European carmakers reportedly find laser welding economicallyadvantageous because the electrode wear of spot welding can beavoided, they do not seem to fully enjoy the benefits of laser weldingsuch as easy connection of hydro-forming parts and other closed-section components and higher joint strength due to continuouswelding. A reason for this is presumably that the application of laserwelding is generally limited to those portions where spot weldingcan be used as a backup in the case of a trouble with laser welding,and another is that the advantages of continuous welding by laser arenot very clear.
Furthermore, unlike spot-welding joints, laser-welding joints arenot axisymmetric, and many variables such as weld length, bead widthand welding direction affect the strength of a joint of laser welding,and for this reason, the withstand load of a laser-welding joint hasnot been clear. In view of this, the authors already proposed a methodfor estimating the strength of laser welded lap joints3). In the presentstudy, the authors partially reviewed the regression analysis employedfor the estimation, and attempted to express the relationship betweenthe size of a weld bead and joint strength in a simplified manner.
2. Shear Strength of Laser Welded Lap Joints2.1 Experimental procedure
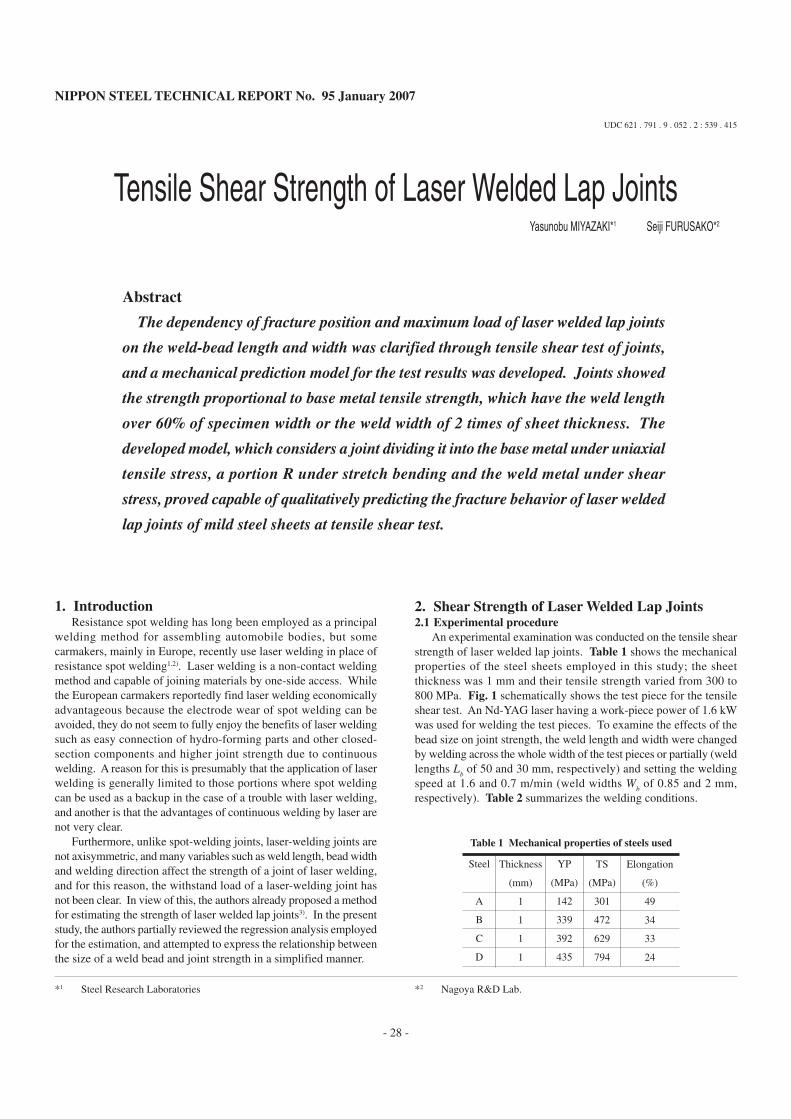
An experimental examination was conducted on the tensile shearstrength of laser welded lap joints. Table 1 shows the mechanicalproperties of the steel sheets employed in this study; the sheetthickness was 1 mm and their tensile strength varied from 300 to800 MPa. Fig. 1 schematically shows the test piece for the tensileshear test. An Nd-YAG laser having a work-piece power of 1.6 kWwas used for welding the test pieces. To examine the effects of thebead size on joint strength, the weld length and width were changedby welding across the whole width of the test pieces or partially (weldlengths L
b of 50 and 30 mm, respectively) and setting the welding
speed at 1.6 and 0.7 m/min (weld widths Wb of 0.85 and 2 mm,
respectively). Table 2 summarizes the welding conditions.
*1 Steel Research Laboratories *2 Nagoya R&D Lab.
Table 1 Mechanical properties of steels used
Steel
A
B
C
D
Thickness
(mm)
1
1
1
1
YP
(MPa)
142
339
392
435
TS
(MPa)
301
472
629
794
Elongation
(%)
49
34
33
24
NIPPON STEEL TECHNICAL REPORT No. 95 January 2007
- 29 -
The tensile shear test was conducted at room temperature and ata constant tension speed of 10 mm/min, and the maximum withstandload of each weld joint was measured. To examine the deformationof the test pieces, some of them were loaded to withstand load, theload was removed before failure, and the deformation around theweld joint was recorded through sectional observation.2.2 Tensile test results
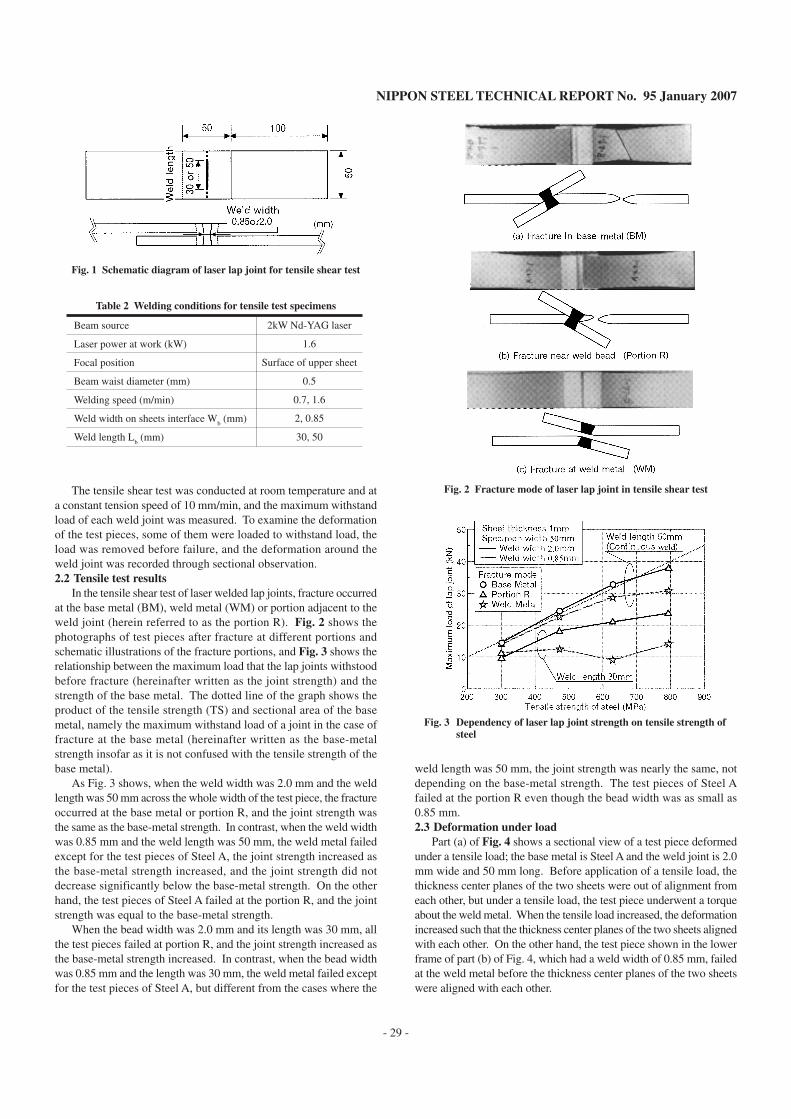
In the tensile shear test of laser welded lap joints, fracture occurredat the base metal (BM), weld metal (WM) or portion adjacent to theweld joint (herein referred to as the portion R). Fig. 2 shows thephotographs of test pieces after fracture at different portions andschematic illustrations of the fracture portions, and Fig. 3 shows therelationship between the maximum load that the lap joints withstoodbefore fracture (hereinafter written as the joint strength) and thestrength of the base metal. The dotted line of the graph shows theproduct of the tensile strength (TS) and sectional area of the basemetal, namely the maximum withstand load of a joint in the case offracture at the base metal (hereinafter written as the base-metalstrength insofar as it is not confused with the tensile strength of thebase metal).
As Fig. 3 shows, when the weld width was 2.0 mm and the weldlength was 50 mm across the whole width of the test piece, the fractureoccurred at the base metal or portion R, and the joint strength wasthe same as the base-metal strength. In contrast, when the weld widthwas 0.85 mm and the weld length was 50 mm, the weld metal failedexcept for the test pieces of Steel A, the joint strength increased asthe base-metal strength increased, and the joint strength did notdecrease significantly below the base-metal strength. On the otherhand, the test pieces of Steel A failed at the portion R, and the jointstrength was equal to the base-metal strength.
When the bead width was 2.0 mm and its length was 30 mm, allthe test pieces failed at portion R, and the joint strength increased asthe base-metal strength increased. In contrast, when the bead widthwas 0.85 mm and the length was 30 mm, the weld metal failed exceptfor the test pieces of Steel A, but different from the cases where the
weld length was 50 mm, the joint strength was nearly the same, notdepending on the base-metal strength. The test pieces of Steel Afailed at the portion R even though the bead width was as small as0.85 mm.2.3 Deformation under load
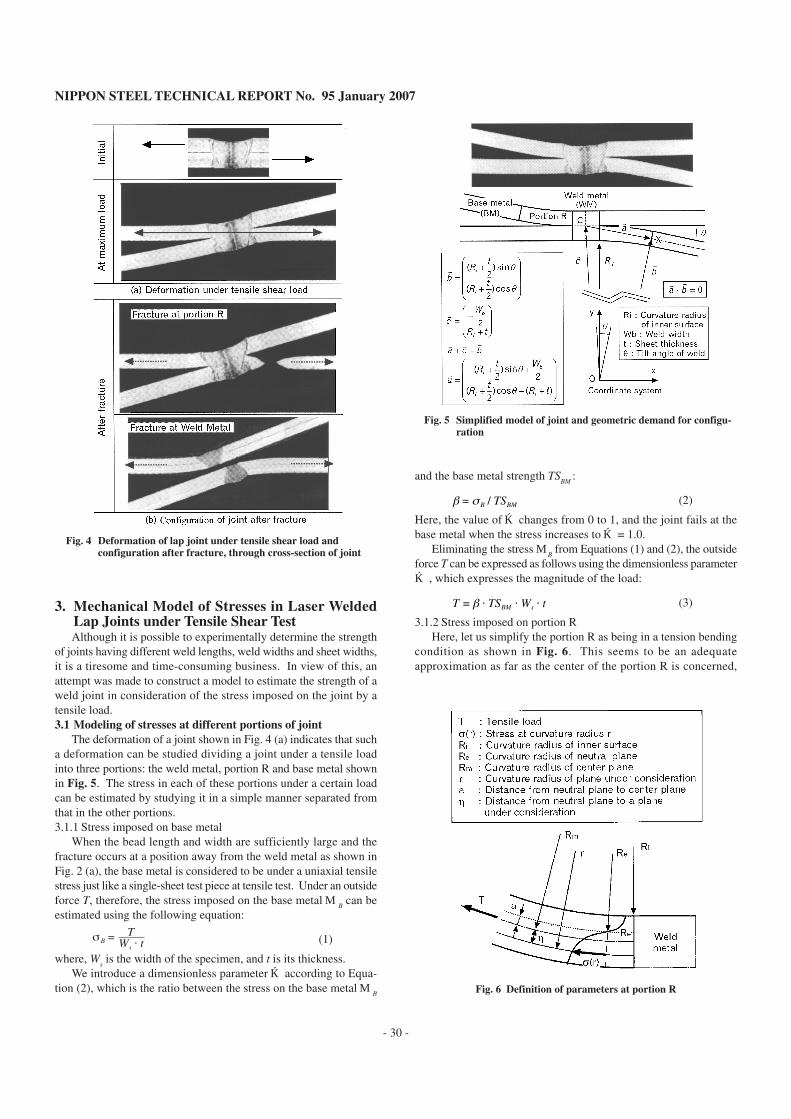
Part (a) of Fig. 4 shows a sectional view of a test piece deformedunder a tensile load; the base metal is Steel A and the weld joint is 2.0mm wide and 50 mm long. Before application of a tensile load, thethickness center planes of the two sheets were out of alignment fromeach other, but under a tensile load, the test piece underwent a torqueabout the weld metal. When the tensile load increased, the deformationincreased such that the thickness center planes of the two sheets alignedwith each other. On the other hand, the test piece shown in the lowerframe of part (b) of Fig. 4, which had a weld width of 0.85 mm, failedat the weld metal before the thickness center planes of the two sheetswere aligned with each other.
Fig. 1 Schematic diagram of laser lap joint for tensile shear test
Table 2 Welding conditions for tensile test specimens
Beam source
Laser power at work (kW)
Focal position
Beam waist diameter (mm)
Welding speed (m/min)
Weld width on sheets interface Wb (mm)
Weld length Lb (mm)
2kW Nd-YAG laser
1.6
Surface of upper sheet
0.5
0.7, 1.6
2, 0.85
30, 50
Fig. 2 Fracture mode of laser lap joint in tensile shear test
Fig. 3 Dependency of laser lap joint strength on tensile strength ofsteel
NIPPON STEEL TECHNICAL REPORT No. 95 January 2007
- 30 -
3. Mechanical Model of Stresses in Laser WeldedLap Joints under Tensile Shear TestAlthough it is possible to experimentally determine the strength
of joints having different weld lengths, weld widths and sheet widths,it is a tiresome and time-consuming business. In view of this, anattempt was made to construct a model to estimate the strength of aweld joint in consideration of the stress imposed on the joint by atensile load.3.1 Modeling of stresses at different portions of joint
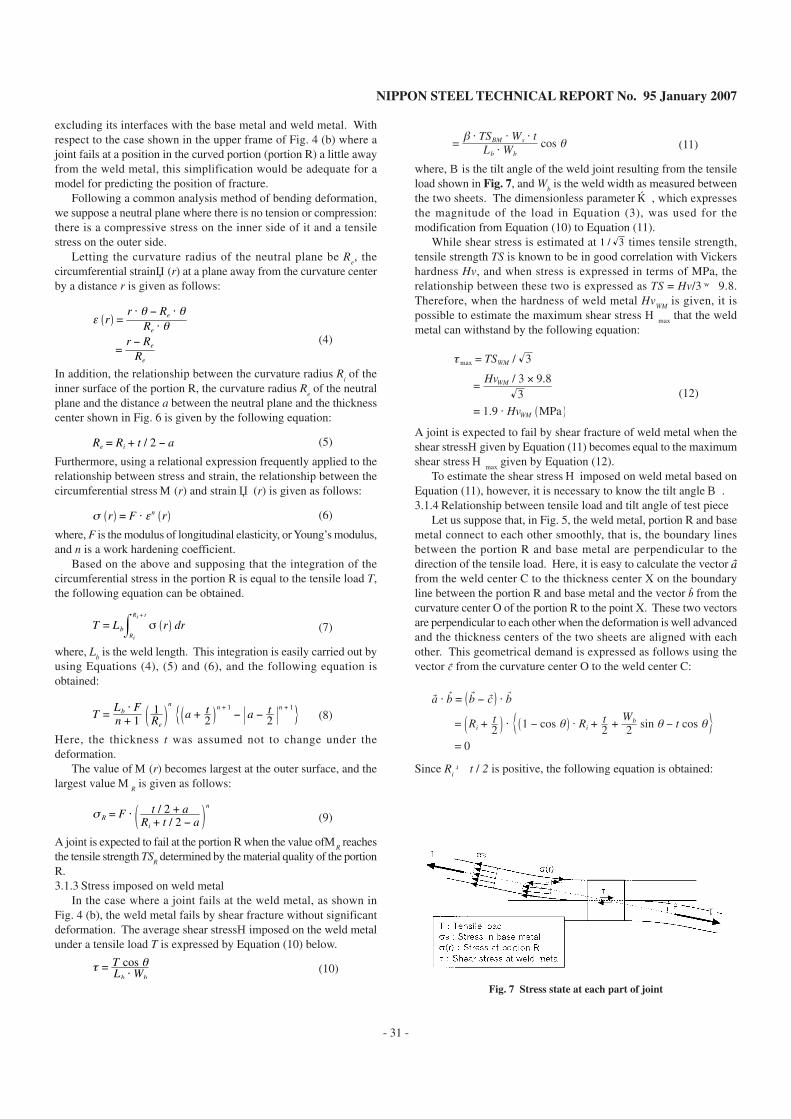
The deformation of a joint shown in Fig. 4 (a) indicates that sucha deformation can be studied dividing a joint under a tensile loadinto three portions: the weld metal, portion R and base metal shownin Fig. 5. The stress in each of these portions under a certain loadcan be estimated by studying it in a simple manner separated fromthat in the other portions.3.1.1 Stress imposed on base metal
When the bead length and width are sufficiently large and thefracture occurs at a position away from the weld metal as shown inFig. 2 (a), the base metal is considered to be under a uniaxial tensilestress just like a single-sheet test piece at tensile test. Under an outsideforce T, therefore, the stress imposed on the base metalσ
B can be
estimated using the following equation:
σB = TWs ⋅ t (1)
where, Ws is the width of the specimen, and t is its thickness.
We introduce a dimensionless parameterβ according to Equa-tion (2), which is the ratio between the stress on the base metalσ
B
and the base metal strength TSBM
:
β = σ B / TSBM (2)
Here, the value ofβ changes from 0 to 1, and the joint fails at thebase metal when the stress increases toβ = 1.0.
Eliminating the stress σB from Equations (1) and (2), the outside
force T can be expressed as follows using the dimensionless parameterβ , which expresses the magnitude of the load:
T = β ⋅ TSBM ⋅ Ws ⋅ t (3)
3.1.2 Stress imposed on portion RHere, let us simplify the portion R as being in a tension bending
condition as shown in Fig. 6. This seems to be an adequateapproximation as far as the center of the portion R is concerned,
Fig. 4 Deformation of lap joint under tensile shear load andconfiguration after fracture, through cross-section of joint
Fig. 5 Simplified model of joint and geometric demand for configu-ration
Fig. 6 Definition of parameters at portion R
NIPPON STEEL TECHNICAL REPORT No. 95 January 2007
- 31 -
excluding its interfaces with the base metal and weld metal. Withrespect to the case shown in the upper frame of Fig. 4 (b) where ajoint fails at a position in the curved portion (portion R) a little awayfrom the weld metal, this simplification would be adequate for amodel for predicting the position of fracture.
Following a common analysis method of bending deformation,we suppose a neutral plane where there is no tension or compression:there is a compressive stress on the inner side of it and a tensilestress on the outer side.
Letting the curvature radius of the neutral plane be Re, the
circumferential strainε(r) at a plane away from the curvature centerby a distance r is given as follows:
ε r =r ⋅ θ − Re ⋅ θ
Re ⋅ θ
=r − Re
Re
(4)
In addition, the relationship between the curvature radius Ri of the
inner surface of the portion R, the curvature radius Re of the neutral
plane and the distance a between the neutral plane and the thicknesscenter shown in Fig. 6 is given by the following equation:
Re = Ri + t / 2 − a (5)
Furthermore, using a relational expression frequently applied to therelationship between stress and strain, the relationship between thecircumferential stressσ (r) and strainε (r) is given as follows:
σ r = F ⋅ εn r (6)
where, F is the modulus of longitudinal elasticity, or Young’s modulus,and n is a work hardening coefficient.
Based on the above and supposing that the integration of thecircumferential stress in the portion R is equal to the tensile load T,the following equation can be obtained.
T = Lb σ r drRi
Ri + t
(7)
where, Lb is the weld length. This integration is easily carried out by
using Equations (4), (5) and (6), and the following equation isobtained:
T =Lb ⋅ Fn + 1
1Re
n
a + t2
n + 1− a − t
2n + 1
(8)
Here, the thickness t was assumed not to change under thedeformation.
The value ofσ (r) becomes largest at the outer surface, and thelargest valueσ
R is given as follows:
σ R = F ⋅ t / 2 + aRi + t / 2 − a
n
(9)
A joint is expected to fail at the portion R when the value ofσR reaches
the tensile strength TSR determined by the material quality of the portion
R.3.1.3 Stress imposed on weld metal
In the case where a joint fails at the weld metal, as shown inFig. 4 (b), the weld metal fails by shear fracture without significantdeformation. The average shear stressτimposed on the weld metalunder a tensile load T is expressed by Equation (10) below.
τ = T cos θLb ⋅ Wb
(10)
=β ⋅ TSBM ⋅ Ws ⋅ t
Lb ⋅ Wbcos θ (11)
where, θis the tilt angle of the weld joint resulting from the tensileload shown in Fig. 7, and W
b is the weld width as measured between
the two sheets. The dimensionless parameterβ , which expressesthe magnitude of the load in Equation (3), was used for themodification from Equation (10) to Equation (11).
While shear stress is estimated at 1 / 3 times tensile strength,tensile strength TS is known to be in good correlation with Vickershardness Hv, and when stress is expressed in terms of MPa, therelationship between these two is expressed as TS = Hv/3× 9.8.Therefore, when the hardness of weld metal Hv
WM is given, it is
possible to estimate the maximum shear stress τmax
that the weldmetal can withstand by the following equation:
τ max = TSWM / 3
=HvWM / 3 × 9.8
3
= 1.9 ⋅ HvWM MPa
(12)
A joint is expected to fail by shear fracture of weld metal when theshear stressτgiven by Equation (11) becomes equal to the maximumshear stressτ
max given by Equation (12).
To estimate the shear stressτ imposed on weld metal based onEquation (11), however, it is necessary to know the tilt angleθ .3.1.4 Relationship between tensile load and tilt angle of test piece
Let us suppose that, in Fig. 5, the weld metal, portion R and basemetal connect to each other smoothly, that is, the boundary linesbetween the portion R and base metal are perpendicular to thedirection of the tensile load. Here, it is easy to calculate the vector afrom the weld center C to the thickness center X on the boundaryline between the portion R and base metal and the vector b from thecurvature center O of the portion R to the point X. These two vectorsare perpendicular to each other when the deformation is well advancedand the thickness centers of the two sheets are aligned with eachother. This geometrical demand is expressed as follows using thevector c from the curvature center O to the weld center C:
a ⋅ b = b − c ⋅ b
= Ri + t2 ⋅ 1 − cos θ ⋅ Ri + t
2 +Wb
2 sin θ − t cos θ
= 0
Since Ri+ t / 2 is positive, the following equation is obtained:
Fig. 7 Stress state at each part of joint
NIPPON STEEL TECHNICAL REPORT No. 95 January 2007
- 32 -
Ri =t cos θ − t
2 −Wb
2 sin θ
1 − cos θ(13)
As is clear from Equation (13), the larger the weld width Wb, the smaller
the curvature radius Ri is expected, with the same tilt angleθ .
Laser welded lap joints of the steels shown in Table 1 weresubjected to tensile test, applied a tensile load to cause a sufficientlylarge rotational deformation, removed the load, and measured R
i and
θ through sectional observation. The relationship between thesetwo is plotted in Fig. 8. The curves in the graph are the relationshipbetween the two calculated from Equation (13). It is clear from thegraph that the experimentally obtained relationship between R
i and
θ agrees well with that calculated from Equation (13), whichrepresents the geometric demand.
Next, it is necessary to calculate the relationship of the tensile loadT with the curvature radius R
i or the tilt angleθ. Furusako et al. used
the dimensionless parameterβ for the tensile load and conductedregression analysis as follows3):
Ri = 147.84 − 147.93βWs
Lb W b0.2 (14)
Here, it is impossible to obtainθ in the form of a function of Ri
from Equation (13), and it will be rather troublesome to determineθwith respect to the value of R
i determined from Equation (14). In
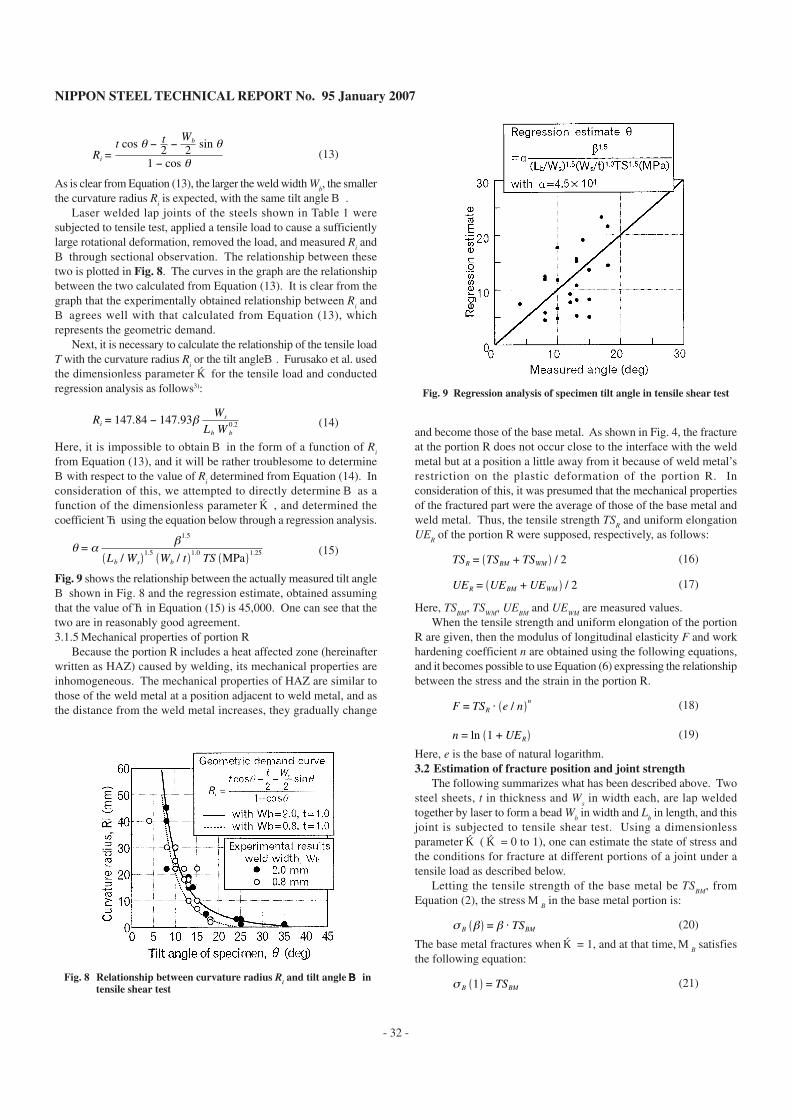
consideration of this, we attempted to directly determineθ as afunction of the dimensionless parameterβ , and determined thecoefficient α using the equation below through a regression analysis.
θ = αβ 1.5
Lb / Ws1.5
Wb / t1.0
TS MPa1.25 (15)
Fig. 9 shows the relationship between the actually measured tilt angleθ shown in Fig. 8 and the regression estimate, obtained assumingthat the value ofα in Equation (15) is 45,000. One can see that thetwo are in reasonably good agreement.3.1.5 Mechanical properties of portion R
Because the portion R includes a heat affected zone (hereinafterwritten as HAZ) caused by welding, its mechanical properties areinhomogeneous. The mechanical properties of HAZ are similar tothose of the weld metal at a position adjacent to weld metal, and asthe distance from the weld metal increases, they gradually change
and become those of the base metal. As shown in Fig. 4, the fractureat the portion R does not occur close to the interface with the weldmetal but at a position a little away from it because of weld metal’srestriction on the plastic deformation of the portion R. Inconsideration of this, it was presumed that the mechanical propertiesof the fractured part were the average of those of the base metal andweld metal. Thus, the tensile strength TS
R and uniform elongation
UER of the portion R were supposed, respectively, as follows:
TSR = TSBM + TSWM / 2 (16)
UER = UEBM + UEWM / 2 (17)
Here, TSBM
, TSWM
, UEBM
and UEWM
are measured values.When the tensile strength and uniform elongation of the portion
R are given, then the modulus of longitudinal elasticity F and workhardening coefficient n are obtained using the following equations,and it becomes possible to use Equation (6) expressing the relationshipbetween the stress and the strain in the portion R.
F = TSR ⋅ e / nn (18)
n = ln 1 + UER (19)
Here, e is the base of natural logarithm.3.2 Estimation of fracture position and joint strength
The following summarizes what has been described above. Twosteel sheets, t in thickness and W
s in width each, are lap welded
together by laser to form a bead Wb in width and L
b in length, and this
joint is subjected to tensile shear test. Using a dimensionlessparameterβ (β = 0 to 1), one can estimate the state of stress andthe conditions for fracture at different portions of a joint under atensile load as described below.
Letting the tensile strength of the base metal be TSBM
, fromEquation (2), the stressσ
B in the base metal portion is:
σ B β = β ⋅ TSBM (20)
The base metal fractures whenβ = 1, and at that time,σB satisfies
the following equation:
σ B 1 = TSBM (21)Fig. 8 Relationship between curvature radius Ri and tilt angleθθθθθ in
tensile shear test
Fig. 9 Regression analysis of specimen tilt angle in tensile shear test
NIPPON STEEL TECHNICAL REPORT No. 95 January 2007
- 33 -
Fig. 10 Estimation procedure for fracture portion and maximum load
When the modulus of longitudinal elasticity F, work hardeningcoefficient n and tensile strength TS
R of the portion R are obtained
using Equations (16) to (19), the stress at the outer surface of theportion R can be determined by Equation (22) below, which isobtained from Equation (9).
σ R β = F ⋅t / 2 + a β
Ri β + t / 2 − a β
n
(22)
Then, the tilt angleθ of the weld joint is calculated from Equation(15) as a function ofβ, and the curvature radius R
i at the inner surface
of the portion R (see Fig. 5) from Equation (13), thus:
θ β = αβ 1.5
Lb / Ws1.5
Wb / t1.0
TS MPa1.25 (23)
Ri β =t cos θ β − t
2 −Wb
2 sin θ β
1 − cos θ β(24)
On the other hand, the value of a is determined using Equation (25)below, which is given by substituting Equations (3) and (5) inEquation (8).
β =Lb ⋅ F
n + 1 ⋅ TSBM ⋅ Ws ⋅ t1
Ri β + t / 2 − a β
n
a β + t2
n + 1− a β − t
2n + 1 (25)
Inconveniently, a is not explicitly expressed as a function ofβ, butthe value of a that satisfies Equation (25) can be obtainedcomparatively easily by using a spreadsheet.
The condition for fracture at the portion R is given as follows:
σ R β = TSR (26)
The shear stress in the weld metal is, from Equation (11),
τ β =β ⋅ TSBM ⋅ Ws ⋅ t
Lb ⋅ Wbcos θ β (27)
Letting the hardness of the weld metal be HvWM
, the condition forfracture at the weld metal is given by Equation (12) as follows:
τ β = 1.9 ⋅ HvWM (28)
To obtain the load T at the time of failure from the dimensionlessparameterβ, the following equation is used based on Equation (3):
T β = β ⋅ TSBM ⋅ Ws ⋅ t (29)
When the test piece width Ws, weld length L
b and weld width W
b are
given, the procedures for estimating the maximum tensile shear loadthat a laser welded lap joint can withstand and the position of fractureare as described below.
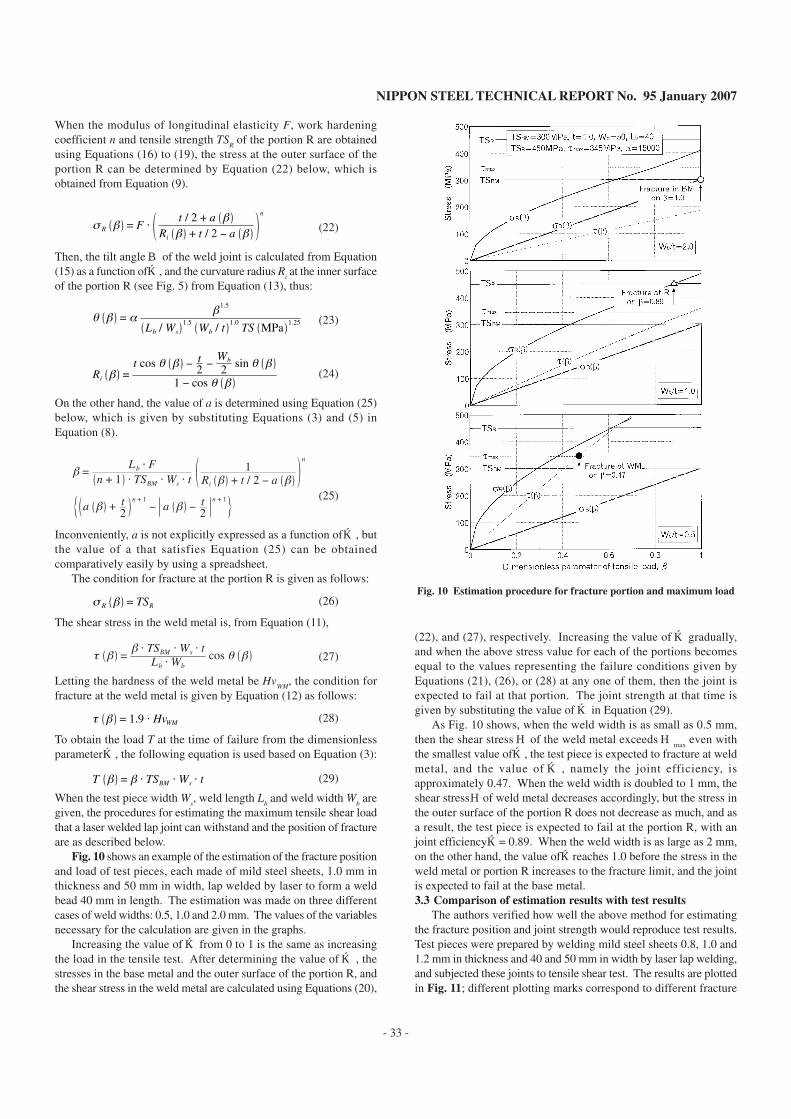
Fig. 10 shows an example of the estimation of the fracture positionand load of test pieces, each made of mild steel sheets, 1.0 mm inthickness and 50 mm in width, lap welded by laser to form a weldbead 40 mm in length. The estimation was made on three differentcases of weld widths: 0.5, 1.0 and 2.0 mm. The values of the variablesnecessary for the calculation are given in the graphs.
Increasing the value ofβ from 0 to 1 is the same as increasingthe load in the tensile test. After determining the value ofβ , thestresses in the base metal and the outer surface of the portion R, andthe shear stress in the weld metal are calculated using Equations (20),
(22), and (27), respectively. Increasing the value ofβ gradually,and when the above stress value for each of the portions becomesequal to the values representing the failure conditions given byEquations (21), (26), or (28) at any one of them, then the joint isexpected to fail at that portion. The joint strength at that time isgiven by substituting the value ofβ in Equation (29).
As Fig. 10 shows, when the weld width is as small as 0.5 mm,then the shear stressτ of the weld metal exceedsτ
max even with
the smallest value ofβ, the test piece is expected to fracture at weldmetal, and the value ofβ , namely the joint efficiency, isapproximately 0.47. When the weld width is doubled to 1 mm, theshear stressτof weld metal decreases accordingly, but the stress inthe outer surface of the portion R does not decrease as much, and asa result, the test piece is expected to fail at the portion R, with anjoint efficiencyβ= 0.89. When the weld width is as large as 2 mm,on the other hand, the value ofβreaches 1.0 before the stress in theweld metal or portion R increases to the fracture limit, and the jointis expected to fail at the base metal.3.3 Comparison of estimation results with test results
The authors verified how well the above method for estimatingthe fracture position and joint strength would reproduce test results.Test pieces were prepared by welding mild steel sheets 0.8, 1.0 and1.2 mm in thickness and 40 and 50 mm in width by laser lap welding,and subjected these joints to tensile shear test. The results are plottedin Fig. 11; different plotting marks correspond to different fracture
NIPPON STEEL TECHNICAL REPORT No. 95 January 2007
- 34 -
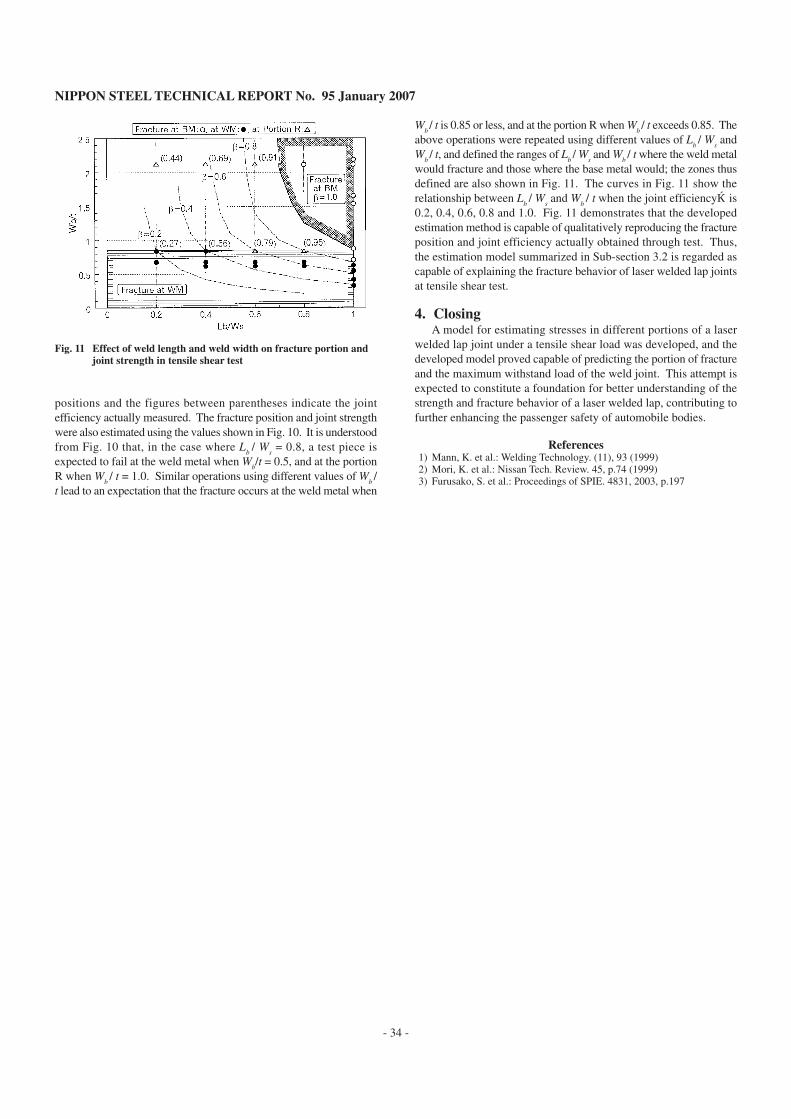
Fig. 11 Effect of weld length and weld width on fracture portion andjoint strength in tensile shear test
positions and the figures between parentheses indicate the jointefficiency actually measured. The fracture position and joint strengthwere also estimated using the values shown in Fig. 10. It is understoodfrom Fig. 10 that, in the case where L
b / W
s = 0.8, a test piece is
expected to fail at the weld metal when Wb/t = 0.5, and at the portion
R when Wb / t = 1.0. Similar operations using different values of W
b /
t lead to an expectation that the fracture occurs at the weld metal when
Wb / t is 0.85 or less, and at the portion R when W
b / t exceeds 0.85. The
above operations were repeated using different values of Lb / W
s and
Wb / t, and defined the ranges of L
b / W
s and W
b/ t where the weld metal
would fracture and those where the base metal would; the zones thusdefined are also shown in Fig. 11. The curves in Fig. 11 show therelationship between L
b / W
s and W
b/ t when the joint efficiencyβis
0.2, 0.4, 0.6, 0.8 and 1.0. Fig. 11 demonstrates that the developedestimation method is capable of qualitatively reproducing the fractureposition and joint efficiency actually obtained through test. Thus,the estimation model summarized in Sub-section 3.2 is regarded ascapable of explaining the fracture behavior of laser welded lap jointsat tensile shear test.
4. ClosingA model for estimating stresses in different portions of a laser
welded lap joint under a tensile shear load was developed, and thedeveloped model proved capable of predicting the portion of fractureand the maximum withstand load of the weld joint. This attempt isexpected to constitute a foundation for better understanding of thestrength and fracture behavior of a laser welded lap, contributing tofurther enhancing the passenger safety of automobile bodies.
References1) Mann, K. et al.: Welding Technology. (11), 93 (1999)2) Mori, K. et al.: Nissan Tech. Review. 45, p.74 (1999)3) Furusako, S. et al.: Proceedings of SPIE. 4831, 2003, p.197