term 2013
TRANSCRIPT
EEA Report No 11/2013
ISSN 1725-9177
A closer look at urban transport
TERM 2013: transport indicators tracking progress towards environmental targets in Europe


EEA Report No 11/2013
A closer look at urban transport
TERM 2013: transport indicators tracking progress towards environmental targets in Europe

Cover design: EEACover photo © Rastislav StaníkLeft photo © Flo HolzingerRight photo © Flo HolzingerLayout: EEA/Pia Schmidt
EEA project manager: Alfredo Sánchez Vicente
European Environment AgencyKongens Nytorv 61050 Copenhagen KDenmarkTel.: +45 33 36 71 00Fax: +45 33 36 71 99Web: eea.europa.euEnquiries: eea.europa.eu/enquiries
Legal noticeThe contents of this publication do not necessarily reflect the official opinions of the European Commission or other institutions of the European Union. Neither the European Environment Agency nor any person or company acting on behalf of the Agency is responsible for the use that may be made of the information contained in this report.
Copyright notice© European Environment Agency, 2013Reproduction is authorised, provided the source is acknowledged, save where otherwise stated.
Information about the European Union is available on the Internet. It can be accessed through the Europa server (www.europa.eu).
Luxembourg: Publications Office of the European Union, 2013
ISBN 978-92-9213-413-6ISSN 1725-9177doi:10.2800/94848
Environmental productionThis publication is printed according to high environmental standards.
Printed by Rosendahls-Schultz Grafisk— Environmental Management Certificate: DS/EN ISO 14001: 2004— Quality Certificate: DS/EN ISO 9001: 2008— EMAS Registration. Licence no. DK – 000235— Ecolabelling with the Nordic Swan, licence no. 541 457— FSC Certificate — licence code FSC C0688122
PaperRePrint — 90 gsm. CyclusOffset — 250 gsm. Both paper qualities are recycled paper and have obtained the ecolabel Nordic Swan.
Printed in Denmark
REG.NO. DK-000244

3
Contents
A closer look at urban transport
Contents
Acknowledgements .................................................................................................... 5
Executive summary .................................................................................................... 6
1 Introduction ........................................................................................................ 10
Part A: Monitoring progress towards transport and environmental goals .....13
2 TERM Core Set of Indicators ................................................................................ 132.1 Overview of progress towards transport goals ..................................................... 132.2 Overview of the 2013 TERM-CSIs ...................................................................... 14
3 Freight and passenger transport demand and modal split ................................... 303.1 Introduction ................................................................................................... 303.2 Freight transport............................................................................................. 303.3 Passenger transport ........................................................................................ 33
Part B: A closer look at urban transport .......................................................36
4 Why is urban transport relevant for the environment? ........................................ 364.1 Transport's role in the economic and social aspects of urban areas ........................ 364.2 Urban transport and quality of life ..................................................................... 364.3 Urban transport and air pollution ...................................................................... 384.4 Urban transport and climate change mitigation ................................................... 424.5 Setting the policy context ................................................................................ 42
5 Urban passenger transport .................................................................................. 445.1 Trends in urban mobility .................................................................................. 445.2 Underlying factors determining urban passenger transport patterns ....................... 475.3 Clean urban passenger vehicles ........................................................................ 51
6 Urban freight transport ....................................................................................... 536.1 Characteristics of urban freight ......................................................................... 536.2 Factors driving freight patterns ......................................................................... 546.3 Clean urban freight ......................................................................................... 58
7 Options to minimise impacts ............................................................................... 597.1 Avoiding the need to travel .............................................................................. 607.2 Supporting modal shift .................................................................................... 627.3 Improving modal efficiency .............................................................................. 657.4 Sustainable urban mobility plans ....................................................................... 68
8 Main messages and conclusions .......................................................................... 70
Acronyms and abbreviations .................................................................................... 73

Contents
4 A closer look at urban transport
References ............................................................................................................... 76
Annex 1 Metadata and supplementary information ................................................85
Annex 2 Relevant transport targets up to 2050 .....................................................89
Annex 3 Explaining the 'target paths' ....................................................................90
Annex 4 Overview of the TERM fact sheets ............................................................94
Annex 5 Data ......................................................................................................... 95

5
Acknowledgements
A closer look at urban transport
Acknowledgements
The TERM process is steered jointly by the European Commission (Eurostat, the Directorate-General for Environment (DG ENV), the Directorate General for Mobility and Transport (DG MOVE), and the Directorate-General for Climate Action (DG CLIMA) and the EEA. The EEA member countries and other international organisations provide input and are consulted on a regular basis.
The project was managed and the final version of the text written by Alfredo Sánchez Vicente (EEA).
The underlying fact sheets used for this report have been developed by the European Environment
Agency, the European Topic Centre for Air and Climate Mitigation (ETC/ACM) and a consortium led by Ricardo-AEA. The first draft of the text for chapters two to eight was completed by a team from Ricardo-AEA led by Nik Hill.
Substantial input and review was also provided by Cinzia Pastorello, François Dejean, Mihai Tomescu, Colin Nugent, Birgit Georgi, Alberto González, Stefan Ulrich Speck, and Patrick McMullan who edited the report (all from the EEA). The EEA reviewer was Paul McAleavey. In addition, comments were received from a number of EEA member countries as well as from the European Commission.

6
Executive summary
A closer look at urban transport
Executive summary
Transport guarantees our mobility and access to goods. Moreover, the transport sector helps maintain and develop our societal and economic systems. Transport is also a main source of pressures on the environment, such as the unsustainable use of natural resources, as well as greenhouse gas, air pollutant and noise emissions. Many of these environmental problems are inter-linked, requiring comprehensive and systemic policies at multiple levels of governance in response.
European Environment Agency's (EEA) annual Transport and Environment Reporting Mechanism (TERM) report aims to provide policymakers, as well as a broader audience, a clear overview of current transport demand, the pressures from the transport sector on the environment, and related impacts and responses. The report uses latest available data in order to assess key trends and overall progress towards policy targets. This overview is provided in the form of a series of twelve indicators known as the 'TERM Core Set of Indicators' or TERM-CSI.
Policy context
The European Union (EU) has adopted specific policy targets for transport, based on the European Commission's White Paper on transport (EC, 2011). The White Paper sets the target of achieving a 60 % reduction in greenhouse gas (GHG) emissions from transport by 2050 compared to 1990 levels. This target represents the transport sector's contribution to the overall EU objective of a 80–95 % reduction of its greenhouse gas emissions as defined in the Roadmap for a low carbon economy by 2050 (EC, 2011a).
Most of the targets monitored in EEA's TERM report are set by the White Paper. Moreover, a range of other environmental targets in the EU transport and environment policy are also tracked, such as the new passenger car carbon dioxide (CO2) emissions target or the share of renewable energy in transport.
The 2011 Transport White Paper also called for a 'new type of urban mobility' aiming to undertake
the necessary transition from a primarily car based personal mobility in cities to a mobility based on walking and cycling, high quality public transport and cleaner passenger vehicles, as well as more efficient freight transport. In essence, the strategy called for a transition to a new way of life in an urban environment from the transport perspective. The European Commission (EC) is currently working on the development of the urban dimension of EU transport policy, which is likely to support initiatives such as sustainable urban mobility plans and access restriction schemes, financial support mechanisms as well as best practice guidelines and information sharing mechanisms.
Environmental performance of European transport — generally improving slowly; achieving long-term targets will require significant evolution of the transport system
Monitoring progress towards targets is the backbone of the TERM report, and Chapter 2 provides the latest information in order that key trends and overall progress towards achieving transport and environmental objectives can be understood.
Table 2.1 presents an overview of progress towards transport goals, showing that European transport is currently improving its environmental performance. The latest data reveal that observed values are better than the 'target path' for the overall GHG emissions, oil consumption reduction and average CO2 emissions for new passenger cars targets. However, achieving the European Union's long-term targets requires that the improvements in environmental performance will be sufficient to avoid locking the transport system into unsustainable trends.
Overall GHG emissions, including aviation but excluding maritime shipping, have reduced only slightly by 0.6 % in 2011. The reduction has been limited partly because international aviation emissions rose by 2.6 %. This slight reduction

Executive summary
7A closer look at urban transport
continues the trend observed in last year's report. While the progress is consistent with the target trajectory, emissions in 2011 were still 25 % above 1990 levels.
Transport oil consumption has reduced by 0.6 % between 2010 and 2011. However, the rate of reduction will need to accelerate over the next few years in order to remain below the linear target line to the 2050 goal of reducing transport oil consumption by 70 % reduction compared to 2008. First estimates based on current fuel sales data, used in this report as a proxy, show that transport energy consumption may have dropped by 4 % in 2012 compared to 2011 in the EU-28 (1).
New passenger car CO2 emissions per kilometre (km) have also followed a continuing downward trend with a further 2.6 % reduction in 2012 compared to 2011. Policies in this area have had positive impacts on the CO2 emissions per kilometre from new passenger cars. The European Union's 2015 goal of 130 g/km may well be achieved ahead of time. In fact, the annual reduction from 2007 suggests that many manufacturers are on track towards the 2015 target while aiming at reducing emissions in the light of the 2020 goal indicated by current legislation. However, the rules on how car manufacturers must meet their CO2 target for 2020 are still to be agreed. On the other hand, differences between real world emissions and test-cycle emissions exist. This has been acknowledged by a European Parliament request to introduce the World Harmonised Light Duty Test Procedure (WLTP) by 2017 which, it is believed, could reduce these differences.
The average EU-28 share of renewable energy consumed in transport increased between 2010 and 2011 from 3.5 % to 3.8 %, while the 'target path' suggests a value of 4.1 % in 2011. Only biofuels complying with the Renewable Energy Directive (RED) sustainability criteria are counted, with data available from 2010 onwards. The share of biofuels complying with the sustainability criteria in the RED increased by 6.3 %, while the amount of all biofuels consumed in transport (also including those not meeting the sustainability criteria) rose by 3.9 %. Meanwhile, the use of renewable electricity in road and rail transport keeps increasing, doubling in the case of road and by 10 % for rail between 2010 and 2011. However, road transport electricity consumed remains very low.
Additional findings on transport demand, air pollutant emissions and alternative fuel vehicles
The TERM-CSI also offers additional findings. Between 2010 and 2011, passenger transport demand in the EU-27 (European Union, excluding Croatia) increased by nearly 1 %, reaching a new all-time high, mainly attributed to a 10 % increase in aviation. Demand steadily increased between 1995 and 2009, but at a slower rate than gross domestic product (GDP). The largest increases have been in air (66 %) and car (23 %) demand between 1995 and 2011. However, the economic recession led to a minor decline in 2009 and 2010 (0.1 %). First estimations suggest that passenger transport demand may have decreased again in 2012.
Freight transport volumes in the EU-27 remained unchanged between 2010 and 2011, approximately 8 % below the peak volumes experienced in 2007. However, the modal share changed slightly in favour of rail transport, the only mode to experience an increase in tonne kilometres (tkm) between 2010 and 2011. First estimations suggest that freight transport demand may have dropped by 3.7 % in 2012.
Even though emissions of all transport air pollutants have significantly declined over the past two decades, the general trend for decreases in air pollutant emissions from transport appears to have stabilised between 2010 and 2011.This is except in the case of sulphur oxides (SOX), where a 2.3 % increase was registered, also driven by a 6.3 % increase in international aviation and more than 2 % rise for domestic and international shipping.
As the EEA report Air quality in Europe — 2013 report stressed, air quality levels in cities are a fundamental issue for public health (EEA, 2013). In 2011, the nitrogen dioxide (NO2) annual limit value was exceeded at 42 % of the traffic stations, at 3 % of the urban background stations but only at one rural background station within the EU. The increasing number of diesel vehicles in some cities in Europe has led to persistant concentrations of NO2 measured close to traffic in the period 2002–2011. As a result, 5 % of the EU urban population lives in areas where the annual EU limit value and the World Health Organization (WHO) air quality guidelines for NO2 were exceeded in 2011. Oxides of nitrogen (NOX) are also promoting tropospheric ozone (O3) formation which along with particulate
(1) For information on the definition of country groupings, see Box 1.1.

Executive summary
8 A closer look at urban transport
matter (PM) are Europe's most problematic pollutants in terms of harm to human health.
'Dieselisation', i.e. the increase of the share of diesel fuels in transport fuels, is one of the main causes of high particulate concentration in European cities. Road fuel excise duties in all European Union Member States are more favourable to diesel than gasoline. Diesel vehicles generally emit more PM and NOX per kilometre than their gasoline equivalents. In 2011, PM with a diameter of 10 micrometres or less (PM10) was exceeded at 43 % of traffic sites, 38 % of urban background sites, 26 % of 'other' sites (mostly industrial) and even at 15 % of rural sites within the EU.
Alternative fuel vehicles are deployed increasingly in Europe. Among these, Liquid Petroleum Gas (LPG) vehicles dominate and only the Netherlands has a significant amount of electric vehicles (70 000 in 2011, steadily increasing since 2004). Pure electric vehicles currently comprise only 0.04 % of the total fleet and latest data show that their share in new car registrations in the EU-27 is 0.1 % (LPG vehicles 1.3 %; Compressed Natural Gas (CNG) vehicles 0.5 %). However, this means an increase of 61 % in 2012. France leads with 5 700 pure electric vehicles sold in 2012, followed by Germany with 2 800.
Chapter 3 analyses in detail the levels of passenger and freight transport demand across Europe and the modes and fuels used to meet it. Transport demand and the modes used largely determine the resulting environmental impacts.
The data show that over the past decade for the EU-28 there is no absolute decoupling of transport demand from GDP, except when it comes to car use in the EU-15. Car use stabilised in the EU-15 while volumes fell by 1.4 % between 2009 and 2011.
For the EU-13 (see Box 1.1), transport growth is outstripping economic growth, reflecting the growth in these economies. Passenger air transport remains the second highest modal share in the EU-27 at almost 9 % and has increased by 10 % between 2010 and 2011.
A closer look on urban transport
Urban transport accounts for a significant share of the environmental impacts of transport in Europe, and the second part of TERM 2013 analyses trends, main characteristics, options to minimise impacts, and recent actions that have proven to be effective in the transition towards more efficient mobility in
European metropolitan areas. Meeting the transport policy aims and goals set out in the White Paper will be easier if towns and cities across Europe follow the example of those places that have already made good progress in making the mobility system evolve towards more sustainability at local scale. If followed more broadly, such an evolution can lead to a better quality of life for all of Europe's citizens.
The importance of urban transport for the environment
Chapter 4 provides an overview of the importance of urban transport in economic terms and sets out the impacts of urban transport on the environment. Urban transport plays a key role in the overall context of transport driven environmental impacts. For example, it has been estimated to account for around 25 % of the CO2 transport emissions responsible for climate change, almost all attributed to road transport (EEA, 2013a). In terms of air quality, the International Agency for Research on Cancer (IARC), the specialised cancer agency of the WHO, has recently classified outdoor air pollution as carcinogenic to humans. Such health risks point to the need for policies to achieve better ways to genuinely change the way we move and transport goods in cities.
Up to a third of Europeans living in cities are exposed to air pollutant levels exceeding EU air quality standards. Between 2009 and 2011, up to 96 % of city dwellers were exposed to fine particulate matter (PM2.5) concentrations above WHO guidelines and up to 98 % were exposed to O3 levels above WHO guidelines (EEA, 2013). The average contribution of urban and local traffic to PM10 concentration is 35 % while it is up to 64 % in the case of NO2 concentrations (EEA, 2012).
Measures to achieve a more sustainable modal share can work
Chapter 5 analyses in detail urban passenger transport trends and main underlying factors that can explain how and why people travel. It concludes that the contribution from sustainable travel modes to urban mobility can be influenced by a number of factors, including the density and design of urban form, the provision and quality of transport infrastructure and transport costs (including parking and public transport fares).
Chapter 5 shows that those cities that have been determined in implementing a package of measures

Executive summary
9A closer look at urban transport
to achieve a more sustainable modal share have obtained promising results. For example, improving non-motorised transport facilities have resulted in increasing bike use in Berlin and Seville, and the congestion charge schemes in cities such as London and Stockholm have achieved substantial road traffic reductions. Public transport has a key role to play in providing sustainable alternatives to guarantee mobility options in the metropolitan area.
Urban freight trends
In spite of being a vital part of the urban economy, delivering goods and services to city residents and businesses, urban freight has received relatively limited attention from both researchers and policymakers. Chapter 6 analyses urban freight trends and main aspects. It is dominated by road transport as the final leg of a potentially long and complicated supply chain, with limited options for modal shift. The key to improving the environmental performance of urban freight lies in better and more efficient logistics and the use of low or zero emission vehicles. Different policy measures can make the transition faster.
Tailoring environmental solutions to different cities
European cities are very different, but they all can benefit from the measures that have proven to be efficient. The way such measures are implemented could vary depending on local circumstances. Chapter 7 presents and discusses a variety of realistic options to minimise impacts. It provides examples and figures that can help developing comprehensive packages of measures covering all modes of transport in a metropolitan area. The development of Sustainable Urban Mobility Plans (SUMPs) can eventually increase the urban quality of life while guaranteeing its social and economic development. The EU takes on an important role in the setting of targets and regulation and the monitoring of progress through a comprehensive framework of action. Ultimately, in order to gain public support this must aim to address not just the environmental impacts of the transport system, but to create an improved quality of life for all European citizens.
Finally, Chapter 8 summarises the main findings and messages from the report.

10
Introduction
A closer look at urban transport
1 Introduction
The EEA works in the transport area to assess the impacts of the sector on the human health and the environment. This work also allows the EEA to monitor the progress of integrating transport and environmental policies, and informing the EU, EEA member countries and the public about such progress. This is achieved by the production of relevant indicators that track progress towards policy targets for transport related to the environment, as well as through the elaboration of periodic assessments that cover all transport modes and the impacts of transport on the environment.
The annual TERM report aims to enable policymakers to gauge the progress of those policies aiming to improve the environmental performance of the transport system as a whole. TERM 2013, has two distinct parts. Part A provides an annual assessment of the EU's transport and environment policies based on the TERM-CSI, a selection of 12 indicators from the broader set of EEA transport indicators to enabling monitoring of the most important aspects of transport. Part B focuses on urban transport and its effects on the environment.
Part A: Monitoring progress towards transport and environmental goals
The TERM report monitors environmental goals from the White Paper on transport (EC, 2011), including the overall goal of achieving a 60 % reduction in transport GHG emissions. In addition to the White Paper goals, a range of other environmental targets in EU transport and environment policy have been identified (see Annex 2). These range from shorter-term targets through to targets for 2050, which aim to support the overall goal of reducing GHG emissions in the transport sector. They include targets from other key transport and environment-related policy and legislation, such as the Roadmap for Moving to a Competitive Low Carbon Economy in 2050 (EC, 2011a), the various regulations setting CO2 emission targets for new passenger cars (EC, 2009) and vans (EC, 2011b), and the targets from the Renewable Energy Directive (RED) (EC, 2009a) and
the Fuel Quality Directive (FQD) (EC, 2009b). In total, the table in Annex 2 identifies 12 targets up to 2050, some of which cannot currently be monitored due to lack of data.
In the TERM 2012 report, a new way of presenting the various transport goals was introduced, which provided a visual summary and measure of progress towards these various goals. This year's TERM report updates this overview with the latest available data (Table 2.1). Currently, this is only possible for five of the targets, but the intention is to expand this as more data become available. For example, first data on CO2 emissions for new passenger vans are already presented in Table 2.1 and will become the sixth goal to which progress can be presented in 2014.
In addition to this, some targets are related to transport implicitly rather than explicitly. These have also been included in the TERM CSIs. They include targets related to emissions, air quality, and noise. Boxes 2.4, 2.5 and 2.6 show the latest data available from a transport perspective. In addition to this, other important information related to the rate of fuel taxation across EEA member countries is also presented in Chapter 2. Moreover, the importance of transport demand as a driver of the environmental performance is also analysed in the first part of the document.
Part B: A closer look at urban transport
Apart from its general role, TERM also seeks to provide the relevant information on a specific topic of interest every year. For 2013, the focus is on urban transport. The aim is to gather more knowledge on the importance of urban transport when managing the environmental performance of transport. Most of the harmful environmental problems from transport are more evident in urban areas. Indeed, a significant share of all journeys takes place solely in urban areas. Better managing transport demand and shifting to alternative modes of transport can be a successful strategy to mitigate externalities. Walking and

Introduction
11A closer look at urban transport
cycling can become the core of the necessary transition from a primarily car-based mobility option in cities to mobility-based on non-motorised and public transport. Goals exist to phase out conventional cars in cities by 2050 and make city logistics CO2 free in major urban centres by 2030. The European Commission is currently working on the development of the urban dimension of EU transport policy, which is likely to support initiatives such as sustainable urban mobility plans and access restriction schemes, financial support mechanisms as well as best practice guidelines and information sharing mechanisms.
Figure 1.1 presents the overall methodology designed for the TERM reports, with an update reflecting the two main objectives for TERM 2013.
Scope of the report
The report aims to cover all 33 EEA member countries (for more on country grouping terminology, see Box 1.1). Where data are not complete, this is generally noted in the metadata section, where different country groupings are also
Figure 1.1 Conceptual map for the TERM approach: TERM 2013 structure
Climate change
Other environmental aspects
Noise
Air emission and air quality
Energy consumption
Baseline Targets 2020, 2030, 2050
PART AMonitoring progress
towards goals
Climate change
Noise
Energy consumption
PART BThematic assessment
Chapter 4 + 5 + 6 + 7: A closer look at urban transport
Other environmental aspects
Air emission and air quality
Chapter 2:TERM-CSIChapter 3:
Freight and passenger transport demand and modal split
described. For some indicators, EU-28 data have been prioritised, as policy targets and goals are specifically developed for these countries, but a reflection based on the available EEA data has been included as far as possible.
When Croatia joined the EU in July 2013, it also became the 33rd member country of the EEA. In this report, data from Croatia have been included as far as is possible. The member countries of the EEA are now referred to as the EEA-33. The EU Member States that joined after 2003 are referred to as the EU-13 while the total of EU Member States is now referred to as the EU-28. Where it has not been possible to include data from Croatia in this year's TERM report, this has been indicated. In this case data for the EU-28 excluding Croatia are referred to as EU-27.
In terms of time, most indicators cover the years since 1990, subject to data availability. But there are cases where data for some Member States have only become available recently, or where the transition from a centrally planned to market economy has led to such big changes that comparisons over time become irrelevant.

Introduction
12 A closer look at urban transport
Box 1.1 A note on country groupings
Throughout the report, abbreviations are used to refer to specific country groupings. The following definitions are used:
• EU-15: Austria, Belgium, Denmark, Finland, France, Germany, Greece, Ireland, Italy, Luxembourg, the Netherlands, Portugal, Spain, Sweden and the United Kingdom.
• EU-10: Cyprus, the Czech Republic, Estonia, Hungary, Latvia, Lithuania, Malta, Poland, Slovakia and Slovenia.
• EU-13: EU-10 and Bulgaria, Croatia and Romania.
• EFTA-4: Iceland, Liechtenstein, Norway and Switzerland.
• EU-25: EU-15 and EU-10.
• EU-28: EU-15 and EU-13.
• EU-27: EU-28 excluding Croatia.
• EEA-33: EEA member countries (EU-28, EFTA-4 and Turkey).
13
Part A│TERM Core Set of Indicators
A closer look at urban transport
Part A: Monitoring progress towards transport and environmental goals 2 TERM Core Set of Indicators
2.1 Overview of progress towards transport goals
Not all of the transport goals set for EU Member States can be currently monitored, as data or the ability to show progress to a certain goal are not yet available. Those that can be monitored are detailed below in Table 2.1, including an assessment of the progress achieved towards them.
The details of how progress towards these goals is measured were provided in the TERM 2012 report (EEA, 2012). Annex 3 of the present document shows a detailed representation of the comparison between real data and the 'target path' defined accordingly for each indicator. In summary, a base year and value have been established for each goal; the base year varies for each goal but is used as the starting point for a target trajectory. In the case of transport GHG emissions, this trajectory is based on the preferred policy option for achieving reductions as set out in the impact assessment accompanying the 2011 Transport White Paper (EC, 2011c). For the other goals, the trajectory is defined as a straight line from the base-year data to the target-year data, i.e. assuming a linear trend towards the target (see Annex 3 for more details and a graphical representation of the comparison between real data and the 'target path').
Key messages
• Environmental performance of European transport is generally improving slowly.
• Achieving long-term targets will require significant evolution of the transport system.
• Overall GHG emissions have reduced only slightly by 0.6 % in 2011. Progress remains on target, but emissions in 2011 were still 25 % above 1990 levels.
• The latest data reveal that observed values are also better than the 'target path' for the oil consumption reduction goal and average CO2 emissions for new passenger cars target.
• The European Union's share of renewable energy consumed in transport increased between 2010 and 2011 from 3.5 % to 3.8 %, while the 'target path' suggests a value of 4.1 % in 2011.
Transport GHG emissions to be reduced by 20 % from 2008 levels by 2030, and at least 60 % from 1990 levels by 2050
Overall GHG emissions, including aviation but excluding maritime shipping (Table 2.1), have reduced slightly, by 0.6 % in 2011. The reduction has been limited partly because international aviation emissions rose by 2.6 %. This slight reduction continues the trend observed in last year's report (which contained data from 2010). As a result, progress is consistent with the target trajectory, even though emissions in 2011 were still 25 % above 1990 levels.
It is clear that transport GHG emissions are directly linked with transport demand, and the latter is influenced by the evolution of GDP. This is especially the case for freight transport (see Chapter 3). The challenge will be to maintain this good progress when the European economic situation returns to pre-recession levels of growth and when the 'target trajectory' becomes more testing, with the significant reductions required post 2015. Keeping the values below the 'target trajectory' in the future may be challenging in the absence of a significant uptake of new technologies and a change in transport demand or a more favourable share of transport activity by less harmful modes.

Part A│TERM Core Set of Indicators
14 A closer look at urban transport
Average passenger car emissions target of 130 g CO2/km for the new car fleet by 2015, and a target of 95 g CO2/km from 2020 onwards
New passenger car CO2 emissions per km have also followed a continuing downward trend with a further 2.6 % reduction in 2012 from 2011 levels, cutting the EU-27 average to 132.2 grams of CO2 per kilometre (g CO2/km). This is close to the 130 g target for the average new car sold in 2015. Based on the emission levels, all major car manufacturers have met their targets in 2012, and some were already in line with more stringent 2015 targets. However, the rules on how car manufacturers must meet their CO2 target for 2020 are still to be agreed and goals for 2025 have not been determined.
On the other hand, previous reports have highlighted the differences between real world emissions and test-cycle emissions. A recent study for the European Commission (TNO, 2012) indicated that there has been an increase in the use of homologation test flexibilities between 2002 and 2010 contributing to the reduction in reported CO2 emissions, and increasing the gap between real world emissions and those from the test-cycle during this period. However, the benefit from the use of each flexibility can only be used once and has some cost associated with it. Therefore, it is likely that the portion of the divergence between real world emissions and those from the test-cycle due to test procedure flexibilities will stabilise. In any case, although real world emissions are higher, the deployment of CO2 reducing technologies means that a substantial share of the reductions in CO2 has taken place.
All EU Member States to achieve a 10 % share in renewable energy by 2020 for all transport options
Individual Member States progress towards this target varies (see Box 2.12). As a reference, the average share of renewable energy across the EU-28 consumed in transport between 2010 and 2011 increased from 3.5 % to 3.8 %, while the 'target path' suggests a value of 4.1 % in 2011. These figures include only those biofuels which met the sustainability criteria. The use of renewable electricity in road transport has doubled from 2010 to 2011, but it is still very low (13 kilotonnes oil equivalent (ktoe) in 2011) compared to the amount of biofuels consumed in transport (13 730 ktoe in 2011), which rose by 3.9 %. Rail use of renewable electricity keeps rising at a stable pace, increasing
by 10 % from 2010 to 2011, reaching 1 300 ktoe in 2011.
The share of biofuels complying with the sustainability criteria in the RED increased by 6.3 %, from 9 238 to 9 819 ktoe. Recently, a proposal to account for indirect land-use change emissions resulting from biofuels use has been under negotiation, including, inter alia, a limit on the use biofuels generated from food crops. This could make the target more challenging to achieve in the shorter term, but would have positive climate and environmental impacts. The implications of the limit are discussed in the next section.
Transport oil consumption to be reduced by 70 % by 2050 from 2008 levels
Transport oil consumption has reduced slightly between 2010 and 2011. However, over the next few years the rate of reduction will need to accelerate in order not to fall behind the linear target line to the 2050 goal of a 70 % reduction on 2008 transport oil consumption.
Maritime bunker GHG emissions to be reduced by 40 % from 2005 levels by 2050
EU CO2 emissions of maritime bunker fuels data for 2011 show inconsistency with the changes in bunker fuels and transport activity for 2010–2011 and they are currently under investigation. Therefore, the observed 2011 data and the latest annual trend cells are coloured in yellow in Table 2.1, and should not be treated as final data. While this issue is being clarified, the newly-released strategy (EC, 2013) to reduce GHG emissions from the maritime sector will result in measures that can help towards meeting the 2050 target.
2.2 Overview of the 2013 TERM-CSIs
Previous sections of the present chapter aimed at providing a clear overview of the progress made towards the transport goals set in the White Paper and other relevant transport and environment legislation, synthesised in Table 2.1. In order to provide a comprehensive overview, the present section gives details on a broader set of key transport and environmental areas, showing the current status of the environmental impacts from transport. This overview is now provided in the form of a series of twelve indicators known as

Part A│TERM Core Set of Indicators
15A closer look at urban transport
Table 2.1 Transport goals overview in the EU-28, 2013
Sou
rce
Targ
etU
nit
Wh
ere
we
wer
eW
her
e w
e w
ant
to b
eW
her
e w
e ar
e
(cu
rren
t tr
end
s vs
. 't
arg
et p
ath
')La
test
an
nu
al
tren
dB
ase
year
Targ
et2
00
92
01
02
01
12
01
2
Yea
rV
alu
eY
ear
Val
ue
'Tar
get
p
ath
'O
bse
rved
'Tar
get
p
ath
'O
bse
rved
'Tar
get
p
ath
'O
bse
rved
'Tar
get
p
ath
'O
bse
rved
Key target
2050
Ro
adm
ap
(EC,
2011
a)
& T
rans
port
W
hite
Pap
er
(EC,
2011
),
2050
Tran
spor
t G
HG
(i
nclu
ding
in
tern
atio
nal
avia
tion,
ex
clud
ing
inte
rnat
iona
l m
ariti
me
ship
ping
)
Mt
CO
220
081
110
2030
914
(– 2
0 %
)1
102
1 07
51
103
1 06
91
105
1 06
31
107
n.a.
– 0.
6 %
1990
849
2050
332
(– 6
0 %
)
Indicative goals
Tran
spor
t W
hite
Pap
er
(EC,
2011
)
EU C
O2 em
issi
ons
of m
ariti
me
bunk
er fue
ls (
b )
Mt
CO
220
0516
620
5010
0 (–
40
%)
160
160
159
152
157
163
156
n.a.
7.5
%
Pass
enge
r Car
CO
2 EC
Re
gula
tion
443/
2009
(E
C,
2009
) (a
)
Targ
et a
vera
ge
type
-app
rova
l em
issi
ons
for
new
pas
seng
er
cars
g CO
2/km
2010
140
2015
20
2013
0 95n.
a.14
614
014
013
813
613
613
2–
2.6
%
Van
CO
2 EC
Re
gula
tion
510/
2011
(E
C,
2011
b)
(a)
Targ
et a
vera
ge
type
-app
rova
l em
issi
ons
for
new
van
s
g CO
2/km
2012
180
2017
20
2017
5 14
7n.
a.n.
a.n.
a.n.
a.n.
a.n.
a.n.
a.18
0n.
a.
Impa
ct
asse
ssm
ent-
ac
com
pany
ing
docu
men
t to
the
Whi
te
Pape
r. (E
C,
2011
c)
Redu
ctio
n of
tr
ansp
ort
oil
cons
umpt
ion
ktoe
2008
414
172
2050
124
252
(– 7
0 %
)40
7 26
239
6 46
640
0 36
739
4 01
339
3 46
439
1 52
538
6 56
1n.
a.–
0.6
%
Rene
wab
le
Ener
gy
Direc
tive
2009
/28/
EC
(EC,
2009
a)
(c)
10 %
sha
re
of r
enew
able
en
ergy
in t
he
tran
spor
t se
ctor
finalenergy
cons
umpt
ion
for
each
Mem
ber
Sta
te (
here
EU
-28
aver
age
as a
pro
xy)
%20
103.
47 %
2020
10.0
0 %
n.a.
n.a.
3.47
%3.
47 %
4.13
%3.
81 %
4.78
%n.
a.9.
8 %
Not
es:
Ind
icat
ive
targ
ets:
In
orde
r to
ass
ign
a co
lour
for
the
cel
ls c
onta
inin
g th
e la
test
obs
erve
d da
ta,
a co
mpa
riso
n is
mad
e to
the
'tar
get
path
'. In
the
cas
e of
the
key
tar
get,
ea
ch y
ear's
data
will
be
com
pare
d w
ith t
he 't
arge
t pa
th' d
efin
ed in
the
Eur
opea
n Com
mis
sion
's P
olic
y O
ptio
n 4
(the
'pre
ferr
ed p
olic
y op
tion'
) in
ord
er t
o m
eet
the
tran
spor
t G
HG
red
uctio
n ta
rget
by
2030
and
205
0.
For
the
othe
r go
als
ther
e ar
e no
off
icia
l est
imat
es o
f th
e 'ta
rget
pat
h' t
o be
fol
low
ed,
so t
his
path
is c
alcu
late
d by
plo
ttin
g a
stra
ight
line
fro
m t
he b
ase
year
dat
a to
the
ta
rget
yea
r da
ta,
i.e.
assu
min
g a
linea
r tr
end
tow
ards
the
tar
get
(see
TER
M 2
012
and
Ann
ex 3
of th
e pr
esen
t re
port
for
mor
e de
tails
and
a g
raph
ical
rep
rese
ntat
ion
of t
he
com
pariso
n be
twee
n re
al d
ata
and
the
linea
r tr
end)
.
(a)
EU-2
7 da
ta.
(b
) EU
CO
2 em
issi
ons
of m
ariti
me
bunk
er fue
ls d
ata
for
2011
sho
w in
cons
iste
ncy
with
the
cha
nges
in b
unke
r fu
els
and
tran
spor
t ac
tivity
for
201
0–20
11 a
nd t
hey
are
curr
ently
und
er in
vest
igat
ion.
The
refo
re,
the
obse
rved
201
1 da
ta a
nd t
he la
test
ann
ual t
rend
cel
ls a
re c
olou
red
in y
ello
w,
and
shou
ld n
ot b
e tr
eate
d as
fin
al d
ata.
(c
) In
the
cas
e of
the
Ren
ewab
le E
nerg
y D
irec
tive
targ
et,
Euro
stat
has
pub
lishe
d fo
r th
e fir
st t
ime
(201
1 da
ta)
the
shar
e of
bio
fuel
s in
tra
nspo
rt e
nerg
y us
e w
hich
mee
t th
e su
stai
nabi
lity
crite
ria
of t
he R
ED,
even
tho
ugh
the
syst
ems
for
cert
ifyin
g su
stai
nabl
e bi
ofue
ls w
ere
not
yet
fully
ope
ratio
nal i
n a
num
ber
of M
embe
r Sta
tes.
Ind
eed,
thi
s is
onl
y po
ssib
le in
cou
ntries
tha
t co
nfirm
ed in
due
tim
e fu
ll co
mpl
ianc
e w
ith A
rtic
le 1
7 'S
usta
inab
ility
crite
ria
for
biof
uels
and
bio
liqui
ds' a
nd A
rtic
le 1
8 'V
erifi
catio
n of
co
mpl
ianc
e w
ith t
he s
usta
inab
ility
crite
ria
for
biof
uels
and
bio
liqui
ds' o
f D
irec
tive
2009
/28/
EC.
Part A│TERM Core Set of Indicators
16 A closer look at urban transport
Box 2.1 TERM Core Set of Indicators (TERM-CSIs)
• TERM 01: Transport final energy consumption by mode
• TERM 02: Transport emissions of greenhouse gases
• TERM 03: Transport emissions of air pollutants
• TERM 04: Exceedances of air quality objectives due to traffic
• TERM 05: Exposure to, and annoyance by, traffic noise
• TERM 12a/b: Passenger transport volume and modal split
• TERM 13a/b: Freight transport volume and modal split
• TERM 20: Real change in transport prices by mode
• TERM 21: Fuel tax rates
• TERM 27: Energy efficiency and specific CO2 emissions
• TERM 31: Share of renewable energy in the transport sector (CSI 037)
• TERM 34: Proportion of vehicle fleet by alternative fuel type.
the 'TERM Core Set of Indicators' or TERM-CSI. They were introduced in the TERM 2011 report to allow for a more focused monitoring of the most important aspects of transport impacts. Box 2.1 provides a summary of the TERM-CSIs.
In Boxes 2.2 to 2.14, each of the TERM-CSIs is described in more detail including related policy targets, latest available data and key messages.

Part A│TERM Core Set of Indicators
17A closer look at urban transport
Box 2.2 TERM 01: Transport final energy consumption by fuel
Notes: The estimates for the year 2012 are based on the regularly updated Eurostat indicator nrg_102m using the categories 'Gross inland deliveries observed' and 'International Maritime Bunkers' for a limited range of fuels. These include motor gasoline, transport diesel, jet fuel and residual fuel oil. The proportionate change observed for these fuels between 2011 and 2012 is then used to estimate 2012 consumption figures for all oil-based road petrol and diesel, rail diesel, aviation kerosene and shipping fuels. Electricity, natural gas and biofuels are estimated by extrapolating the consumption trends of the previous years.
Latest available data: 2011 (2012 estimated using fuel supply data).
Source: Eurostat, 2013.
Related targets and monitoring
For the EU, the policy scenarios in the impact assessment which accompanied the EC's Transport White Paper (EC, 2011c) suggest a reduction of around 70 % by 2050 compared to 2008 transport oil consumption.
Key messages: It appears that transport energy consumption could have dropped by 4 % in 2012 compared to 2011 in the EU-28, with current fuel sales data used as a proxy for estimating total transport energy consumption. The shipping sector saw the greatest decline in energy consumption during the recession; international maritime bunkers dropped by 10 % between 2008 and 2009 alone. Levels of energy use for aviation, road transport and rail transport all fell by around 5 % between 2007 and 2011. Road transport is the largest consumer of energy accounting for 73 % of total demand in 2011. The share of road diesel fuel consumed compared to gasoline is still increasing, reaching 69 % in 2012.
In Switzerland, demand for rail transport has significantly increased over the past decade; this is
Transport energy consumption in the EU-28
also reflected in increased energy use in the rail sector. Meanwhile rail energy use has decreased in the EU-28. In Norway and Turkey road transport energy use grew faster than in the EU-28. At the same time Turkey's rail energy use has fallen substantially reflecting decreasing demand for rail services. This is likely due to the temporarily closure of railway lines because of maintenance and infrastructure renewal.
There is still a lack of statistical data available for the share of energy between different transport activities. While the use of gasoline, aviation kerosene or road diesel is known, modelling estimations are still needed to discern the proportion of energy used in urban transport, for example, or the amounts of diesel road fuel that has been used for passenger and freight transport. Figure 4.1 shows shares in EU transport greenhouse gas emissions in 2010 as updated estimates based on the PRIMES-TREMOVE model and not from official statistics. There is still a need to improve the understanding of the share of road fuel consumption and CO2 due to different transport activities.
Further information: Box 2.10 Fuel tax rates, and Box 2.12 Share of renewable energy in the transport sector.
0
2
4
6
8
10
12
14
16
18
20
1990 1995 2000 2005 2007 2008 2009 2010 2011 2012
Energy consumption (million terajoules)
Road gasoline Road diesel BiogasolineBiodiesel Natural gas LPGRail electricity Rail gas/diesel oil Aviation keroseneShip gasoline Ship diesel/gas oil Ship residual fuel oilOther Oil derived fuels 70 % reduction of 2008 oil consumption
70 % reduction of 2008 oil consumption by 2050
Estim
ate

Part A│TERM Core Set of Indicators
18 A closer look at urban transport
Box 2.3 TERM 02: Transport emissions of GHGs
Notes: The orange line includes proxy data for 2012, which is an EEA preliminary estimate (EEA, 2013b). It was originally estimated excluding international bunkers. In order to show 2011 data covering the same scope as in previous years, the 2011 value of international aviation emissions was added to the 2012 proxy. This corresponds to the basic assumption that international aviation emissions did not change between 2011 and 2012. In the figure, the 2011–2012 trends are marked with a dashed line.
EU CO2 emissions of maritime bunker fuels data for 2011 show inconsistency with the changes in bunker fuels and transport activity for 2010–2011 and they are currently under investigation. Therefore, the observed 2011 data and blue line appear dashed for the latest year, and should not be treated as final data.
Latest available data: 2011 (2012 estimated).
Source: EEA, 2013.
Related targets and monitoring
For the EU, transport GHG emissions are to be reduced by 20 % from 2008 levels by 2030 (+ 8 % against 1990 levels), and at least 60 % from 1990 levels by 2050. Shipping (international maritime bunkers) emissions are to be reduced by 40 % from 2005 levels by 2050 (EC, 2011). Both are monitored annually in TERM 02 indicator. In terms of total GHG emissions, the EU has committed to a 20 % reduction by 2020 (from 1990 levels). In addition to these targets, transport is an important non-emission trading scheme (non-ETS) sector in terms of GHG emissions. As such, Member States have the responsibility to reduce emissions through national policies (altogether by – 10 % against 2005 levels by 2020), as opposed to the sectors covered by the ETS (e.g. energy industries, industrial installations), where the emission reduction objective is to be achieved through an EU-wide trading scheme (– 21 % vs. 2005).
Key messages: The latest EEA preliminary estimations show that transport emissions, including aviation, fell by 2.3 % in 2012, following the reduction trend seen from 2008. In 2011, transport (including shipping and aviation) contributed 25 % of the total of GHG emissions in the EU-28. Emissions in 2011 were 25 %
EU-28 transport emissions of GHGs
above 1990 levels, despite a decline between 2008 and 2011. Emissions will, therefore, need to fall by 68 % by 2050 in order to meet the Transport White Paper target. International aviation experienced the largest percentage increase in GHG emissions from 1990 levels (+ 94 %), followed by international shipping (+ 48 %).
Emissions from international shipping declined between 2008 and 2010. However, GHG emissions from international aviation rose by almost 3 % in 2011, breaking the reduction trend seen since 2008.
Outside the EU-28, transport emissions in Turkey, excluding bunkers, have increased substantially by 82 % since 1990. In Switzerland, transport emissions (excluding shipping) have increased by 18 %, slightly below the EU-28 average, while in Norway and Iceland, emissions increased by 40 % and 53 % respectively, which are well above the EU-28 average.
Further information: Trends and projections in Europe 2013 — Tracking progress towards Europe's climate and energy targets until 2020 (EEA, 2013a), tracks progress towards GHG targets and includes some perspectives on the projected developments of transport GHG emissions until 2020, including description of national and EU policies. See also Box 2.11 Energy efficiency and specific CO2 emissions.
1990
1995
2000
2005
2010
2015
2020
2025
2030
2035
2040
2045
2050
0
200
400
600
800
1 000
1 200
GHG emissions (million tonnes)
Transport including international aviation International maritime transport
2030 target: 20 % transport GHG reduction compared to 2008
2050 target: 60 % transport GHG reduction compared to 1990
2050 target: 40 % maritime GHG reduction compared to 2005

Part A│TERM Core Set of Indicators
19A closer look at urban transport
Box 2.4 TERM 03: Transport emissions of air pollutants
Note: Latest available data: 2011.
Source: EEA, 2013.
Related targets and monitoring
Directive 2008/50/EC (EC, 2008) sets limit values (LVs) for the atmospheric concentrations of main pollutants, including sulphur dioxide (SO2), nitrogen dioxide (NO2), airborne particulate matter (PM10, PM2.5), lead, carbon monoxide (CO), benzene, and ozone (O3) for EU Member States. These limits are related to transport implicitly, but the introduction of progressively stricter Euro emission standards and fuel quality standards has led to substantial reductions in air pollutant emissions. Policies aimed at reducing fuel consumption in the transport sector to cut GHG emissions (see Box 2.3) may also help further reduce air pollutant emissions.
Iceland, Liechtenstein, Norway, Switzerland and Turkey are not members of the European Union and hence have no emission ceilings set under the National Emission Ceilings Directive (NECD) 2001/81/EC (EC, 2001). As well as most of the EU Member States, Norway and Switzerland have ratified the 1999 United Nations Economic Commission for Europe Convention on Long-range Transboundary Air Pollution (UNECE
Trend in emissions of air pollutants from transport in EEA-33
LRTAP) Gothenburg Protocol, which required them to reduce their emissions to the agreed ceiling specified in the protocol by 2010. Liechtenstein has also signed, but has not ratified the protocol.
Key messages: The general trend for decreases in air pollutant emissions from transport appears to have stabilised between 2010 and 2011 (in the case of SOX it has increased by 2.3 %, boosted by a 6.3 % increase in international aviation and more than 2 % rise for domestic and international shipping). Only non-methane volatile organic compounds (NMVOC) decreased by around 4.4 %. However, viewed over the past two decades, emissions of all transport air pollutants have significantly declined. The largest percentage decreases over this period have been for CO and NMVOC (both 78 %). However, increases in shipping activity since 1990 have offset reductions elsewhere, in particular for SOX but also for NOX and PM.
Further information: Box 2.5 Exceedances of air quality objectives due to traffic; and The contribution of transport to air quality (EEA, 2012).
1990
1991
1992
1993
1994
1995
1996
1997
1998
1999
2000
2001
2002
2003
2004
2005
2006
2007
2008
2009
2010
2011
0
20
40
60
80
100
120
Index 1990 = 100
CONMVOCSOX excl. international shippingPM2.5 NOXSOX

Part A│TERM Core Set of Indicators
20 A closer look at urban transport
Box 2.5 TERM 04: Exceedances of air quality objectives due to traffic
Annual mean NO2 concentration observed at traffic stations, 2011 (left) and annual mean PM10 concentration observed at traffic stations, 2011 (right)
Related targets and monitoring
For the EU, Directive 2008/50/EC (EC, 2008) on ambient air quality and cleaner air for Europe regulates ambient air concentrations of SO2, NO2, particulate matter (PM10 and PM2.5), lead, benzene, CO and O3.
EU limit values (LV) on concentrations of NO2 in ambient air (LVs had to be met by 1 January 2010):
• An annual mean LV for NO2 of 40 μg NO2/m3. • An hourly LV of 200 μg NO2/m3 not to be exceeded
more than 18 times in a calendar year.
EU limit values on concentrations of PM10 in ambient air (limit values had to be met by 1 January 2005):
• A LV for PM10 of 50 μg/m3 (24-hour average, i.e. daily), not to be exceeded more than 35 times in a calendar year.
• A LV of 40 μg/m3 as an annual average.
Key messages: The decrease in NOX emissions (29 %) from road traffic sources between 2002 and 2011 is considerably greater than the fall in NO2 annual mean concentrations (ca. 8 %) measured at stations close to traffic. This is attributed primarily to the increase in NO2 emitted directly into the air from diesel vehicles
Notes: The two highest PM10concentrationclasses(darkorangeandlightorange)correspondtothe2005annualLV(40μg/m3) andtoastatisticallyderivedlevel(31μg/m3) corresponding to the 2005 daily LV. The lowest class corresponds to the WHO air quality guideline for PM10of20μg/m3.
Source: AirBase v. 7.
(see Box 4.1) and to the increasing number of diesel vehicles in some cities in Europe. As a result, 5 % of the EU urban population live in areas where the annual EU LV and the WHO Air Quality Guidelines for NO2 were exceeded in 2011.
Road transport is significantly behind the most worrying air quality problems in cities. In addition to direct NO2 emissions, NOX is also promoting tropospheric O3 formation. Road transport in cities is also a substantial source of PM.
In 2011, the NO2 annual LV was exceeded at 42 % of the traffic stations. The annual LV was exceeded at 3 % of the urban background stations but only at one rural background station.
In 2011, the PM10 24-hour LV was exceeded at 43 % of traffic sites, 38 % of urban background sites, 26 % of 'other' sites (mostly industrial) and even at 15 % of rural sites within the EU (EEA, 2013).
The PM2.52010annualtargetvalue(25μg/m3) was exceeded in 2011 at 10 % of traffic sites, 18 % of urban background sites, 7 % of 'other' (mostly industrial) sites, and 5 % of rural sites.
Further information: Box 2.4; Chapter 4; EEA, 2012; and EEA, 2013.
!!!
!
!
!
!!
!!
!!!
!
!
!!
!
!
!
!!!!
!
!!!
!
!
!
!
!
!
!
!
!!
!!
!
!
!
!
!
!
!
!
!
!
!
!
!
!!
!
!
!!
!
!!
!
!
!
!
!
!!
!
!
!
!
!
!
!
!
!
!
!!
!
!
!!
!!!
!
!
!
!
!
!!! !
!!
!
!!!
!!
!
!
!
!!
!
!!
!!
!
!
!
!! !
!
! !
!
!
!
!!
!
!
!!
!!!!
!!
!!
!
!
!
!
!
!
!!
!
!
!
!
!
!
!
!
!
!!!
!!
!!
!
!
!
!
!
!
!
!
!
!!!!
!
!!
!
!
!!!!
!!
!
!
!
!
!!
!
!
!
!
!
!!!
!
!
!
!
! !
!
70°60°50°40°
30°
30°
20°
20°
10°
10°
0°
0°-10°-20°-30°
60°
50°
50°
40°
40°
30°
30°
0 500 1000 1500 km
!!!
-20°
30°
Canary Is. -30°
40°
Azores Is.
Madeira Is.
30°
20°
20°
10°
10°0°
!
!!!!
!!!!!
!!!!
!!!
!! !!!
!
!
!!
!!
!
!
!
!
!!
!!
!!!!!!
!
!!! !!!!
!!!
!!!!!!
!
!!
!!
!
!
!!
!
!
!
!
!!!
!
!!
!
!!!!!
!!!
!
!
!!
!!!!!
!!!!!!!
!
!!!
!!
!!!!!!
!! !
!
!
!
!!
!
!
!
!
!!!
!
!
!
!
!
! !
!!
!!
!
!
!
!
!
!
!
!
!!
!!!!!!
!
!
!!!
!!!!!!!!!
!!
!!!!!!!!!!!
!!!
!!!!
!!!
!!
!!!!!
!!!! !
!
!
!!!
!!!!!!
!
!! !!
!!!!
!
!
!!
!!!
!!!!
!!
!!
!!!
!!
!!
!!
!!!!!!!
!!
!
! !
!
!
!!
!
!
!
!
!
!!
!!!
!
!
!
!! !!
!
!
!
!
!
!
!
!!! !!
!!
!
!
!
!!
!!!
!
!
!!
!!!
!!
!
!
!
!!
!
! !
!
!!
!
!
!!
!
!!
!
!
!
!
!
!
!
!
!
!
!!
!!!!!
!
!!!!!!!
!
!
!
! !
!!
!!
!!
!!!!!
!!
!
! !
!!
!
!
!!!
!!!!!!!!!
!!
!
!
!
!
!
!
!
!
!
!!
!
!!!!
!!
!
!
!
!
!!
!
!!!!
!!
!
!!
!
!
!!
!
Annual mean NO2 concentration observed at traffic stations, 2011 (EEA-33)
≤ 20 20–40 40–45 > 45
Outside data coverage
µg/m3
No data
!
!!
!
!
!
!
!
!
!
!!
!!
!!
!
!
!
!!
!
!!
!
!
!
!
!
!
!
!
!
!
!
!
!
!
!
!
!
!
!!
!!!
!
!
!!
!
!!
!
!
!
!
!
!!
!
!
!
!!
!
!
!
!
!
!
!!
!
!
!
!
!
!
!!!!
!
!
!
!
70°60°50°40°
30°
30°
20°
20°
10°
10°
0°
0°-10°-20°-30°
60°
50°
50°
40°
40°
30°
30°
0 500 1000 1500 km
-20°
30°
Canary Is. -30°
40°
Azores Is.
Madeira Is.
30°
20°
20°
10°
10°0°
!!
!!!!!!
!!!!
!!!!
!!!!
!!!! !!!!
!
!
!
!
!!
!!!!!!
!!!!
!!
!
!!!!!
!!
! !!!
!!!!
!
!!
!
!
!
!
!!! !!
!!!
!!
!
!!!!!
!
!
!!!!!!!!
!
!!
!
!!
!!
!!
!!
!! !!
!
!!!
!!
!
!
!
!
!!!
!
!
!
!
!
!
!
!
!
!
!
!
! !
!!
!!!
!!
!
!!!!
!
!!!!
!!!!
!!!
!!
!!
!!
!
!!!!! !!
!!!
!!!
!
!!!
!!
!
!!!!
!!!!!
!
!! !!!!
!
!
!!
!
!!!
!!
!! !!
!
!!
!!!!
!
!!
!!!
!
!!!
!!!
!
!!
!!!
!
!
!!
!!
!!
!
!
!
!
!!
!!
!
!
!
!!
!
!
!
!!
!!
!!
!
!
!
!
!
!!
!
!
!
!
!
! !
!!
!
!!
!
!!!!!!!
!
!!!!
!!
!!!!
!
!
!
!
!
!! !
!!!
!!!!!!
!
!
!
!
!!
!
!!
!
!
!!!
!!
!
! !!!
!
! !!!
!
!
!
!!!!
!
!!!
!!! !!
!
!
!
!!
!
!
!
!
!
!
!!!
!!
!
!
!!
!
!
!!
!!
!!!
!
!
!!!!
!
!
! !
!!!
!
!!
!
!
!!
!
!
!!
!
!! !
!
!!
!
!! !!! !
!
!!!!
!
!!
!!!!!
! !
!!
! !
!!!
!
!
!!!!!!
!
!!
! !!
!!
!!
!
!!!
!
!
!
!
!!!!
!!
!!
!
!
!
!
!
!
!
! !
!!
!!! !
!!
!
!
!
!!!!!!!!!
!!!!!!
!
!
!
!
!!
!!
!
!
!
!!
!
!
!!!
!!
!
!
!
!!
!
!
Annual mean PM10 concentration observed at traffic stations, 2011 (EEA-33)
≤ 20 31–40 > 40
Outside data coverage
µg/m3 20–31
No data

Part A│TERM Core Set of Indicators
21A closer look at urban transport
Box 2.6 TERM 05: Exposure to and annoyance by traffic noise
Note: The figure provides information for those European capitals able to provide data for 2012.
Latest available data: 2012.
Source: EEA, 2013.
Related targets and monitoring
This indicator aims to gauge progress towards a reduction in the number of people exposed to and annoyed by traffic noise levels that endanger human health and degrade quality of life.
The main legislative instrument for assessing exposure to noise in the EU is Directive 2002/49/EC (EC, 2002) relating to the assessment and management of environmental noise. This requires not only noise mapping and action planning to reduce noise exposure from transport and industrial sources, but also the protection of quiet areas both inside and outside of cities. Data reported in accordance with this directive is essential in determining the impact of noise. Using the data, WHO has stated that at least one million healthy life years are lost each year due to road traffic noise in Europe (WHO/JRC, 2011). This is more than any air pollutant, except pollution made up of very fine particles. Exposure to noise at night is particularly damaging to human health. The WHO recommends a night time noise guideline for Europe of not more than 40 dB Lnight-outside (decibel (dB) night noise level outside at the façade) and an interim target level of not more than 55 dB Lnight-outside, where the guideline cannot be achieved in the short term.
Because the guideline level stipulated by WHO is not reflected in the directive, assessments cannot yet be made using data from the directive. It is possible, however, to assess the interim target level of 55 dB Lnight-outside. Where second round noise maps have been reported for major cities it is possible to analyse the percentage of the population in European capital
Percentage of people exposed to levels above the WHO interim target for night-time noise in Europe from road transport in 2012 (> 55 dB Lnight)
cities that are exposed to levels above the Interim Target. This data for 2012 is presented above.
In addition to this, the proposal for a 7th Environment Action Programme (COM(2012) 710 final) aims to ensure that by 2020 noise pollution in the EU has significantly decreased, moving closer to WHO recommended levels. This requires, in particular, implementing updated EU noise policy aligned with the latest scientific knowledge, and measures to reduce noise at source, including improvements in city design. An estimated 40 % of the EU's population live in urban areas with levels of noise at night above the recommended WHO levels.
Distance to targets: In 2012, a second round of noise mapping was due for completion. This was to have delivered data pertaining to more than 400 cities in Europe and to provide an update of the first round maps from 2007. Unfortunately, only about 40 % of the expected data have been reported at the time of writing. Therefore, a trend analysis is not yet possible.
Key messages: Noise from road traffic impacts heavily on our health. Although only about 40% of the expected data for 2012 has been reported, it is clear that at least 100 million Europeans are exposed to daily average road traffic noise levels that are detrimental to health according to the indicator on annoyance (> 55 dB Lden (weighted average day, evening, night)). The total numbers of exposure to rail and aircraft noise are lower, but not inconsiderable. One of the most effective ways to change this could be by noise reduction at source.
Further information: Noise Observation & Information Service for Europe http://NOISE.eionet.europa.eu.
0
5
10
15
20
25
30
35
40
45
Sofia
Luxe
mbo
urg
Paris
Tallin
nOslo
Dublin
Vien
na
Cope
nhag
en
Lond
on
War
saw
Bern
Helsink
i
Vilniu
s
Amste
rdam
Reyk
javík
Valle
ttaBe
rlin
%

Part A│TERM Core Set of Indicators
22 A closer look at urban transport
Box 2.7 TERM 12a/b: Passenger transport volume and modal split within the EU
Note: Figures on pkm travelled by air are only available as an EU-27 aggregate. Air pkm is a provisional estimate for domestic and intra-EU-27 flights. Figures for car, bus and rail are available, separately, for all EU-28 Member States. The sources used by DG MOVE (2013) include national statistics, the International Transport Forum, Eurostat as well as the EEA's own estimates. Passenger statistics data are mostly completed with estimates in order to have an indicative view of passenger transport demand. The estimation for 2012 has been calculated using the estimated 2012 energy consumption data from TERM 01 multiplied by the 2011 ratio of transport demand to fuel consumption.
Latest available data: 2011.
Source: DG MOVE, 2013.
Related targets and monitoring
In the EU, the majority of medium-distance passenger transport (50 % pkm over 300 km) should be by rail by 2050 (EC, 2011). A better indicator of the mobility in the medium range is currently under development by Eurostat.
Key messages: Between 2010 and 2011, passenger transport demand in the EU-27 increased by nearly 1 %, reaching a new all-time high, mainly attributed to a 10 % increase in aviation. Demand steadily increased between 1995 and 2009, but at a slower rate than GDP. The largest increases have been in air (66 %) and car (23 %) demand between 1995 and 2011. However, the economic recession led to a decline in 2009 and 2010 (0.1 %). The car dominates the land passenger transport share at 76 %, followed by air (9 %) bus and coach (8 %) and rail (6 %).
Passenger transport volume in the EU-27
Croatia experienced a 16 % increase in land passenger transport over the period 2001 to 2011. Land passenger demand, for the non-EU EEA member countries, also showed high growth. In particular, Turkey and Iceland at 53 % and 21 % respectively, compared to 7 % for the EU-28. Regarding the modal split, Switzerland's rail share has increased over the past decade, being around 18 % in 2011, by far the highest value within the EEA-33. Correspondingly, the share for car in Switzerland is below the EEA-33 average. Turkey has the highest modal share of bus and coach use within the EEA-33 although it declined from 60 % in 1995 to 44 % in 2011. Iceland and Norway have car shares well above the EEA-33 average at 89 % and 88 % respectively.
Further information: Freight and passenger transport demand and modal split (Chapter 3).
Billion passenger km (pkm)
Car Bus Rail Air
3 9304 372
4 630 4 693 4 762 4 789 4 866 4 832 4 822 4 608
499
517523 519 533 535 515 509 512
488351
371377 391 396 411 403 404 407
401
346
457
527 549 572 561 522 522 575556
0
1 000
2 000
3 000
4 000
5 000
6 000
7 000
1995 2000 2005 2006 2007 2008 2009 2010 2011 2012
4 608
488
401
556
Estim
ate

Part A│TERM Core Set of Indicators
23A closer look at urban transport
Box 2.8 TERM 13a/b: Freight transport volume and modal split within the EU
Note: Figures on tkm for air and maritime are only available as an EU-27 aggregate. Air and maritime tkm are provisional estimates for domestic and intra-EU-27 transport. Figures for road, inland waterways and rail are available separately for all EU-28 Member States. The sources used by DG MOVE (2013) include national statistics, the International Transport Forum, Eurostat as well as the EEA's own estimates. The 2012 estimation is calculated using the estimated 2012 energy consumption data from TERM 01 multiplied by the 2011 ratio of transport demand to fuel consumption. In the case of road and rail, the latest 2012 freight data available from Eurostat has been used.
Latest available data: 2011.
Source: DG MOVE, 2013.
Related targets and monitoring
In the EU, a total of 30 % of road freight over 300 km should shift to other modes such as rail or waterborne transport by 2030, and more than 50 % by 2050, facilitated by efficient and green freight corridors (EC, 2011). A better indicator of the mobility in the medium range is currently under development by Eurostat.
Key messages: Between 2010 and 2011, freight transport volumes in the EU-27 remained unchanged, approximately 8 % below the peak volumes experienced in 2007. However, the modal share changed slightly in favour of rail transport, the only mode to experience an increase in tkm between 2010 and 2011. Still, road transport dominates land freight transport at 76 %, followed by rail (18 %) and inland waterways (6 %). Fuel consumption data for 2012 suggests that overall freight transport volumes experienced another dip, falling back approximately to 2009 levels.
In the EU-13, land freight transport grew by 72 % between 2001 and 2011, with tkm more than doubling
Freight transport volume in the EU-27
in Bulgaria, Lithuania, Poland and Slovenia between 2001 and 2011. In contrast, demand in the EU-15 was 2 % lower in 2011 than in 2001. Remarkably, land tkm per capita is now slightly greater in Poland than in Germany and tkm per capita for the EU-13 is greater than for the EU-15.
Land freight transport growth in the non-EU EEA member countries has been higher than the EU-28 average at 33 % compared to 11 % (2001–2011). In terms of modal split, Norway's rail share is around the EU-28 average, while Turkey's is significantly lower at around 5 %. However, rail freight in Turkey has increased considerably, by 51 % between 2001 and 2011. In Iceland, all freight transport is by road. By contrast, in Switzerland 54 % is by road compared to 46 % by rail.
Further information: Freight and passenger transport demand and modal split (Chapter 3). See also TERM 2012 Box 3.1 (EEA, 2012) for more details on the modal split by distance classes which is more related to the White Paper target.
Road Maritime Rail Air
1 2891 519
1 794 1 848 1 914 1 8811 690 1 756 1 734 1 667
1 146
1 314
1 461 1 505 1 532 1 498
1 3361 415 1 408122
134
139138
145 145
130148 141
386
404
413435
448 440
361391 420
2
2
33
3 3
23 3
1995 2000 2005 2006 2007 2008 2009 2010 2011 2012
Inland waterways
1 667
0
500
1 000
1 500
2 000
2 500
3 000
3 500
4 000
4 500
Billion tonne km (tkm)
Estim
ate
1 263
137
4142

Part A│TERM Core Set of Indicators
24 A closer look at urban transport
Box 2.9 TERM 20: Real change in transport prices by mode
Note: Real change in passenger and freight transport prices by mode, relative to average consumer prices based on the United Nations (UN) Classification of individual consumption by purpose (COICOP). Passenger transport by road includes exclusively transport of individuals and groups of persons and luggage by bus, coach, taxi and hired car with driver.
Latest available data: 2012.
Source: Eurostat, 2013.
Related targets and monitoring
Transport prices are themselves important drivers of individual and business transport decisions, affecting transport growth and modal split development, and can lead to changes in distribution management, location decisions and spatial planning.
The prices of transport services are the result of, on the one hand, autonomous market developments such as vehicle and logistics technology. However, on the other hand, they are influenced by government interventions such as taxation, infrastructure provision, regulation, and subsidies. Through these interventions, governments can cause price levels that reflect the external costs associated with different forms of transport. This may result in a shift between
Real change in transport prices by mode in the EU-27
modes. Monitoring changes in transport prices by mode is considered a relevant variable to assess whether the system is providing economic incentives for a modal shift.
Key messages: From the reference point of 2005 until 2012, the purchase price of motor cars has steadily reduced in comparison to average consumer prices. Over the same period the cost of fuel (covered under the operation of personal transport equipment) has increased, as has passenger transport by other modes — air, bus, rail and water. Air transport prices reached 2005 levels in 2010 but then increased significantly the following two years.
Further information: Box 2.10: Fuel tax rates.
80
85
90
95
100
105
110
115
120
125
130
1996 1997 1998 1999 2000 2001 2002 2003 2004 2005 2006 2007 2008 2009 2010 2011 2012
EU-27 index (2005 = 100)
All transport Purchase of motor cars
Operation of personal transport equipment Passenger transport by railway
Passenger transport by road Passenger transport by air
Passenger transport by sea and inland waterway

Part A│TERM Core Set of Indicators
25A closer look at urban transport
Box 2.10 TERM 21: Fuel tax rates
Note: Some Member States have higher tax rates for fuels with sulphur content > 10 parts per million (ppm) or biofuel shares below a given threshold.
Source: DG TAXUD, 2013.
Related targets and monitoring
Fuel taxes are seen as a useful signal of the 'internalisation' of external environmental costs, since fuel consumption is an excellent proxy for GHG emissions produced by transport use.
For the EU, the White Paper on Transport (EC, 2011) indicates that motor fuel taxation should be revised to take account of the energy and CO2 component. Guidelines will be developed for the application of internalisation charges, covering the social costs of congestion, CO2 (if not included in fuel tax), local pollution, noise and accidents.
A 2011 proposal for a revised Energy Taxation Directive setting minimum tax rates according to fuel energy content and CO2 emissions would have required minimum excise duties for diesel to increase from currently EUR 330 to around EUR 390 per 1 000 litres while petrol would have remained at around EUR 360 per 1 000 litres. In the longer term, by 2023, the proposal would have also required Member States to adapt to fuel neutral taxation, requiring diesel duties per litre to be some 10 % above petrol duties to account for the higher energy and carbon content.
Key messages: The price of fuel is an important determinant of the demand for transport and the
Road fuel excise duties in the EU-28 (situation as of July 2013)
efficiency with which fuel is used. However the evolution of fuel prices has not fully countered growth in transport demand. Methods to incorporate price internalisation have not significantly changed, with recent fuel price increases attributed to the rise in the price of base oil. The price per litre of Euro-Super 95 has increased 40 % without taxes over the past three years (since September 2010) and 22 % with taxes (excise duty and other indirect taxes plus Value Added Tax (VAT)) (DG ENER, 2013). The excise duty for LPG remains significantly lower per megajoule than petrol and diesel and varies significantly among countries (from EUR 497 per 1 000 kg in Denmark to EUR 108 per 1 000 kg in France or being completely exempt in Belgium and Finland).
In May 2013, the weighted average share of taxes and duties on fuel prices in the EU-15 was 57 % for unleaded petrol and 51 % for diesel. In the EU-13 shares were 50 % and 46 %, respectively. In the EU-28, the gap in the taxation per unit of energy between petrol and diesel fuel has slightly narrowed in recent years: the amount of taxes paid per MJ of diesel is now 73 % of the amount of taxes per MJ of petrol, up from 69 % in 2010 (Calculated from DG ENER, 2013; and Eurostat, 2013).
Further information: Box 2.9: Real change in transport prices by mode.
0
100
200
300
400
500
600
700
800
EUR/1 000 litres road fuel
Petrol Diesel
Croa
tia
Esto
nia
Denmar
kMalt
a
Bulga
ria
Greec
e
Cypr
us
Luxe
mbo
urg
Irelan
d
Slove
nia
Nethe
rland
s
Unite
d King
dom
Roman
ia
Latvia
Lithu
ania
Finlan
d
Belgi
um
Czec
h Re
publi
cSp
ain
Hunga
ryIta
ly
Austr
ia
Portu
gal
German
y
Polan
d
Fran
ce
Swed
en
Slov
akia

Part A│TERM Core Set of Indicators
26 A closer look at urban transport
Box 2.11 TERM 27: Energy efficiency and specific CO2 emissions
Note: Latest available data: 2012.
Source: EEA, 2013c; and EEA, 2013d.
Related targets and monitoring
The EU target for average passenger car emissions is 130 g CO2/km for the new car fleet by 2015, and 95 g CO2/km from 2020 onwards (average emissions of CO2 for the new passenger cars sold in the EU EC Regulation, 443/2009). The target for vans is 175 g CO2/km by 2017 (phased in from 2014) and 147 g CO2/km by 2020 (average emissions of CO2 for the new vans sold in the EU Regulation, 510/2011). Average emissions of CO2 for the new car fleet have been monitored annually by the European Commission for over a decade, but such data are not available for vans. The first annual European Commission monitoring data on the average emissions of CO2 for the new van fleet were published in 2013 (EEA, 2013d).
Key messages: CO2 emissions from the new passenger car fleet in the EU-27 decreased by 3.5 g CO2/km between 2011 and 2012, from 136 g to 132 g. If this reduction rate continues, the passenger car fleet will meet the 130 g CO2/km target for 2015 more than a year early but will fall short of meeting the 95 g target by 2020. Annual reduction rates between 2008 and 2012 have been decreasing.
It had previously been estimated that average CO2 emissions from new vans decreased from
Average emissions (g CO2/km) for new cars (left) and vans (right) in the EU-27
203 g CO2/km in 2007 to 181 g CO2/km in 2010 (TNO et al., 2012). The first provisional EC monitoring data for the year 2012 show a van fleet average of 180 g CO2/km. Therefore, significant progress will have to be made in order to achieve the target of 147 g CO2/km by 2020.
Recent agreements in the European Union have called for the emissions testing procedures to be updated, as soon as possible, to bring in the new worldwide harmonised light duty testing procedure (WLTP). This is expected to help address the current problem of a gap between the official homologated fuel consumption figures and those typically achieved under real-world driving conditions. According to the International Council of Clean Transportation (ICCT) the average discrepancy between type-approval and on-road CO2 emissions has increased considerably over the last decade, being below 10 % in 2001, but increasing to around 25 % by 2011 (ICCT, 2013). In any case, although real world emissions are higher, the visible deployment of CO2 reducing technologies means that a substantial share of the reductions in CO2 emissions has taken place.
Further information: Box 2.3: Transport emissions of GHGs.
g CO2/km
Average CO2 emissions from new passenger cars
2020 target for new passenger cars (95 g CO2/km)
2015 target for new passenger cars (130 g CO2/km)
2010
2011
2012
2013
2015
2017
2019
2014
2016
2018
2020
2010
2000
2002
2004
2006
2008
2012
2014
2016
2018
2020
g CO2/km
Average CO2 emissions from new vans
2020 target for new vans (147 g CO2/km)
2017 target for new vans (175 g CO2/km)
60
80
100
120
140
160
180
200
60
80
100
120
140
160
180
200

Part A│TERM Core Set of Indicators
27A closer look at urban transport
Box 2.12 TERM 31: Share of renewable energy in the transport sector
Note: * data are preliminary; Eurostat's estimates (ESTAT 'Shares 2011' database).
For a consistent comparison across years, this graph provides two different sets of values, as follows:
- On the left, the renewable energy sources in transport (RES-T) share (%) accounting only for biofuels complying with RED sustainability criteria (which is only possible from 2010 onwards).
- On the right, the RES-T share (%) including all biofuels consumed in transport.
In accordance with the RED, renewable electricity in electric road vehicles was accounted for 2.5 times the energy content of the input of electricity from RES and the contribution of biofuels produced from wastes, residues, non-food cellulosic material, and ligno-cellulosic material was considered twice that of other biofuels.
Latest available data: 2011.
Source: EEA based on Eurostat, 2013.
Related targets and monitoring
For each EU Member State, 10 % of the energy consumed in the transport sector must be renewable by 2020 (RED, 2009/28/EC). Only biofuels complying with the sustainability criteria under the RED are to be counted towards this target and therefore proper monitoring is only possible from 2010 (see the graph on the left). In addition, to stimulate the
% share of renewable energy consumed in transport by country, including only those biofuels compliant with the Renewables Directive (left) and all biofuels consumed in transport (right)
growth of certain shares of renewable energy sources in transport, renewable electricity in electric road vehicles is accounted for 2.5 times the energy content of the input of electricity from renewable energy sources, while the contribution of biofuels produced from wastes, residues, non-food cellulosic material, and ligno-cellulosic material is considered twice that of other biofuels. Nevertheless, the 10 % target is expected to be met primarily through biofuels.
0 2 4 6 8 10
SwitzerlandTurkeyCyprusMalta
CroatiaDenmarkEstonia
Belgium *BulgariaFinlandPortugalSlovakiaFrance
Czech RepublicGreece
LuxembourgRomaniaSloveniaIreland
United KingdomLithuaniaNorwayHungary
NetherlandsItaly
LatviaSpain
GermanyPolandAustriaSwedenEU-28
2010 RES-T (%)2011 RES-T (%)
2020
tar
get
0 2 4 6 8 10
2011 RES-T (%) 2010 RES-T (%)
2005 RES-T (%)

Part A│TERM Core Set of Indicators
28 A closer look at urban transport
Box 2.12 TERM 31: Share of renewable energy in the transport sector (cont.)
Bi-annual reporting on progress towards RED targets is required by EU Member States from 31 December 2011.
Low carbon sustainable fuels in aviation are to reach 40 % by 2050 and EU CO2 emissions of maritime bunker fuels by 40 % (if feasible 50 %) on 2005 levels (EC, 2011). Fuel suppliers are to reduce emissions of GHGs by 6 % to 10 % by 2020 relative to 2010 fossil fuels (Fuel Quality Directive 2009/30/EC). It is anticipated that this will be monitored in the future and included in TERM 31 indicator.
Key messages: For 2011, Eurostat published for the first time the share of biofuels in transport energy use, which meet the sustainability criteria of the RED. This is despite the fact that the systems for certifying sustainable biofuels were not yet fully operational in a number of Member States. The average EU-28 share of renewable energy consumed in transport increased between 2010 and 2011 from 3.5 % to 3.8 %, including only those biofuels which met the sustainability criteria. The consumption of energy from renewable sources would have been much closer to the 5.75 % target set in the original Biofuels Directive (2003/30/EC) when all biofuels are
taken into account, as its share is 5.1 % in 2011. The difference between nominal biofuel share and biofuel share meeting the RED criteria is most notable for France, Portugal and Slovakia. Despite these countries having some of the highest biofuel shares in Europe, only a small fraction of these meet the sustainability criteria.
The use of renewable electricity in road transport has doubled from 2010 to 2011, but it is very low (13 ktoe in 2011) compared to the amount of biofuels consumed in transport (13 730 ktoe in 2011). Rail use of renewable electricity keeps rising at a stable pace, 10 % from 2010 to 2011, reaching 1 300 ktoe in 2011.
Examining the non-EU countries, Switzerland and Turkey have only a very small biofuel share, although more than 50 % of electricity in Switzerland is from renewable sources. Furthermore, virtually the entire rail network is electrified in Switzerland and it achieves a much higher share for rail use for both passenger and freight transport than the EU-28 average, see Boxes 2.6 and 2.7
Further information: Box 2.2: Transport final energy consumption by fuel.

Part A│TERM Core Set of Indicators
29A closer look at urban transport
Box 2.13 TERM 34: Proportion of vehicle fleet by alternative fuel type
Note: Croatia data will be included from 2014 (number of registrations in 2013).
Latest available data: 2012.
Source: EEA, 2013.
Related targets and monitoring
There are no specific targets for the percentage of the vehicle fleets that use alternative fuels, but the European Commission aims for European cities to be free of conventionally fuelled cars by 2050 (EC, 2011), to be measured by pkm in urban areas.
For both conventional and alternatively-fuelled vehicles, Euro 6 emission standards will begin to be introduced from 2013 for Heavy Goods Vehicles (HGVs), buses and coaches, from 2014 for passenger cars, and from 2015 for light duty vehicles. These will reduce pollutant emissions, especially emissions of PM and NOX.
Key messages: Changes in economic incentive schemes contributed to a significant drop in 2010 and 2011 LPG registrations in France and Italy, but they are increasing again. Pure electric vehicles currently comprise only 0.04 % of the total fleet and latest data shows that their share in EU-27 new car registrations is 0.1 % (being LPG 1.3 % and CNG 0.5 %). However, the number of registrations in the EU-27 has grown by 61 % in 2012, continuing the increasing path seeing from 2008. France leads with 5 650 pure electric vehicles sold in 2012, followed by Germany with 2 809.
Countries with targeted measures (which include Denmark, France, Germany, Ireland, Norway and Sweden,) have seen the greatest take up. In 2012, more than 4 000 electric vehicles were registered in Norway, accounting for 3 % of new vehicle registrations (Malvik et al., 2013). Measures include exemption from one off purchase tax (making the cost comparable with conventional vehicles); exemption from 25 % VAT, and use of bus lanes.
Car stock data availability is scarce for some countries (France, the United Kingdom) and not available for others (i.e. Denmark). The percentage of car stock by alternative fuel type varies between countries and responds to specific circumstances rather than to a pattern among groups of countries (EU-15 or EU-13). Within the EU-28, Poland has the highest share (16 % share in 2011, remaining around this level since 2005). Italy follows with a 7 % share while the Netherlands and Croatia have 4 % and 3 % respectively. LPG vehicles dominate and only the Netherlands have a significant amount of electric vehicles (70 000 in 2011, steadily increasing since 2004). Of all EEA member countries Turkey has the highest share of alternatively-fuelled vehicles, with 40 % of cars running on LPG.
Further information: Box 2.11 Energy efficiency and specific CO2 emissions.
0
100
200
300
400
500
600
2000 2001 2002 2003 2004 2005 2006 2007 2008 2009 2010 2011 2012
Thousand vehicles
BiodieselDual fuelEthanol ElectricLPG NGTotal alternative fuel
Number of car registrations by alternative fuel type in the EU-27

30
Part A│Freight and passenger transport demand and modal split
A closer look at urban transport
3 Freight and passenger transport demand and modal split
Key messages
• Freight transport demand in the EU-28 stabilised in 2011, after an increase in 2010, and road continues to be the dominating mode.
• Passenger transport demand was static in 2011. Latest data suggest a stabilisation of car passenger transport demand in the EU-15. Cars dominate at over 80 % of land transport demand in the EU-28.
• Passenger air transport remains the second highest modal share in the EU-28 (excluding Croatia) (2) at almost 9 %.
• In the EU-13, car and road freight modal shares are rapidly converging to EU-15 levels.
(2) Data for aviation and international maritime transport are only available as an EU-27 aggregate (EU-28 excluding Croatia) and are not available on an individual country-by-country basis.
3.1 Introduction
This chapter analyses the levels of passenger and freight transport demand across Europe. Transport demand, and the modes and fuels used to meet this demand, largely determine the resulting environmental impacts. The chapter summarises and assesses the available data on transport demand for road, rail, air and sea and its relationship with GDP. The concept of decoupling refers to breaking this link or, in other words, achieving economic growth without increasing transport demand (environmental pressures) and related impacts. The fact that data are available for land transport in Croatia but not available for aviation and international maritime is highlighted where appropriate.
The data show that over the past decade for the EU-28 there is no absolute decoupling of transport demand from GDP. Transport demand has increased alongside rising incomes, albeit at a slower rate (known as relative decoupling). Freight demand (tkm) has greater relative decoupling than passenger demand (pkm). For the EU-15, there is clear, relative, decoupling of GDP when it comes to car use. For the EU-13, transport growth is outstripping economic growth, reflecting the emergence of, and growth in, these economies. It is worth remembering that data for international road freight transport are declared
on the basis of the nationality of the haulier, regardless of where this activity is being performed.
3.2 Freight transport
Freight transport demand by road, rail, ship and air within the EU-28 showed an upward trend throughout the 1990s and early 2000s up to the onset of the recession, growing by 20 % between 2000 and 2007. Between 2007 and 2009, freight volumes fell back to levels previously seen in mid-2003. Between 2009 and 2011, they grew again, yet total tkm in 2011 were still around 8 % lower than in 2007. The estimate for 2012, based on fuel consumption data and latest road and rail data as a proxy, suggests that freight transport demand may have fallen again in 2012. Growth in land freight transport demand (road, rail and inland waterways) in each of the four non-EU EEA member countries was above 20 %, significantly exceeding the EU-28 average of 12 %.
Road haulage accounted for 76 % of total inland freight movements within the EU-28 in 2011. Total road freight volumes in 2011 were below their pre-recession peak in 2007 but still 15 % higher than in 2000. Road freight demand varies across EU Member States. Road freight transportation fell by around 2.3 % in the EU-15 but grew by around 2.1 % in the EU-13 between 2010 and 2011. For the EU-15,

Part A│Freight and passenger transport demand and modal split
31A closer look at urban transport
Figure 3.1 Freight transport volumes and GDP
Note: * only road.
Source: DG MOVE, 2013.
Freight transport demand has largely grown in line with GDP at the EEA-33 level (excluding Croatia and Liechtenstein).The decoupling effect between freight demand and GDP seen during the recession reversed in 2010. Transport demand per Euro of GDP generated increased by 2.8 %. Figures for 2011 show a return to decoupling and estimates for 2012, based on proxy data, suggest even stronger decoupling, with transport demand falling and GDP stagnating.
Splitting these results at the EU-15 and EU-13 level, just for road freight transport, it is clear that there are distinct differences. For the EU-15, a decoupling of freight transport demand from GDP has been achieved in all but one year since 2004. However, for the EU-13, the reverse is true with freight transport demand growing faster than GDP every year except 2009 and 2011. Data for international road freight transport are declared here on the basis of the nationality of the haulier, regardless of where this transport is being performed.
Note: * road, rail and inland waterways.
The two lines in the main graph show the development in real GDP and freight transport volumes in the EEA-33 (excluding Croatia and Liechtenstein), while the columns show the level of annual decoupling. A positive value on the columns indicates higher growth in GDP than in freight transport (i.e. decoupling), while a negative value indicates higher growth in freight transport than in GDP. The data refer to road, rail and inland waterways modes of transport.
Source: DG MOVE, 2013.
70
80
90
100
110
120
130
1995
1996
1997
1998
1999
2000
2001
2002
2003
2004
2005
2006
2007
2008
2009
2010
2011
2012
– 15
– 10
– 5
0
5
10
15Transport volume * and GDP index (2005 = 100)
Transport volume *and GDP index (2005 = 100)
Transport volume * and GDP index (2005 = 100)
Decoupling (%)
Decoupling tkm GDP
Estim
ate
5060708090100110120130140150
– 25– 20– 15– 10– 5
05
10152025
1995
1996
1997
1998
1999
2000
2001
2002
2003
2004
2005
2006
2007
2008
2009
2010
2011
Decoupling (%)
EU-15 decoupling of road tkm
Decoupling tkm road GDP
EU-13 decoupling of road tkm
5060708090100110120130140150
– 25– 20– 15– 10– 5
05
10152025
1995
1996
1997
1998
1999
2000
2001
2002
2003
2004
2005
2006
2007
2008
2009
2010
2011
Decoupling (%)
Decoupling tkm road GDP
EEA-33 excluding Croatia and Liechtenstein

Part A│Freight and passenger transport demand and modal split
32 A closer look at urban transport
Figure 3.2 Freight modal split between road and rail
Two decades ago, the share of rail freight transport in the EU-13 was very high, exceeding the road freight share. However, the rail freight share of the road/rail total has been in decline since the 1990s falling to 24 % in 2009.
In 2010–2011, there appears to have been a slight recovery with the EU-13 rail freight share up to 26 %. The rail freight share in the EU-13 thus still remains significantly higher than in the EU-15 where it increased from 15 % to 17 % between 2009 and 2011. Over the longer term, the share of rail freight has remained fairly stable in the EU-15.
Source: DG MOVE, 2013.
0
10
20
30
40
50
60
70
80
90
Road EU-13 Road EU-15 Road EU-28
Rail EU-13 Rail EU-15 Rail EU-28
%
1995
1996
1997
1998
1999
2000
2001
2002
2003
2004
2005
2006
2007
2008
2009
2010
2011
road freight demand differs widely depending on the Member State. For example, a 30 % decline was recorded in Greece between 2010 and 2011, while volumes in Germany grew by 3.4 %.
In the EU-13, Bulgaria (9 %), Latvia (15 %) and Lithuania (11 %) show particularly high growth rates. In 2010 Poland replaced Spain as the country with the second largest road freight volumes after Germany.
In the non-EU EEA member countries, the shares of road and rail transport freight transport demand are varied; inland waterways do not play any role. Switzerland has high rail share (46 %) while in Iceland all freight transport is by road. Rail shares in Turkey and Norway are 5 % and 16 %, respectively.
Rail freight volumes in the EU-28 remained fairly stable during the 1990s but grew roughly in line with overall freight volumes between 2002 and 2007.
Most of this growth occurred in the EU-15, which saw a 19 % increase. All EEA member countries experienced steep declines during the economic recession; in 2009, overall rail freight volumes were almost 20 % lower than during the peak in 2007. Between 2009 and 2011, volumes recovered. In 2011, rail freight volumes were only 6 % lower than in 2007. In fact, rail is the only mode that has experienced an increase in tkm between 2010 and 2011.
Maritime freight transport makes up 38 % of the total freight transport demand in EU-28 Member States (excl. Croatia; DG MOVE, 2013). The modal share has remained fairly stable at that level since 1995, meaning that growth in demand for maritime transport has been broadly in line with overall freight transport growth rates. Maritime transport peaked in 2007, but declined in the following two years due to the recession. Volumes increased again in 2010 and remained broadly unchanged in 2011 at around 8 % below the 2007 peak.

Part A│Freight and passenger transport demand and modal split
33A closer look at urban transport
3.3 Passenger transport
Total passenger transport demand (pkm) including road, rail, air and sea in the EU-27 increased by 11 % between 2000 and 2011 (DG MOVE, 2013). However, an estimate based on 2012 fuel consumption data suggests that passenger transport demand may have declined between 2011 and 2012. In all non-EU EEA member countries, growth in road and rail pkm was above EU-28 average. In Turkey, pkm in 2011 was almost 1.5 times higher than in 2000. In Iceland, pkm grew by 27 % and in Norway and Switzerland by between 17 % and 18 %, respectively.
In terms of land-based passenger transport, from 2000 to 2011, growth in the EU-15 Member States was 6 % and in the EU-13 30 %. However, from 2008 onwards there has been little land passenger transport growth, across all modes, both in the EU-15 and the EU-13 Member States. In terms of contributions from different modes, there are also differences between the EU-15 and the EU-13 Member States.
Car pkm demand in the EU-15 increased by only 5 % over the 2000 to 2011 period, and actually fell 1.4 % between 2009 and 2011. This reflects the stabilisation of car demand in western Europe (and the United States) which has been the subject of much research (Newman and Kenworthy, 2011; Puentes and Tomer, 2008 and Le Vine et al., 2009).
In contrast, car pkm in the EU-13 rose by 53 % between 2000 and 2011. This strong growth is due to the much lower levels of car ownership and use compared to the EU-15 at the start of this period, combined with strong GDP growth. Accession to the EU has also made it easier to import second hand vehicles from neighbouring countries.
Overall, car journeys are by far the dominant mode accounting for over 80 % of EU-15 and EU-13 land pkm, and 73 % of all internal EU-28 pkm, including land, air and sea (excluding Croatia). In Norway and Iceland, the car's modal share is close to 90 % of land passenger transport.
Regarding growth in rail and bus passenger demand there are strong differences among EEA member countries. For rail, growth was 17 % for the EU-15
over the 2000 to 2011 time period with France and the United Kingdom accounting for the greatest increases in rail pkm. In contrast, in the EU-13 rail pkm decreased by 27 % over the same period. The modal share of rail in passenger land transport declined continuously, from 13 % in 1995, to 10 % in 2000 to 5 % in 2011. Switzerland has the highest rail mode share in the EEA-33. It increased from around 14 % to around 18 % between 2000 and 2011.
EU-15 Member States have invested heavily in high-speed rail (HSR) since 2000, increasing track capacity by over 150 %, resulting in an increase in pkm by HSR of almost 80 % (DG MOVE, 2013). Despite the growth in pkm the modal share of rail transport (relative to total land transport) in the EU-15 has remained fairly stable at around 7 % over the past decade (6.7 % in 2000 to 7.3 % in 2011).
Air transport is the sector with the greatest growth over the period 2000 to 2011, increasing by 25 % in the EU-27 (DG MOVE, 2013). Aviation in the EU showed annual increases of between 3.5 to 4 % until the recent economic recession. However, total passenger kilometres fell by nearly 9 % between 2007 and 2009. In 2011, it saw strong growth again and reached similar levels to 2007. However, in 2012, the number of flight movements in the EU-27 decreased by 3 % and are forecast to decrease by a further 0.5 % to 3.6 % in 2013 (Eurocontrol, 2013). It therefore seems likely that air passenger kilometres will also have dropped. However, despite the recent slow-down, positive growth rates of between around 1 % and 3.5 % per year are forecast from 2014 onwards (Eurocontrol, 2013).
At the EU-27 level GDP and passenger transport demand grew at similar rates. However, developments in the EU-15 are quite different to the EU-13. In the EU-15, greater relative decoupling occurred for car use, with GDP growing faster than car transport demand. This is linked, in part, to modal shift — demand for rail grew faster than GDP. In contrast, in the EU-13, there has been little or even negative decoupling with car pkm and GDP growing at similar rates over the past 15 years. However, while EU-13 GDP fell between 2008 and 2009 car pkm kept increasing. Therefore, in recent years, between 2008 and 2011, car pkm per Euro of GDP in the EU-13 was higher than during the late 1990s.

Part A│Freight and passenger transport demand and modal split
34 A closer look at urban transport
Figure 3.3 Trends in passenger transport demand and GDP
Note: * only passenger car transport volumes.
Source: DG MOVE, 2013.
Note: * road, rail and inland waterways.
Source: DG MOVE, 2013.
Prior to the recession, demand for passenger transport among EEA-33 countries was growing. However, the increase was generally less than the increase in GDP, resulting in relative decoupling of passenger transport demand from GDP.
For the EU-27, as GDP declined between 2008 and 2009 passenger transport demand remained static, leading to a temporary reversal in the decoupling trend. Data for 2010 and 2011 again show some decoupling as GDP grew whereas demand stagnated. Estimates based on proxy data suggest a stronger decoupling in 2012.
Differences between the EU-15 and EU-13, and the role of different modes should also be taken into consideration. Between 2000 and 2011, passenger transport growth was almost 32 % in EU-13 states — more than five times greater than that for the EU-15 Member States (6 %). This was driven by increases in car pkm which grew 53 % while bus and rail use declined. This indicates an increase in car pkm per unit of GDP in the EU-13 (see graphs below) reflecting the rapid motorisation and modal shift from public transport to passenger cars.
EU-15 decoupling of car pkm EU-13 decoupling of car pkm
Decoupling (%)
70
80
90
100
110
120
130
1995
1996
1997
1998
1999
2000
2001
2002
2003
2004
2005
2006
2007
2008
2009
2010
2011
2012
– 15
– 10
– 5
0
5
10
15Transport volume * and GDP index (2005 = 100)
Transport volume * andGDP index (2005 = 100)
Transport volume * andGDP index (2005 = 100)
Decoupling (%)
Decoupling pkm GDP
Estim
ate
5060708090100110120130140150
– 25– 20– 15– 10– 5
05
10152025
199519
9619
9719
9819
9920
0020
0120
0220
0320
0420
0520
0620
0720
0820
0920
1020
11
Decoupling (%)
Decoupling pkm car GDP
50
60708090100110120130140150
– 25– 20– 15– 10– 5
05
10152025
199519
9619
9719
9819
9920
0020
0120
0220
0320
0420
0520
0620
0720
0820
0920
1020
11
Decoupling pkm car GDP
EEA-33 excluding Croatia and Liechtenstein
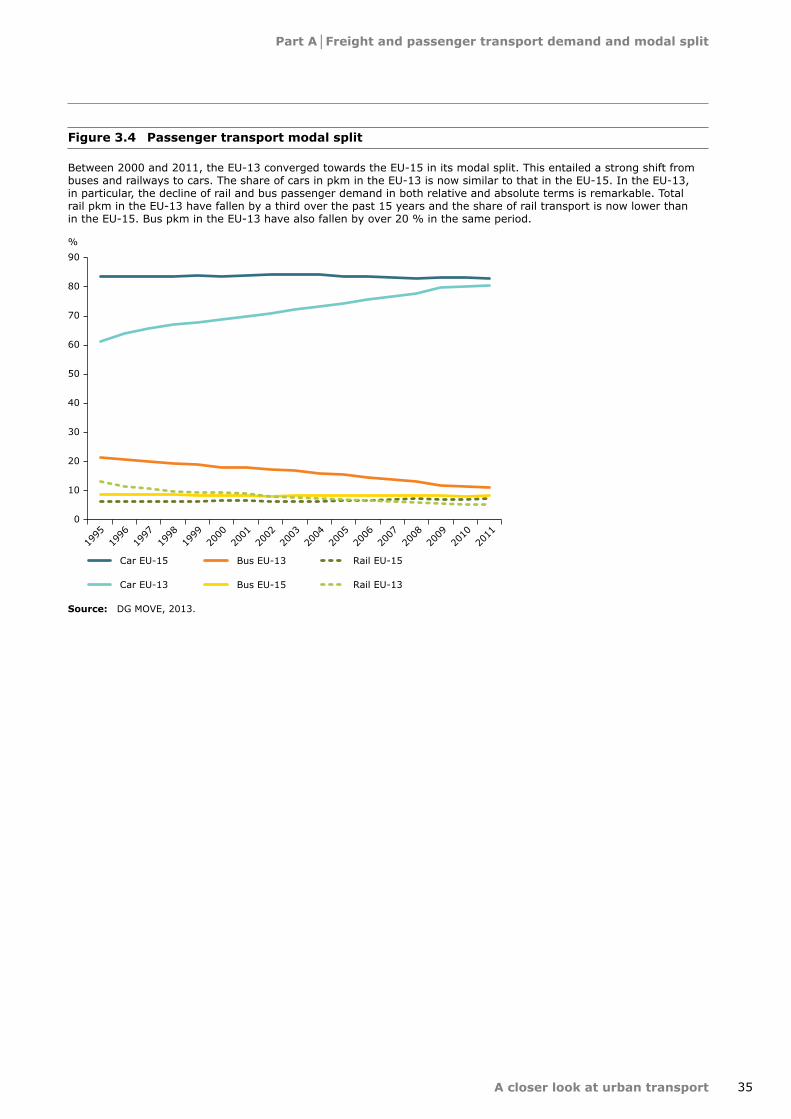
Part A│Freight and passenger transport demand and modal split
35A closer look at urban transport
Figure 3.4 Passenger transport modal split
Between 2000 and 2011, the EU-13 converged towards the EU-15 in its modal split. This entailed a strong shift from buses and railways to cars. The share of cars in pkm in the EU-13 is now similar to that in the EU-15. In the EU-13, in particular, the decline of rail and bus passenger demand in both relative and absolute terms is remarkable. Total rail pkm in the EU-13 have fallen by a third over the past 15 years and the share of rail transport is now lower than in the EU-15. Bus pkm in the EU-13 have also fallen by over 20 % in the same period.
0
10
20
30
40
50
60
70
80
90
Car EU-15
Car EU-13
Bus EU-13
Bus EU-15
Rail EU-15
Rail EU-13
%
1995
1996
1997
1998
1999
2000
2001
2002
2003
2004
2005
2006
2007
2008
2009
2010
2011
Source: DG MOVE, 2013.

36
Part B│Why is urban transport relevant for the environment?
A closer look at urban transport
Part B: A closer look at urban transport 4 Why is urban transport relevant for the
environment?
Key messages
• Urban transport plays a key role in economic and societal terms.
• However, there are a number of associated potential, negative, environmental and quality-of-life impacts including air quality and noise pollution, road accidents, and its contribution to climate change.
• Road transport, and particularly diesel vehicles, is a major emitter of PM and NOX in cities, leading to a high proportion of population being exposed to air pollutant levels above EU and WHO air quality standards.
• EU policies seek to work together with national and local ones to address these impacts.
4.1 Transport's role in the economic and social aspects of urban areas
Urban areas play a vital economic role, with around 85 % of the European Union's GDP generated in cities (EC, 2009c). More than 74 % of the EU-27 population live in urban areas which allows for easier access to jobs and social opportunities (DG MOVE, 2013). The UN predicts that this figure will rise to over 80 % by 2030 (Rodrigue & Notteboom, 2013). Therefore, a significant proportion of total mobility, i.e. overall passenger and freight trips, is increasingly being concentrated in European cities.
Transport systems have the potential to help provide multiple social and economic opportunities and benefits, including better accessibility to markets, such as those focusing on employment and investment opportunities. Urban citizens have a greater reliance on public transport, with congestion often making private transportation less convenient. Demand patterns in terms of accessing goods and services are influenced by the availability of transport options (ITAS/ KIT, 2012).
An efficient urban transport system is a key competitive factor in attracting investment, in which innovative cities will take the lead (Symbiocity, 2013). In urban environments, transport effectiveness and efficiency not only affect local and regional productivity rates, they also have an impact on citizens' quality of life (Albalate & Bel, 2009).
Clearly, walking and cycling are forms, or modes, of transport. Efforts on improving cycling and pedestrian facilities have proven to be effective and efficient when serious planning measures have been implemented.
Prioritising non-motorised modes in urban environments not only has major advantages in terms of accessibility and economic activity, it also improves social equity and it is certainly a crucial aspect in improving urban quality of life. The type of environment also influences the accessibility of public transport too, as people will be more willing to use these modes if it is safe, convenient and pleasant to walk or cycle to public transport interchange hubs. This is especially true if it includes facilities for these modes, such as appropriate cycle parking. Combining a package of measures has proven to be efficient.
4.2 Urban transport and quality of life
Urban living offers a wealth of social and cultural opportunities, and urban transport provides access to them, as well as to work and training. However, transport can also have a negative impact on the quality of life. Key impacts relate to health and the environment, for example noise, road safety and air pollution (the latter is considered in detail in Section 4.3). There are also wider impacts relating to well-being, including congestion and associated stress and social exclusion. Different cities prioritise accessibility by different modes which, in turn, affect quality of life and environmental impacts.

Part B│Why is urban transport relevant for the environment?
37A closer look at urban transport
4.2.1 Noise
Traffic exposes half of the EU's urban population to noise levels above 55 dB (see Box 2.6). In most cities, more than half of respondents agreed that noise was a major problem in their city — this proportion ranged from 51 % in Rotterdam and Strasbourg to 95 % in Athens (EC, 2010). Freight traffic can make a significant contribution, accounting for 40 % of noise emissions in urban areas (Korver et al., 2012).
Noise comes from all transport modes. Aviation noise from airports is an increasing source of contention with 725 500 people affected by 55 dB Lden noise levels around London Heathrow, 238 700 by Frankfurt and 170 000 by Paris Charles de Gaulle (Airports Commission, 2013). Aviation growth and proximity to urban areas are key issues here. Actions include night-time restrictions on aircraft movement with Paris Charles de Gaulle currently providing restrictions on flying possibilities related to aircraft noise (Aeroports de Paris, 2011).
4.2.2 Road accidents
In 2010, around 38 % of all road traffic accident fatalities occurred in urban areas in the EU-19 (3). Urban road fatalities have been reduced in the last decade (by 39 %), slightly less than the reduction of all road traffic fatalities (42 %). The EU aims to reduce this to zero by 2050 and halve casualties by 2020, ensuring that it is a world leader in safety (EC, 2011).
Pedestrians are the most vulnerable travellers, with 70–80 % of pedestrian/vehicle crashes occurring when people try to cross the road (OECD, ITF, 2011), including between 33 % and 50 % at a pedestrian crossing. This reinforces the need to improve pedestrian crossing facilities in cities.
Reductions in driving speeds have been proven to increase pedestrian survival rates (TRL, 2010). According to the International Transport Forum within the OECD (OECD/ITF 2011), speed moderation in urban areas not only reduces the likelihood of a collision but, moreover, the severity of the injuries. Recent studies agreed that reducing the impact speed from 50 km/h to 30 km/h decreases the risk by a factor of 80 % for a pedestrian being killed in a collision. The dangers posed by motor
traffic impact on people's ability to live comfortably in cities and measures such as reallocating road space can also reduce collisions. For example, targeted measures on roads with high numbers of pedestrians in the United Kingdom resulted in a reduction in road casualties of 24–60 % (DfT, 2008).
Freight transport can be a key contributor to road injuries, with Heavy Good Vehicles (HGVs) responsible for over 42 % of cyclist deaths in London (Keigan et al., 2009). The presence of freight traffic can also reduce the perception of road safety, reducing the uptake in walk and cycle modes.
The 30 km/h citizens' initiative claims that a reduction in the maximum authorised speed, as (http://en.30kmh.eu), will affect the average speed of cars only slightly, while benefiting safety and significantly encouraging non-motorised transport in cities.
4.2.3 Traffic congestion
It is estimated that nearly EUR 100 billion — around 1 % of the EU's GDP — are lost to the European economy annually as a result of traffic congestion (EC, 2007). This compares to a similar EUR 100 billion figure due to the side effects or so called 'external costs' (i.e. costs not paid by the transport user) arising from transport air pollution (EEA, 2013e). Meanwhile estimates of the external costs of accidents come to just over double this figure (CE Delft, 2011). In London, Cologne, Amsterdam and Brussels, drivers spend more than 50 hours a year in road traffic jams (INRIX, 2010). Congestion also impacts well-being, affecting road users' stress. It has become clear that congestion cannot be managed just by adding road capacity, and an increasing number of cities are applying integrated approaches to tackle congestion, including measures related to access restrictions, parking standards and pricing policies, land use planning and improving non-motorised facilities and public transport services.
4.2.4 Social inequalities
Social inequalities associated with transport includes: exclusion from facilities for example restricted access to shops and leisure services; the
(3) Data from the Community Database on Accidents on the Roads in Europe (CARE). EU-19 are: Austria, Belgium, Czech Republic, Denmark, Finland, France, Germany, Greece, Ireland, Italy, Luxembourg, Netherlands, Poland, Portugal, Romania, Slovenia, Spain, Sweden and the United Kingdom.
Part B│Why is urban transport relevant for the environment?
38 A closer look at urban transport
monetary cost of travel potentially impacting on access to employment and therefore on incomes; and fear based exclusion whereby concerns over safety and security impact on the use of public transport services and walk and cycle modes (Church et al., 2000 in Lucas, 2012). In addressing such examples the provision of infrastructure; the cost of travel (including the availability of discounted or free travel passes) and measures to improve transport safety all have a key role to play.
Transport-related inequalities can also be linked to social networks and social capital. European research highlights the role that car ownership, and the associated mobility that this offers, can play in developing the extent and strength of a person's social network (Frei et al., 2009 in Lucas, 2012). Correspondingly, having no car and living where there is limited public transport infrastructure result in declining social capital (Viry et al., 2009 in Lucas, 2012).
4.2.5 The land take of urban transport
The amount of urban land allocated to residential and commercial development, as well as major transport infrastructure, can vary and significantly affect the quality of life in cities. Such use of land results in soil sealing — the loss of soil resources due to the covering of land for housing, roads or other construction work — and is viewed as irreversible. Soil sealing within so-called Urban Morphological Zones (UMZ) (defined as a set of urban areas situated less than 200 meters apart and which contribute to the make-up and function of any given city) of European capitals varies between 23 % and 78 % (EEA, 2010). An average of 30 % of soil sealing occurs in those areas of the UMZs devoted to transport, mostly roads and associated land (ETC/SIA, 2013, using the EEA's urban-atlas dataset). This can, of course, vary depending on the city in question and even the different parts of the city, and is directly correlated with the level of mobility and the different modes of transport used.
A minor proportion of urban land was devoted to transportation in the pre-automobile era. This consisted of a network of basic roads used predominantly by pedestrians. Although such use of land can still be found in European cities today it contrasts sharply with modern comparisons between the quality of space offered by a motorway and shared areas for pedestrians and cyclists. Nowadays, the amount of land that is allocated exclusively to car transport and off-street car parking tends to be out of proportion to the
land actually available. This focus on supporting the movement and placement of cars conflicts with other modes of transport available (such as pedestrians and bikes) but also with the need for green and recreational areas.
An efficient transport system can improve the use of land in urban areas, maximising the space available for non-motorised trips. Better facilities for walking and cycling provide a twofold benefit in improving significantly the efficiency of transport in urban areas and the quality of life as perceived by citizens and visitors. Accessible, good-quality, well-maintained green spaces and playgrounds, modern transport systems and safe, walkable neighbourhoods that encourage physical activity and social interactions are key constituents of urban quality of life (EEA, 2009).
4.3 Urban transport and air pollution
Air quality in cities is of major importance to health. As the latest Air quality in Europe — 2013 report (EEA, 2013) shows, up to a third of Europeans living in cities are exposed to air pollutant levels exceeding EU air quality standards. Between 2009 and 2011, up to 96 % of city dwellers were exposed to fine particulate matter (PM2.5) concentrations above WHO guidelines. Up to 98 % were exposed to O3 levels above WHO guidelines. As Figure 4.1 shows, the proportions decrease when considering the limits or targets set out in EU legislation because they are in certain cases less strict than WHO guidelines.
The Air quality in Europe — 2013 report coincides with the recent statement from the International Agency for Research on Cancer (IARC), the specialised cancer agency of the WHO, which has officially classified outdoor air pollution as carcinogenic to humans.
The contribution of transport to air quality was the focus of the TERM 2012 report (EEA, 2012a), which offered an overview and discussed the contribution of all modes of transport to pollution emissions (including the so-called 'secondary air pollutants', i.e. NOX promoting tropospheric O3 and PM formation) and concentrations, detailing local and regional effects and exploring the link between air pollution and global warming. In general, figures from 2012 remain identical to the 2013 edition of the TERM report, as the transport sector is responsible for 58 % of all the NOX emitted in the EEA-33 in 2011, 32 % only by road transport. In addition, the share of the transport sector in overall emissions of PM2,5 is 27 %,

Part B│Why is urban transport relevant for the environment?
39A closer look at urban transport
Figure 4.1 Exposure to harmful levels of air pollution in the EU
EU urban population exposed to harmful levels of air pollution in 2011, according to:
PM2.5
PM10
03
NO2
BaP
SO2
96 %
88 %
98 %
5 %
94 %
46 %
31 %
33 %
14 %
5 %
31 %
< 1 %
EU limit/target values WHO guidelines
Source: EEA, 2013.
and international shipping alone is responsible for 17 % of all SOX emitted. Methods known as 'source apportionment techniques', have estimated that the averaged contribution of urban and local traffic to PM10 concentration is 35 % while it is up to 64 % in the case of NO2 concentrations (EEA, 2012).
While considerable progress has been made in the past twenty years in improving urban air quality, a number of challenges remain. Road traffic contributes significantly to breaches of air quality standards in many cities and other urban areas. Boxes 2.4 and 2.5, from the TERM-CSI indicator chapter, provided information on transport emissions of air pollutants and the actual exceedances of air quality objectives due to traffic respectively. In 2011, the NO2 annual limit value was exceeded at 42 % of Europe's urban traffic measurement stations. Meanwhile, 43 % of traffic locations recorded an excess of the PM10 24-hour limit value. This is despite Directive 2008/50/EC (EC, 2008) on ambient air quality and cleaner air for Europe having established that this limit value had to be met by 1 January 2005 (EEA, 2013).
In comparing Boxes 2.4 and 2.5 one observes that the decrease in NOX emissions (29 %) from road traffic sources between 2002 and 2011 is considerably greater than the fall in NO2 annual
mean concentrations (ca. 8 %) measured at stations close to traffic in the same period. This is attributed primarily to the increase in NO2 emitted directly into the air from diesel vehicles (the proportion of NO2 in the NOX emissions of a diesel vehicle is far higher than the proportion of NO2 in the NOX emissions of a conventional-petrol vehicle). Some cities in Europe showed an increase in concentrations of NO2 measured close to traffic in the period 2002–2011 mainly due to the increasing number of diesel vehicles. As a result, 5 % of the EU urban population lives in areas where the annual EU limit value and the WHO Air Quality Guidelines for NO2 were exceeded in 2011. Box 4.1 explains how Euro standards have failed to deliver the reduction in NO2 emissions that was anticipated for diesel vehicles.
Congested urban traffic conditions and frequent short journeys can increase fuel consumption by 30 % and result in higher air pollution emissions per kilometre compared to free-flowing longer journeys. This is a consequence of increased cold engine operation, higher fuel consumption in stop-start conditions and less efficient performance of exhaust emission abatement systems (EEA, 2012).
Buses, mopeds and motorcycles make up a higher proportion of vehicle composition in urban

Part B│Why is urban transport relevant for the environment?
40 A closer look at urban transport
Box 4.1 Tightening NOX emission standards for diesel vehicles has not delivered real NO2 reductions
The technical requirements for the type approval of motor vehicles with regard to emissions have been harmonised in the European Union to ensure acceptable limits for exhaust emissions of new vehicles sold in EU Member States. These requirements, the so-called 'euro standards', have been implemented since 1993 (Euro 1) and continuous efforts to reduce vehicle emissions have been on-going, with the introduction of the Euro 6 standard from 2014. As soon as a new emission standard enters into force, Member States must refuse the approval, registration, sale and introduction of vehicles that do not comply with these emission limits.
The progressive introduction of Euro emissions standards has substantially reduced emissions of NOX, CO, volatile organic compounds (VOCs) and PM in road motor vehicles. However, emission standards for diesel vehicles have not delivered the NOX improvements anticipated. Increases in the fraction of NOX emitted as NO2 by diesel vehicles (both passenger and freight) has led to exceedances of NO2 values in many European cities. This has become one of the principle reasons why there is non-compliance with EU air quality regulations (see Box 2.5). For diesel cars, the divergence between expected and real-world emissions was evident from the introduction of the Euro 3 standards implemented in 2000.
Figure 4.2 shows that while the NOX emission limit values for diesel passenger cars (left) have been reduced by approximately a factor of 4 from 1993 to 2009 (Euro 1 to Euro 5), the estimated average NOX emissions in real driving conditions have slightly increased (right). As a side-effect of engine technology developments, the share of direct NO2 emissions in the NOX mixture has increased at the same time, posing additional challenges for the attainment of the NO2 air quality standards. Increasing traffic volumes, coupled with the promotion of the sale and use of diesel vehicles in EU Member States (mainly due to their CO2 benefits), stresses the importance of this issue.
The European Commission announced in November 2012, via its CARS 2020 Action Plan (EC, 2012), that it would develop from 2014, and implement by 2017, a new driving test-cycle and test procedure. This will measure fuel consumption and emissions from cars and vans and will ensure compliance with the Euro 6 limit values under real driving conditions. Appropriate transitional arrangements will be in place from 2014 until 2017. For both conventional and alternatively fuelled vehicles, Euro 6/VI emissions will begin to be introduced from 2013 for heavy duty vehicles (i.e. HGVs and buses/coaches), from 2014 for passenger cars, and from 2015 for light goods vehicles (LGVs).
As shown in Figure 4.2, the Euro 6 standard is therefore expected to substantially reduce the NOX emissions from diesel engines in cars and other vehicles intended to be used for transport. The future level of NO2 ambient concentrations will clearly depend on the effectiveness of Euro 6 under real driving conditions and the development of an effective new driving test-cycle.
Note: These figures include the average New European Driving Cycle (NEDC) and the average Common ARTEMIS Driving Cycle (CADC) (1/3-mix urban, rural, motorway) test results for a set of diesel cars.
Source: Kühlwein et al., 2013; and Hausberger, S., 2010.
0
0.2
0.4
0.6
0.8
1.0
1.2
EURO
0
EURO
1
EURO
2
EURO
3
EURO
4
EURO
5
EURO
6
Passenger diesel cars — CADC 1/3 mix
0
0.2
0.4
0.6
0.8
1.0
1.2
EURO
0
EURO
1
EURO
2
EURO
3
EURO
4
EURO
5
EURO
6
g/km g/kmPassenger diesel cars — NEDC
NO NO2 NO NO2
Figure 4.2 Test results for a set of diesel cars

Part B│Why is urban transport relevant for the environment?
41A closer look at urban transport
areas than they do nationally and lead to higher emissions. Buses can emit high levels of NOX and PM unless measures are taken to ensure they meet strict emission standards. Mopeds and motorcycles, particularly older models, are high emitters of CO and VOCs.
City commuters are particularly vulnerable to high concentration of pollutants in urban areas. Indeed, during their regular journeys commuters
Box 4.2 Exposure to air pollution during commuting in selected European cities by mode of transport
In general, exposure studies published so far have revealed that cyclists are exposed to lower PM concentrations in comparison to those travelling by other vehicles, as the vehicle shell provides little protection from air pollution to the passengers. Travelling by car has been shown to involve exposure both to higher PM (11 %, according to Boogaard et al., 2009) and BC (Adams et al., 2002; De Nazelle et al., 2012) compared with cycling. Car travel similarly involves inhalation of enhanced levels of CO (De Bruin et al., 2004; Vellopoulou et al., 1998; Dor et al., 1995), VOCs (McNabola et al., 2008) and PM concentrations (Diapouli et al., 2008), especially during heavy traffic. The pollutant exposure will, however, differ greatly depending on the intensity and speed of the traffic and the type of ventilation inside the car. However, when accounting for inhaled doses, cyclists will receive higher levels of PM2.5 due to their higher inhalation rate resulting from greater energy expenditure (McNabola et al., 2008).
The fact that proximity to the pollutant sources has a significant impact on exposure levels experienced by cyclists and pedestrians highlights the benefits of physical separation of non-motorised modes from arterial roads. One example could be to use parallel quieter streets as main bike routes alongside pedestrian facilities. The need for reduction in the numbers of diesel vehicles in cities is also evident as a recommendation for the urban environment worldwide.
Source: ETC/ACM, 2012 (all article references are included in the reference chapter).
European studies comparing PM exposure levels (μg/m3) in different commuting modes
Car Bus Bicycle Taxi Subway
Barcelona, PM2.5 (de Nazelle et al., 2012) 36 26 35 – –
Barcelona, PM2.5 (Querol et al., 2012) 27
Dutch cities, PM2.5 (Boogard et al., 2009) 14–122 – 6–112 – –
Dublin, PM2.5 (McNabola et al., 2008); route 1
83 128 88 – –
Dublin, PM2.5 (McNabola et al., 2008); route 2
89 104 72
Florence, PM2.5 (Fondelli et al., 2008) – 56 – 39 –
Belgian cities, PM10 (Int Panis et al., 2010) 38–74 – 50–73 – –
London, PM2.5 (Kaur et al., 2005) 38 35 34 42 –
Aberdeen, PM2.5 (Dennekamp et al., 2002) 11 38 – – –
London, PM2.5 (Pfeifer et al., 1999) – – – 33 246
London PM2.5 (Adams et al., 2001a) 36 39 29 – 202
Manchester, PM4, (Gee et al., 1999; Gee and Raper, 1999)
42 338 54 – –
Arnhem, PM2.5 (Zurbier et al., 2010) 73–88 60–73 66–71 – –
Arnhem, PM10 (Zurbier et al., 2010) 42–45 57–61 35–37 – –
European studies comparing BC exposure levels (μg/m3) in different commuting modes
Car Bus Bicycle Taxi Subway
Barcelona (de Nazelle et al., 2012) 17 6 10
Berlin (Fromme et al., 2008; EC) 8–14 6–109
Antwerpen (Dons et al., 2012) 6 6 4 5
London (Adams et al., 2002) 26–34 16–25 15–19
can receive up to 30 % of their inhaled daily dose of black carbon (BC), and approximately 12 % of their daily PM2.5 personal exposure, even though such individuals usually travel for no more than 6 % of the day (Dons et al., 2012; Fondelli et al., 2008). However, an assessment of population exposure to air pollution during commuting in European cities (ETC/ACM, 2012) reveals that the mode of transport chosen can affect exposure levels (Box 4.2).

Part B│Why is urban transport relevant for the environment?
42 A closer look at urban transport
4.4 Urban transport and climate change mitigation
Urban transport has been estimated to account for around 25 % of the CO2 transport emissions responsible for climate change, almost all attributed to road transport (EEA, 2013a). This is in line with recent modelling including international travel, as shown in Figure 4.3.
The 'slow, stop and start' element of congested urban traffic conditions and frequent short journeys can result in higher carbon emissions per km (as with air pollutant emissions) compared to free-flowing longer journeys (EEA, 2012). Europe's most congested cities of Warsaw, Marseille, and Palermo have morning peak congestion levels of 84 %, 74 % and 64 % respectively (TomTom, 2013). Disparities in real world and test cycle driving are also exacerbated in urban driving conditions.
Cities have a role in leading action against climate change, reflecting their contribution to emissions. Meeting the EU climate change targets and the 60 % reduction in transport emissions by 2050 compared to 1990 levels will also depend on the actions taken by cities, and their efficiency. Local authorities are acting in various forms to facilitate cleaner urban mobility options within the scope of more general climate change objectives. For
Figure 4.3 Shares in EU transport greenhouse gas emissions in 2010 (estimates)
Note: These are updated estimates for 2010 based on the PRIMES-TREMOVE model and are not from official statistics. A short description of the model is provided in the impact assessment accompanying the 2011 Transport White Paper (EC, 2011c).
Source: DGMOVE, 2013.
example, the Covenant of Mayors, a grouping comprising European local authorities and launched by the European Commission, has agreed to meet the European Union climate and energy package objective to reduce the EU's 20 % CO2 emissions by 2020 from 1990 levels.
The objective is to be achieved through concrete measures aiming at increasing energy efficiency and the development of renewable energy sources. This involves the following stages:
• the preparation of a Baseline Emission Inventory (BEI);
• submission of a Sustainable Energy Action Plan (SEAP);
• the publication of implementation reports;
• the promotion of activities including the involvement of citizens and stakeholders.
• the recognition of outstanding initiatives through its 'Benchmarks of Excellence' scheme.
When cities set their overall targets, they consider the contribution different sectors and the actions taken in those sectors can make. According to those SEAPs with 'accepted' status up until the March 2013 period, the transport sector has a key role to play, as 20 % of the total emission reductions are expected to result from actions addressing urban transport (JRC, 2013). These actions include measures related to the municipal fleet, public transport and private and commercial transport occurring on the territory of those countries having signed the SEAP and under the competence of the local authority.
4.5 Setting the policy context
European cities face similar challenges of congestion, air quality, road safety, climate change and the need to ensure economic viability. Transport policy at an EU level can help cities overcome these challenges and identify and implement solutions by providing methodologies and examples of best practice and through the setting of targets and objectives.
The key European policies and outcome messages for urban transport are shown in Box 4.3.
The following chapters explore these challenges and the policy targets and mechanisms needed to address them. Urban passenger and freight
Share in transportemissions
Passengers58 %
Freight42 %
Urban freight
9 %Urbantravel16 %
Inter-urbantravel31 %
Inter-continental
travel11 %
Inter-continental
freight10 %
Inter-urbanfreight23 %

Part B│Why is urban transport relevant for the environment?
43A closer look at urban transport
Box 4.3 Key European policies and outcome messages for urban transport
Sustainable Urban Mobility Plans
Sustainable Urban Mobility Plans (SUMPs) aim to address current and future transport needs sustainably. They are referenced in the Transport White Paper and the Action Plan on Urban Mobility. The European Commission introduced ELTISPlus (www.eltis.org) to encourage and facilitate the broad uptake of SUMPs across European cities. In developing the plan all aspects of mobility and sustainability should be considered.
The Transport White Paper (EC, 2011) sets out specific urban targets:
• 'conventionally-fuelled' cars will be phased out in cities by 2050 and their use will be halved by 2030;
• a target of CO2-free city logistics in major urban centres by 2030;
• reducing road accident fatalities by 2030 by half and to zero by 2050.
The Action Plan on Urban Mobility (EC, 2009c) set out a clear framework for EU initiatives for urban mobility while respecting the principle of subsidiarity. The actions identified from the plan were implemented through EU programmes and initiatives from 2009–2012. Actions included:
• supporting local authorities in developing SUMPs and providing information on funding;
• overseeing the strengthening of passenger rights in urban public transport;
• working with Member States to achieve full compliance with the EU Disability Strategy 2010–2020, by including the urban mobility dimension;
• supporting research and demonstration projects to assist the market introduction of lower and zero emission vehicles and alternative fuels.
The Urban Transport Green Paper (EC, 2007) identified a number of core elements of sustainable urban mobility, including the need to make towns and cities and their transport systems more fluid and accessible as well as greener and smarter.
transport patterns and underpinning drivers and needs are examined in Chapters 5 and 6. Existing
and new methods to reduce impacts and optimise travel are detailed in Chapters 5, 6 and 7.

44
Part B│Urban passenger transport
A closer look at urban transport
5 Urban passenger transport
Key messages
• The density and design of urban form, the provision and quality of transport infrastructure and transport costs (including parking and public transport fares) are key factors influencing the contribution of sustainable travel modes to urban mobility.
• The percentage of public transport and walk and cycle modes increases in city centres of a higher density.
• Available data shows an average journey length for motorised transport between 9 and 22 km per day. These distances provide many opportunities for more environmentally friendly modes of transport.
• The provision of cycling infrastructure is crucial in order for a city to achieve significant levels of commuter cycling. Gaining the first 5 % modal share in a city with little commuter bike use is viewed as substantially harder than achieving higher percentages.
• The availability and cost of parking act as a significant deterrent to car use with an increase in the price resulting in a decrease in car use.
• Urban road user charging schemes in Europe have achieved significant reductions in traffic levels and related emissions.
• Cities offer a number of advantages as regards the implementation of new vehicle technologies.
Urban passenger transport can be defined as the movement of people within city centres and broader, metropolitan areas. Recent work by the Organisation for Economic Co-operation and Development (OECD) and the European Commission (Dijkstra and Poelman, 2012; OECD/EC, 2012) has attempted to address this. It has identified 828 (greater) cities with an urban centre of at least 50 000 inhabitants in the EU, Switzerland, Croatia, Iceland and Norway based on a spatial selection of high density population areas. In order to improve mobility in urban areas one must attempt to understand the context and functions of cities, and the broader existence of commuting areas, or urban clusters, where daily trips from/to the main city are originated.
This chapter identifies and explains trends and patterns in urban passenger mobility using data from European cities. Because of the lack of available data sets and the difficulty in comparing cities, the selection of urban areas included throughout the report is determined by the work already carried out by different organisations. Such work has been available for certain individual cities, yet no comprehensive euro-wide urban transport dataset has been produced so far. The purpose of including
such data in this report is not to extrapolate city level data to an EU level, but rather presents an idea of the challenges facing urban areas with a view to future policy actions.
Sections 5.1 and 5.3 use data to identify and explore current mobility patterns in cities. Sections 5.2 and 5.4 consider planning, socio-economic, cultural and policy influences to provide explanations for these patterns. A similar approach is undertaken in Chapter 6 to understand trends and influences in urban freight transport.
5.1 Trends in urban mobility
Urban mobility trends relate to the contrast between urban and non-urban areas, as well as to those specific to urban areas. Comparing mobility patterns in the city centre and in the greater metropolitan area is one example. Trends relate to the modes used, the length and purpose of journeys, and trip patterns in a broader sense. A wide range of quantitative data has been drawn upon to understand these trends and infer explanations within this chapter; however, care needs to be

Part B│Urban passenger transport
45A closer look at urban transport
Figure 5.1 Modal split for metropolitan city areas for 2009 and 2011
Source: EMTA data for 2009 and 2011 (EMTA, 2012 and 2012a).
taken when making comparisons. For example, methodological differences in collecting data mean that direct comparisons between different cities cannot always be made, and a more qualitative approach has sometimes been necessary.
5.1.1 Modes used
Urban areas make greater use of public transport, walking and cycling, with less reliance on cars than non-urban regions (EEA, 2010a). Larger cities also typically have lower car use. The European Metropolitan Transport Authorities (EMTA, 2012 and 2012a) provide guidance on the definition with 'main city' being typically the most important city of the area, or the capital of the region, while 'metropolitan area' is seen as the group of municipalities or administrative units which have strong links on mobility, the provision of urban services, etc. In addition this area falls under the competence of the Public Transport Authority (PTA). This leads to different ways of organising the administrative and institutional aspects of local authorities. This highlights the differences between metropolitan areas, where public transport systems are co-ordinated on a regional basis (large parts of rural areas are integrated in the provision of services), and those where public transport is organised on a more urban and local scale. Nevertheless the configuration of these PTA Areas
is a result of socio-geographical and economic processes as well as the underlying administrative structure in each country.
The modal split for metropolitan and main city areas for 2011 and 2009 is provided below in Figures 5.1 and 5.2 using EMTA data. The choice of years (2011 and 2009) reflects the availability of data for all modes. Data prior to 2009 are available but do not cover walking and cycle modes at the city level. Note that not all EMTA cities are included in both Figures 5.1 and 5.2 reflecting data availability for both 2009 and 2011.
Metropolitan areas (Figure 5.1) typically have higher levels of car use than main city areas (Figure 5.2), mainly because commuting distances are higher and public transport has more difficulties to provide convenient services and widespread accessibility to usually more sprawl settlements. The use of sustainable transport modes (walking, cycling and public transport) is more prevalent inside main cities. Typically, more than 60 % of modal share comes from these 'sustainable transport' modes (EMTA, 2012 and 2012a) but it can be higher than 80 %, for example in Barcelona (86.1 %) and in the central Paris region of Ile-de-France (87.2 %).
Bus use dominates public transport demand in half of the EMTA cities (EMTA, 2012 and 2012a), and metro, tram and suburban rail all play contributory
0 10 20 30 40 50 60 70 80 90 100Vienna 2009
2011Stuttgart 2009
2011Turin 2009
2011Copenhagen 2009
2011Madrid 2009
2011Stockholm 2009
2011Helsinki 2009
2011Seville 2009
2011Paris 2009
2011Berlin 2009
2011Barcelona 2009
2011Valencia 2009
2011Amsterdam 2009
2011
Modal share of walk and bike (%) Modal share of public transport Modal share of the rest of motorised modes (%)
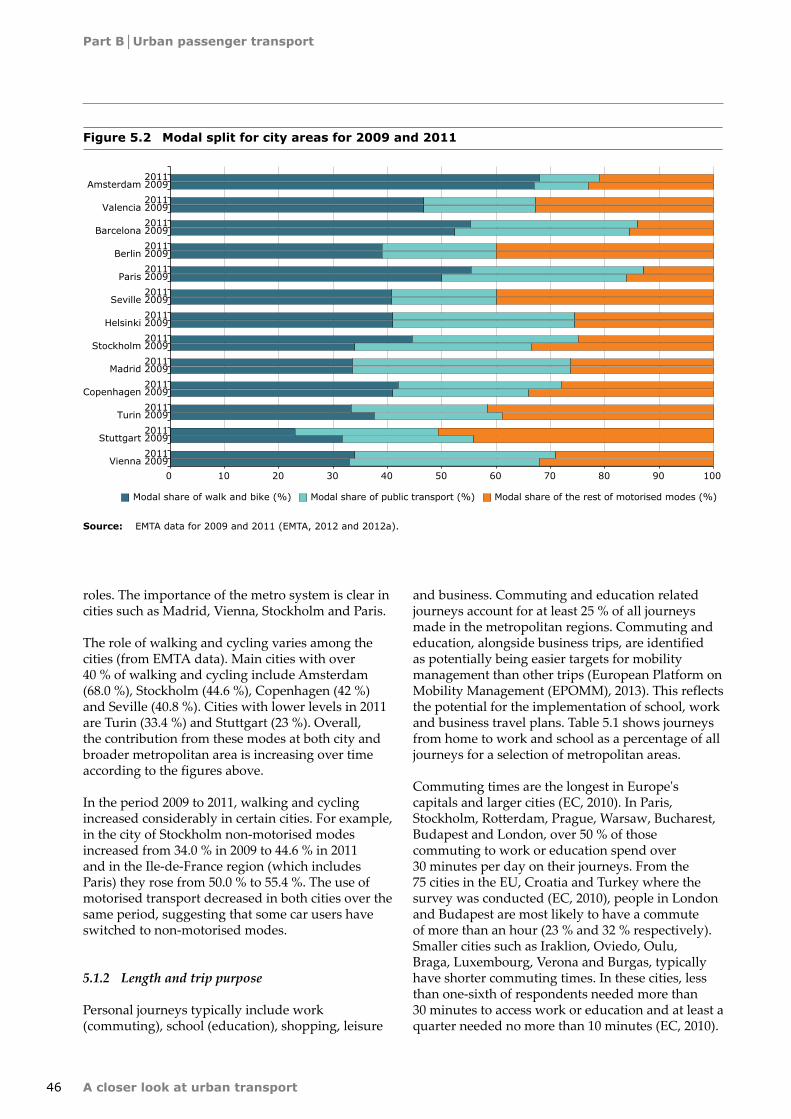
Part B│Urban passenger transport
46 A closer look at urban transport
Figure 5.2 Modal split for city areas for 2009 and 2011
Source: EMTA data for 2009 and 2011 (EMTA, 2012 and 2012a).
roles. The importance of the metro system is clear in cities such as Madrid, Vienna, Stockholm and Paris.
The role of walking and cycling varies among the cities (from EMTA data). Main cities with over 40 % of walking and cycling include Amsterdam (68.0 %), Stockholm (44.6 %), Copenhagen (42 %) and Seville (40.8 %). Cities with lower levels in 2011 are Turin (33.4 %) and Stuttgart (23 %). Overall, the contribution from these modes at both city and broader metropolitan area is increasing over time according to the figures above.
In the period 2009 to 2011, walking and cycling increased considerably in certain cities. For example, in the city of Stockholm non-motorised modes increased from 34.0 % in 2009 to 44.6 % in 2011 and in the Ile-de-France region (which includes Paris) they rose from 50.0 % to 55.4 %. The use of motorised transport decreased in both cities over the same period, suggesting that some car users have switched to non-motorised modes.
5.1.2 Length and trip purpose
Personal journeys typically include work (commuting), school (education), shopping, leisure
and business. Commuting and education related journeys account for at least 25 % of all journeys made in the metropolitan regions. Commuting and education, alongside business trips, are identified as potentially being easier targets for mobility management than other trips (European Platform on Mobility Management (EPOMM), 2013). This reflects the potential for the implementation of school, work and business travel plans. Table 5.1 shows journeys from home to work and school as a percentage of all journeys for a selection of metropolitan areas.
Commuting times are the longest in Europe's capitals and larger cities (EC, 2010). In Paris, Stockholm, Rotterdam, Prague, Warsaw, Bucharest, Budapest and London, over 50 % of those commuting to work or education spend over 30 minutes per day on their journeys. From the 75 cities in the EU, Croatia and Turkey where the survey was conducted (EC, 2010), people in London and Budapest are most likely to have a commute of more than an hour (23 % and 32 % respectively). Smaller cities such as Iraklion, Oviedo, Oulu, Braga, Luxembourg, Verona and Burgas, typically have shorter commuting times. In these cities, less than one-sixth of respondents needed more than 30 minutes to access work or education and at least a quarter needed no more than 10 minutes (EC, 2010).
0 10 20 30 40 50 60 70 80 90 100Vienna 2009
2011Stuttgart 2009
2011Turin 2009
2011Copenhagen 2009
2011Madrid 2009
2011Stockholm 2009
2011Helsinki 2009
2011Seville 2009
2011Paris 2009
2011Berlin 2009
2011Barcelona 2009
2011Valencia 2009
2011Amsterdam 2009
2011
Modal share of public transport (%) Modal share of the rest of motorised modes (%)Modal share of walk and bike (%)

Part B│Urban passenger transport
47A closer look at urban transport
Table 5.1 Journeys from home to work and school as a percentage of total journeys for a selection of metropolitan areas
Metropolitan areas % home to work & school journeys
Metropolitan areas % home to work & school journeys
Stadsregio Amsterdam 26.0 % Madrid community 56.4 %Barcelona Metropolitan region 37.1 % Paris Ile-de-France 35.8 %Berlin-Brandenburg 28.0 % Metropolitan area of Seville 33.6 %Birmingham (UK, West Midlands) 25.8 % Sheffield (UK, South Yorkshire) 25.0 %Brussels Metropolitan 52.0 % County of Stockholm 38.0 %Budapest (central Hungarian region) 46.6 % Stuttgart region 31.6 %Cadiz Bay 42.7 % Turin Metropolitan region 37.9 %Helsinki 32.4 % Valencia Metropolitan region 45.7 %Greater London 25.1 % Vilnius 87.0 %Lyon Urban Community 32.0 %
Note: Data relate to surveys carried out between 2004 and 2009.
Source: EMTA Barometer 2009 (EMTA, 2012).
In general, as Banister (2008) stresses, time spent travelling may have remained constant as cities have spread, but distances and speeds have increased substantially. One can also note that cities and metropolitan areas have grown as a consequence of faster modes of transport and general affordability and with a general lack of measures curbing any undue impacts on the environment.
Commuting times do not always relate to the mode of transport used. They were longest in capitals where there was typically a high level of public transport use, and shorter in the smaller cities where respondents could walk to work. However, there were also cities with a high use of car/motorbike or bicycle where commuting times were also long, such as Dublin (EC, 2010).
Cities with lower car ownership, for example due to fiscal measures, may have a higher average car journey length. For example, EMTA data suggest that Greater Copenhagen, in comparison with other cities, has a very low car ownership rate of 333 vehicles per 1 000 inhabitants but the highest journey length for motorised transport, at 32 km (EMTA, 20012). Possible reasons for this include those with the greatest need for private transport will purchase a car, despite potential fiscal barriers, and will therefore travel further. An additional explanation is that if the cost of car ownership is
high, people may tend to use the car much more, to get 'full use' out of it, and this would also impact on total journey length. This also is also dependant on the price of fuel.
According to the data available for a number of EMTA metropolitan areas (4), the average journey length for motorised transport is between 9 and 22 km per day. These distances provide many opportunities for clean modes of transport, such as electric or pedal bikes as well as electric vehicles or public transport services.
5.2 Underlying factors determining urban passenger transport patterns
The urban passenger transport patterns detailed in Section 5.1 are influenced by the size, planning (density) and design of the city as well as socio-economic factors, including population levels and economic activity (GDP). The provision and the quality of infrastructure as well as the costs of the different modes play key roles in determining such transport patterns. Policy mechanisms relate to these factors and are explored in detail in Section 5.4. However, the different factors must not be considered in isolation; the interplay between them must be recognised, even if it cannot be quantified.
(4) Data available for nine metropolitan areas: Amsterdam, Barcelona, Birmingham, Helsinki, London, Lyon, Madrid, Sheffield, and Stockholm.

Part B│Urban passenger transport
48 A closer look at urban transport
5.2.1 Urban form — size, density and design
Transport fuel use is generally understood to reduce when urban density increases. This was first proposed by Newman and Kenworthy (1989, 1989a) with the research being a topic of much debate and discussion. As a result, this research has been complemented by numerous other studies. These include Karathodorou et al. (2010) who concluded that urban density does affect fuel consumption, suggesting that this is through variations in the car stock and the distances travelled. The proposition is that higher density cities result in shorter travel distances and more walking and therefore the area covered by public transport is such that the public transport network becomes more viable (Karathodorou et al., 2010). This correlates with the findings in Section 5.1.1, which show how the percentage of public transport and walk and cycle modes increases in city centres, which are typically of a higher density.
5.2.2 Quality and provision of transport infrastructure
The quality and provision of transport infrastructure has a clear influence on modes used. Cities with targeted walking and cycling policies, for example
Copenhagen and Amsterdam, have a high modal split of these (42 % and 68 % respectively). This is consistent with broader research. For example, in a study covering 213 medium-sized European cities, Santos et al. (2013) identified a positive relationship between bicycle share and the length of the bicycle network.
Cultural practices with regards to modes used are not generally embedded within populations. Even the well-known and established cycling cities of Copenhagen and Amsterdam have developed their strong cycling infrastructure and ethos over time. Visionary political will and investment in infrastructure can result in dramatic changes.
For example, Seville is number 4 in the 2013 Copenhagenize Index of bicycle-friendly cities (see Box 7.2), with modal share increasing from 0.5 % in 2006 to 7 % in 2013. The Index was keen to stress that although a modal share of 15 % is a motivating target for European cities, it is much harder to achieve the first 5 % than subsequently moving to 15 %. The provision of infrastructure played a key role in this increase with 80 km of bicycle routes being introduced in one year. As it was highlighted by the EU project Bypad-Bicycle Policy Audit (www.bypad.org) for cities that have the lowest level
Figure 5.3 Bicycle traffic in Berlin since 1951 — relative change in percentage
0
20
40
60
80
100
120
140
160
180
200
220
1951
1953
1955
1957
1959
1961
1963
1965
1967
1969
1971
1973
1975
1977
1979
1981
1983
1985
1987
1989
1991
1993
1995
1997
1999
2001
2003
2005
2007
2009
Bicycle traffic in Berlin (West) Bicycle traffic in Berlin as a whole Large bicyle traffic census
Bicycle counts 1994 Monthly traffic census
% (2001 = 100 %)
Source: Senate Department for Urban Development and the Environment, 2011, Mobility in the City — Berlin Traffic in Figures 2010.
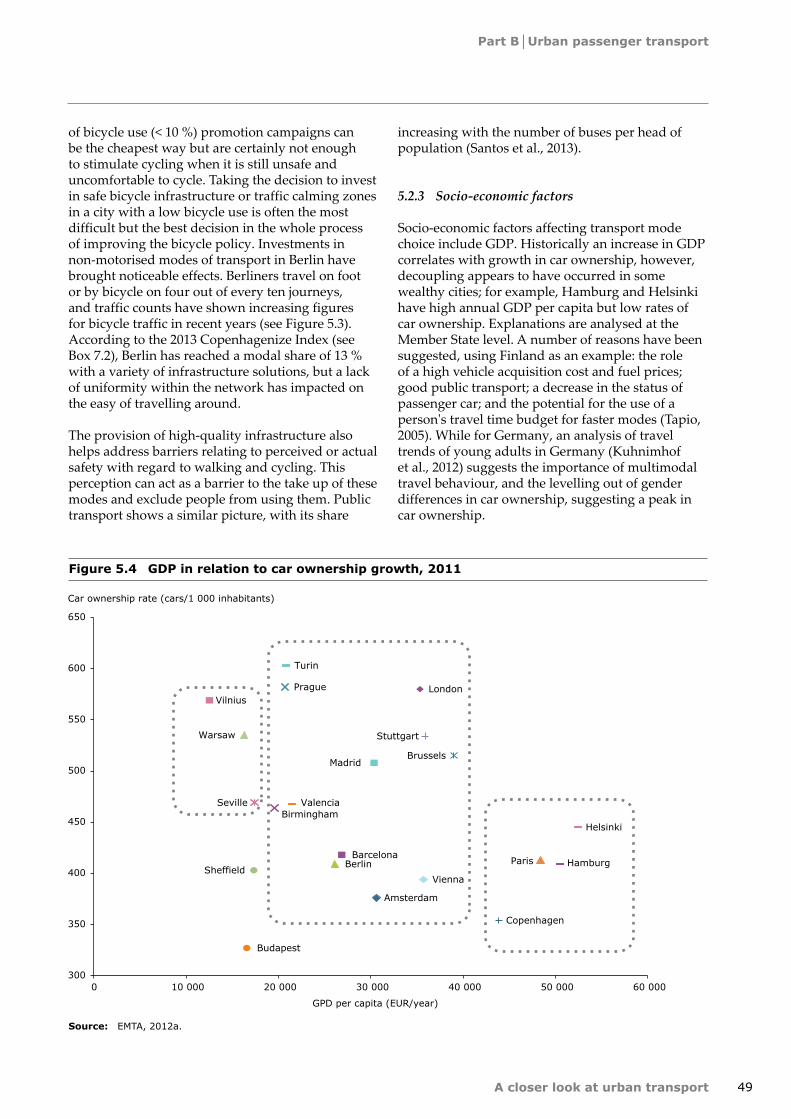
Part B│Urban passenger transport
49A closer look at urban transport
Figure 5.4 GDP in relation to car ownership growth, 2011
of bicycle use (< 10 %) promotion campaigns can be the cheapest way but are certainly not enough to stimulate cycling when it is still unsafe and uncomfortable to cycle. Taking the decision to invest in safe bicycle infrastructure or traffic calming zones in a city with a low bicycle use is often the most difficult but the best decision in the whole process of improving the bicycle policy. Investments in non-motorised modes of transport in Berlin have brought noticeable effects. Berliners travel on foot or by bicycle on four out of every ten journeys, and traffic counts have shown increasing figures for bicycle traffic in recent years (see Figure 5.3). According to the 2013 Copenhagenize Index (see Box 7.2), Berlin has reached a modal share of 13 % with a variety of infrastructure solutions, but a lack of uniformity within the network has impacted on the easy of travelling around.
The provision of high-quality infrastructure also helps address barriers relating to perceived or actual safety with regard to walking and cycling. This perception can act as a barrier to the take up of these modes and exclude people from using them. Public transport shows a similar picture, with its share
increasing with the number of buses per head of population (Santos et al., 2013).
5.2.3 Socio-economic factors
Socio-economic factors affecting transport mode choice include GDP. Historically an increase in GDP correlates with growth in car ownership, however, decoupling appears to have occurred in some wealthy cities; for example, Hamburg and Helsinki have high annual GDP per capita but low rates of car ownership. Explanations are analysed at the Member State level. A number of reasons have been suggested, using Finland as an example: the role of a high vehicle acquisition cost and fuel prices; good public transport; a decrease in the status of passenger car; and the potential for the use of a person's travel time budget for faster modes (Tapio, 2005). While for Germany, an analysis of travel trends of young adults in Germany (Kuhnimhof et al., 2012) suggests the importance of multimodal travel behaviour, and the levelling out of gender differences in car ownership, suggesting a peak in car ownership.
Source: EMTA, 2012a.
Amsterdam
BarcelonaBerlin
Birmingham
Brussels
Budapest
Copenhagen
Hamburg
Helsinki
London
Madrid
Paris
Prague
Seville
Sheffield
Stuttgart
Turin
Valencia
Vienna
Vilnius
Warsaw
300
350
400
450
500
550
600
650
0 10 000 20 000 30 000 40 000 50 000 60 000
Car ownership rate (cars/1 000 inhabitants)
GPD per capita (EUR/year)

Part B│Urban passenger transport
50 A closer look at urban transport
This decoupling ties in with a broader pattern with regard to car ownership and use. In western Europe and North America, car travel demand appears to be decreasing, remaining at the same level, or growing only slowly (Newman and Kenworthy, 2011; Puentes and Tomer, 2008; and Le Vine et al., 2009). The concept of, and potential for, 'Peak car' is therefore under much discussion, with the proposition that car use and ownership could have peaked, in certain cities and countries. Goodwin (2012) explores these and other factors, including changes in the symbolism of vehicles, the role of public transport and smart mobility. Goodwin (2012) also highlights the emphasis by some on an economic explanation, thus reflecting the financial challenges over the last few years.
In central and eastern European cities, car use is still growing. For example, in the Polish city of Gdynia, car use increased from 31 % in 1996 to 48 % in 2010. A 2012 study carried out in the cities of Budapest, Copenhagen and Karlsruhe aimed to gauge young people's attitudes towards transport. In Budapest (ITAS/KIT, 2012), the majority of young people interviewed used public transport because it was necessary rather than it being a preferred means of transport. This was in comparison with Karlsruhe and Copenhagen, where those interviewed had a high rating of the transport system and cycling, respectively. In Budapest there was greater interest in car ownership.
Analysis at the EU-13 and EU-15 level (detailed in Chapter 3) supports these propositions, with car passenger km increasing in the former and stabilising in the latter.
5.2.4 Costs of transport
A key determinant of transport choice can be cost. For public transport, the costs to users are clearly visible, associated with an individual journey and paid in advance in the form of a ticket. By contrast, drivers underestimate the true costs of their journeys, often only taking into account fuel. Maintenance and vehicle depreciation costs are not always factored into these calculations.
If fare prices rise, public transport share can decrease (Santos et al., 2013). However, this needs to be set against other factors including the quality of transport services on offer. Integrated ticketing and advanced ticket systems, such as the Oyster card in London, can help reduce boarding times and improve the passenger travel experience. It can also help reduce fare evasion, with Transport for
Figure 5.5 Parking charges and car modal share
Note: Paris covers car, taxi and motorcycle.
Sources: ITDP, 2011; EPOMM TEMs and EMTA data (EPOMM TEMs data cover 2008–2011 and it is motorised modes, other than public transport).
London reporting a reduction from 17 % to less than 3 % since the introduction of the Oyster card (SDC, 2010). This can, in turn, increase revenues available to further improve public transport provision. The flexibility of smart card mobility and the absence of up-front costs can echo the convenience of car ownership and reduced or free travel for disadvantaged groups can help address issues of social inequalities.
The availability and cost of parking is one of the most important determinants of car use (Tsamboulas, 2001). Surveys conducted in six European countries suggest that up to two-thirds of car journeys end with parking either on the street or in a public parking area (JRC, 2012). Regulatory mechanisms include caps on the amount of parking spaces and various other parking restrictions. In addition, parking fees can act as a significant deterrent to car use with an increase in the price resulting in a decrease in car use.
Other economic based measures include earmarking of parking charge funds to invest in sustainable transport schemes. For example, in Barcelona 100 % of parking fees contribute to Bicing — Barcelona's bike sharing scheme (ITDP, 2011).
0
5
10
15
20
25
30
35
40
45
50
0
1
2
3
4
5
6
Amste
rdam
Stoc
kholm
Cope
nhag
enPa
ris
Barce
lona
Antw
erp
Munich
Hambu
rg
Stra
sbou
rg
Vien
na
Car modal share (%)City centre first hour cost (EUR)
Car modal share City centre first hour cost (EUR)

Part B│Urban passenger transport
51A closer look at urban transport
Table 5.2 Traffic and CO2 reduction monitoring results in different urban road-user charging schemes in Europe
City/scheme
Traffic % change
Notes on the traffic change
CO2 % change
Notes on the CO2 change
London – 16 % % change in vehicles, 2006 versus 2002 during charging hours
- -
Stockholm – 22 % During the trial, – 25 % lower thereafter compared to what it would have been without the system
– 33 % Between 2006 and 2008
Bologna – 23 % Access reduction during charging hours on a working day 1004–2006
- -
Milan – 14 % Decrease in vehicles accessing the Ecopass Zone, 2007–2008
– 14 % Change after nine months of operation
Rome – 18 % From 2000 to 2005 – 21 % Change in mean values between 2001 and 2004
Source: EC, 2011d.
In terms of traffic, urban congestion charging has been introduced to help manage levels in several European cities with perhaps the most notable examples being in London and Stockholm. The pricing mechanism is designed to drive efficiency in transport demand to encourage consolidation, mode shift and removal of unnecessary trips. Stockholm has reduced traffic levels by 22 % and has achieved a reduction in congestion (travel time) of 30–50 %, with emissions decreasing by 12–14 % within the central charging zone (JEG, 2010; and EC, 2011d). In the case of the London scheme, traffic levels have been reduced by 15 % (JEG, 2010). Such charges can also support investment in public transport and other schemes and help generate modal shift. For example, there was an increase of 37 % in the number of bus passengers entering the congestion charge zone in London, in the first year of introduction of the scheme, with half attributable to the charging (TfL, 2004). Table 5.2 shows some impacts of urban road-user charging schemes.
5.3 Clean urban passenger vehicles
Cleaner vehicle technologies alongside measures to reduce car use will play a key role in ensuring that European cities are more liveable and reducing the environmental and health impacts of transport. As touched upon in Chapter 4, the negative impacts can be severe. The EC has a target to halve the use of conventional cars in urban areas by 2030 and phase them out of cities by 2050 (EC, 2011). New cleaner vehicle technologies include hybrids, plug-in hybrids, electric and hydrogen-powered vehicles. These vehicle technologies are applicable to all passenger modes — cars, buses, personal rapid transport and two wheeled transport. The take up
of these new vehicle technologies will be supported by the proposed new directive on infrastructure for alternative transport fuels (EC, 2013a). Here the minimum number of electric vehicle charging points at Member State level is detailed. Expectations for the take up in urban areas for example for electric vehicles is also clear (EC, 2013a).
Some cities are implementing local initiatives to try to encourage the introduction of cleaner vehicles. Residents and businesses in The Hague can benefit from a government scrappage scheme which focuses on petrol cars from before 1991 and diesel cars from before 2005. Such a scheme allows them to apply from 1 July 2013 for a grant if they have an old car that could be scrapped. A higher subsidy applies if the old vehicle is replaced by a more environmentally friendly model. The subsidy may eventually be as much as EUR 3 500, but other (regional and national) subsidies may apply as well. The scheme will run until April 2014 but could finish earlier if the EUR 1.5 million available is allocated. This is a continuation of a successful scrappage scheme which ran from 2008–2010 and which was successful in taking about 6 000 old cars off the road (Denhaag, 2013).
Cities offer a number of advantages as regards the implementation of new vehicle technologies. The shorter distances travelled are typically suited to electric battery-powered vehicles such as cars, bikes or buses (the range of electric vehicles is currently 100 km to 160 km). Fuelling infrastructure, such as electric plug-in points and hydrogen pumps, is more feasible at the urban level, as is subsequent maintenance. The local air quality, decrease in emissions and the noise benefits offered by these lower carbon vehicles also help to address the key

Part B│Urban passenger transport
52 A closer look at urban transport
challenges of environmental protection and climate change as identified in Chapter 4.
Carbon emission savings associated with the introduction of Plug-in Hybrid Electric Vehicles (PHEVs), electric and hydrogen-powered vehicles
depend on how the electricity or hydrogen is generated. As the electricity grid is decarbonised, savings will increase. PHEVs might save 30 % rising to 40 % in 2020, with battery-electric and hydrogen fuel cell vehicles achieving over 50 %, rising to nearer 70 % in 2020–2030 (RAC Foundation, 2013).

53
Part B│Urban freight transport
A closer look at urban transport
6 Urban freight transport
Key messages
• Urban freight is a vital part of the urban economy delivering goods and services to city residents and businesses.
• It is dominated by road transport as the final leg of a potentially long and complicated supply chain, with limited options for modal shift.
• Different estimations show that freight comprises some 10–18 % of urban road traffic, but the share of emissions of freight vehicles of total urban traffic emissions is estimated to be between 20 % and 30 % or even reach 40 % depending on the local situation.
• Measures to manage the relationship between residents and traffic, particularly in city centres and historic towns include pedestrianisations, vehicle size and weight controls, parking and loading controls, and delivery time windows.
• The key to improving the environmental performance of urban freight lies in better and more efficient logistics and the use of low or zero emission vehicles.
Urban freight transport is generated by the movement of goods into, out of, and within towns and cities and is closely linked to national and international freight transport patterns. Unlike passenger transport, it is largely generated by private businesses and operates on a purely commercial basis. It is a vital part of the economy of urban areas but can have significant environmental impacts. For example, urban freight traffic is more polluting than long-distance freight traffic as fuel consumption increases sharply if vehicles make frequent stops (DG MOVE, 2012). Despite this, the sector has received relatively limited attention from both researchers and policymakers (Savy, 2013).
6.1 Characteristics of urban freight
Data on urban freight are limited. However, where data are available, overall trends and characteristics can be seen, primarily that urban freight transport is dominated by road transport. For example, a comparison of mode shares for freight movements in tonnes lifted for London and Paris shows that road transport dominates at around 90 % of tonnes, with rail and water both having roughly a 10 % share (Allen, 2012; TURBLOG, 2011). In Berlin; road freight transport in total freight transport volume is around 75 %, while rail and inland navigation each account
for more than 10 % (Senate Department for Urban Development and the Environment, 2011).
A study of cities in the United Kingdom by Allen (2010) suggested that the amount of inbound goods is generally greater than outbound goods, reflecting a decline in manufacturing in urban areas. The proportion of local freight is related to city size, ranging from 15 % of total road freight for smaller cities up to 40 % for very large cities. Data on the distances in kilometres travelled by vehicles show the contribution of freight movements to urban traffic levels. It has been estimated that freight comprises some 10–18 % of urban road traffic, but contributes some 40 % of air pollution and noise emissions (Korver et al., 2012). According to a recent study (DG MOVE, 2012) the share of emissions of freight vehicles could vary between 20 % and 30 % of total urban traffic emissions depending on the local situation. As an example, traffic management measures will impact fuel consumption, as this increases sharply if vehicles make frequent stops. Another important trend is the amount of LGVs relative to HGVs. These proportions can vary from country to country. In the United Kingdom, LGVs make up the largest proportion of freight vehicles, typically over 80 % in urban areas. The level of LGV traffic in urban areas has remained stable or is growing, whereas HGV traffic has been falling (Figure 6.1).
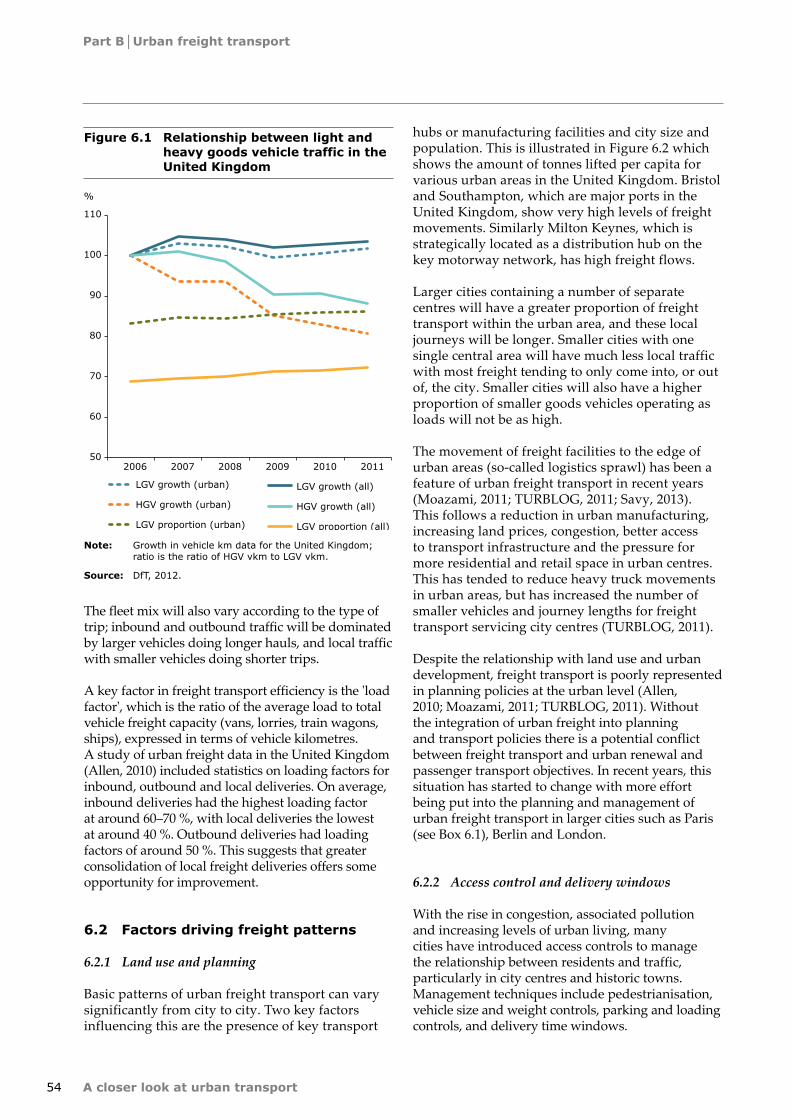
Part B│Urban freight transport
54 A closer look at urban transport
Figure 6.1 Relationship between light and heavy goods vehicle traffic in the United Kingdom
50
60
70
80
90
100
110
2006 2007 2008 2009 2010 2011
LGV growth (urban)
HGV growth (urban)
LGV proportion (urban)
LGV growth (all)
HGV growth (all)
LGV proportion (all)
%
The fleet mix will also vary according to the type of trip; inbound and outbound traffic will be dominated by larger vehicles doing longer hauls, and local traffic with smaller vehicles doing shorter trips.
A key factor in freight transport efficiency is the 'load factor', which is the ratio of the average load to total vehicle freight capacity (vans, lorries, train wagons, ships), expressed in terms of vehicle kilometres. A study of urban freight data in the United Kingdom (Allen, 2010) included statistics on loading factors for inbound, outbound and local deliveries. On average, inbound deliveries had the highest loading factor at around 60–70 %, with local deliveries the lowest at around 40 %. Outbound deliveries had loading factors of around 50 %. This suggests that greater consolidation of local freight deliveries offers some opportunity for improvement.
6.2 Factors driving freight patterns
6.2.1 Land use and planning
Basic patterns of urban freight transport can vary significantly from city to city. Two key factors influencing this are the presence of key transport
Note: Growth in vehicle km data for the United Kingdom; ratio is the ratio of HGV vkm to LGV vkm.
Source: DfT, 2012.
hubs or manufacturing facilities and city size and population. This is illustrated in Figure 6.2 which shows the amount of tonnes lifted per capita for various urban areas in the United Kingdom. Bristol and Southampton, which are major ports in the United Kingdom, show very high levels of freight movements. Similarly Milton Keynes, which is strategically located as a distribution hub on the key motorway network, has high freight flows.
Larger cities containing a number of separate centres will have a greater proportion of freight transport within the urban area, and these local journeys will be longer. Smaller cities with one single central area will have much less local traffic with most freight tending to only come into, or out of, the city. Smaller cities will also have a higher proportion of smaller goods vehicles operating as loads will not be as high.
The movement of freight facilities to the edge of urban areas (so-called logistics sprawl) has been a feature of urban freight transport in recent years (Moazami, 2011; TURBLOG, 2011; Savy, 2013). This follows a reduction in urban manufacturing, increasing land prices, congestion, better access to transport infrastructure and the pressure for more residential and retail space in urban centres. This has tended to reduce heavy truck movements in urban areas, but has increased the number of smaller vehicles and journey lengths for freight transport servicing city centres (TURBLOG, 2011).
Despite the relationship with land use and urban development, freight transport is poorly represented in planning policies at the urban level (Allen, 2010; Moazami, 2011; TURBLOG, 2011). Without the integration of urban freight into planning and transport policies there is a potential conflict between freight transport and urban renewal and passenger transport objectives. In recent years, this situation has started to change with more effort being put into the planning and management of urban freight transport in larger cities such as Paris (see Box 6.1), Berlin and London.
6.2.2 Access control and delivery windows
With the rise in congestion, associated pollution and increasing levels of urban living, many cities have introduced access controls to manage the relationship between residents and traffic, particularly in city centres and historic towns. Management techniques include pedestrianisation, vehicle size and weight controls, parking and loading controls, and delivery time windows.

Part B│Urban freight transport
55A closer look at urban transport
Box 6.1 Urban logistics planning in Paris
The freight strategy for the city of Paris aims to reduce emissions from freight transport and supports innovation in logistics to improve efficiency. Its focus is on encouraging freight facilities back into more central areas to reduce logistics sprawl and the re-use of rail transport. The key measures in the strategy include:
• integrating suitable delivery areas into premises in new developments;
• reserving areas close to rail and waterways for logistics activities;
• identifying additional part-time transit ports along the River Seine for the transhipment of goods from boats to delivery vehicles.
These planning policies have helped to maintain and further develop rail and water-based freight in the city, with an expected increase in rail mode share from 3 % to 6 %. They have also been complemented by new 'urban logistics spaces', which are designed to consolidate inbound goods for specific neighbourhoods with final delivery using green vehicles (e.g. tricycles and electric vehicles). An example of a project generated by this planning policy is the Monoprix rail transhipment centre which is estimated to have reduced truck movements for servicing their stores from 1 000 000 km to 300 000 km per year (TURBLOG, 2011).
Photo: © Laetitia Dablanc, 2013
Figure 6.2 Tonnes lifted per capita in 16 urban areas in the United Kingdom
0
10
20
30
40
50
60
70
80
90
100
Great
er Lo
ndon
Great
er M
anch
este
r
Wes
t Midl
ands
Wes
t Yor
kshir
e
Sout
h Yo
rksh
ire
Merse
yside
Tyne
and Wea
r
Brist
ol
Glasgo
w
Sout
hampt
on
Edinb
urgh
Milton Ke
ynes
Leice
ster
Card
iffYo
rk
Brigh
ton &
Hove
Tonnes per capita
Source: Allen, 2010.

Part B│Urban freight transport
56 A closer look at urban transport
These controls have significant benefits for urban and city residents, but if not handled properly, can generate inefficiencies in urban freight transport (DG MOVE, 2012). For example, delivery windows can increase the number of vehicles required to service premises, with more vehicles needed to service all the delivery points within the given time window. This can concentrate freight traffic at peak times. Size and weight restrictions can lead to more vehicles to carry the same amount of goods and so increasing noise, emissions of air pollutants and GHGs. However, cities often take contrasting approaches; for example, London has a night-time lorry restriction to reduce noise for residents, whereas Paris encourages night-time deliveries to reduce peak hour congestion (TURBLOG, 2011). Therefore such schemes need to be designed to meet local circumstances and could include additional environmental regulations as is the case in Paris, with an afternoon time window reserved for the least polluting vehicles.
Managing these potential conflicts through a consideration of freight transport in the planning process and engagement with the freight community is key to their successful introduction. Many cities across Europe now operate freight partnerships where they work co-operatively with local industry to improve delivery conditions. Examples include Utrecht, Ljubljana, Hanover or Dusseldorf. Failure to do this can result in freight companies disregarding the controls and accepting penalties, as this is less costly for their business (CIVITAS, 2012).
In terms of access control, the impacts of freight transport on cyclists and other vulnerable road users need to be considered. These can be linked with delivery windows, for example the emphasis in Paris on night-time deliveries can increase cyclist safety (British Cycling, 2013). Impacts can also be minimised through the use of segregated cycling infrastructure; close proximity warning systems; the use of wide view vehicle mirrors to reduce blindspots and side-guards. Hauliers can also gain advice through the joining of a reputable best practise organisation.
6.2.3 Just-in-time delivery and e-commerce
The development of information technology systems in freight and logistics has led to the concept of lean distribution and just-in-time (JIT) deliveries (Moazami, 2011). Through better exchange of information along the supply chain, there has been a move away from stock-holding to a much leaner system with central distribution and reduced times between order and supply. This has been driven
by a desire to reduce the amount of stock held and the number of warehouses in supply chains. The result has been smaller, more frequent deliveries to retail and catering premises. This in turn has tended to reduce load factors and increase the number of delivery vehicles in urban areas. This increase in transport activity may seem counter-productive for businesses, but since transport costs typically account for only around 10 % of the cost of a product (EC, 2006; Rodrigue and Notteboom, 2013) any increase in transport costs is offset by reductions in stock holding. In trying to manage freight movements, increasing costs in the supply chain, such as warehousing or handling costs, might be counterproductive. Conversely environmental improvements to vehicles may not significantly increase the overall product costs.
Another driver related to the development of IT is the dramatic increase in e-commerce. The number of people ordering goods over the Internet has doubled in Europe in the last 10 years from 20 % to 43 % (EC, 2012a). The highest levels of Internet shopping are seen in northern Europe in countries such as the United Kingdom and Sweden (as shown in Figure 6.3). This correlates strongly with broadband Internet penetration. Internet shopping can result in a reduction in shopping trips, but an increase in residential delivery trips. For example in 2006, it resulted in 138 million less passenger car km (0.4 %) and 35 million (0.2 %) more delivery van kilometres in the Netherlands (Weltevreden and Rotem-Mindali, 2008).
This rise in e-commerce has shifted delivery away from traditional retail outlets to the parcel and courier sector. This has had a similar effect to the introduction of JIT deliveries in more centralised stock-holding. It is also shifting some retail delivery into residential areas. These have not traditionally been a key node for urban freight transport, but this may be changing and the management of residential areas will need to consider these deliveries. One of the problems with home delivery is when the customer is not at home. The level of missed deliveries has been estimated as between 2 and 30 % (Edwards et al., 2009), resulting in increases in vehicle activity and emissions from subsequent trips, although solutions to this problem are available (see Section 7.1.2).
6.2.4 Fragmentation and consolidation
All these factors can generate fragmentation and inefficiency in urban freight transport, particularly for the 'last mile of delivery'. This is illustrated by the rapid growth in the parcel and courier sector

Part B│Urban freight transport
57A closer look at urban transport
Figure 6.3 Percentage of people in the EU-27 who have ordered goods over the Internet in the past 12 months, 2011
0
10
20
30
40
50
60
70
80
Percentage
Esto
nia
Denmar
kMalt
a
Bulga
ria
Greec
e
Cypr
us
Luxe
mbo
urg
Irelan
d
Slov
enia
Nethe
rland
s
Unite
d King
dom
Roman
ia
Latvia
Lithu
ania
Finlan
d
Belgi
um
Czec
h Re
publi
cSp
ain
Hunga
ryIta
ly
Austr
ia
Portu
gal
German
y
Polan
d
Fran
ce
Swed
en
Slov
akia
Source: EC, 2012a.
linked to JIT delivery and e-commerce, and also by the liberalisation of the postal market. Although generating significant business benefits, light freight vehicle movements has increased in cities, particularly van use, as can be seen in Figure 6.4.
Figure 6.4 The change in urban freight vkm in London between 1994 and 2010
0
20
40
60
80
100
120
140
160
180
1994
1995
1996
1997
1998
1999
2000
2001
2002
2003
2004
2005
2006
2007
2008
2009
2010
Index (1994 = 100)
Gross value added LGV vehicle km HGV vehicle km
Source: Allen, 2012.
Reducing the impact of these drivers on urban freight transport requires greater consolidation for both the supply and demand of goods. For the supply side, the concept of urban consolidation centres or zones has been developing over a number of years,

Part B│Urban freight transport
58 A closer look at urban transport
where inbound goods are consolidated for more efficient distribution around the city. On the demand side, businesses can work singly or in groups to consolidate their demand, for example through Delivery and Servicing Plans (DSPs). Such efficiency improvements will also help reduce business costs.
6.3 Clean urban freight
Urban freight transport is largely road-based and vehicles are almost entirely fuelled by diesel. Freight vehicles are increasingly being targeted in emissions reduction policies at national and urban level. The European Commission has a target of CO 2-free city logistics in major urban centres by 2030 (EC, 2011), which will require a major shift in operating patterns and the adoption of new technology. There are also EU targets for average emissions of CO2 for new vans sold in the EU (EC, 2011b).
6.3.1 Mode shift
The Transport White Paper noted that freight transport over short and medium distances (below 300 km) is likely to remain road-based into, out of, and within urban areas. Water and rail can play a part but their expansion can be limited by the available infrastructure and by competition with passenger transport.
However, there are a growing number of examples of the use of urban rail networks for deliveries. One of these is the use of rail transhipment by the Monoprix supermarket chain in Paris (TURBLOG, 2011), estimated to have reduced lorry movements by 70 %.
There has also been an increasing interest in using urban tram and metro systems to distribute freight, as in Dresden and Zurich (ELTIS, 2013, 2013a). For courier-type deliveries in more densely populated areas, there is the potential for the final leg of the journey to be by cycle or on foot. In Paris for example, Geodis operates local transhipment bases with onward delivery by electric van or powered tricycle (ELTIS, 2013b).
6.3.2 Low emission vehicles
With the limited options available for mode shift in urban freight the introduction of low and zero emission technologies will be particularly important in reducing the environmental impact
of freight vehicles. The range of new technologies available was discussed in detail in the 2012 TERM report. In the short term the focus has been on the improvement of existing technology through the use of exhaust emissions controls primarily through improved Euro Emission standards, but also as retrofit technology. In the medium term there are opportunities for gas vehicles, particular biomethane vehicles, and hybrid and electric vehicles. In the longer term hydrogen presents a potential opportunity.
However, there are a number of barriers to the adoption of these technologies including:
• potential increases in operating costs — this can be increased service/maintenance costs for emissions control equipment and increased capital cost for new technologies;
• new infrastructure requirements — in the case of gas, electric or hydrogen fuels;
• changes in operating patterns — particularly for new technology where range and refuelling patterns may be different;
• the need to new skills and training — to maintain, service and drive these vehicles.
Policies designed to support the uptake of low emission vehicles must address these barriers and make new vehicle technologies attractive to freight operators. The provision of information will be important through programmes such as CIVITAS and ELTIS at the European level, but also through local freight programmes.
On a more regulatory level low emission zones (LEZs) have been used to drive the uptake of these new technologies. Schemes in London and Berlin have led to a significant uptake of heavy duty vehicles being retrofitted with devices which trap particulate matter. This has led to a decrease in overall PM emissions. Pricing measures are also an important tool including measures such as emission-related congestion charges and parking charges. The use of low emission technologies is also being linked to urban transhipment focusing specifically on the 'last mile' of delivery.
In addition, the way in which vehicles are driven significantly affects their emissions performance. Evaluation of eco-driver training programmes designed to improve driver behaviour has shown fuel savings of between 5 % and 20 % (EcoWill, 2013).
59
Part B│Options to minimise impacts
A closer look at urban transport
7 Options to minimise impacts
Key messages
• Cities across Europe continue to evolve and change and so need an integrated approach to tackling the environmental impacts of transport consistent with their planning and economic development polices.
• Such integrated SUMPs are being developed in some cities pulling together unique and ambitious packages of measures.
• However, this approach is only progressing slowly due to the fragmentation of transport and planning polices, entrenched behaviours, uncertainty over funding and, in some cases, lack of political will.
• Action at the European level to improve knowledge and awareness and continued funding programme can help reduce these barriers to the implementation of effective solutions.
The set of options that can be used to reduce the environmental impact of transport needs to be appropriate to each individual city. Within this context an integrated approach needs to be taken across passenger and freight sectors taking into account the wider economic development of the city. However, many barriers to the implementation of an integrated approach are common and persistent in many European cities. Any strategy that aims at improving the performance of urban transport under the sustainability principles and, indeed the options to minimise impacts that are included in this chapter have to cope with these obstacles in order to be effective. The barriers to implementation help explain why progress has been so slow. A description of the most important barriers on decisions relating to transport was given by Banister (2008):
• application of general planning and car parking standards and prices which are inappropriate and unachievable in a town centre/high street context;
• reluctance of people to use public transport and cycle/walk, even for local trips;
• strong desire of urban residents to use their cars as of right;
• fragmentation of the organisation, integration and management of public transport;
• uncertainty over the funding of public transport and non-motorised modes;
• separation of planning and transport functions within local authorities.
The lack of both political will and funding are probably the two most important and widespread barriers, along with the planning culture and tradition. Raising awareness about the effectiveness of integrated approaches, both in terms of efficiency in the use of resources and gains in public confidence and acceptability to support these measures through active involvement and action, is the way to overcome such barriers.
Options to improve urban transport, as well as at the wider national and European level, can be analysed in terms of three key approaches (Dalkmann and Brannigan, 2007):
• Avoid — the need to travel to access goods and services through efficient urban planning, communication technology, consolidation activities and demand management.
• Shift — where appropriate, people and goods moved towards more sustainable modes such as walking, cycling, public transport rail and water transport.
• Improve — the environmental performance of vehicles with the adoption of low emission vehicle technologies and more efficient operation of vehicles.
Part B│Options to minimise impacts
60 A closer look at urban transport
7.1 Avoiding the need to travel
Most urban transport is a means to an end and is generated for the purposes of accessing goods and services, as illustrated by the trip purpose data in Chapter 5. Therefore, a key element of sustainable urban transport is improving access to these goods and services, hence reducing travel distances and times, which in term will avoid unnecessary travel and traffic in urban areas.
7.1.1 Land use and planning
Land-use planning focuses on the land-use patterns which generate the demand for transport. The overall emphasis is on shaping the pattern of development and influencing the location, scale, density, design and mix of land use to avoid the need to travel and make it easier for people to access jobs and facilities by the most sustainable mode (Stantchev and Whiteing, 2009).
The following are key principles that can be used in land-use planning to achieve this (Litman, 2012):
• Compact urban form and increased density — will reduce help passenger trip distances, allow public transport to be more efficient and reduce freight delivery distances.
• Mixed land use — locating shopping, schools and businesses close to residential areas. Mixed use areas typically have 5–15 % less vehicle travel.
• Urban realm design — that encourages walking and cycling and allows for efficient delivery of goods. The provision of green and open spaces is also important for increased social benefit. Successful examples include the pedestrianisation of Copenhagen centre and the Nottingham Clear Zone, where vehicles are prohibited between 10 am and 4.30 pm.
Engagement with all key stakeholders and consideration of passenger and freight transport is crucial for successful urban planning and avoiding potential conflicts. For example, moving towards more city centre shopping and living can have benefits for passenger transport demand but can cause inefficiencies in freight transport (TURBLOG, 2011; DG MOVE, 2012). These more vibrant centres will have a greater range of small independent shops and businesses, which will be harder to service than fewer larger businesses. Understanding this and working with these
businesses to ensure deliveries are managed efficiently will be important to the success of the area. Such consultation is generally done when developing mobility plans. It may also be done through on going consultative groups such as the freight transport charter in Paris (TURBLOG, 2011) or the freight quality partnerships in many cities in the United Kingdom (Allen, 2010).
In terms of developing the overall package of measures the role and expectations for passenger and freight travel need to be considered. Issues include the environmental impact of the modes, the potential for passenger and freight modal shift; and the wider health and other benefits associated with the increased walking and cycling that city centre living can help facilitate. Separation of planning and transport functions within local authorities as well as planning traditions are regarded as the main barriers here, but the awareness and public/political acceptability is high in the places where actions have been taken.
7.1.2 Information and communications technology (ICT)
The increasing availability and quality of information networks, particularly the Internet, has given rise to a growth in audio/video conferencing, tele-working and e-commerce. All these activities have the potential to replace a traditional trip with a 'virtual' trip and could reduce travel demand. Businesses using audio and video conferencing systems are reducing business travel by 10–30 % and generating significant savings in travel costs and staff time (Cairns, 2009).
Tele-working is increasingly popular, with some 13 % of the EU-15 working population classified as teleworkers (Manpower, 2013). There is significant debate on how much travel it actually saves, but most studies suggest that the number of trips and overall distances travelled are less for home-based tele-workers (Corpuz, 2011).
E-commerce is perhaps the fastest growing behaviour that will potentially reduce travel demand by replacing retail trips. However, as discussed in Chapter 6, the management of home delivery trips that can be inefficient due to missed deliveries. Local collection and delivery points (CDPs) in the form of lockers in places such as railway and bus stations and post offices is increasingly being promoted to solve this problem, for example, the E-box in France and Packstation in Germany (Niches, 2009). The increased use of residential 'parcel safes' is also another option.

Part B│Options to minimise impacts
61A closer look at urban transport
ICT will also help facilitate 'Smarter Mobility' packages. Smart phones can be used to access public transport, book tickets. ICT also allows the easy functioning of car and bike share schemes. Knowledge barriers among users and administrations along with financial constraints are the main barriers.
7.1.3 Consolidating supply and demand
Urban freight vehicle trips can be avoided by consolidating the delivery of goods more efficiently into fewer vehicles, as the average vehicle loading for local freight trips is less than 50 %. The greatest opportunity is in deliveries to small retail or catering businesses, which can have fragmented and inefficient delivery patterns (DG MOVE, 2012).
Typically, supplier vehicles deliver to the consolidation or transhipment centre on the edge of the central urban area where the goods are prepared for onward delivery. These schemes often use low emission delivery vehicles and have greater flexibility in delivery access. Delivery trips to businesses using a consolidation centre are significantly reduced, with examples in Bristol, Heathrow and Stockholm showing reductions of some 60–75 % (Scott Wilson Group Plc., 2010). However, many cities have tried this approach unsuccessfully, mainly because it has not proved commercially viable. Even today, most schemes require some form of public support. An alternative is to give the scheme additional benefits, for example exemptions from access restrictions as in the case in Utrecht (see Box 7.1).
On the other hand, there is potential to consolidate demand from customers by a planned approach to managing deliveries and goods to a single business or area. This approach has perhaps been most developed by Transport for London (TfL). Known as DSPs, it has reduced the number of deliveries to site by some 20 % (TfL, 2009). DSPs are complementary to travel plans and should be developed alongside other plans designed to reduce passenger travel.
7.1.4 Access management
Access management is widely used in cities to manage vehicle activity, particularly in sensitive areas. It covers a wide range of measures including time restrictions, parking restrictions, size and weight restrictions, controls related to vehicle emissions and pricing-based techniques. It is used to avoid inappropriate traffic and unnecessary trips, and is generally implemented for environmental or congestion reasons. Most schemes are targeted at freight and freight/private cars, rather than solely at private cars (DG TREN, 2010). The targeting of heavier vehicles reflects their proportionally higher environmental impact.
In the development of any access management system it is important to consider the needs of all users to arrive at an equitable solution on exemptions. For example, the development of bus-only lanes in Barcelona (DG MOVE, 2012) considered multi-purpose lanes on city boulevards, where lanes were used by buses in peak hours
Box 7.1 The Utrecht Cargohopper
The Cargohopper is a solar electrically-powered goods vehicle delivering light-weight ambient retail goods and parcels into the historic centre of Utrecht from a transfer site close to the city centre. Goods are initially delivered to a suburban warehouse located some 11 km from the city centre and are transferred to a central transhipment centre some 300 m from the start of the access-restricted city centre (time and weight). Final delivery is carried out by the Cargohopper, which hauls three trailers similar to those used at airports for transporting passenger luggage to and from aircraft. The delivery service is exempt from time windows and length restrictions and is able to use bus lanes.
Between April 2009 and October 2010, the Cargohopper made more than 12 000 deliveries of around 66 000 parcels/boxes. It is estimated that it replaced approximately 16 500 conventional goods vehicle trips into central Utrecht. This equates to a reduction of 122 000 vkm and 34 tonnes of CO2.
Photo: © Bert Roozendaal, RoozWorks

Part B│Options to minimise impacts
62 A closer look at urban transport
(08.00–10.00 and 17.00–21.00), but were exclusively available for the loading and unloading of freight between 10.00 and 17.00 and for residents' parking between 21.00 and 08.00.
Parking management can be a powerful tool to manage vehicle activity. Inefficient and poor parking controls generate additional traffic and congestion, with as much as 50 % of traffic congestion caused by drivers cruising around in search of a cheaper parking space (ITDP, 2011). The following are examples of innovative parking policies:
• Emissions-based charging/exception — such as the CO 2 based charges used in some London boroughs and the environmental loading points in Bremen for low emission delivery vehicles. Madrid is also currently studying the possibility of parking charge differential of 20 % in different areas depending on parking demand and the level of NOX emissions.
• Relocation of parking — removal of on-street parking from historic districts and central shopping streets, giving priority to pedestrians, cyclists and public transport. Copenhagen is leading the way in this approach.
• Design measures — to manage parking and make streets more pedestrian-friendly. For example, Amsterdam has zones called 'woonerfs' that use parked cars to create a winding passage, which forces vehicles to move at a pedestrian's pace.
7.2 Supporting modal shift
Modal shift from passenger car to public transport and walk and cycle can help reduce the environmental externalities associated with urban transport. Such travel choices can be very habitual and are hard to break. They are rooted in the structure of our daily activities, but also influenced by deeper values and aspirations, economic motivations and wider influences such as social obligations (Goodwin and Lyons, 2010). Changing these habitual behaviours requires challenging these attitudes and perceptions.
Marketing campaigns can be used to encourage people to change their travel habits and adopt more efficient and sustainable transport modes. People are most likely to change their regular travel patterns at certain 'life change' events, for example when changing job or starting a family.
Travel behaviour change programmes, which target these events, can encourage more sustainable travel choices by motivating people to consider alternatives.
In terms of implementing policy an understanding of the economic and health benefits of sustainable travel is also key. Physical inactivity can cost a country EUR 150–300 per capita per year (WHO, 2013), while cycling has positive benefit cost ratio of 5:1 (median value from a range of studies; WHO, 2011). Online tools such as the Health Economic Assessment Tool (HEAT) developed by the WHO could play an important role in helping policy makers understand these economic benefits. (WHO, 2013a).
7.2.1 Increasing the share of walking and cycling
The above behavioural change strategies can help create the desire and motivation for change. This, however, needs to be combined with the correct infrastructure and facilities. For meaningful, long-term shifts to walking and cycling to be achieved, those who are persuaded to try it have to find the experience pleasant, convenient and safe.
Analysis of bicycle trips in selected cities in the Netherlands, Denmark, Germany and the United Kingdom highlights the very wide variations in share found, even within a given country. It also allows the most effective policy interventions to be identified. These can be summarised as:
• extensive systems of separate cycling facilities (well maintained and fully integrated);
• intersection modifications and priority traffic signals for cyclists;
• traffic calming (30 km/h speed limits in residential areas, physical deterrents for cars);
• large supply of good bike parking throughout the city;
• coordination with public transport (extensive bike parking at all public transport hubs);
• strict enforcement of cyclist rights by police and courts.
The authors (Pucher & Buehler, 2008, 2010) highlight the need for 'coordinated implementation of all of these measures, so that they reinforce the impact of each other in promoting cycling.

Part B│Options to minimise impacts
63A closer look at urban transport
The role of ranking and benchmarking is also key. Here the Copenhagenize Index (see Box 7.2) of bicycle-friendly cities and the European Cyclists' Federation (ECF, 2013) first EU-wide cycling barometer play important roles.
The emergence of electrically-assisted bicycles (with a typical range of 80 kilometres) also makes cycling a much more viable option for older people, longer journeys and hillier geographic regions. Compared to electric cars, electric bikes and scooters are much more available and affordable and do not require any recharging infrastructure as they typically have a removable battery which can be recharged at home. Western Europe is currently the second largest market for electric bikes and is expected to see a compound annual growth rate of over 9 % by 2020 (Navigant, 2013).
New mobility services are also key to the take up of innovative cycle hire and share schemes. These bike-share schemes have generally had success — the City Bike of Vienna which was launched in 2003, has 1 200 bicycles, 92 bike stations and has resulted in 2.7 million journeys since the system commenced (data from 2012 — ECF, 2013a). The Veturilo system in Warsaw is in place since 2012 and during the first month bikes were rented 200 000 times.
7.2.2 Developing the use of public transport
The proximity to a public transport interchange can significantly influence how many people use or
are willing to use public transport. Cities in Europe offer different modes of public transport (bus, tram, metro, train) with different speeds and frequencies and different number of stops (see Box 7.3).
The key to increasing the use of public transport is the development of high quality, convenient alternatives that can effectively compete with the car. It is worth repeating here the aim once stressed by Enrique Peñalosa, former Mayor of Bogotá, Colombia 'A developed country is not a place where the poor have cars. It's where the rich use public transport'. Reliable and frequent public transport services have been shown to contribute to higher levels of satisfaction with public transport and an increase in demand levels (Redman et al., 2013). Often a number of measures are combined over an entire public transport route to provide a 'quality corridor'. These measures include:
• public transport priority through 'physical' bus lanes (such as those clearly separated by plastic lines) and priority phasing of traffic lights;
• high quality accessible vehicles with low floor and wheel-chair access;
• real-time passenger information both at stops and inside vehicles;
• improved interchanges providing better integration between modes, with improved pedestrian access and cycle parking;
Box 7.2 The Copenhagenize Index 2013 on bicycle-friendly cities
The Copehagenize Index of bicycle-friendly cities is a ranking of over 150 cities worldwide. The first ranking took place in 2011 with a second ranking following in 2013. The ranking is based on 13 different categories. These categories include:
• variables related to the emphasis of bicycle in urban planning, the modal share for bicycles and its increase since 2006, the existence of traffic-calming measures (such as speed-reduction measures, shared spaces, street layouts in favour of non-motorised transport), bicycle facilities and infrastructure or the presence of a bike-share programme;
• variables to do with governance and social issues, such as the local political climate regarding urban cycling, the perception of safety (with mandatory helmet laws contributing to a low rating and low helmet-usage rate a high rating in the ranking) and social acceptance (related to how drivers and the community at large regard urban cyclists);
• variables that give a sense of intangible features that makes a city bike friendly, as the level of advocacy (the existence of cycling organisations and the level of respect that they enjoy in political circles), bicycle culture as bike being accepted as a normal form of transport by citizens) or gender split among bike commuters.
The set of variables allows for a comprehensive analysis of cities, taking into account issues such as political ambition versus the real investment, and the seriousness of bike-friendly actions in cities that eventually result in a significant modal share for bicycles.
Source: http://copenhagenize.eu/index/index.html.

Part B│Options to minimise impacts
64 A closer look at urban transport
Box 7.3 Access to public transport in European cities
Easy access to public transport is defined as a five-minute walk for medium-speed modes (busses and trams) and a ten minute walk for high-speed modes (metros and trains). The frequency classes are defined based on the average number of departures an hour between 7 am and 8 pm on a normal weekday:
• Very high: Access to more than ten departures an hour for both medium- and high-speed modes.
• High: Access to more than ten departures an hour for one mode, but not both
• Medium: Access to between four and ten departures an hour on one or both modes, but no access to more than ten departures and hour
• Low access: less than four departures an hour for one or both modes, but no access to more than four departures an hour
The analysis below compares the share of people that have easy access to a public transport stop broken down by frequency of departures in multiple European cities. It is the first time that such a harmonised comparison is possible. The analysis shows that large cities enjoy greater levels of very high access than medium cities. Among the large cities, access to (very) high frequency stops is over 75 % in the urban centre of Stockholm, Helsinki, Athens, Marseille and Torino, while in the centre of Dublin it is only 43 %. In some cities, such as Budapest, the high access is good (65 %), but overall access relatively low (75 %). The analysis is based on four main sources of information:
• A harmonised definition of the urban centre developed by the EC and OECD (see note)
• Geocoded location of all public transport stops and their mode and frequency
• A detailed distribution of population in a city
• A street network
Even though there are many details and variables that should be considered here, i.e. the importance of non-motorised modes in each city, accessibility levels are in line with Figures 5.1 and 5.2, as public transport in Amsterdam has a relative low modal share while it is up to 24 % in the case of Stockholm (with more than 35 % of the population in the urban centre with a 'very high' access to public transport).
Access to public transport in large (left) and midium-sized (right) European cities, 2012
Note: http://ec.europa.eu/regional_policy/sources/docgener/focus/2012_01_city.pdf.
Source: Lewis Dijkstra and Hugo Poelman, Directorate-General for Regional and Urban Policy, European Commission. A Regional Working Paper is forthcoming.
0
10
20
30
40
50
60
70
80
90
100
Dublin
The H
ague
Rotte
rdam
Buda
pest
Berlin
Amste
rdam
Manch
ester
Cope
nhag
en
Brus
sels
Stoc
kholm
Helsink
i
Athe
ns
Marse
illeTu
rin
Share of population of the urban centre (%)
No access Low Medium High Very high No access Low Medium High Very high
0
10
20
30
40
50
60
70
80
90
100
Eindh
oven
Leide
n
Dordr
echt
Char
leroi
Haarle
mLiè
geGen
t
Antw
erp
Bord
eaux
Tallin
n
Göteb
org
Toulo
use
Utre
cht
Malmö
Share of population of the urban centre (%)

Part B│Options to minimise impacts
65A closer look at urban transport
• integrated ticketing with the use of smart cards;
• branding buses to promote a faster service and simplification of routes.
Many cities have been investing in new or updated tram and metro systems, providing high-quality mass transit systems. Others have been developing rapid transit bus systems. The infrastructure investments are more notorious if complemented by information and marketing activities.
In addition, offers such as low price or free tickets and other incentives, which will induce consumers to change behaviour, have a role to play. The city of Tallinn has recently introduced free public transport across the city aiming to 'safeguard social cohesion of local communities by granting equal mobility opportunities to all social strata' (Box 7.4). It is hoped that car drivers will find it an incentive to switch to public transport, 'thus reducing pollution and noise, and, in the long run, will improve living standards of all citizens' (ELTIS, 2013c).
7.2.3 Alternatives to road freight
The potential for mode shift in the freight sector is perhaps more limited than for passenger transport. There are opportunities for using rail or water transport to bring goods into, and out of, cities where infrastructure for these modes exists. Supporting the development of these modes requires both national and local action. Perhaps the most important policy action at the local level is the use of a planning system to safeguard sites around such infrastructure to allow freight activities. Both Paris and London have taken this approach to safeguard sites along the river frontage for freight handling activities (TURBLOG, 2011; DG MOVE, 2012).
Such systems rely on the local availability of infrastructure close to where supply and demand is located. They are to some extent opportunistic and have to be developed on a case by case basis. One example is the servicing of canal-side hotels and restaurants by barge in Utrecht (DG MOVE, 2012). The barge, known as the Beer-boat, is electrically powered and is rented by suppliers to make their deliveries. The cost of the service is estimated to be lower than using a conventional van because of a range of city restrictions that apply to these vehicles.
7.3 Improving modal efficiency
7.3.1 New mobility services
There is a growing use of what might be considered 'new mobility services' that are helping to improve efficiency and integrate different traditional transport modes (Schipple and Puhe, 2012). Key concepts include:
• Bike-sharing — where a person can use a bike to make a journey and return it to either the same or a different location. This helps encourage a cycling culture and generate greater use of public transport. The added value of these schemes depends strongly on their capacity to trigger modal change from cars, as oppose to public transport users, and the extent in which the schemes create a more favourable cycling culture in each particular city. Existing cycling infrastructure and accompanying measures to reduce the use of unnecessary trips by private car are key to successful deployment. In this sense, the economic viability of these systems has triggered many debates. In the case of cycling, recent estimations (Anaya and Castro, 2012) suggest that the costs covered by users are around 28.4 %, which is very much in line with the figures for other modes of transport (38.4 % for buses, 59.6 % underground and 19.5 % for trams). The figures do not take into account the benefits in terms of reducing congestion, improving air quality and noise levels or the invaluable improvements in the health of users and the quality of life in cities for citizens and visitors.
• Car-sharing — is essentially short term car rental. Members join a car-sharing scheme with an annual fee and then pay per hour of use for the cars. The main benefits of car-sharing are that members have lower average mileage and a much greater use of other modes than traditional car users (Carplus, 2013). A possible criticism of car sharing schemes is that they provide a comparatively low cost, easy access route to car use for those who do not currently own a car, and could thus be argued to provide a potential stimulus for increased motoring. However, current evidence suggests that any tendency for this to happen is more than outweighed by the reductions in levels of car use achieved through former car owners giving up ownership in favour of car-sharing. Typical car sharing vehicles have 20 % lower CO 2 emissions than private cars (Carplus, 2013) and they have been leading the way in promoting electric and other low emission
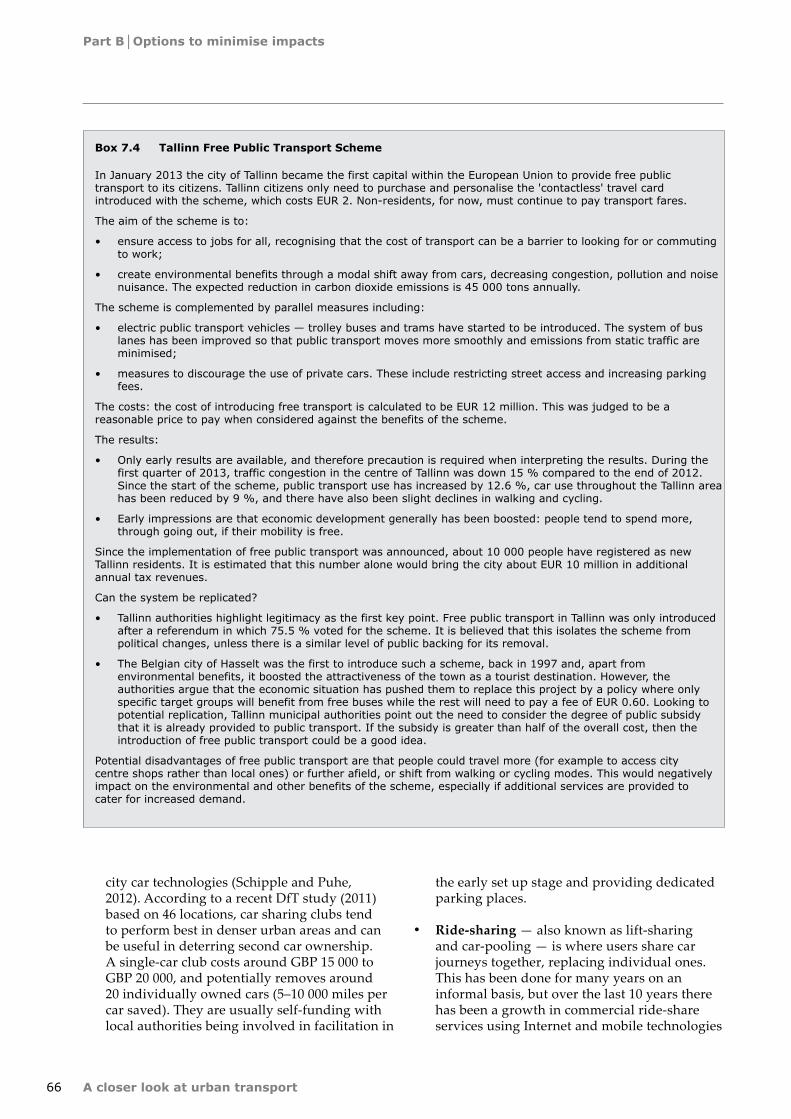
Part B│Options to minimise impacts
66 A closer look at urban transport
Box 7.4 Tallinn Free Public Transport Scheme
In January 2013 the city of Tallinn became the first capital within the European Union to provide free public transport to its citizens. Tallinn citizens only need to purchase and personalise the 'contactless' travel card introduced with the scheme, which costs EUR 2. Non-residents, for now, must continue to pay transport fares.
The aim of the scheme is to:
• ensure access to jobs for all, recognising that the cost of transport can be a barrier to looking for or commuting to work;
• create environmental benefits through a modal shift away from cars, decreasing congestion, pollution and noise nuisance. The expected reduction in carbon dioxide emissions is 45 000 tons annually.
The scheme is complemented by parallel measures including:
• electric public transport vehicles — trolley buses and trams have started to be introduced. The system of bus lanes has been improved so that public transport moves more smoothly and emissions from static traffic are minimised;
• measures to discourage the use of private cars. These include restricting street access and increasing parking fees.
The costs: the cost of introducing free transport is calculated to be EUR 12 million. This was judged to be a reasonable price to pay when considered against the benefits of the scheme.
The results:
• Only early results are available, and therefore precaution is required when interpreting the results. During the first quarter of 2013, traffic congestion in the centre of Tallinn was down 15 % compared to the end of 2012. Since the start of the scheme, public transport use has increased by 12.6 %, car use throughout the Tallinn area has been reduced by 9 %, and there have also been slight declines in walking and cycling.
• Early impressions are that economic development generally has been boosted: people tend to spend more, through going out, if their mobility is free.
Since the implementation of free public transport was announced, about 10 000 people have registered as new Tallinn residents. It is estimated that this number alone would bring the city about EUR 10 million in additional annual tax revenues.
Can the system be replicated?
• Tallinn authorities highlight legitimacy as the first key point. Free public transport in Tallinn was only introduced after a referendum in which 75.5 % voted for the scheme. It is believed that this isolates the scheme from political changes, unless there is a similar level of public backing for its removal.
• The Belgian city of Hasselt was the first to introduce such a scheme, back in 1997 and, apart from environmental benefits, it boosted the attractiveness of the town as a tourist destination. However, the authorities argue that the economic situation has pushed them to replace this project by a policy where only specific target groups will benefit from free buses while the rest will need to pay a fee of EUR 0.60. Looking to potential replication, Tallinn municipal authorities point out the need to consider the degree of public subsidy that it is already provided to public transport. If the subsidy is greater than half of the overall cost, then the introduction of free public transport could be a good idea.
Potential disadvantages of free public transport are that people could travel more (for example to access city centre shops rather than local ones) or further afield, or shift from walking or cycling modes. This would negatively impact on the environmental and other benefits of the scheme, especially if additional services are provided to cater for increased demand.
city car technologies (Schipple and Puhe, 2012). According to a recent DfT study (2011) based on 46 locations, car sharing clubs tend to perform best in denser urban areas and can be useful in deterring second car ownership. A single-car club costs around GBP 15 000 to GBP 20 000, and potentially removes around 20 individually owned cars (5–10 000 miles per car saved). They are usually self-funding with local authorities being involved in facilitation in
the early set up stage and providing dedicated parking places.
• Ride-sharing — also known as lift-sharing and car-pooling — is where users share car journeys together, replacing individual ones. This has been done for many years on an informal basis, but over the last 10 years there has been a growth in commercial ride-share services using Internet and mobile technologies

Part B│Options to minimise impacts
67A closer look at urban transport
to match rides (examples include liftshare.com in the United Kingdom and mitfahrgelegenheit.de in Germany. Conventionally these systems work based on arranging sharing in advance. However the recent growth in ownership of smartphones with GPS location awareness has allowed real-time ride-sharing services to be developed.
7.3.2 Traffic management and integration
The continuing development in IT has already been seen in a number of areas including passenger information and freight logistics. Intelligent transport systems can be used at an urban level to manage traffic flows and behaviour more intelligently. Most cities now have urban traffic control (UTC) systems designed to manage junctions and ease the flow of vehicle traffic on an area-wide basis. Traditionally, they have been used to manage congestion, which in itself will improve the environmental performance of vehicles. However, they are increasingly being looked at to help reduce and manage vehicles emissions more directly. UTC systems have been linked to air quality monitoring and forecasting, have been used to give priority to low emission vehicles and direct traffic away from congested and polluted areas. For example in Utrecht, a system to route goods vehicle traffic away from areas with high pollution in real-time (CIVITAS, 2013) was trialled, and in Leicester an integrated traffic management and air quality system has been developed that will generate traffic control scenarios optimised to improve air quality (i-TRAQ, 2013).
Financial constraints from cities to invest in technology are usually seen as the main barrier to introduce city-wide improvements on ICT, as well as lack of knowledge of the current technical solutions available in the market to improve urban transport performance.
7.3.3 Driver behaviour
Driver behaviour can be the single biggest factor in the performance of a vehicle, with fuel consumption varying between drivers by up to 30 %. Given training on fuel efficient or 'eco-driving' techniques most drivers can improve their fuel consumption by up to 15 %, with the associated cost and CO 2 savings (EST, 2013). Many countries have developed training schemes in recent years and there has been significant co-operation through EU-level projects such as
EcoDriven and EcoWill (EcoWill, 2013). Much of this has focused on car drivers and car fleets, and now many countries are integrating eco-driver training into national driver training and examination (EcoWill, 2010).
A significant amount of effort has also been directed at driver training with freight fleets, including national schemes such as the Safe and Fuel Efficient Driving programme in the United Kingdom (DfT, 2010). Driver training has also been promoted at the local level, quite often as part of a wider freight-efficiency programme.
7.3.4 Regulation and pricing
The most widely-used regulation to promote the use of low(er) emission vehicles is the LEZ. This is a particular type of access restriction used in urban areas that restricts access to vehicles based on their emissions performance, usually based on Euro emissions standards, and such schemes have been widely adopted across Europe. In many cases, the focus is on heavy duty vehicles, trucks and buses, and on fleet renewal or retrofit emissions control equipment.
The effectiveness of such schemes depends on the scale at which they are implemented, the level of emissions performance promoted and the effectiveness of enforcement. In general, they have most effect when applied to all vehicle types in an area. When just applied to heavy duty vehicles the impact has been less. For example a study of five schemes in the Netherlands, directed at heavy vehicles, found limited impacts (Boogaard, 2012). The greatest impact of many LEZs appears to have been a reduction in PM2.5 and black carbon, related largely to the introduction of particulate filters, and in areas of high HGV traffic, with the impact on overall PM10 and NO2 levels being considerably less.
The difficulty in tackling overall PM10 concentrations is because they are also affected by other combustion sources and non-exhaust emissions such as brake and tyre dust which are more difficul to be reduced by LEZ's. The limited impact on NO2 is likely to be due to the fact that many schemes have focused on the reduction of PM through promoting the use the retrofit particulate traps and newer Euro standards, which will not necessarily reduce NO2 emissions (see Box 4.1). However, another factor may well be related to the underperformance of Euro emission standards in real-world urban driving as previously noted. At the European level there seems to be a

Part B│Options to minimise impacts
68 A closer look at urban transport
need for greater understanding of the performance of LEZs and how they can be made more effective.
However, some examples demonstrate that the success of LEZs in terms of their availability to reduce emissions and improve air quality depends on the concrete rules governing the area (see TERM 2012 (EEA, 2012)).
Pricing measures have also been used to promote low emission vehicles as in the low emission vehicle exemptions for the London congestion charge. Milan's EcoPass scheme charges vehicles to enter the city based on their emissions performance with the cleanest vehicle being free. The scheme has had a significant impact on vehicle fleet composition with the number of passenger vehicles in the charged categories dropping by 70 % over a three-year period (Danielis, 2011). It also seems to have had a significant impact on PM concentrations in the city, but a more variable impact on NO2 concentrations. The scheme has also provided a very positive cost/benefit ratio in relation to revenue, congestion benefits and air quality benefits. Such pricing mechanisms can provide a more flexible approach than simple regulations and can have additional benefits in wider demand management.
7.4 Sustainable urban mobility plans
Potential solutions for sustainable mobility in cities across Europe need to be drawn together into a consistent and coherent mobility plan, integrated with other city plans and policies.
These mobility plans have become known as SUMPs. Their importance has also been underlined in the EC Transport White Paper (EC, 2011), which emphasises the importance of 'a mixed strategy involving land-use planning, pricing schemes, efficient public transport services and infrastructure for non-motorised modes and charging/refuelling of clean vehicles is needed to reduce congestion and emissions'. It also recognises that such plans need to be fully aligned with urban development plans to ensure that wider urban planning and transport planning are not in conflict.
The process for developing a SUMP was clearly set out in the guidelines developed by the EltisPlus
project and is illustrated in Figure 7.1. It essentially consists of four key stages covering analysis of the existing situation, setting improvement goals, developing a clear set of actions and an implementation strategy. In developing these plans they need to consider all aspects of mobility, both passenger and freight, and the wider economic development of the city. They must also be clearly rooted in the policy context at the national and European level, ensuring that they support these policy objectives.
Progress on SUMPS across Europe varies. However, even in countries that are performing well there are significant barriers to the successful development of a SUMP including:
• existing dominance of the car and car orientated infrastructure;
• a lack of joint working between sectors, particularly transport and land use;
• gaps in relevant knowledge among officials;
• insufficient funds for the preparation of SUMPs and increasingly for infrastructure itself;
• resistance to change both within municipalities and key stakeholder organisations.
A key element is to fill knowledge gaps and promote the benefits of SUMPS. This is often best done by getting cities to learn from each other and transfer knowledge (Marsden et al., 2009; Marsden and Stead 2011) for example through existing initiatives such as ELTIS and the CIVITAS Forums.
There is also a need for financial support both for developing SUMPS and the measures within them. This is particularly important when the concept is little known in an area and the measures being considered are new or innovative. In these cases managing risk with supportive funding can help generate action where it might otherwise not occur.
In terms of more formal instruments the European Commission is preparing a strategy aimed at providing common rules and procedures for the development of SUMPS by city authorities, to ensure greater harmonisation of plans and improve their quality.

Part B│Options to minimise impacts
69A closer look at urban transport
Figure 7.1 SUMPS elements and activities
Source: Rupprecht Consult, 2013.

70
Main messages and conclusions
A closer look at urban transport
8 Main messages and conclusions
Overview of progress towards the key five transport goals
The TERM 2013 report provides the second assessment of progress towards the five key environmental goals identified in the Transport White Paper and other transport policy documents. The latest data show that progress is in line with the 'target trajectory' for all of the five goals except the use of renewable energy in the transport sector, while final figures on emissions of maritime bunker fuels data for 2011 are still to be confirmed.
The five key goals sit within the EU's overall goal to achieve a 60 % reduction in transport GHG emissions by 2050 (including aviation but excluding international maritime emissions). Progress towards this overall goal remains on target. The observed data indicate that the slight reduction achieved between 2009 and 2010 has continued in 2011. The challenge will be to maintain this progress when the European economic situation returns to pre-recession levels of growth as the 'target trajectory' demands significant reductions between 2015 and 2020.
Transport oil consumption has also been reduced based on the most recently available data from 2011. However, consumption remains above the 'trajectory' towards the 2050 goal of a 70 % reduction relative to 2008. This is based on the Transport White Paper Impact Assessment (EC, 2011c).
Passenger car CO 2 emissions have also continued on a downward trend. Policies in this area appear to be achieving objectives and the 2015 goal of 130g/km may well be achieved ahead of time. In fact, the annual reduction from 2007 suggests that many manufacturers are on track towards the 2015 target while aiming at reducing emissions in the light of the 2020 goal indicated by current legislation. To help address the current problem of a gap between the officially approved fuel consumption figures and those typically achieved under real-world driving conditions, Members of the European Parliament have requested that the World Harmonised Light Duty Test Procedure (WLTP) is introduced as a matter of urgency
and, if possible, by 2017. The WLTP is a global, harmonised procedure for measuring CO2 and pollutant emissions from light-duty vehicles. It remains to be seen what impact this will have on CO 2 emissions tests and whether these changes will sufficiently reduce the gap between real-world fuel consumption and test cycle results to both restore confidence in these to the buyer and reduce the undermining of regulated CO 2 limits.
International maritime energy consumption and tonne-kilometres remained broadly unchanged in 2011. However, data for CO2 emissions appear to show a sharp rise. This seems to be due to inconsistencies between Eurostat data and that reported to United Nations Framework Convention on Climate Change (UNFCCC), and will need to be verified before assessing any trend. The European Commission's strategy on integrating maritime transport emissions in the EU's GHG reduction policies (EC, 2013) is expected to achieve reductions if the target of a 40 % reduction by 2050 for this sector is to be reached.
The target to increase the share of renewable energy in transport to 10 % by 2020 may prove difficult to achieve. The recent European Commission proposal to allow only 5 % of this target to be met using first-generation crop-based biofuels means that there is now more effort needed to achieve this target. It will require a very substantial increase in production of next-generation biofuels or higher use of renewable electricity. In the short term, only a relatively limited contribution can be expected from plug-in electric vehicles using renewably generated electricity.
Principle findings from the twelve TERM Core Set of Indicators (TERM-CSI)
The TERM-CSI is a selection of 12 indicators from the broader set of EEA transport indicators which enable monitoring of the most important aspects of transport impacts. The TERM-CSI indicators provide a mixed picture of transport's overall environmental impacts in Europe. The continuing reduction of both total energy consumption and GHG emissions is

Main messages and conclusions
71A closer look at urban transport
welcome. This has been achieved despite estimated passenger transport growth of 10 % between 2000 and 2011. Freight demand may also be expected to grow if GDP continues on an upward path whilst rail has seen growth in freight demand in both the EU-13 and EU-15. If these observed signals are confirmed in the near future, then this would mark a starting point for the reversal of a long-term overall decline in rail freight share. This would need to be maintained if the Transport White Paper target of 30 % of road freight over 300 km shifting to other modes, such as rail or waterborne transport by 2030, is to be met.
Air quality remains a key concern. Limit values for NO2 and PM10 continue to be exceeded in a large number of locations (as shown in Box 2.5). Worryingly, the most recent data on transport emissions of air pollutants indicate that the long-term trend of decline is no longer taking place in 2011 (as shown in Box 2.4).
Actions are crucial in European cities to improve the way we move and transport goods
Many of the responses that are needed to address these negative environmental impacts must come from Europe's growing towns and cities. Urban transport is responsible for up to 25 % of all transport CO2 emissions, and residents of urban areas currently suffer far worse air pollution, noise and congestion than those in rural areas. More than three-quarters of Europeans live in urban areas and nine out of ten of them believe improvements are needed to traffic in their area.
Transport, particularly road transport, is a major emitter of PM and NOX, among other pollutants. For instance, the transport sector is responsible for 58 % of all the NOX emitted in the EEA-33 in 2011, 32 % from road transport alone. As Box 4.1 shows, increasing NOX emissions per vkm from diesel vehicles from the Euro 3 standard onwards (a trend that seems to stop with Euro 6 vehicles), and the increased fraction of NO2 emitted as NOX, have significantly contributed to persistent NO2 concentrations in EU cities. Tropospheric O3 is, along with PM, Europe's most problematic pollutants in terms of harm to human health. Because NOX also contributes to the formation of tropospheric O3 and PM, and road transport in cities is also a substantial source of primary PM, actions to avoid unnecessary motorised trips (including a shift to other modes) would significantly benefit air quality in urban areas.
Urban transport is essential in terms of ensuring the quality of life for city dwellers. Maintaining the basic functions and services of urban transport, whilst improving the quality of life for citizens, means developing, implementing and reinforcing the facilities for cyclists and pedestrians until clean technology is fully available and in use. The use of urban space currently allocated to road transport could be more fairly distributed in order to improve the quality of life within cities.
Many of Europe's towns and cities are leading the way in addressing these issues. In each of the main policy areas, examples of highly successful approaches can be identified. Nevertheless, every town and city is different and each must find what works best for their individual needs. Addressing urban transport's environmental impacts is challenging but also offers opportunities. Given urban transport's contribution to emissions and energy use it plays a vital role in ensuring achievement of the Transport White Paper targets.
In Chapter 7, many of these successful approaches have been discussed. There is an increasing body of evidence and knowledge being compiled through various European research and information initiatives such as ELTIS, CIVITAS and the Intelligent Energy Europe Programme. Approaches include the use of Smart Technology to help progress innovative bicycle and car sharing schemes. These help ensure the formation of new mobility services, reducing reliance on the car, and tapping into potential social and cultural moves away from car ownership by younger people. Investment in targeted behavioural change programmes, alongside improvements in public transport and walk and cycle facilities can also result in significant modal shift. Measures to facilitate further this modal shift can require the use of access management schemes to ensure 'lock in' for these benefits (Sloman et al., 2010).
One can highlight the Danish model of bicycle use to illustrate the potential for cities to contribute to the EU targets. As the European Cyclist Federation claims, bicycle use would contribute between 12 to 26 % of the 60 % reduction target (ECF, 2011) if levels of cycling in the EU-27 were the same as those in Denmark.
In terms of facilitating the implementation of the approaches included in Chapter 7, efforts are on-going at European Union, Member State and city level. The European Union plays a role in the setting of targets and regulation and the monitoring of progress. At the Member State level, governments take forward measures and ensure

Main messages and conclusions
72 A closer look at urban transport
targets are achieved. Actions at the city level include government led initiatives as well as actions such as the introduction of Sustainable Urban Mobility Plans through which a package of measures to achieve a more sustainable modal share can be implemented. Consideration must be given to the current transport use trends shown between different European Union cities and Member States and the steps that can be taken to ensure that these move in a positive direction. On-going research into the causes of the stabilisation of car use at the EU-15 level is key. This is particularly relevant where measures and learning are transferable such as through improvements in public transport and walking as well as cycle infrastructure and through pricing mechanisms.
Political will and funding are needed, but public acceptance is key to success and future imitation
In order to introduce the measures and approaches mentioned in Chapter 7, it is necessary to consider what makes them politically and socially possible, and what should be done to overcome barriers such as a lack of political will and funding. Raising awareness about the effectiveness of integrated approaches, both in terms of efficiency in the use of resources and gains in public confidence and acceptability to support these measures through active involvement and action, is the way ahead to overcome such barriers.
A clear vision, and a determination to deliver it, is a key element. Many schemes, which have proved popular once introduced, have had to overcome a transitional phase (Börjesson et al., 2012). Here, strong political will is required. Often transformational changes needed in some cities
may only be achievable if the right governance structures are in place.
It is also crucial to maintain a dialogue at all stages with all those involved and affected, aiming to build a consensus and broaden the support base for the introduction of new measures. Time and budget must be set aside for engagement and marketing activities to communicate the benefits of changes and build understanding and support among the public. Furthermore, as discussed in Chapter 7, in terms of implementing policy an understanding of the economic and health benefits of sustainable travel is crucial.
The implementation and use of new smart technologies, and the development and use of innovative low carbon vehicles and associated fuelling infrastructure, will also help ensure that European cities retain a competitive edge, and contribute to the development of valuable economic intellectual property.
Finally, it is necessary to have a coordinated approach, which integrates a whole range of policy measures, to achieve the desired results. Ultimately, in order to gain public support this must aim to address not just the environmental impacts of the transport system, but to create an improved quality of life for all European citizens.
Urban transport accounts for a significant share of the environmental and social impacts of transport in Europe. Meeting the transport policy aims and goals set out in the White Paper will be dependent upon towns and cities across Europe following the example of those places that have already made good progress in tackling these issues. If this can be achieved, then it will lead to a better quality of life for all of Europe's citizens.
73
Acronyms and abbreviations
A closer look at urban transport
Acronyms and abbreviations
BC Black carbon
BEI Baseline Emission Inventory
CADC Common Artemis Driving Cycle
CARE Community Database on Accidents on the Roads in Europe
CDP Collection and Delivery Points
CNG Compressed natural gas
CO Carbon monoxide
CO2 Carbon dioxide
COICOP Classification of Individual consumption by purpose
dB Decibel
DG CLIMA Directorate-General for Climate Action
DG ENER Directorate-General for Energy
DG ENV Directorate-General for Environment
DG MOVE Directorate-General for Mobility and Transport
DG TAXUD Directorate-General for Taxation and Custom Union
DPSIR Driving forces, pressures, state of the environment, impacts and societal responses
DSPs Delivery and Servicing Plans
EC European Commission
ECA Emission Control Areas
EEA European Environment Agency
EFTA European Free Trade Agreement
EMEP European Monitoring and Evaluation Programme
EMTA European Metropolitan Transport Authorities
EU European Union
EUETS European Emissions Trading Scheme
EUR Euros
EPOMM European Platform on Mobility Management
ETC/ACM European Topic Centre for Air and Climate Mitigation
ETC/SIA European Topic Centre for Spatial Information and Analysis
ETS Emissions Trading Scheme

Acronyms and abbreviations
74 A closer look at urban transport
FQD Fuel Quality Directive
g grams
GDP Gross domestic product
GHG Greenhouse gas
HDV Heavy duty vehicle
HEAT Health Economic Assessment Tool
HGV Heavy goods vehicle
HSR High speed rail
IARC International Agency for Research on Cancer
ICCT International Council of Clean Transportation
ICT Information and Communications Technologies
IT Information Technologies
IWW Inland waterways
JIT Just In Time
JRC Joint Research Council
Km kilometer
ktoe kilo tonne oil equivalent
LEZ Low Emission Zone
Lden Day-evening-night noise indicator
Lnight Night time noise indicator
LDG Light Good Vehicles
LNG Liquefied natural gas
LPG Liquefied petroleum gas
LRTAP Long-range Transboundary Atmospheric Pollution
LV Limit value
MJ Megajoule
MTOE Mega tonne oil equivalent
Mt CO2-equivalent Million tonnes of CO2-equivalent
NECD National Emission Ceilings Directive
NEDC New European Drive Cycle
NG Natural gas
NH3 Ammonia
NMVOC Non-methane volatile organic compound
NO
N2O
NOX
Nitrogen monoxide
Nitrous oxide
Oxides of nitrogen

Acronyms and abbreviations
75A closer look at urban transport
NO2
O3
Nitrogen dioxide
Ozone
OECD Organisation for Economic Co-operation and Development
PHEV Plug-in Hybrid Electric Vehicle
PM Particulate matter
PM2.5 Particulate matter with a diameter of 2.5 micrometers or less
PM10 Particulate matter with a diameter of 10 micrometers or less
pkm Passenger-kilometres
ppm Parts per million
PTA Public Transport Authority
RED Renewable Energy Directive
SEAP Sustainable Energy Action Plan
SUMPs Sustainable Urban Mobility Plans
SO2
SOX
Sulphur dioxide
Sulphur oxides
TERM Transport and Environment Reporting Mechanism
TERMCSI Transport and Environment Reporting Mechanism — Core Set of Indicators
TfL Transport for London
tkm Tonne-kilometres
UMZ Urban Morphological Zones
UN United Nations
UNECE United Nations Economic Commission for Europe
UNFCCC United Nations Framework Convention on Climate Change
UTF Urban Traffic Control
VAT Value Added Tax
VOC Volatile organic compound
WHO
WLTP
World Health Organization
Worldwide harmonised Light-duty Test Procedure
μg/m3 Micrograms per cubic meter

76
References
A closer look at urban transport
References
Adams, H.S., Nieuwenhuijsen, M.J., Colvile, R.N., McMullen, M. A. and Khandelwal, P., 2001, 'Fine particle (PM2.5) personal exposure levels in transport microenvironments', Science of the Total Environment, 279 (1–3), 29–44.
Adams, H.S., Nieuwenhuijsen, M.J., Colvile, R.N., Older, M.J. and Kendall, M., 2002, 'Assessment of road users' elemental carbon personal exposure levels', Atmospheric Environment, (36) 5 335–5 342.
Aeroports de Paris, 2011, Paris Charles de Gaulle 2011 Customer Guide (http://www.aeroportsdeparis.fr/ADP/Resources/18668e9f-f2ef-4af1-bc4f-58aa8607c68d-BATguideduclientVA.PDF) accessed 9 August 2013.
Airports Commission, 2013, Aviation Noise Discussion Paper (https://www.gov.uk/government/publications/aviation-noise-discussion-paper) accessed 9 August 2013.
Albalate and Bel, 2009, 'What Local Policy Makers Should Know about Urban Road Charging: Lessons from Worldwide Experience', Public Administration Review, 69 (5) 962–974.
Allen, J. and Browne, M., 2010, Considering the relationship between freight and urban form, Transport Studies Department, University of Westminster, London (http://www.greenlogistics.org/themesandoutputs/wm9/downloads/Freight%20transport%20and%20urban%20form%20Final%20September%202010.pdf) accessed 16 October 2013.
Allen, J., Browne, M. and Woodburn, A., 2012, London Freight Data Report: 2012 Update, Prepared for Transport for London (http://www.tfl.gov.uk/microsites/freight/documents/london-freight-data-report-2012.pdf) accessed 16 October 2013.
Anaya, E., and Castro, A., 2012, Balance General de la Bicicleta Pública en España, Fundacion ECA — Bureau Veritas (http://www.eltis.org/docs/tools/Bike_sharing_schemes_in_Spain.pdf) accessed 9 August 2013.
Banister, D., 2008, The sustainable mobility paradigm. Transport Policy, (15) 73–80.
Boogaard, H., Borgman, F., Kamminga, J. and Hoek, G., 2009, 'Exposure to ultrafine and fine particles and noise during cycling and driving in 11 Dutch cities'. Atmospheric Environment, (43) 4 234–4 242.
Boogaard, H., Janssen, N., Fischer, P., Kos, G., Weijers, E., Cassee, F., van der Zee, S., Hartog, J., Meliefste, K., Wang, M., Brunekreef, B. and Hoek, G., 2012. 'Impact of low emission zones and local traffic polices on ambient air pollution concentrations', Science of the Total Environment, (435–436) 132–140.
Börjesson, M., Eliasson, J., Hugosson, M., and Brundell-Freij, K., 2012, 'The Stockholm Congestion Charges —5 years on. Effects, acceptability and lessons learnt', Transport Policy, (20) 1–12.
British Cycling, 2013, HGVs and cycling: why the two are uneasy bedfellows (http://www.britishcycling.org.uk/campaigning/article/20130619-campaigning-road-safety-HGVs-and-Cycling--Why-the-two-are-uneasy-bedfellows-0) accessed 29 July 2013.
Cairns, S., 2009, Can teleconferencing reduce business travel?, Transport Studies Group, UCL, London.
Carplus, 2013, Carplus — rethinking car use (www.carplus.org.uk) accessed 18 July 2013.
Church, A., Frost, M. and Sullivan, K., 2000, 'Transport and Social Exclusion in London', Transport Policy, (7) 195–205.
CE Delft, 2011, External Costs of Transport in Europe — Update study for 2008, Report for the International Union of Railways, CE Delft, Infras and Fraunhofer ISI, Delft (http://ecocalc-test.ecotransit.org/CE_Delft_4215_External_Costs_of_Transport_in_Europe_def.pdf) accessed 7 October 2013.
CIVITAS, 2012, CIVITAS Guide for the Urban Transport Professional, results and lessons from the long term evaluation of the CIVITAS initiative, Delft (http://www.civitas.eu) accessed 20 August 2013.

References
77A closer look at urban transport
CIVITAS, 2013, Clean Route Planning for Freight Transport — Utrecht, CIVITAS, Delft (www.civitas-initiative.org) accessed 3 July 2013.
Corpuz, G., 2011, 'An empirical assessment of teleworking using the Sydney Household Travel Survey data', Proceedings of the Australian Transport Research Forum 2011, Adelaide.
Dalkmann, H. and Brannigan, C., 2007, Sustainable Transport: A Sourcebook for Policy‑makers in Developing Cities, Deutschen Gesellschaft für Internationale Zusammenarbeit, Bonn. (http://lib.icimod.org/record/13155/files/5302.pdf) accessed 8 November 2013.
Danielis, R., Rotaris, L., Marcucci, E., Massiani, J., 2011, An economic, environmental and transport evaluation of the Ecopass scheme in Milan: three years later, SIET Società Italiana di Economia dei Trasporti e della Logistica, Italy.
de Bruin, Y.B., Carrer, P., Jantunen, M., Hänninen, O., Di Marco, G.S., Kephalopoulos, S., Cavallo, D. and Maroni, M., 2004, 'Personal carbon monoxide exposure levels: Contribution of local sources to exposures and microenvironment concentrations in Milan', Journal of Exposure Analysis and Environmental Epidemiology, 14(4) 312–322.
de Nazelle, A., Fruin, S., Westerdahl, D., Martinez, D., Ripoll, A., Kubesch, N. and Nieuwenhuijsen, M.A., 2012, 'Travel mode comparison of commuters' exposures to air pollutants in Barcelona', Atmospheric Environment, (59) 151–159.
Denhaag, 2013, Subsidie sloop oude auto's (http://www.denhaag.nl/home/bewoners/loket/to/Subsidie-sloop-oude-autos.htm) accessed 25 October 2013.
Dennekamp, M., Mehenni, O., Cherrie, J. and Seaton, A., 2002, 'Exposure to ultrafine particles and PM2.5 in different microenvironments', Annals of Occupational Hygiene, (46) 412–414.
Diapouli, E., Grivas, G., Chaloulakou, A. and Spyrellis, N., 2008, 'PM 10 and ultrafine particles counts in-vehicle and on-road in the Athens area', Water, Air, and Soil Pollution: Focus, 8(1) 89–97.
DfT, 2008, Mixed Priority Routes: A Practitioners Guide, United Kingdom Department of Transport, London.
DfT, 2010, A Guide to Safe and Fuel Efficient Driving for HGVs, United Kingdom Department of Transport, London.
DfT, 2011, Soft measures, hard facts, The value for money of transport measures which change travel behaviour. A Review of the Evidence, United Kingdom Department of Transport, London.
DfT, 2012, Road traffic (vehicle kms) by vehicle type and road class in Great Britain, United Kingdom Department for Transport, London (http://www.dft.gov.uk/statistics/series/traffic) accessed 8 August 2013.
DG ENER, 2013, Market Observatory Oil bulletin, time series data, European Commission, Directorate-General for Energy, Brussels (http://ec.europa.eu/energy/observatory/oil/bulletin_en.htm) accessed 22 August 2013.
DG MOVE, 2012, Study on Urban Freight Transport, European Commission, Directorate-General for Mobility and Transport, Brussels (http://ec.europa.eu/transport/themes/urban/studies/doc/2012-04-urban-freight-transport.pdf) accessed 22 July 2013.
DG MOVE, 2013, Statistical pocketbook 2013, European Commission, Directorate-General for Mobility and Transport, Brussels (http://ec.europa.eu/transport/facts-fundings/statistics/pocketbook-2013_en.htm) accessed 29 July 2013.
DG TAXUD, 2013, Excise Duty Tables: Part II — Energy products and electricity, July 2013, European Commission, Directorate-General for Taxation and Customs Union, Brussels (http://ec.europa.eu/taxation_customs/resources/documents/taxation/excise_duties/energy_products/rates/excise_duties-part_ii_energy_products_en.pdf) accessed 2 October 2013.
DG TREN, 2010, Study on Urban Access Restrictions, Report TREN/A4/103-2/2009, European Commission, Directorate-General for Mobility and Transport, Brussels.
Dijkstra, L. and Poelman, H., 2012, Cities in Europe, the new OECD‑EC definition, European Commission, Brussels (http://ec.europa.eu/regional_policy/sources/docgener/focus/2012_01_city.pdf) accessed 26 October 2013.
Dons, E., Int Panis, L., Van Poppel, M., Theunis, J. and Wets G., 2012, 'Personal exposure to Black Carbon in transport microenvironments', Atmospheric Environment, (55) 392–398.
Dor, F., Le Moullec, Y.and Festy, B., 1995, 'Exposure of city residents to carbon monoxide and monocyclic aromatic hydrocarbons during commuting trips in

References
78 A closer look at urban transport
the Paris metropolitan area', Journal of the Air and Waste Management Association, 45(2) 103–110.
EC, 2001, Directive 2001/81/EC of the European Parliament and the Council on National Emission Ceilings for certain atmospheric pollutants (OJ L 309, 23.10.2001, p. 22–30) (http://eurlex.europa.eu/ smartapi/cgi/sga_doc?smartapi!celexplus!prod!CEL EXnumdoc&numdoc=32001L0081&lg=EN) accessed 18 June 2013.
EC, 2002, Directive 2012/49/EC of the European Parliament and of the Council of 25 June 2002 relating to the assessment and management of environmental noise — Declaration by the Commission in the Conciliation Committee on the Directive relating to the assessment and management of environmental noise (OJ L 189, 18.7.2002, p. 12–25) (http://eur-lex.europa.eu/LexUriServ/LexUriServ.do?uri=OJ:L:2002:189:0012:0025:EL:PDF) accessed 9 October 2013.
EC, 2006, Communication from the Commission to the European Parliament, the Council, the European Economic and Social Committee and the Committee of the Regions 'Freight Transport Logistics in Europe — the key to sustainable mobility' (COM(2006) 336 final of 28 June 2006).
EC, 2007, Green Paper Towards a new culture for urban mobility (http://ec.europa.eu/transport/themes/urban/urban_mobility/green_paper/green_paper_en.htm) accessed 18 June 2013.
EC, 2008, Directive 2008/50/EC of the European Parliament and of the Council of 21 May 2008 on ambient air quality and cleaner air for Europe (OJ L 152, 11.06.2008, p. 1–44) (http://eur-lex.europa. eu/LexUriServ/LexUriServ.do?uri=OJ:L:2008:152:000 1:0044:EN:PDF) accessed 19 July 2013.
EC, 2009, Regulation (EC) No 443/2009 of the European Parliament and of the Council of 23 April 2009 setting emission performance standards for new passenger cars as part of the Community's integrated approach to reduce CO2 emissions from light-duty vehicles (OJ L 140, 5.6.2009, p. 1) (http:// eur-lex.europa.eu/LexUriServ/LexUriServ.do?uri=OJ: L:2009:140:0001:0015:EN:PDF) accessed 19 July 2013.
EC, 2009a, Directive 2009/28/EC of the European Parliament and of the Council of 23 April 2009 on the promotion of the use of energy from renewable sources and amending and subsequently repealing Directives 2001/77/EC and 2003/30/EC (OJ L 140, 5.6.2009, p. 16) (http://eur-lex.europa.eu/
LexUriServ/LexUriServ.do?uri=OJ:L:2009:140:0016:0 062:en:PDF) accessed 29 July 2013.
EC, 2009b, Directive 2009/30/EC of the European Parliament and of the Council of 23 April 2009 amending Directive 98/70/EC as regards the specification of petrol, diesel and gas-oil and introducing a mechanism to monitor and reduce greenhouse gas emissions and amending Council Directive 1999/32/EC as regards the specification of fuel used by inland waterway vessels and repealing Directive 93/12/EEC (OJ L 123, 17.05.2003, p. 42–46) (http://eur-lex.europa.eu/LexUriServ/LexUriServ. do?uri=OJ:L:2009:140:0088:0113:EN:PDF ) accessed 19 July 2013.
EC, 2009c, Communication from the Commission to the European Parliament, the Council, the European Economic and Social Committee and the Committee of the Regions 'Action Plan on Urban Mobility' (COM(2009) 490 final of 30 September 2009).
EC, 2010, Perception Survey on Quality of Life in European Cities: Analytical Report, Fieldwork: November 2009, Flash Eurobarometer No. 277, European Commission, Brussels.
EC, 2011, White Paper 'Roadmap to a Single European Transport Area —Towards a competitive and resource efficient transport system' (COM(2011) 144 final of 28 March 2011) (http://eur-lex.europa.eu/LexUriServ/ LexUriServ.do?uri=COM:2011:0144:FIN:EN:PDF) accessed 28 June 2013.
EC, 2011a, Communication from the Commission to the European Parliament, the Council, the European Economic and Social Committee and the Committee of the Regions 'A Roadmap for moving to a competitive low carbon economy in 2050' (COM(2011) 112 final of 8 March 2011) (http://eur-lex.europa.eu/ LexUriServ/LexUriServ.do?uri=COM:2011:0112:FIN: EN:PDF) accessed 19 July 2013.
EC, 2011b, Regulation (EU) No 510/2011 of the European Parliament and of the Council of 11 May 2011 setting emission performance standards for new light commercial vehicles as part of the Union's integrated approach to reduce CO2 emissions from light-duty vehicles (OJ L 145, 31.05.2011, p. 1) (http:// eur-lex.europa.eu/LexUriServ/LexUriServ.do?uri=O J:L:2011:145:0001:0018:EN:PDF) accessed 19 July 2013.
EC, 2011c, Impact Assessment, Accompanying document to the White Paper 'Roadmap to a Single European Transport Area Towards a competitive

References
79A closer look at urban transport
and resource efficient transport system' (SEC(2011) 358 final of 28 March 2011) (http://eur-lex.europa.eu/LexUriServ/ LexUriServ.do?uri=SEC:2011:0358:FIN:EN:PDF) accessed 19 July 2013.
EC, 2011d, The Contribution of ICT to Energy Efficiency: Local and Regional Initiatives. Final report: A toolkit for local and regional initiatives, European Commission, Brussels (http://ec.europa.eu/information_society/activities/sustainable_growth/docs/ict4ee_wiki/final_toolkit_master-p_v.pdf) accessed 9 August 2013.
EC, 2011e, Cities of Tomorrow: Challenges, Visions and Ways forward, European Commission, Brussels (http://ec.europa.eu/regional_policy/sources/docgener/studies/pdf/citiesoftomorrow/citiesoftomorrow_final.pdf) accessed 28 June 2013.
EC, 2012, Communication from the Commission to the European Parliament, the Council, the European Economic and Social Committee and the Committee of the Regions CARS 2020: 'Action Plan for a competitive and sustainable automotive industry in Europe' (COM(2012) 636 final of 8 November 2012) (http://eur-lex.europa.eu/LexUriServ/LexUriServ.do?uri=COM:2012:0636:FIN:EN:PDF) accessed 10 October 2013.
EC, 2012a, Consumer conditions scoreboard, 7th edition, Directorate-General for Health and Consumers, European Commission, Brussels.
EC, 2013, Communication from the Commission to the European Parliament, the Council, the European Economic and Social Committee and the Committee of the Regions 'Integrating maritime transport emissions in the EU's greenhouse gas reduction policies' (COM(2013) 479 final of 28 June 2013) (http://ec.europa.eu/clima/policies/transport/shipping/docs/com_2013_479_en.pdf) accessed 29 July 2013.
EC, 2013a, Proposal for a Directive on the deployment of alternative fuels infrastructure (COM2013 (18) final of 24 January 2013) (http://eur-lex.europa.eu/LexUriServ/LexUriServ.do?uri=COM:2013:0018:FIN:EN:PDF) accessed 3 July 2013.
EcoWill, 2010, Overview of the status of ecodriving integration with driver education and testing, EcoWill, Vienna.
EcoWill, 2013, Ecodriving benefits (http://www.ecodrive.org/en/what_is_ecodriving-/benefits_of_ecodriving), accessed 20 June 2013.
Edwards, J., McKinnon, A., Cherret, T., McLeod, F., Song, L., 2009, 'The impact of failed home deliveries on carbon emissions: are collection and delivery points environmentally friendly alternatives', Proceedings of the 14th Annual Logistics Research Network Conference, Cardiff.
EEA, 2009, Ensuring quality of life in Europe's cities and towns, EEA Report No 5/2009, European Environment Agency (http://www.eea.europa.eu/publications/quality-of-life-in-Europes-cities-and-towns) accessed 8 July 2013.
EEA, 2010, The European Environment State and Outlook 2010 — Land Use, State of the environment, Report No 1/2010, European Environment Agency (http://www.eea.europa.eu/soer) accessed 30 July 2013.
EEA, 2010a, The European Environment State and Outlook 2010 — Urban Environment, State of the environment, Report No 1/2010, European Environment Agency (http://www.eea.europa.eu/soer) accessed 30 July 2013.
EEA, 2012, The contribution of transport to air quality, EEA Report no. 10/2012, European Environment Agency (http://www.eea.europa.eu/publications/transport-and-air-quality-term-2012) accessed 30 July 2013.
EEA, 2013, Air quality in Europe — 2013 report, EEA Report No 9/2013, European Environment Agency (http://www.eea.europa.eu/media/newsreleases/reducing-the-20ac-45-billion) accessed 7 October 2013.
EEA, 2013a, Annual European Union greenhouse gas inventory 1990–2011 and inventory report 2013, EEA Technical report No 8/2013, European Environment Agency (www.eea.europa.eu/publications/ european-union-greenhouse-gas-inventory-2013) accessed 24 September 2013.
EEA, 2013b, Trends and projections in Europe 2013 — Tracking progress towards Europe's climate and energy targets until 2020, EEA Report No 10/2013, European Environment Agency (http://www.eea.europa.eu/publications/trends-and-projections-2013) accessed 10 October 2013.
EEA, 2013c, Monitoring CO2 emissions from new passenger cars in the EU: summary of data for 2012, European Environment Agency (http://www.eea.europa.eu/publications/monitoring-co2-emissions-from-new-cars) accessed 3 July 2013.

References
80 A closer look at urban transport
EEA, 2013d, Van manufacturers must make new models more efficient by 2020 (data for 2012), European Environment Agency (http://www.eea.europa.eu/highlights/van-manufacturers-must-make-new) accessed 16 October 2013.
EEA, 2013e, Road user charges for heavy goods vehicles (HGV), Technical report No 1/2013, European Environment Agency (http://www.eea.europa.eu/publications/road-user-charges-for-vehicles) accessed 7 October 2013.
Eltis, 2013, CarGo Tram Dresden — how tramcars avoid truck transfers, Eltis case study, Brussels (www.eltis.org) accessed 20 June 2013.
Eltis, 2013a, Cargo‑Tram and E‑Tram, bulky and electric waste collection by tram in Zurich, Eltis, Brussels (www.eltis.org) accessed 20 June 2013.
Eltis, 2013b, Distripolis: a new city logistics solution in Paris, Eltis, Brussels (www.eltis.org) accessed 20 June 2013.
Eltis, 2013c, Free public transport in Tallin, Estonia (www.eltis.org) accessed 20 June 2013.
EltisPlus, 2011, Developing and Implementing a Sustainable Urban Mobility Plan, Eltis, Brussels (www.mobilityplans.eu) accessed 19 July 2013.
EMTA, 2012, Barometer 2009 of public transport in the European metropolitan areas, European Metropolitan Transport Authorities, Paris (http://www.emta.com/IMG/pdf/barometer_report_2012_data_2009_.pdf) accessed 23 August 2013.
EMTA, 2012a, Barometer 2011 of public transport in the European metropolitan areas, European Metropolitan Transport Authorities, Paris (http://www.emta.com/IMG/pdf/emta_barometre_2011_final_dec_2012.pdf) accessed 23 August 2013.
EPOMM TEMS, 2013, Managing mobility for a better future (http://www.epomm.eu/tems/) accessed 20 August 2013.
EST, 2013, Smarter Driving (http://www.energysavingtrust.org.uk/Organisations/Transport/Products-and-services/Smarter-Driving) accessed 3 July 2013.
ETC/ACM, 2012, Estimating the contribution of commuting on exposure to particulate matter in European urban areas, ETC/ACC Technical Paper 2012/2, European Technical Centre on Air Pollution and Climate Change Mitigation. (http://acm.eionet.
europa.eu/reports/docs/ETCACM_TP_2012_2_PM_exposure_urban_commuting.pdf) accessed 21 August 2013.
ETC/ACM, 2012a, Road traffic's contribution to air quality in European cities, ETC/ACC Technical Paper 2012/14, European Technical Centre on Air Pollution and Climate Change Mitigation.
European Cyclists Federation, 2011, Cycle More Often 2 Cool Down the Planet. Quantifying CO2 Savings of Cycling (http://www.ecf.com/wp-content/uploads/ECF_CO2_WEB.pdf) accessed 2 August 2013.
European Cyclists Federation, 2013, EU Wide Cycling Barometer (http://www.ecf.com/news/the-first-eu-wide-ecf-cycling-barometer-launched) accessed 22nd August 2013.
European Cyclists Federation, 2013a, Factsheet ‑ the rise of bicycle sharing schemes (http://www.ecf.com/wp-content/uploads/Factsheet-ITF2012-BSS.pdf) accessed 22 August 2013.
Eurocontrol, 2013, EUROCONTROL Seven‑Year Forecast, February 2013, Flight Movements and Service Units 2013–2019, Eurocontrol, Brussels (http://www.eurocontrol.int/documents/seven-year-flights-forecast-2013-2019) accessed 29 July 2013.
Eurostat, 2013, Eurostat Statistical Database, Eurostat, Luxembourg (http://epp.eurostat.ec.europa.eu/portal/page/portal/statistics/search_database) accessed 10 July 2013.
Fondelli, M.C., Chellini, E., Yli-Tuomi, T., Cenni, I., Gasparrini, A., Nava, S., Garcia-Orellana, I., Lupi, A., Grechi, D., Mallone, S. and Jantunen, M., 2008, 'Fine particle concentrations in buses and taxis in Florence, Italy', Atmospheric Environment, 42(35) 8 185–8 193.
Frei, A., Axhausen, K.W. and Ohnmacht,T., 2009, 'Mobilities and Social Network Geography: Size and Spatial Dispersion—the Zurich Case Study', in: Ohnmacht, T., Maksim, H. and Bergman, M. M. (eds.), Mobilities and Inequalities, Ashgate, Surrey.
Fromme, H., Oddoy, A., Piloty, M., Krause, M. and Lahrz, T., 1998, 'Polycyclic aromatic hydrocarbons (PAH) and diesel engine emission (elemental carbon) inside a car and a subway train', Science of the Total Environment, (217) 165–173.
Gee, I.L., Coleman, B. and Raper, D.W., 1999, 'Commuter exposure to respirable particles inside vehicles in Manchester, UK', in: Raw, G., Aizlewood,

References
81A closer look at urban transport
C. and Warren, P., The 8th International Conference on Indoor Air and Climate, Indoor Air 99, Edinburgh.
Gee, I.L. and Raper, D.W., 1999, 'Commuter exposure to respirable particles inside buses and by bicycle (Conference Paper)', Science of the Total Environment, (235) 403–405.
Goodwin, P. and Lyons, G., 2010, 'Public attitudes to transport: interpreting the evidence, in Transportation', Planning and Technology, (33/1) 3–17.
Goodwin, P., 2013, Peak Travel, Peak Car and the Future of Mobility — Evidence, Unresolved Issues, Policy Implications and a Research Agenda, International Transport Forum, Paris.
Hausberger, S., 2010, Fuel Consumption and Emissions of Modern Passenger Cars, Graz University of Technology, Graz (http://www.ermes-group.eu/public/reports/2010-TUG-fuel-consumption-cars.pdf) accessed 21 October 2013.
ICCT, 2013, From laboratory to road. A comparison of official and 'real‑world' fuel consumption and CO 2 values for cars in Europe and the United States, International Council on Clean Transportation, Washington (http://www.theicct.org/sites/default/files/publications/ICCT_LabToRoad_20130527.pdf) accessed 29 August 2013.
INRIX, 2010, Roadmap to a Single European Transport Area (http://ec.europa.eu/transport/infrastructure/tentec/tentec-portal/site/en/facts_and_figures.html) accessed 4 August 2013.
Institute for Technology Assessment and Systems Analysis (ITAS), Karlsruhe Institute of Technology (KIT), 2012, Urban Transport Technology Options in Urban Transport Changing Paradigms and Promising Innovation Pathways, Report to the European Parliament.
Int Panis, L., de Geus, B., Vandenbulcke, G., Willems, H., Degraeuwe, B., Bleux, N., Mishra, Thomas, I. and Meeusen, R., 2010, 'Exposure to particulate matter in traffic: A comparison of cyclists and car passengers', Atmospheric Environment, (44/19) 2 263–2 270.
ITDP, 2011, Europe's Parking U‑Turn: From accommodation to regulation, Institute for Transportation and Development policy, New York.
i-Traq, 2013, Integrating traffic control and air quality (http://iap.esa.int/projects/transport/itraq) accessed 3 July 2013.
JEG, 2010, Urban road charge in European cities: A possible means towards a new culture for urban mobility?, Report of the Joint Expert Group on Transport and Environment on urban road pricing schemes in European cities of the EU Commission, Brussels.
JRC, 2012, Driving and parking patterns of European car drivers: A mobility survey, Joint Research Centre, Brussels (http://publications.jrc.ec.europa.eu/repository/bitstream/111111111/26994/1/driving%20and%20parking%20patterns%20-%20final_online.pdf Figures 3.6 and 4.8) accessed 22 July 2013.
JRC, 2013, The Covenant of Mayors in Figures 5‑Year Assessment, Joint Research Centre, Brussels (http://www.covenantofmayors.eu/IMG/pdf/com_in_figures_jrc.pdf) accessed on 22 October 2013.
Kaur, S., Nieuwenhuijsen, M. and Colvile, R., 2005, 'Personal exposure of street canyon intersection users to PM2.5, ultrafine particle counts and carbon monoxide in Central London, UK', Atmospheric Environment, (39/20) 3629.
Karathodorou, N., Graham, D.J. and Noland, R.B., 2010, 'Estimating the effect of urban density on fuel demand', Energy Economics, (32) 86–92.
Keigan, M., Cuerden, R. and Wheeler, A., 2009, 'Analysis of police collision files for pedal cyclist fatalities in London, 2001–2006', TRL Report, (438) (http://www.tfl.gov.uk/assets/downloads/businessandpartners/pedal-cyclist-fatalities-in-London-2001-2006.pdf) accessed 23 July 2013.
Korver, W., Stemerding M., Van Egmond, P. and Wefering F., 2012, CIVITAS Guide for The Urban Transport Professionals: Results and lessons of long‑term evaluation of the CIVITAS initiative, CIVITAS, Delft.
Kuhnimhof, T., Buehler, R., Wirtz, M. and Kalinowska, D., 2012, 'Travel trends among young adults in Germany: increasing multimodality and declining car use for men', Journal of Transport Geography, (24) 443–450.
Kühlwein, J., Rexeis, M., Luz, R., Hausberger, S. 2013, Update of Emission Factors for EURO 5 and EURO 6 Passenger Cars for the HBEFA Version 3.2. Graz University of Technology, Report No. I-25/2013/ Rex EM-I 2011/20 679
Le Vine, S., Jones, P. and Polak, J., 2009, 'Has the historical growth in car use come to an end in great Britain?', Paper presented at the 37th European Transport Conference.

References
82 A closer look at urban transport
Litman, T., 2012, Land Use Impacts on Transport. How land‑use factors affect travel behaviour, Victoria Transport Policy Institute, Victoria.
Lucas, K., 2012, 'Transport and Social Exclusion: Where are we now?', Transport Policy, (20) 105–113.
Manpower, 2013, The world of virtual work facts and statistics (http://files.shareholder.com/downloads/MAN/164668571x0x117500/bebbb96d-64a8-4a24-a3ab-1a41eeffb7db/MP_World%20of%20Virtual%20Work%20Facts_Stats_FINAL.pdf) accessed 16 July 2013.
Malvik, H.V., Wensaas, G.B. and Hannisdahl, O.H., 2013, 'The Future is Electric! The EV Revolution in Norway — explanations and lessons learned', ECEEE Summer Study Proceedings 2013, 995–1 005.
Marsden, G., Trapenberg, Frick, K., May, A.D. and Deakin, E., 2009, Good Practice in the Exploitation of Innovative Strategies in Sustainable Urban Transport, City Interview Synthesis, University of California, Berkely (http://www.uctc.net/papers/880.pdf) accessed 29 July 2013.
Marsden, G. and Stead, D., 2011, 'Policy transfer and learning in the field of transport: A review of concepts and evidence', Transport Policy, (18/3) 492–500.
McNabola, A., Broderick, B.M. and Gill, L.W., 2008, 'Relative exposure to fine particulate matter and VOCs between transport microenvironments in Dublin. Personal exposure and uptake', Atmospheric Environment, (42/26) 6 496–6 512.
Moazami, A. and Noroozi, S., 2011, Urban Freight Transport in the Context of Urban Development, Division of logistics and transportation, Chalmers University of Technology, Gothenburg.
Navigant, 2013, Electric Bicycles Global Market Opportunities, Barriers, Technology Issues, and Demand Forecasts for E‑Bicycles, Pedal‑Assist Bicycles, and E‑Bicycle Batteries and Motors, Navigant Research, Washington (http://www.navigantresearch.com/wp-assets/uploads/2013/03/EBIKE-13-Executive-Summary.pdf) accessed 22 August 2013.
Newman, P., and Kenworthy, J.R., 1989, 'Gasoline Consumption and cities: a comparison of US cities in a global survey', Journal of the American Planning Association, (55/1) 24–36.
Newman, P. and Kenworthy J.R., 1989a, Cities and Automobile Dependence: An International Sourcebook, Gower, Aldershot.
Newman, P., Kenworthy, J., 2011, 'Peak car use: understanding the demise of automobile dependence', World Transport Policy and Practice, (17) 31–42.
Niches, 2009, Alternative solutions for home delivery, Niches, Brussels (www.niches-transport.org) accessed 15 August 2013.
OECD/EC, 2012, Cities in Europe — The New OECD‑EC definition, Organisation for Economic Co-operation and Development / European Commission, Paris/ Brussels (http://ec.europa.eu/regional_policy/sources/docgener/focus/2012_01_city.pdf) accessed 21 August 2013.
OECD/ITF, 2011, Pedestrian Safety, Urban Space and Health, Organisation for Economic Co-operation and Development/International Transport Forum, Paris (http://www.oecd-ilibrary.org/transport/pedestrian-safety-urban-space-and-health_9789282103654-en) accessed 21 August 2013.
Pfeifer, G.D., Harrison, R.M. and Lynam, D.R., 1999, 'Personal exposures to airborne metals in London taxi drivers and office workers in 1995 and 1996', Science of the Total Environment, (235) 253–260.
Pucher, J. and Buehler, R., 2010, 'Walking and Cycling for Healthy Cities', Built Environment, (36/4) 391–414 (http://policy.rutgers.edu/faculty/pucher/BuiltEnvironment_WalkBike_10Dec2010.pdf) accessed 11 August 2013.
Pucher, J., and Buehler, R., 2008, 'Making Cycling Irresistible: Lessons from The Netherlands, Denmark and Germany', Transport Reviews, (28/4) 495–528 (http://policy.rutgers.edu/faculty/pucher/irresistible.pdf) accessed 23 July 2013.
Puentes, R. and Tomer, A., 2008, The Road Less Traveled: An Analysis of Vehicle Miles Traveled Trends in the U.S., Brookings Institution, Washington DC.
Querol, X., Moreno, T., Karanasiou, A., Reche, C., Alastuey, A., Viana, M., Font, O., Gil, J., De Miguel, E. and Capdevila, M., 2012, 'Variability of levels and composition of PM10 and PM2.5 in the Barcelona metro system', Atmospheric Chemistry and Physics, (12) 5 055–5 076.
RAC Foundation, 2013, Powering Ahead: The future of low‑carbon cars and fuels, Royal Automobile Club

References
83A closer look at urban transport
Foundation, London (http://www.racfoundation.org/assets/rac_foundation/content/downloadables/powering_ahead-kay_et_al-apr2013.pdf) accessed 30 July 2013.
Redman L, Friman M., Garling T and Hartig T., 2013, 'Quality attributes of public transport that attract car users: A research review', Transport Policy, (25) 119–127.
Rodrigue, J.P. and Notteboom T., 2013, 'Transport Costs', in: Rodrigue, J. P. (ed.), The Geography of Transport Systems, Routledge, New York.
Rupprecht Consult, 2013, Developing and Implementing a Sustainable Urban Mobility Plan, Rupprecht Consult, Cologne (www.mobilityplans.eu) accessed 8 November.
Santos, G., Maoh, H., Potoglou, D. and von Brum, T., 2013, 'Factors influencing modal split of commuting journeys in medium-size European cities', Journal of Transport Geography, (30) 127–137.
Savy, M., 2013 'European Urban Freight: a comprehensive approach', in: Urban Freight for Liveable Cities: how to deal with collaboration and trade‑offs, The Volvo Research and Education Foundation, Gothenburg.
Schipple, J. and Puhe, M., 2012, Description of technologies, challenges and paradigms in urban transport, Report to the Europe Parliament, Brussels.
Scott Wilson Group plc, 2010, Freight Consolidation Centre Study — final report, Scott Wilson Group plc, Glasgow.
SDC, 2010, Smarter Moves — How information communications technology can promote sustainable mobility, Sustainable Development Commission, London (http://www.sd-commission.org.uk/data/files/publications/SDC_Smarter_Moves_w.pdf) accessed 30 July 2013.
Senate Department for Urban Development and the Environment, 2011, Mobility in the City — Berlin Traffic in Figures 2010, Senate Department for Urban Development and the Environment, Berlin (http://www.stadtentwicklung.berlin.de/verkehr/politik_planung/zahlen_fakten/entwicklung/index_en.shtml) accessed 17 October 2013.
Sloman, L., Cairns S., Newson C., Anable J., Pridmore A. and Goodwin P., 2010, The Effects of Smarter Choice Programmes in the Sustainable Travel Towns, Department for Transport, London.
Stantchev, S. and Whiteing, T., 2009, Land use planning — thematic research summary, European Commission Transport Research Knowledge Centre, Brussels.
Symbiocity, 2013, Paving the way for a future in motion (http://www.symbiocity.org/en/Activate/Undersidor/Elderly-Care) accessed 15 July 2013.
Tapio, P., 2005, 'Towards a theory of decoupling: degrees of decoupling in the EU and the case of road traffic in Finland between 1970 and 2001', Transport Policy, (12) 137–151
TfL, 2004, Impacts Monitoring Report, Transport for London, London.
TfL, 2009, A pilot Delivery and Servicing Plan for TfL's Palestra Offices in Southward: A London Freight Matters Case Study, Transport for London, London.
TNO, AEA, CE Delft, Ricardo, Okopol and TML, 2012, Support for the revision of regulation on CO2 emissions from light commercial vehicles — final report, Report to the European Commission, Brussels.
TNO, 2012, Supporting Analysis regarding Test Procedure Flexibilities and Technology Deployment for Review of the Light Duty Vehicle CO2 Regulations. Note on options for reducing test cycle flexibilities and their potential impact on type approval CO2 emissions, TNO, Delft (http://ec.europa.eu/clima/policies/transport/vehicles/cars/docs/note_2012_en.pdf) accessed 7 October 2013.
TomTom, 2013, TomTom Congestion Index (http://www.tomtom.com/en_gb/congestionindex) accessed 10 July 2013.
TRL, 2010, 'Relationship between Speed and Risk of Fatal Injury: Pedestrians and Car Occupants', Report to the UK Department for Transport, Transport for London, London.
Tsamboulas, D., 2001, 'Parking Fare Thresholds: A Policy Tool', Transport Policy, (8) 115–124. (http://www.spur.org/publications/library/report/parkingandlivabilityindowntownsf_010105) accessed 3 August 2013.
TURBLOG, 2011, Transferability of urban logistics concepts and practices from a world wide perspective — Deliverable 3.1 — Urban logistics practices — Paris Case study (http://www.transport-research.info/Upload/Documents/201307/20130703_154506_25800_D3.1_casestudyParisFrance.pdf) accessed 17 October 2013.

References
84 A closer look at urban transport
Vellopoulou, A.V. and Ashmore, M.R., 1998, 'Personal exposures to carbon monoxide in the city of Athens: I. Commuters' exposures', Environment International, 24(7) 713–720.
Viry, G., Kaufmann, V. and Widmer, E.D., 2009, 'Social Integration Faced with Commuting: More Widespread and Less Dense Support Networks', in: Ohnmacht, T., Maksim, H. and Bergman, M. (eds.), Mobilities and Inequality, Ashgate, London.
WHO, 2011, Health Economic Assessment Tools for Walking and Cycling, World Health Organisation Regional Office for Europe, Copenhagen (http://www.euro.who.int/__data/assets/pdf_file/0003/155631/E96097rev.pdf) accessed 22 August 2013.
WHO, 2013, Economic Cost of Transport Related Health Impacts, World Health Organisation Regional Office for Europe, Copenhagen (http://www.euro.who.int/en/what-we-do/health-topics/environment-and-health/Transport-and-health/data-and-statistics/economic-cost-of-transport-related-health-effects2) accessed 22 August 2013.
WHO, 2013a, HEAT Modelling Tool, World Health Organisation, Geneva (http://www.heatwalkingcycling.org) accessed 22 August 2013.
WHO/JRC, 2011, Burden of disease from environmental noise. Quantification of healthy life years lost in Europe, World Health Organization, Geneva (http:// www.euro.who.int/en/what-we-do/health-topics/ environment-and-health/noise/publications/2011/ burden-of-disease-from-environmental-noise.-quantification-of-healthy-life-years-lost-in-europe) accessed 20 August 2012.
Weltevreden, J.W. and Rotem-Mindali, T.O., 2008, Mobility effects of b2c and c2c e‑commerce: A literature review and assessment, Netherlands Institute of Spatial Research, The Hague and Delft.
Zuurbier, M., Hoek, G., Oldenwening, M., Lenters, V., Meliefste, K., van den Hazel, P. and Brunekreef, B., 2010, 'Commuters' exposure to particulate matter air pollution is affected by mode of transport, fuel type, and route', Environmental Health Perspectives, 118(6) 783–789.

85
Annex 1
A closer look at urban transport
Annex 1 Metadata and supplementary information
Throughout the report abbreviations are used to refer to specific country groupings. The following definitions are used:
• EU-15: Austria, Belgium, Denmark, Finland, France, Germany, Greece, Ireland, Italy, Luxembourg, the Netherlands, Portugal, Spain, Sweden and the United Kingdom.
• EU-10: Cyprus, the Czech Republic, Estonia, Hungary, Latvia, Lithuania, Malta, Poland, Slovakia and Slovenia.
Chapter Supplementary information
1 Introduction Box 1.1 A note on country groupings
Source: EEA.
2 TERM Core Set of Indicators Table 2.1 Transport goals overview in the EU-28, 2013
Note: Progress towards meeting transport specific targets from policy and legislation. Data from various sources.
Source: EEA, 2013.
Box 2.1 TERM Core Set of Indicators (TERM-CSIs)
Source: EEA, 2013.
Box 2.2 TERM 01: Transport final energy consumption by fuel
Note: EU-28. Covers the years 1990, 1995, 2000, 2005, 2007, 2008, 2009, 2010, 2011 and 2012.
Source: EEA indicator, TERM 01. Based on data from Eurostat, 2013.
Box 2.3 TERM 02: Transport emissions of GHGs
Note: EU-28 emissions of GHG emissions from 1990.
Source: EEA indicator, TERM 02. http://www.eea.europa.eu/data-and-maps/data/data-viewers/greenhouse-gases-viewer, 2013.
Box 2.4 TERM 03: Transport emissions of air pollutants
Note: EEA-33 data for 1990–2011 from reporting under the UNECE Convention on Long-range Transboundary Air Pollution (LRTAP).
Source: EEA indicator, TERM 03. http://www.eea.europa.eu/data-and-maps/data/data-viewers/air-emissions-viewer-lrtap, 2013.
Box 2.5 TERM 04: Exceedances of air quality objectives due to traffic
Note: EEA-33 Annual mean NO2 and PM10 concentrations observed at traffic stations, 2011.
Source: EEA indicator, TERM 04. Based on data from AirBase v5, Urban Audit, 2013.
• EU-13: EU-10, Bulgaria, Croatia and Romania.
• EFTA-4: Iceland, Liechtenstein, Norway and Switzerland.
• EU-27: EU-28 excluding Croatia.
• EU-28: EU-15 and EU-13.
• EEA-33: EU-28, EFTA-4 and Turkey.
Annex 1
86 A closer look at urban transport
Chapter Supplementary information
Box 2.6 TERM 05: Exposure to and annoyance by traffic noise
Note: Information for a number of European capitals able to provide data for 2012.
Source: EEA indicator, TERM 05. Based on data from Noise Observation and Information Service (NOISE), 2013.
Box 2.7 TERM 12a/b: Passenger transport volume and modal split within the EU
Note: Passenger transport passenger-km for the EU-27 between 1995 and 2011.
Source: EEA TERM 12a/b indicator, DG MOVE statistical pocketbook (2013).
Box 2.8 TERM 13a/b: Freight transport volume and modal split within the EU
Note: Freight transport tonne-km for the EU-27 between 1995 and 2011.
Source: EEA TERM 13a/b indicator, DG MOVE statistical pocketbook (2012).
Box 2.9 TERM 20: Real change in transport prices by mode
Note: EU-27 real change in transport prices. Data series covers 1996–2012.
Source: EEA indicator, TERM 20. Based on data from Eurostat (2013).
Box 2.10 TERM 21: Fuel tax rates
Note: Coverage is EU-28 for 2013.
Source: EEA indicator, TERM 21. Based on data from DG TAXUD (2013).
Box 2.11 TERM 27: Energy efficiency and specific CO2 emissions
Note: Average CO2 emissions for new cars sold in the EU-27 for 2000–2012.
Source: EEA indicator, TERM 27. Based on data from European new passenger car CO2 monitoring compiled by EEA and DG CLIMA.
Box 2.12 TERM 31 Share of renewable energy in the transport sector
Note: % share of renewable energy consumed in transport by country, including only those biofuels compliant with the Renewables Directive and all biofuels consumed in transport.
Source: EEA indicator, TERM 31. Based on data from Eurostat (2013).
Box 2.13 Proportion of vehicle fleet by alternative fuel type
Note: Thousands of car registrations by alternative fuel type, EU-27.
Source: EEA, 2013c.
3 Passenger and freight transport demand and modal split
Figure 3.1 Freight transport volumes and GDP
Note: The two curves show the development in real GDP and freight transport volumes in the EEA-33 (excluding Croatia and Liechtenstein), while the columns show the level of annual decoupling. Positive decoupling indicates faster growth in GDP than in freight transport while negative decoupling indicates stronger growth in freight transport than in GDP. The data refer to road, rail and inland waterways modes of transport.
Source: DG MOVE 2013.
Figure 3.2 Freight modal split between road and rail
Note: Percentage share of land freight transport between road and rail transport mode for EU-13, EU-15 and combined EU-28.
Source: DG MOVE, 2013.

Annex 1
87A closer look at urban transport
Chapter Supplementary information
Figure 3.3 Trends in passenger transport demand and GDP
Note: Data from Liechtenstein are not included as they were not available as part of the dataset. GDP is expressed in euros at 2000 prices. Passenger-kilometres includes transport by road, rail and bus. There is no agreement among the EU Member States on how to attribute the passenger-kilometres of international intra-EU flights, therefore aviation data are not included in the figure.
Source: DG MOVE 2013.
Figure 3.4 Passenger transport modal split
Note: Passenger transport modal split, shown for EU-15 and EU-13.
Source: DG MOVE, 2013.
4 Why is urban transport relevant for the environment?
Figure 4.1 Exposure to harmful levels of air pollution in the EU
Note: EU urban population exposed to harmful levels of air pollution in 2011, according to EU limit/target values and WHO guidelines
Source: EEA, 2013.
Box 4.1 Tightening NOX emission standards for diesel vehicles has not delivered real NO2 reductions
Source: EEA, 2013.
Figure 4.2 Test results for a set of diesel cars
Note: NO and NO2 emissions for passenger diesel cars. Figures include the average New European Driving Cycle (NEDC) and the Average Common ARTEMIS Driving Cycle (CADC) (1/3-mix urban, rural, motorway) test results for a set of diesel cars.
Source: Kühlwein et al., 2013 and Hausberger, S., 2010.
Box 4.2 Exposure to air pollution during commuting in selected European cities by mode of transport
Source: ETC/ACM, 2012 (all article references are included in the reference section).
Figure 4.3 Shares in EU transport greenhouse gas emissions in 2010 (estimates)
Note: These are updated estimates for 2010 based on the PRIMES-TREMOVE model and are not from official statistics.
Source: DGMOVE, 2013.
Box 4.3 Key European policies and outcome messages for urban transport
Source: EEA, 2013.
5 Local effects of transport on urban air quality
Figure 5.1 Modal split for metropolitan city areas for 2009 and 2011
Source: EMTA data for 2009 and 2011 (EMTA, 2012 and 2012a).
Figure 5.2 Modal split for city areas for 2009 and 2011
Source: EMTA data for 2009 and 2011 (EMTA, 2012 and 2012a).
Figure 5.3 Bicycle traffic in Berlin since 1951 — relative change in percentage
Source: Senate Department for Urban Development and the Environment, 2011, Mobility in the City, Berlin Traffic in Figures 2010.
Figure 5.4 GDP in relation to car ownership growth, 2011
Source: EMTA, 2012a

Annex 1
88 A closer look at urban transport
Chapter Supplementary information
Figure 5.5 Parking charges and car modal share
Note: Paris covers car, taxi and motorcycle.
Source: ITDP (2011), EPOMM TEMs and EMTA data (EPOMM TEMs corresponds to a range of years from 2008, the latter is from 2011 and is motorised modes, other than public transport).
Table 5.1 Journeys from home to work and school as a percentage of total journeys for a selection of cities
Note: Data relates to surveys carried out between 2004 and 2009.
Source: EMTA Barometer 2009 (EMTA, 2012).
Table 5.2 Traffic and CO2 reduction monitoring results in different urban road user charging schemes in Europe
Source: EC, 2011d.
6 Urban freight transport Figure 6.1 Relationship between light and heavy goods vehicle traffic in the United Kingdom
Note: Growth in vehicle km data for the United Kingdom, ratio is the ratio of HGV vkm to LGV vkm.
Source: DfT, 2012.
Figure 6.2 Tonnes lifted per capita in 16 urban areas in the United Kingdom
Source: Allen, 2010.
Figure 6.3 Percentage of people who have ordered goods over the Internet in the past 12 months
Note: Data for EU 27 from 2011
Source: EC, 2012a.
Figure 6.4 The change in urban freight vkm in London between 1994 and 2010
Source: Allen, 2012.
Box 6.1 Urban logistics planning in Paris
Photo: Laetitia Dablanc, 2013.
7 Options to minimise impacts Figure 7.1 SUMPS elements and activities
Source: EltisPlus, 2013.
Box 7.1 The Utrecht Cargohopper
Photo: Bert Roozendaal, RoozWorks.
Box 7.2 The Copenhagenize Index 2013 on bicycle-friendly cities
Source: http://copenhagenize.eu/index/index.html.
Box 7.3 Access to public transport in European cities
Note: http://ec.europa.eu/regional_policy/sources/docgener/focus/2012_01_city.pdf.
Source: Lewis Dijkstra and Hugo Poelman, Directorate-General for Regional and Urban Policy, European Commission.

89
Annex 2
A closer look at urban transport
Annex 2 Relevant transport targets up to 2050
Target Target date Source Relevant indicator
Comments
Transport GHG (including international aviation, excluding international maritime shipping) 20 % ↓ (versus 2008) 60 % ↓ (versus 1990)
2030 2050
Transport White Paper (EC, 2011a), 2050 Roadmap (EC, 2011b)
TERM 02 The 2050 Roadmap is the broader strategy that sets the most cost-effective ways to reduce GHG emissions based on the outcome from modelling to meet the long-term target of reducing domestic emissions by 80 to 95 %. The target for the transport sector was set out in the White Paper on Transport on the basis of the 2050 Roadmap.
EU CO2 emissions of maritime bunker fuels 40 % ↓ (versus 2005)
2050
Transport White Paper (EC, 2011a)
TERM 02
40 % share of low carbon sustainable fuels in aviation
2050
Transport White Paper (EC, 2011a)
TERM 31 Potentially monitored through EU ETS reporting
Use of conventionally fuelled cars in urban transport 50 % ↓ 100 % ↓
2030 2050
Transport White Paper (EC, 2011a)
TERM 34 The White Paper goal relates not to vehicle numbers but to share in urban passenger kilometres
CO2 free city logistics in major urban centres
2030
Transport White Paper (EC, 2011a)
Not currently possible to monitor
The majority of medium-distance passenger transport should go by rail
2050
Transport White Paper (EC, 2011a)
TERM 12a/b Only indirectly monitored through modal shares
Road freight over 300 km shift to rail/waterborne transport 30 % shift 50 %+ shift
2030 2050
Transport White Paper (EC, 2011a)
TERM 13a/b Only indirectly monitored through modal shares
10 % share of renewable energy in the transport sector final energy consumption for each Member State 2020
Renewable Energy Directive 2009/28/EC (EC, 2009b)
TERM 31
Fuel suppliers to reduce lifecycle GHG of road transport fuel 6–10 % ↓ (versus 2010 fossil fuels)
2020
Fuel Quality Directive 2009/30/EC (EC, 2009c)
TERM 31 To be monitored in future indicator updates
Target average type-approval emissions for new passenger cars 130 g CO2/km 95 g CO2/km
2012–2015 2020
Passenger Car CO2 EC Regulation 443/2009 (EC, 2009a)
TERM 27 and TERM 34
Phased in between 2012 (65 %) and 2015 (100 %)
Target average type-approval emissions for new light vans 175 g CO2/km 147 g CO2/km
2014–2017 2020
Van CO2 EC Regulation 510/2011 (EC, 2011c)
TERM 27 and TERM 34
70 % reduction of transport oil consumption from today
2050 Impact assessment- accompanying document to the White Paper (EC, 2011d)
TERM01 This is interpreted as a 70 % drop in oil consumption in the transport sector from 2009 levels, as it is the latest data available

90
Annex 3
A closer look at urban transport
Annex 3 Explaining the 'target paths'
This annex provides an overview of the method to assess progress towards targets and assign colours to the cells in Table 2.1.
Reducing transport GHG emissions: In the case of the key target, each year's data will be compared with the 'trajectory' based on the 'preferred policy option' for achieving reductions as set out in the impact assessment accompanying the 2011 Transport White Paper (EC, 2011d) in order to meet the transport GHG reduction target by 2050. The following graph provides a representation of the comparison between real data and the 'target path' defined accordingly. In the column 'Observed' under each given year, and under
Figure A3.1 Transport GHG emissions
0
200
400
600
800
1 000
1 200
1990 2000 2010 2020 2030 2040 2050
'Preferred policy option' GHG transport emissions (excl.maritime bunkers) absolute valuesGHG actual transport emissions (excl.maritime bunkers)
2030 transport target (20 % reduction on 2008; + 8 % on 1990 levels)
2050 transport target (60 % reduction on 1990)
the title 'Where we are (current trends vs. 'target path')', a green colour indicates when the latest data shows a value equal or below that of the 'target path' for that year. In other words, the reduction achieved is in line with — or better than — the estimations. Because concrete 'preferred policy option' estimations are only available every five years (up to 2050), an interpolation of the values is still needed for the years in between, prior to the comparison.
In the final column 'latest annual trend', the colour green indicates when the latest data show improvement compared to the previous year in which data are available.

Annex 3
91A closer look at urban transport
Indicative targets: In order to assign a colour for the cells for the indicative targets, a similar methodology has been followed. However, as there were no official estimations on the 'target path' to be followed, this path is calculated by plotting a straight line from the base year data to the target year data, i.e. assuming a linear trend towards the target. At this point, it is clear that this is a subjective assessment of progress with the only aim being to give an approximate indication of whether the target will be met. Assuming a linear trend could lead to incomplete conclusions because for most of the targets improvements are not expected in the
Figure A3.2 EU CO2 emissions of maritime bunker fuels
0
20
40
60
80
100
120
140
160
180
200
1990 1995 2000 2005 2010 2015 2020 2025 2030 2035 2040 2045 2050
Total GHG emissions, million tonnes)
International maritime transport
2050 maritime target (40 % reduction on 2005)
Target path
first years. This is as a consequence of fleet renewal and technology uptake, among other circumstances, including temporal breakdowns or recessions. However, these circumstances will be explained when assessing the annual progress, and can also be checked against the evolution of different TERM-CSIs. In addition, assumed linear trends have been calculated bearing in mind mid-term targets if available (i.e. CO2 emissions from new passenger cars for the 2015 and 2020 targets) and therefore different speeds to meet the targets, forecast in official scenarios and documents, are taken into account.
Note: EU CO2 maritime emissions of maritime bunker fuels data for 2011 shows inconsistency with the changes in bunker fuels and transport activity for 2010–2011 and it is currently under investigation. Therefore, the observed 2011 data and blue line appear dashed for the latest year, and should not be treated as final data.

Annex 3
92 A closer look at urban transport
Figure A3.3 Target average type-approval CO2 emissions for new passenger cars
60
80
100
120
140
160
180
Tailpipe emission factor, g CO2/km
Average CO2 emissions from new passenger cars Target path
2020 target for new passenger cars (95 g CO2/km)
2015 target for new passenger cars (130 g CO2/km)
2000
2001
2002
2003
2004
2005
2006
2007
2008
2009
2010
2011
2012
2013
2014
2015
2016
2017
2018
2019
2020
Figure A3.4 Target average type-approval CO2 emissions for new vans
120
130
140
150
160
170
180
190
2010 2011 2012 2013 2014 2015 2016 2017 2018 2019 2020
Tailpipe emission factor, g CO2/km
Average CO2 emissions from new vans Target path
2020 target for new vans (147 g CO2/km)
2017 target for new vans (175 g CO2/km)

Annex 3
93A closer look at urban transport
60
80
100
120
140
160
180
Tailpipe emission factor, g CO2/km
Average CO2 emissions from new passenger cars Target path
2020 target for new passenger cars (95 g CO2/km)
2015 target for new passenger cars (130 g CO2/km)
2000
2001
2002
2003
2004
2005
2006
2007
2008
2009
2010
2011
2012
2013
2014
2015
2016
2017
2018
2019
2020
120
130
140
150
160
170
180
190
2010 2011 2012 2013 2014 2015 2016 2017 2018 2019 2020
Tailpipe emission factor, g CO2/km
Average CO2 emissions from new vans Target path
2020 target for new vans (147 g CO2/km)
2017 target for new vans (175 g CO2/km)
Figure A3.5 Reduction of transport oil consumption (incl. maritime bunkers)
Figure A3.6 Share of renewable energy in the transport sector
0
50 000
100 000
150 000
200 000
250 000
300 000
350 000
400 000
450 000
1990 1995 2000 2005 2010 2015 2020 2025 2030 2035 2040 2045 2050
Oil consumption (ktoe)
EU-28 – Oil consumption (ktoe) 70 %-reduction (on 2008) of transport oil consumption (ktoe) Target path
2050 oil consumption target (70 % reduction on 2008)
0
2
4
6
8
10
12
Renewables share (%) Renewables share (%) meeting RED criteria Target path
10 % share of renewable energy in the transport sector final energy consumptionfor each Member State (here EU-28 average as a proxy)
%
2005
2006
2007
2008
2009
2010
2011
2012
2013
2014
2015
2016
2017
2018
2019
2020

94
Annex 4
A closer look at urban transport
The TERM indicators have been published annually since 2000, subject to data availability. In 2000, the indicators appeared only in the annual TERM report but they have since been published individually on the EEA website. When the
Annex 4 Overview of the TERM fact sheets
indicator set was originally defined, it was foreseen that the data, that was at that point limited, would eventually become available over time. For this reason, not all indicators have been published every year.
2000–2004 2005–2009 2010–2013
TERM 01 Transportfinalenergyconsumptionbymode x x x x x x x x x x x x x x
TERM 02 Transport emissions of greenhouse gases x x x x x x x x x x x x x
TERM 03 Transport emissions of air pollutants x x x x x x x x x x x x x x
TERM 04 Exceedancesofairqualityobjectivesduetotraffic x x x x x x x x x x x x x x
TERM 05 Exposuretoandannoyancebytrafficnoise x x x x
TERM 06 Fragmentation of ecosystems and habitats by transport infrastructure x x x x
TERM 07 Proximity of transport infrastructure to designated areas x x
TERM 08 Land take by transport infrastructure x x x
TERM 09 Transport accident fatalities x x x x x x x x x
TERM 10 Accidental and illegal discharges of oil at sea x x x
TERM 11 Waste oil and tires from vehicles x
TERM 11a Waste from road vehicles (ELV) x x x
TERM 12a/b Passenger transport volume and modal split (CSI 035) x x x x x x x x x x x x x x
TERM 13a/b Freight transport volume and modal split (CSI 036) x x x x x x x x x x x x x x
TERM 14 Access to basic services x x x
TERM 15 Regional accessibility of markets and cohesion x x
TERM 16 Access to transport services x x
TERM 18 Capacity of infrastructure networks x x x x x x x x x
TERM 19 Infrastructure investments x x x x x x x
TERM 20 Real change in transport prices by mode x x x x x x x x x x x
TERM 21 Fuel prices and taxes x x x x x x x x x x x x x x
TERM 22 Transport taxes and charges x x x x x x x
TERM 23 Subsidies x
TERM 24 Expenditure on personal mobility by income group x x x x x x x
TERM 25 External costs of transport x x x x x x x x
TERM 26 Internalisation of external costs x x x x x x x x x
TERM 27 EnergyefficiencyandspecificCO2 emissions x x x x x x x x x x x
TERM 28 Specificairpollutantemissions x x x x x x x x x x x
TERM 29 Occupancy rates of passenger vehiclesx
x x x x x x x
TERM 30 Load factors for freight transport x x x x x x x
TERM 31 Uptake of cleaner and alternative fuels (CSI 037) x x x x x x x x x x x x x x
TERM 32 Sizeofthevehiclefleet x x x x x x x x x x x x
TERM 33 Averageageofthevehiclefleet x x x x x x x x x x x x
TERM 34 Proportionofvehiclefleetmeetingcertainemissionstandards x x x x x x x x x x x x
TERM 35 Implementation of integrated strategies x x x x
TERM 36 Institutional cooperation x x x
TERM 37 National monitoring systems x x x x
TERM 38 Implementation of SEA x x x x
TERM 39 Uptake of environmental mgt. systems by transport companies x
TERM 40 Public awareness x x x

95
Annex 5
A closer look at urban transport
Annex 5 Data
This annex provides an overview of the key statistics that underpin the assessment in the report. It is generally based on data from sources such as Eurostat and the European Commission's Directorate-General for Mobility and Transport's statistical pocketbook. For a full explanation of the data sources, see metadata in Annex 1.
• Table A5.1 Freight inland transport volume by country (1 000 million tkm) (1995–2011) — road, rail and inland waterways. DG MOVE, 2013.
• Table A5.2 Modal share of freight transport (% in total inland freight tkm) (1995–2011) — road, rail and inland waterways. DG MOVE, 2013.
• Table A5.3 Sea transport of goods (1 000 tonnes) (1997–2011). Eurostat, 2013.
• Table A5.4 Total inland passenger transport (1 000 million pkm) (1995–2011): cars, trains, buses and coaches, trams and metros by country. DG MOVE, 2013.
• Table A5.5 Modal split of passenger inland transport (cars, trains, buses and coaches) by country (1995–2011). DG MOVE, 2013.
• Table A5.6 Air passenger transport in EU-27 (1 000 million passenger kilometres) (1995–2011). DG MOVE, 2013, only domestic and intra-EU-27 transport; provisional estimates.
• Table A5.7 Number of passenger cars per thousand inhabitants (1990, 1995, 2000, 2005, 2010, 2011). DG MOVE, 2013.
• Table A5.8 Greenhouse gas emissions from transport in Europe (million tonnes, unless otherwise stated) emissions of GHGs by country and sub-sector (1990, 2011). EEA data viewer, 2013.
• Table A5.9 Gross inland consumption and primary production of biodiesel, biogasoline and other liquid biofuels in the EEA-33 in TJ. Eurostat, 2013.

Annex 5
96 A closer look at urban transport
Table A5.1 Freight inland transport volume by country (1 000 million tkm) (1995–2011) — road, rail and inland waterways
1995 1996 1997 1998 1999 2000 2001 2002 2003 2004 2005 2006 2007 2008 2009 2010 2011
Austria 42 43 45 47 51 54 57 58 59 60 58 62 61 59 49 51 51
Belgium 59 55 57 55 51 66 68 68 66 64 61 60 60 56 50 52 50
Bulgaria 14 13 14 13 11 12 13 14 15 18 20 20 21 23 26 29 29
Croatia 4 4 4 4 4 5 9 10 11 11 12 14 14 15 13 12 12
Cyprus 1 1 1 1 1 1 1 1 1 1 1 1 1 1 1 1 1
Czech Rep. 54 53 52 53 54 55 56 60 62 61 58 66 64 66 58 66 69
Denmark 24 23 23 23 25 26 24 24 25 25 25 23 23 21 19 17 19
Estonia 5 6 8 10 11 12 13 14 14 16 16 16 15 13 11 12 12
Finland 34 34 36 38 40 42 40 42 41 43 42 41 40 42 37 39 36
France 233 236 243 251 268 271 267 264 260 267 255 262 271 256 214 222 229
Germany 372 368 382 396 418 430 435 430 434 459 470 501 523 521 459 483 492
Greece 24 25 26 28 28 29 30 31 33 37 33 35 29 30 29 30 21
Hungary 23 23 24 28 28 29 27 27 27 31 36 43 48 48 45 45 45
Iceland 1 1 1 1 1 1 1 1 1 1 1 1 1 1 1 1 1
Ireland 6 7 8 9 11 13 13 15 16 18 18 18 19 18 12 11 10
Italy 196 197 201 203 199 208 208 213 194 219 235 211 205 204 185 194 163
Latvia 12 15 17 17 16 18 20 21 25 26 28 28 32 32 27 28 34
Lithuania 12 12 14 14 16 17 16 20 23 24 28 31 35 35 30 33 37
Luxembourg 6 4 5 6 7 9 10 10 10 11 10 10 10 10 9 9 9
Malta 0 0 0 0 0 0 0 0 0 0 0 0 0 0 0 0 0
Netherlands 106 108 115 123 129 125 125 122 124 139 132 132 131 130 114 123 126
Norway 12 15 17 18 18 18 18 18 19 20 21 23 23 24 22 23 23
Poland 120 125 132 132 127 130 126 128 134 156 162 182 205 217 224 260 262
Portugal 34 35 38 39 40 41 43 42 42 43 45 47 49 42 38 38 39
Romania 41 48 48 37 31 33 37 44 49 61 77 81 83 80 57 53 52
Slovakia 31 29 29 31 30 27 26 26 27 29 33 33 38 40 36 37 38
Slovenia 6 6 7 7 7 8 10 10 10 12 14 15 17 20 18 19 20
Spain 113 113 122 136 146 160 173 196 204 233 245 253 270 254 220 219 217
Sweden 51 52 54 52 52 55 53 56 57 58 60 62 64 65 55 60 60
Switzerland 18 17 18 19 19 21 21 21 21 22 22 23 23 26 24 24 25
Turkey 121 145 149 161 159 171 159 158 161 166 176 187 191 192 187 202 214
United Kingdom 175 181 186 189 185 184 183 183 186 185 183 188 192 182 159 165 174
Source: DG MOVE, 2013.

Annex 5
97A closer look at urban transport
Table A5.2 Modal share of freight transport (% in total inland freight tkm) (1996–2011) — road, rail and inland waterways
Source: DG MOVE, 2013.
Road (%) Rail (%) IWW (%)
1996 2001 2006 2011 1996 2001 2006 2011 1996 2001 2006 2011
Austria 64.3 65.9 63.2 56.0 30.8 29.6 33.8 39.9 4.9 4.5 3.0 4.2
Belgium 76.3 78.3 71.1 66.3 13.2 10.4 14.2 15.2 10.4 11.3 14.7 18.5
Bulgaria 40.2 60.2 69.0 73.6 56.0 36.7 27.1 11.4 3.8 3.1 3.9 15.0
Croatia 58.2 75.9 74.8 74.0 41.2 23.2 24.3 20.2 0.5 0.9 0.9 5.7
Cyprus 100.0 100.0 100.0 100.0 0.0 0.0 0.0 0.0 0.0 0.0 0.0 0.0
Czech Republic 57.1 69.7 76.1 79.2 42.4 30.2 23.8 20.7 0.5 0.1 0.1 0.1
Denmark 92.4 91.4 91.8 86.0 7.6 8.6 8.2 14.0 0.0 0.0 0.0 0.0
Estonia 31.1 35.3 34.7 48.5 68.9 64.7 65.3 51.5 0.0 0.0 0.0 0.0
Finland 73.7 75.4 72.8 73.9 26.0 24.4 27.1 25.8 0.3 0.2 0.2 0.2
France 76.2 77.5 80.8 81.1 21.2 19.4 15.7 14.9 2.6 3.1 3.4 3.9
Germany 64.3 66.5 65.9 65.8 19.0 18.6 21.4 23.0 16.7 14.9 12.8 11.2
Greece 98.7 98.7 98.1 98.3 1.3 1.3 1.9 1.7 0.0 0.0 0.0 0.0
Hungary 61.4 67.8 71.6 75.9 32.6 28.2 23.9 20.0 6.0 4.0 4.5 4.0
Iceland 100.0 100.0 100.0 100.0 0.0 0.0 0.0 0.0 0.0 0.0 0.0 0.0
Ireland 91.7 96.0 98.8 99.0 8.3 4.0 1.2 1.0 0.0 0.0 0.0 0.0
Italy 89.2 89.5 88.5 87.8 10.7 10.4 11.4 12.2 0.1 0.1 0.0 0.1
Latvia 15.1 27.4 39.0 36.2 84.9 72.6 61.0 63.8 0.0 0.0 0.0 0.0
Lithuania 34.1 51.7 58.4 58.8 65.9 48.3 41.6 41.2 0.1 0.0 0.0 0.0
Luxembourg 80.4 90.1 91.5 93.7 12.2 6.1 4.6 3.1 7.4 3.8 4.0 3.2
Malta 100.0 100.0 100.0 100.0 0.0 0.0 0.0 0.0 0.0 0.0 0.0 0.0
Netherlands 64.2 63.0 63.2 58.2 2.9 3.4 4.8 5.1 32.9 33.5 32.1 36.7
Norway 81.7 84.0 85.3 84.3 18.3 16.0 14.7 15.7 0.0 0.0 0.0 0.0
Poland 45.3 61.2 70.4 79.4 54.0 37.8 29.4 20.5 0.7 1.0 0.2 0.1
Portugal 94.8 95.0 94.9 94.0 5.2 5.0 5.1 6.0 0.0 0.0 0.0 0.0
Romania 41.4 49.6 70.5 50.2 50.7 43.1 19.4 28.0 7.9 7.3 10.0 21.7
Slovakia 53.8 53.6 67.6 76.6 40.7 42.5 30.4 20.9 5.4 3.9 2.0 2.4
Slovenia 57.9 71.3 78.2 81.4 42.1 28.7 21.8 18.6 0.0 0.0 0.0 0.0
Spain 90.2 93.2 95.4 95.5 9.8 6.8 4.6 4.5 0.0 0.0 0.0 0.0
Sweden 63.9 64.3 64.2 61.8 36.1 35.7 35.8 38.2 0.0 0.0 0.0 0.0
Switzerland 52.7 46.0 45.5 54.0 47.0 53.7 54.3 45.9 0.3 0.3 0.2 0.1
Turkey 93.8 95.3 94.9 94.7 6.2 4.7 5.1 5.3 0.0 0.0 0.0 0.0
United Kingdom 91.6 89.3 88.2 87.9 8.3 10.6 11.7 12.0 0.1 0.1 0.1 0.1
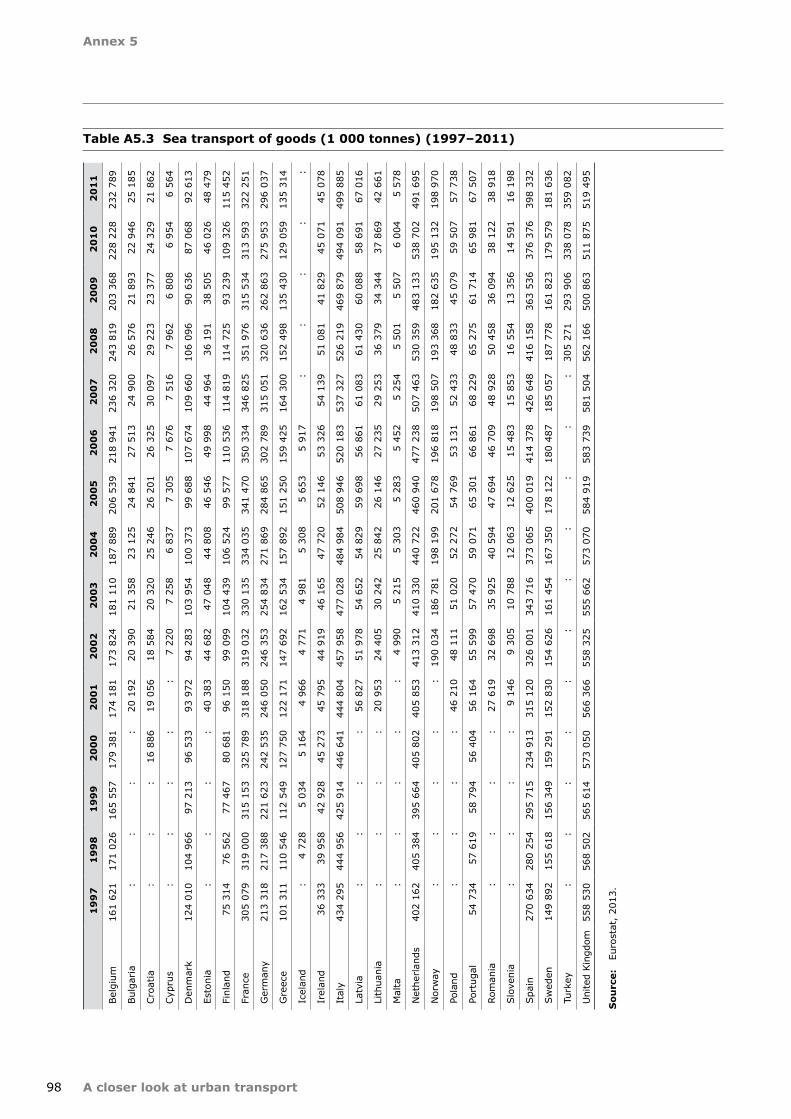
Annex 5
98 A closer look at urban transport
Table A5.3 Sea transport of goods (1 000 tonnes) (1997–2011)
19
97
19
98
19
99
20
00
20
01
20
02
20
03
20
04
20
05
20
06
20
07
20
08
20
09
20
10
20
11
Bel
gium
161
621
171
026
165
557
179
381
174
181
173
824
181
110
187
889
206
539
218
941
236
320
243
819
203
368
228
228
232
789
Bul
garia
::
::
20 1
9220
390
21 3
5823
125
24 8
4127
513
24 9
0026
576
21 8
9322
946
25 1
85
Cro
atia
::
:16
886
19 0
5618
584
20 3
2025
246
26 2
0126
325
30 0
9729
223
23 3
7724
329
21 8
62
Cyp
rus
::
::
:7
220
7 25
86
837
7 30
57
676
7 51
67
962
6 80
86
954
6 56
4
Den
mar
k12
4 01
010
4 96
697
213
96 5
3393
972
94 2
8310
3 95
410
0 37
399
688
107
674
109
660
106
096
90 6
3687
068
92 6
13
Esto
nia
::
::
40 3
8344
682
47 0
4844
808
46 5
4649
998
44 9
6436
191
38 5
0546
026
48 4
79
Finl
and
75 3
1476
562
77 4
6780
681
96 1
5099
099
104
439
106
524
99 5
7711
0 53
611
4 81
911
4 72
593
239
109
326
115
452
Fran
ce30
5 07
931
9 00
031
5 15
332
5 78
931
8 18
831
9 03
233
0 13
533
4 03
534
1 47
035
0 33
434
6 82
535
1 97
631
5 53
431
3 59
332
2 25
1
Ger
man
y21
3 31
821
7 38
822
1 62
324
2 53
524
6 05
024
6 35
325
4 83
427
1 86
928
4 86
530
2 78
931
5 05
132
0 63
626
2 86
327
5 95
329
6 03
7
Gre
ece
101
311
110
546
112
549
127
750
122
171
147
692
162
534
157
892
151
250
159
425
164
300
152
498
135
430
129
059
135
314
Icel
and
:4
728
5 03
45
164
4 96
64
771
4 98
15
308
5 65
35
917
::
::
:
Irel
and
36 3
3339
958
42 9
2845
273
45 7
9544
919
46 1
6547
720
52 1
4653
326
54 1
3951
081
41 8
2945
071
45 0
78
Ital
y43
4 29
544
4 95
642
5 91
444
6 64
144
4 80
445
7 95
847
7 02
848
4 98
450
8 94
652
0 18
353
7 32
752
6 21
946
9 87
949
4 09
149
9 88
5
Latv
ia:
::
:56
827
51 9
7854
652
54 8
2959
698
56 8
6161
083
61 4
3060
088
58 6
9167
016
Lith
uani
a:
::
:20
953
24 4
0530
242
25 8
4226
146
27 2
3529
253
36 3
7934
344
37 8
6942
661
Mal
ta:
::
::
4 99
05
215
5 30
35
283
5 45
25
254
5 50
15
507
6 00
45
578
Net
herlan
ds40
2 16
240
5 38
439
5 66
440
5 80
240
5 85
341
3 31
241
0 33
044
0 72
246
0 94
047
7 23
850
7 46
353
0 35
948
3 13
353
8 70
249
1 69
5
Nor
way
::
::
:19
0 03
418
6 78
119
8 19
920
1 67
819
6 81
819
8 50
719
3 36
818
2 63
519
5 13
219
8 97
0
Pola
nd:
::
:46
210
48 1
1151
020
52 2
7254
769
53 1
3152
433
48 8
3345
079
59 5
0757
738
Port
ugal
54 7
3457
619
58 7
9456
404
56 1
6455
599
57 4
7059
071
65 3
0166
861
68 2
2965
275
61 7
1465
981
67 5
07
Rom
ania
::
::
27 6
1932
698
35 9
2540
594
47 6
9446
709
48 9
2850
458
36 0
9438
122
38 9
18
Slo
veni
a:
::
:9
146
9 30
510
788
12 0
6312
625
15 4
8315
853
16 5
5413
356
14 5
9116
198
Spa
in27
0 63
428
0 25
429
5 71
523
4 91
331
5 12
032
6 00
134
3 71
637
3 06
540
0 01
941
4 37
842
6 64
841
6 15
836
3 53
637
6 37
639
8 33
2
Swed
en14
9 89
215
5 61
815
6 34
915
9 29
115
2 83
015
4 62
616
1 45
416
7 35
017
8 12
218
0 48
718
5 05
718
7 77
816
1 82
317
9 57
918
1 63
6
Turk
ey:
::
::
::
::
::
305
271
293
906
338
078
359
082
Uni
ted
Kin
gdom
558
530
568
502
565
614
573
050
566
366
558
325
555
662
573
070
584
919
583
739
581
504
562
166
500
863
511
875
519
495
Sou
rce:
Eu
rost
at,
2013
.

Annex 5
99A closer look at urban transport
Table A5.4 Total inland passenger transport (1 000 million pkm): cars, trains, buses and coaches, trams and metros by country (1995–2011)
Sou
rce:
D
G M
OVE,
201
3.
1
99
51
99
61
99
71
99
81
99
92
00
02
00
12
00
22
00
32
00
42
00
52
00
62
00
72
00
82
00
92
01
02
01
1
Aus
tria
8485
8586
8788
8990
9192
9393
9598
9698
99
Bel
gium
119
119
121
124
127
127
130
132
133
135
136
138
142
140
142
143
145
Bul
garia
4240
4243
4445
4649
4849
5253
5760
6061
62
Cro
atia
1821
2323
2425
2627
2829
2930
3234
3331
30
Cyp
rus
45
55
55
55
56
66
77
77
7
Cze
ch R
epub
lic89
9090
9093
9597
9799
9899
100
102
104
104
9797
Den
mar
k61
6263
6364
6463
6363
6463
6365
6565
6466
Esto
nia
88
89
910
1010
1011
1313
1313
1312
13
Finl
and
6262
6465
6667
6870
7172
7374
7676
7677
77
Fran
ce78
379
781
484
486
887
891
192
593
093
793
393
895
395
095
296
196
8
Ger
man
y96
997
197
298
31
005
990
1 01
21
016
1 01
11
024
1 01
41
024
1 02
71
033
1 04
11
048
1 06
1
Gre
ece
6770
7377
8288
9397
101
105
110
115
121
125
125
124
122
Hun
gary
7373
7475
7677
7778
7980
7982
8282
8179
79
Icel
and
34
44
44
45
55
55
66
66
5
Irel
and
3839
4143
4446
4848
4950
5254
5759
5755
55
Ital
y75
476
978
180
380
786
387
488
589
590
683
483
683
683
587
785
582
0
Latv
ia11
1112
1315
1515
1617
1516
1820
1816
1514
Lith
uani
a21
2324
2628
2929
3032
3539
4443
4239
3633
Luxe
mbo
urg
66
66
67
77
77
78
88
88
8
Mal
ta2
22
22
22
22
22
33
33
33
Net
herlan
ds16
116
016
416
416
816
816
917
117
317
917
717
717
817
617
517
016
9
Nor
way
5153
5557
5858
6061
6162
6263
6466
6667
68
Pola
nd17
618
019
020
020
321
021
622
222
723
524
927
029
132
533
234
235
6
Port
ugal
6972
7781
8487
8992
9798
101
101
103
103
102
100
99
Rom
ania
7780
8079
8081
8180
8284
8791
9498
101
100
99
Slo
vaki
a37
3736
3536
3636
3737
3737
3837
3734
3535
Slo
veni
a21
2324
2425
2525
2526
2626
2728
2930
3030
Spa
in31
132
433
434
936
837
838
639
239
841
041
941
943
143
443
742
141
9
Swed
en10
610
710
710
812
012
112
212
512
612
712
712
813
113
013
013
013
2
Switz
erla
nd88
9090
9192
9495
9798
9910
010
110
310
510
710
911
1
Turk
ey14
415
416
416
917
017
216
316
717
118
520
021
322
523
523
423
825
0
Uni
ted
Kin
gdom
701
707
720
726
736
734
748
770
767
772
767
773
781
775
771
768
767
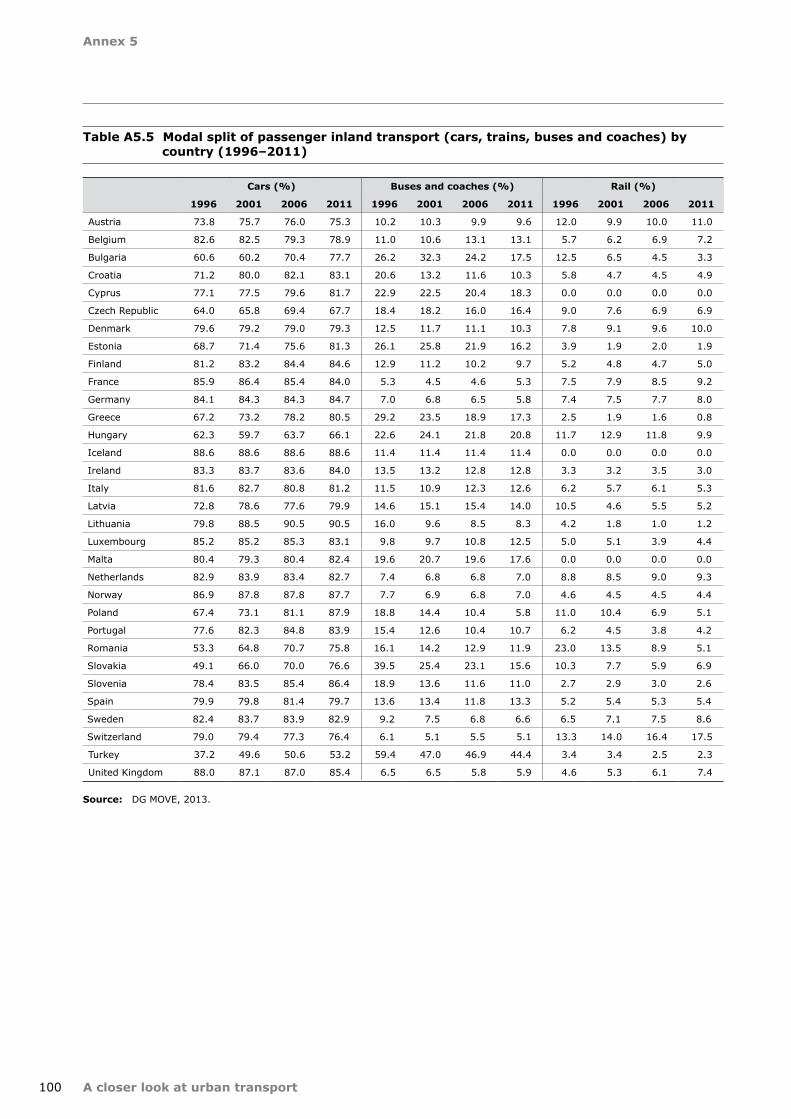
Annex 5
100 A closer look at urban transport
Table A5.5 Modal split of passenger inland transport (cars, trains, buses and coaches) by country (1996–2011)
Cars (%) Buses and coaches (%) Rail (%)
1996 2001 2006 2011 1996 2001 2006 2011 1996 2001 2006 2011
Austria 73.8 75.7 76.0 75.3 10.2 10.3 9.9 9.6 12.0 9.9 10.0 11.0
Belgium 82.6 82.5 79.3 78.9 11.0 10.6 13.1 13.1 5.7 6.2 6.9 7.2
Bulgaria 60.6 60.2 70.4 77.7 26.2 32.3 24.2 17.5 12.5 6.5 4.5 3.3
Croatia 71.2 80.0 82.1 83.1 20.6 13.2 11.6 10.3 5.8 4.7 4.5 4.9
Cyprus 77.1 77.5 79.6 81.7 22.9 22.5 20.4 18.3 0.0 0.0 0.0 0.0
Czech Republic 64.0 65.8 69.4 67.7 18.4 18.2 16.0 16.4 9.0 7.6 6.9 6.9
Denmark 79.6 79.2 79.0 79.3 12.5 11.7 11.1 10.3 7.8 9.1 9.6 10.0
Estonia 68.7 71.4 75.6 81.3 26.1 25.8 21.9 16.2 3.9 1.9 2.0 1.9
Finland 81.2 83.2 84.4 84.6 12.9 11.2 10.2 9.7 5.2 4.8 4.7 5.0
France 85.9 86.4 85.4 84.0 5.3 4.5 4.6 5.3 7.5 7.9 8.5 9.2
Germany 84.1 84.3 84.3 84.7 7.0 6.8 6.5 5.8 7.4 7.5 7.7 8.0
Greece 67.2 73.2 78.2 80.5 29.2 23.5 18.9 17.3 2.5 1.9 1.6 0.8
Hungary 62.3 59.7 63.7 66.1 22.6 24.1 21.8 20.8 11.7 12.9 11.8 9.9
Iceland 88.6 88.6 88.6 88.6 11.4 11.4 11.4 11.4 0.0 0.0 0.0 0.0
Ireland 83.3 83.7 83.6 84.0 13.5 13.2 12.8 12.8 3.3 3.2 3.5 3.0
Italy 81.6 82.7 80.8 81.2 11.5 10.9 12.3 12.6 6.2 5.7 6.1 5.3
Latvia 72.8 78.6 77.6 79.9 14.6 15.1 15.4 14.0 10.5 4.6 5.5 5.2
Lithuania 79.8 88.5 90.5 90.5 16.0 9.6 8.5 8.3 4.2 1.8 1.0 1.2
Luxembourg 85.2 85.2 85.3 83.1 9.8 9.7 10.8 12.5 5.0 5.1 3.9 4.4
Malta 80.4 79.3 80.4 82.4 19.6 20.7 19.6 17.6 0.0 0.0 0.0 0.0
Netherlands 82.9 83.9 83.4 82.7 7.4 6.8 6.8 7.0 8.8 8.5 9.0 9.3
Norway 86.9 87.8 87.8 87.7 7.7 6.9 6.8 7.0 4.6 4.5 4.5 4.4
Poland 67.4 73.1 81.1 87.9 18.8 14.4 10.4 5.8 11.0 10.4 6.9 5.1
Portugal 77.6 82.3 84.8 83.9 15.4 12.6 10.4 10.7 6.2 4.5 3.8 4.2
Romania 53.3 64.8 70.7 75.8 16.1 14.2 12.9 11.9 23.0 13.5 8.9 5.1
Slovakia 49.1 66.0 70.0 76.6 39.5 25.4 23.1 15.6 10.3 7.7 5.9 6.9
Slovenia 78.4 83.5 85.4 86.4 18.9 13.6 11.6 11.0 2.7 2.9 3.0 2.6
Spain 79.9 79.8 81.4 79.7 13.6 13.4 11.8 13.3 5.2 5.4 5.3 5.4
Sweden 82.4 83.7 83.9 82.9 9.2 7.5 6.8 6.6 6.5 7.1 7.5 8.6
Switzerland 79.0 79.4 77.3 76.4 6.1 5.1 5.5 5.1 13.3 14.0 16.4 17.5
Turkey 37.2 49.6 50.6 53.2 59.4 47.0 46.9 44.4 3.4 3.4 2.5 2.3
United Kingdom 88.0 87.1 87.0 85.4 6.5 6.5 5.8 5.9 4.6 5.3 6.1 7.4
Source: DG MOVE, 2013.

Annex 5
101A closer look at urban transport
Table A5.6 Air passenger transport in EU-27 (1 000 million passenger kilometres) (1995–2011)
1 000 million pkm
1995 346.0
1996 366.0
1997 390.0
1998 409.0
1999 425.0
2000 457.0
2001 453.0
2002 445.0
2003 463.0
2004 493.0
2005 527.0
2006 549.0
2007 572.0
2008 561.0
2009 522.0
2010 522.5
2011 575.1
Note: These data are estimates, not actual statistics. Only domestic and intra–EU-27 transport; provisional estimates.
Source: DG MOVE, 2013, only domestic and intra-EU-27 transport; provisional estimates.
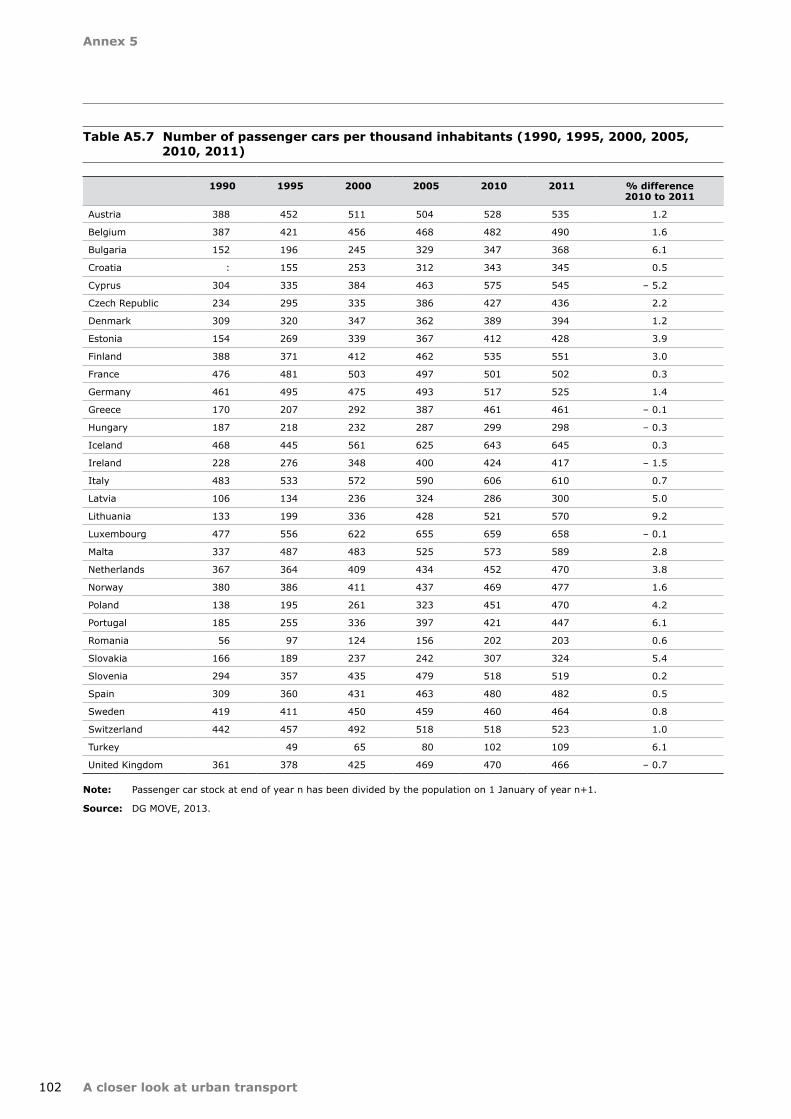
Annex 5
102 A closer look at urban transport
Table A5.7 Number of passenger cars per thousand inhabitants (1990, 1995, 2000, 2005, 2010, 2011)
Note: Passenger car stock at end of year n has been divided by the population on 1 January of year n+1.
Source: DG MOVE, 2013.
1990 1995 2000 2005 2010 2011 % difference 2010 to 2011
Austria 388 452 511 504 528 535 1.2
Belgium 387 421 456 468 482 490 1.6
Bulgaria 152 196 245 329 347 368 6.1
Croatia : 155 253 312 343 345 0.5
Cyprus 304 335 384 463 575 545 – 5.2
Czech Republic 234 295 335 386 427 436 2.2
Denmark 309 320 347 362 389 394 1.2
Estonia 154 269 339 367 412 428 3.9
Finland 388 371 412 462 535 551 3.0
France 476 481 503 497 501 502 0.3
Germany 461 495 475 493 517 525 1.4
Greece 170 207 292 387 461 461 – 0.1
Hungary 187 218 232 287 299 298 – 0.3
Iceland 468 445 561 625 643 645 0.3
Ireland 228 276 348 400 424 417 – 1.5
Italy 483 533 572 590 606 610 0.7
Latvia 106 134 236 324 286 300 5.0
Lithuania 133 199 336 428 521 570 9.2
Luxembourg 477 556 622 655 659 658 – 0.1
Malta 337 487 483 525 573 589 2.8
Netherlands 367 364 409 434 452 470 3.8
Norway 380 386 411 437 469 477 1.6
Poland 138 195 261 323 451 470 4.2
Portugal 185 255 336 397 421 447 6.1
Romania 56 97 124 156 202 203 0.6
Slovakia 166 189 237 242 307 324 5.4
Slovenia 294 357 435 479 518 519 0.2
Spain 309 360 431 463 480 482 0.5
Sweden 419 411 450 459 460 464 0.8
Switzerland 442 457 492 518 518 523 1.0
Turkey 49 65 80 102 109 6.1
United Kingdom 361 378 425 469 470 466 – 0.7

Annex 5
103A closer look at urban transport
Table A5.8 Greenhouse gas emissions from transport in Europe (million tonnes, unless otherwise stated), emissions of GHGs by country and sub-sector (1990, 2011)
Tota
l tra
nsp
ort
excl
ud
ing
in
tern
atio
nal
avi
atio
n
and
nav
igat
ion
Civ
il av
iati
onR
oad
Rai
lN
avig
atio
n
19
90
20
11
Gro
wth
%
19
90
20
11
Gro
wth
%
19
90
20
11
Gro
wth
%
19
90
20
11
Gro
wth
%
19
90
20
11
Gro
wth
%
Aus
tria
14.0
321
.75
550.
030.
0694
13.5
621
.12
560.
200.
16–
170.
010.
01–
20
Bel
gium
20.8
227
.05
300.
010.
0417
919
.95
26.2
331
0.24
0.11
– 54
0.41
0.50
20
Bul
garia
6.79
8.13
200.
140.
07–
526.
097.
5223
0.36
0.06
– 83
0.06
0.01
– 83
Cro
atia
4.10
5.89
440.
160.
09–
423.
675.
6053
0.14
0.08
– 40
0.13
0.12
– 12
Cyp
rus
1.18
2.25
910.
000.
00n.
a.1.
182.
2591
0.00
0.00
n.a.
0.00
0.00
n.a.
Cze
ch R
epub
lic7.
7617
.26
122
0.15
0.01
– 97
6.40
16.8
116
30.
660.
29–
570.
060.
01–
83
Den
mar
k10
.78
12.8
719
0.25
0.15
– 40
9.42
11.8
926
0.30
0.25
– 16
0.81
0.57
– 29
Esto
nia
2.46
2.26
– 8
0.01
0.00
– 51
2.28
2.14
– 6
0.16
0.11
– 32
0.02
0.01
– 33
Finl
and
12.7
613
.23
40.
390.
25–
3711
.06
11.6
86
0.19
0.10
– 49
0.45
0.54
21
Fran
ce12
1.22
132.
059
4.29
4.78
1111
4.54
125.
039
1.08
0.49
– 55
1.09
1.24
14
Ger
man
y16
4.72
157.
18–
52.
341.
86–
2015
2.62
149.
35–
22.
901.
07–
632.
080.
77–
63
Gre
ece
14.5
420
.30
400.
360.
35–
111
.99
17.4
746
0.23
0.05
– 77
1.97
2.41
23
Hun
gary
8.34
11.3
937
0.00
0.00
– 10
07.
7911
.25
440.
520.
14–
730.
030.
00–
90
Icel
and
0.62
0.86
390.
030.
02–
360.
530.
8256
0.00
0.00
n.a.
0.06
0.02
– 69
Irel
and
5.12
11.2
912
00.
050.
02–
634.
7710
.81
126
0.15
0.14
– 8
0.09
0.17
102
Ital
y10
3.11
117.
8514
1.63
2.32
4395
.08
109.
7415
0.50
0.16
– 68
5.49
4.93
– 10
Latv
ia3.
003.
145
0.00
0.00
875
2.40
2.86
190.
600.
26–
560.
000.
021
493
Lith
uani
a7.
564.
48–
410.
010.
00–
795.
324.
06–
240.
350.
19–
450.
020.
025
Luxe
mbo
urg
2.72
6.85
152
0.00
0.00
165
2.69
6.83
154
0.03
0.01
– 55
0.00
0.00
2
Mal
ta0.
350.
5762
0.00
0.00
– 5
0.34
0.51
500.
000.
00n.
a.0.
010.
0433
7
Net
herlan
ds26
.26
35.2
234
0.03
0.02
– 19
25.7
334
.42
340.
090.
1013
0.41
0.67
65
Nor
way
11.1
015
.24
370.
691.
2177
7.76
10.0
630
0.11
0.04
– 60
1.71
2.09
22
Pola
nd20
.47
48.6
913
80.
060.
0946
18.6
347
.70
156
1.64
0.37
– 77
0.14
0.01
– 92
Port
ugal
10.3
117
.55
700.
230.
3655
9.63
16.9
576
0.19
0.04
– 77
0.26
0.20
– 22
Rom
ania
11.9
614
.58
220.
020.
301
099
10.0
613
.49
340.
750.
60–
201.
120.
16–
86
Slo
vaki
a5.
026.
3827
0.01
0.01
– 25
4.59
6.28
370.
430.
10–
780.
000.
0034
Slo
veni
a2.
735.
7010
90.
000.
0078
2.66
5.65
113
0.07
0.04
– 42
0.00
0.00
n.a.
Spa
in55
.74
87.3
957
1.78
3.37
8952
.01
79.7
553
0.42
0.28
– 33
1.51
3.85
154
Swed
en19
.30
20.0
04
0.69
0.53
– 22
17.6
518
.57
50.
110.
07–
410.
550.
49–
12
Switz
erla
nd14
.60
16.2
111
0.26
0.13
– 48
14.1
715
.87
120.
030.
0433
0.11
0.12
5
Turk
ey26
.29
47.9
582
0.91
3.37
268
24.3
541
.69
710.
520.
48–
80.
502.
4138
2
Uni
ted
Kin
gdom
115.
2111
5.17
01.
271.
5825
109.
9410
8.56
– 1
1.46
2.08
432.
292.
457
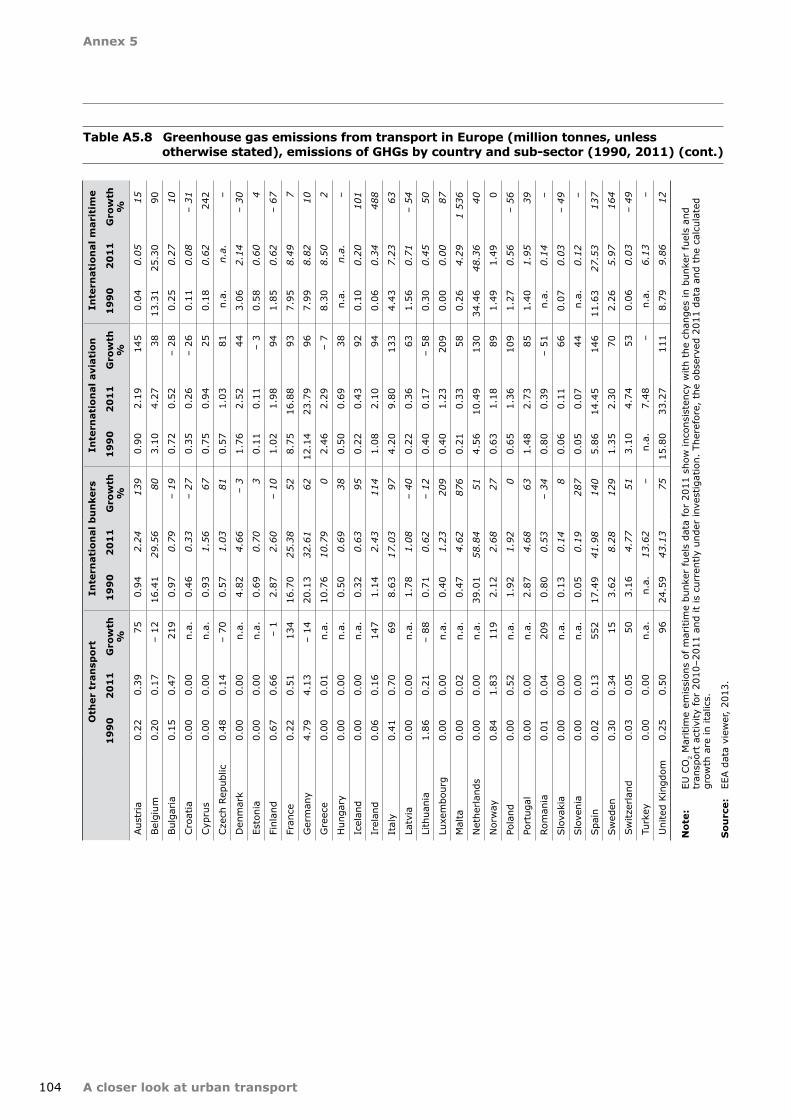
Annex 5
104 A closer look at urban transport
Table A5.8 Greenhouse gas emissions from transport in Europe (million tonnes, unless otherwise stated), emissions of GHGs by country and sub-sector (1990, 2011) (cont.)
Oth
er t
ran
spor
tIn
tern
atio
nal
bu
nke
rsIn
tern
atio
nal
avi
atio
n I
nte
rnat
ion
al m
arit
ime
19
90
20
11
Gro
wth
%
19
90
20
11
Gro
wth
%
19
90
20
11
Gro
wth
%
19
90
20
11
Gro
wth
%
Aus
tria
0.22
0.39
750.
942.
2413
90.
902.
1914
50.
040.
0515
Bel
gium
0.20
0.17
– 12
16.4
129
.56
803.
104.
2738
13.3
125
.30
90
Bul
garia
0.15
0.47
219
0.97
0.79
– 19
0.72
0.52
– 28
0.25
0.27
10
Cro
atia
0.00
0.00
n.a.
0.46
0.33
– 27
0.35
0.26
– 26
0.11
0.08
– 31
Cyp
rus
0.00
0.00
n.a.
0.93
1.56
670.
750.
9425
0.18
0.62
242
Cze
ch R
epub
lic0.
480.
14–
700.
571.
0381
0.57
1.03
81n.
a.n.
a.–
Den
mar
k0.
000.
00n.
a.4.
824.
66–
31.
762.
5244
3.06
2.14
– 30
Esto
nia
0.00
0.00
n.a.
0.69
0.70
30.
110.
11–
30.
580.
604
Finl
and
0.67
0.66
– 1
2.87
2.60
– 10
1.02
1.98
941.
850.
62–
67
Fran
ce0.
220.
5113
416
.70
25.3
852
8.75
16.8
893
7.95
8.49
7
Ger
man
y4.
794.
13–
1420
.13
32.6
162
12.1
423
.79
967.
998.
8210
Gre
ece
0.00
0.01
n.a.
10.7
610
.79
02.
462.
29–
78.
308.
502
Hun
gary
0.00
0.00
n.a.
0.50
0.69
380.
500.
6938
n.a.
n.a.
–
Icel
and
0.00
0.00
n.a.
0.32
0.63
950.
220.
4392
0.10
0.20
101
Irel
and
0.06
0.16
147
1.14
2.43
114
1.08
2.10
940.
060.
3448
8
Ital
y0.
410.
7069
8.63
17.0
397
4.20
9.80
133
4.43
7.23
63
Latv
ia0.
000.
00n.
a.1.
781.
08–
400.
220.
3663
1.56
0.71
– 54
Lith
uani
a1.
860.
21–
880.
710.
62–
120.
400.
17–
580.
300.
4550
Luxe
mbo
urg
0.00
0.00
n.a.
0.40
1.23
209
0.40
1.23
209
0.00
0.00
87
Mal
ta0.
000.
02n.
a.0.
474.
6287
60.
210.
3358
0.26
4.29
1 53
6
Net
herlan
ds0.
000.
00n.
a.39
.01
58.8
451
4.56
10.4
913
034
.46
48.3
640
Nor
way
0.84
1.83
119
2.12
2.68
270.
631.
1889
1.49
1.49
0
Pola
nd0.
000.
52n.
a.1.
921.
920
0.65
1.36
109
1.27
0.56
– 56
Port
ugal
0.00
0.00
n.a.
2.87
4.68
631.
482.
7385
1.40
1.95
39
Rom
ania
0.01
0.04
209
0.80
0.53
– 34
0.80
0.39
– 51
n.a.
0.14
–
Slo
vaki
a0.
000.
00n.
a.0.
130.
148
0.06
0.11
660.
070.
03–
49
Slo
veni
a0.
000.
00n.
a.0.
050.
1928
70.
050.
0744
n.a.
0.12
–
Spa
in0.
020.
1355
217
.49
41.9
814
05.
8614
.45
146
11.6
327
.53
137
Swed
en0.
300.
3415
3.62
8.28
129
1.35
2.30
702.
265.
9716
4
Switz
erla
nd0.
030.
0550
3.16
4.77
513.
104.
7453
0.06
0.03
– 49
Turk
ey0.
000.
00n.
a.n.
a.13
.62
– n.
a.7.
48–
n.a.
6.13
–
Uni
ted
Kin
gdom
0.25
0.50
9624
.59
43.1
375
15.8
033
.27
111
8.79
9.86
12
Not
e:
EU C
O2
Mar
itim
e em
issi
ons
of m
ariti
me
bunk
er fue
ls d
ata
for
2011
sho
w in
cons
iste
ncy
with
the
cha
nges
in b
unke
r fu
els
and
tran
spor
t ac
tivity
for
201
0–20
11 a
nd it
is c
urre
ntly
und
er in
vest
igat
ion.
The
refo
re,
the
obse
rved
201
1 da
ta a
nd t
he c
alcu
late
d gr
owth
are
in it
alic
s.
Sou
rce:
EE
A d
ata
view
er,
2013
.

Annex 5
105A closer look at urban transport
Not
e:
EU C
O2
Mar
itim
e em
issi
ons
of m
ariti
me
bunk
er fue
ls d
ata
for
2011
sho
w in
cons
iste
ncy
with
the
cha
nges
in b
unke
r fu
els
and
tran
spor
t ac
tivity
for
201
0–20
11 a
nd it
is c
urre
ntly
und
er in
vest
igat
ion.
The
refo
re,
the
obse
rved
201
1 da
ta a
nd t
he c
alcu
late
d gr
owth
are
in it
alic
s.
Sou
rce:
EE
A d
ata
view
er,
2013
.
Table A5.9 Gross inland consumption and primary production of biodiesel, biogasoline and other liquid biofuels in the EEA-33 in TJ
1
99
11
99
62
00
12
00
62
01
1
Bio
-d
iese
lsB
io-
gas
olin
eO
ther
liq
uid
b
iofu
els
Bio
-d
iese
lsB
io-
gas
olin
eO
ther
liq
uid
b
iofu
els
Bio
-d
iese
lsB
io-
gas
olin
eO
ther
liq
uid
b
iofu
els
Bio
-d
iese
lsB
io-
gas
olin
eO
ther
liq
uid
b
iofu
els
Bio
-d
iese
lsB
io-
gas
olin
eO
ther
liq
uid
b
iofu
els
Aus
tria
Con
sum
ptio
n0
029
10
051
00
079
210
241
02
607
15 4
392
772
3 45
1
Prod
uctio
n0
029
10
051
00
079
23
263
02
607
5019
2 18
83
313
Bel
gium
Con
sum
ptio
n0
00
00
00
00
00
2 43
312
959
1 78
21
933
Prod
uctio
n0
00
00
00
00
00
1 20
910
423
5 33
21
638
Bul
garia
Con
sum
ptio
n0
00
00
00
00
00
348
714
00
Prod
uctio
n0
00
00
00
00
00
348
591
00
Cro
atia
Con
sum
ptio
n0
00
00
00
00
00
010
553
0
Prod
uctio
n0
00
00
00
00
00
028
10
0
Cyp
rus
Con
sum
ptio
n0
00
00
00
00
00
068
40
0
Prod
uctio
n0
00
00
00
00
00
024
00
0
Cze
ch
Repu
blic
Con
sum
ptio
n0
00
913
00
1 90
90
071
148
010
035
2 53
80
Prod
uctio
n0
00
710
00
2 63
10
04
076
480
7 77
31
469
0
Den
mar
kCon
sum
ptio
n0
00
00
00
00
031
10
5 82
44
015
9
Prod
uctio
n0
00
00
094
00
02
632
00
2 96
40
9
Esto
nia
Con
sum
ptio
n0
00
00
00
00
00
00
00
Prod
uctio
n0
00
00
00
00
00
00
00
Finl
and
Con
sum
ptio
n0
00
00
00
00
034
02
070
3 89
11
893
Prod
uctio
n0
00
00
00
00
00
084
110
549
Fran
ceCon
sum
ptio
n0
00
7 97
11
616
011
421
2 42
50
23 8
976
209
085
089
16 4
690
Prod
uctio
n0
00
7 97
11
616
011
057
2 42
50
22 4
066
209
068
038
17 9
000
Ger
man
yCon
sum
ptio
n0
00
00
2 02
40
013
324
35 0
8113
722
109
728
86 1
1732
300
31 7
86
Prod
uctio
n0
00
00
2 02
40
013
324
116
103
9 11
210
9 72
810
6 12
115
314
31 7
86
Gre
ece
Con
sum
ptio
n0
00
00
00
00
1 89
70
08
887
00
Prod
uctio
n0
00
00
00
00
1 75
70
04
102
00
Hun
gary
Con
sum
ptio
n0
00
00
00
00
045
00
4 39
92
282
0
Prod
uctio
n0
00
00
00
00
045
00
5 31
963
40
Icel
and
Con
sum
ptio
n0
00
00
00
00
00
00
00
Prod
uctio
n0
00
00
00
00
00
00
00
Irel
and
Con
sum
ptio
n0
00
00
00
00
3027
552
889
1 27
519
Prod
uctio
n0
00
00
00
00
2927
6298
50
18
Ital
yCon
sum
ptio
n0
00
00
00
00
8 34
00
054
443
4 76
222
291
Prod
uctio
n0
00
00
00
00
8 34
00
022
097
3 19
822
291
Latv
iaCon
sum
ptio
n0
00
00
00
00
5743
31
432
318
81

Annex 5
106 A closer look at urban transport
Table A5.9 Gross inland consumption and primary production of biodiesel, biogasoline and other liquid biofuels in the EEA-33 in TJ (cont.)
1
99
11
99
62
00
12
00
62
01
1
Bio
-d
iese
lsB
io-
gas
olin
eO
ther
liq
uid
b
iofu
els
Bio
-d
iese
lsB
io-
gas
olin
eO
ther
liq
uid
b
iofu
els
Bio
-d
iese
lsB
io-
gas
olin
eO
ther
liq
uid
b
iofu
els
Bio
-d
iese
lsB
io-
gas
olin
eO
ther
liq
uid
b
iofu
els
Bio
-d
iese
lsB
io-
gas
olin
eO
ther
liq
uid
b
iofu
els
Prod
uctio
n0
00
00
00
00
247
133
32
136
5381
Lith
uani
aCon
sum
ptio
n0
00
00
00
00
588
226
01
489
394
0
Prod
uctio
n0
00
00
00
00
383
268
02
956
497
0
Luxe
mbo
urg
Con
sum
ptio
n0
00
00
00
00
00
211
582
214
7
Prod
uctio
n0
00
00
00
00
00
00
00
Mal
taCon
sum
ptio
n0
00
00
00
00
00
029
00
Prod
uctio
n0
00
00
00
00
00
029
00
Net
herlan
dsCon
sum
ptio
n0
00
00
00
00
968
798
16 4
866
676
6 24
414
4
Prod
uctio
n0
00
00
00
00
684
314
4 42
918
167
014
4
Nor
way
Con
sum
ptio
n0
00
00
00
00
861
144
8 82
765
683
Prod
uctio
n0
00
00
00
00
00
03
358
00
Pola
ndCon
sum
ptio
n0
00
00
00
00
1 24
92
558
249
22 4
207
479
9 20
1
Prod
uctio
n0
00
00
00
00
3 17
93
542
244
10 9
534
057
3 02
0
Port
ugal
Con
sum
ptio
n0
00
00
00
00
2 92
30
012
692
017
1
Prod
uctio
n0
00
00
00
00
2 92
30
013
528
017
1
Rom
ania
Con
sum
ptio
n0
00
00
00
00
00
05
418
1 99
639
9
Prod
uctio
n0
00
00
00
00
00
03
939
1 45
60
Slo
vaki
aCon
sum
ptio
n0
00
00
01
299
00
1 81
554
05
866
1 33
90
Prod
uctio
n0
00
00
01
496
00
1 77
40
04
798
2 26
50
Slo
veni
aCon
sum
ptio
n0
00
00
00
00
740
01
302
161
0
Prod
uctio
n0
00
00
00
00
740
014
00
Spa
inCon
sum
ptio
n0
00
00
03
004
00
2 36
64
789
062
653
9 41
90
Prod
uctio
n0
00
00
03
004
00
2 36
64
789
025
492
9 84
70
Swed
enCon
sum
ptio
n0
00
00
097
510
01
818
6 04
35
511
9 04
08
469
3 64
2
Prod
uctio
n0
00
00
097
510
01
818
6 04
35
511
9 04
08
469
3 64
2
Switz
erla
ndCon
sum
ptio
n0
00
00
00
00
294
270
00
0
Prod
uctio
n0
00
00
00
00
294
270
00
0
Turk
eyCon
sum
ptio
n0
00
00
00
00
902
00
461
214
0
Prod
uctio
n0
00
00
00
00
902
00
461
214
0
Uni
ted
Kin
gdom
Con
sum
ptio
n0
00
00
00
00
5 47
02
016
030
138
13 5
100
Prod
uctio
n0
00
00
00
00
9 42
30
06
510
623
0
Sou
rce:
Eu
rost
at,
2013
.

Sou
rce:
Eu
rost
at,
2013
.
European Environment Agency
A closer look at urban transportTERM 2013: transport indicators tracking progress towards environmental targets in Europe
2013 — 106 pp. — 21 x 29.7 cm
ISBN 978-92-9213-413-6doi:10.2800/94848


HOW TO OBTAIN EU PUBLICATIONS
Free publications:• viaEUBookshop(http://bookshop.europa.eu);• attheEuropeanUnion'srepresentationsordelegations.Youcanobtaintheir
contact details on the Internet (http://ec.europa.eu) or by sending a fax to +352 2929-42758.
Priced publications:• viaEUBookshop(http://bookshop.europa.eu).
Priced subscriptions (e.g. annual series of the Official Journal of the European Union and reports of cases before the Court of Justice of the European Union):• viaoneofthesalesagentsofthePublicationsOfficeoftheEuropeanUnion
(http://publications.europa.eu/others/agents/index_en.htm).

TH-A
L-13-012-EN-C
doi:10.2800/94848
European Environment AgencyKongens Nytorv 61050 Copenhagen KDenmark
Tel.: +45 33 36 71 00Fax: +45 33 36 71 99
Web: eea.europa.euEnquiries: eea.europa.eu/enquiries