terramobilita/iqmulus urban point cloud analysis benchmark
TRANSCRIPT

HAL Id: hal-01167995https://hal.archives-ouvertes.fr/hal-01167995
Submitted on 25 Jun 2015
HAL is a multi-disciplinary open accessarchive for the deposit and dissemination of sci-entific research documents, whether they are pub-lished or not. The documents may come fromteaching and research institutions in France orabroad, or from public or private research centers.
L’archive ouverte pluridisciplinaire HAL, estdestinée au dépôt et à la diffusion de documentsscientifiques de niveau recherche, publiés ou non,émanant des établissements d’enseignement et derecherche français ou étrangers, des laboratoirespublics ou privés.
TerraMobilita/iQmulus urban point cloud analysisbenchmark
Bruno Vallet, Mathieu Brédif, Andrés Serna, Beatriz Marcotegui, NicolasPaparoditis
To cite this version:Bruno Vallet, Mathieu Brédif, Andrés Serna, Beatriz Marcotegui, Nicolas Paparoditis. TerraMo-bilita/iQmulus urban point cloud analysis benchmark. Computers and Graphics, Elsevier, 2015,Computers and Graphics, 49, pp.126-133. �10.1016/j.cag.2015.03.004�. �hal-01167995�

TerraMobilita/iQmulus Urban Point Cloud AnalysisBenchmark
Bruno Valleta,∗, Mathieu Bredifa, Andres Sernab, Beatriz Marcoteguib, NicolasPaparoditisa
aUniversite Paris-Est, IGN Recherche, SRIG, MATIS73 avenue de Paris, 94160 Saint Mande, FrancebCentre de Morphologie Mathmatique (CMM)
35 rue Saint Honor, 77305 Fontainebleau, France
Abstract
The object of the TerraMobilita/iQmulus 3D urban analysis benchmark is toevaluate the current state of the art in urban scene analysis from mobile laserscanning (MLS) at large scale. A very detailed semantic tree for urban scenesis proposed. We call analysis the capacity of a method to separate the pointsof the scene into these categories (classification), and to separate the differentobjects of the same type for object classes (detection). A very large groundtruth is produced manually in two steps using advanced editing tools developedespecially for this benchmark. Based on this ground truth, the benchmark aimsat evaluating both the classification, detection and segmentation quality of thesubmitted results.
Keywords: Benchmark, urban scene, laser scanning, mobile mapping,classification, segmentation, detection, analysis
1. Introduction
Nowadays, LiDAR technology (Light Detection And Ranging) has been pros-pering in the remote sensing community. We can find several developments suchas: Aerial Laser Scanning (ALS), useful for large scale buildings survey, roadsand forests; Terrestrial Laser Scanning (TLS), for more detailed but slower ur-ban surveys in outdoor and indoor environments; Mobile Laser Scanning (MLS),less precise than TLS but much more productive since the sensors are mountedon a vehicle; and more recently, “stop and go” systems, easily transportableTLS systems making a trade off between precision and productivity.
Since all these technologies, the amount of available 3D geographical dataand processing techniques has bloomed in recent years. Many semi-automatic
∗Corresponding authorEmail address: [email protected] (Bruno Vallet)URL: http://recherche.ign.fr/labos/matis/~vallet (Bruno Vallet)
Preprint submitted to Int. Journal of Syst. & App. in Comp. Graphics February 27, 2015

and automatic methods aiming at analysing 3D urban point clouds can be foundin the literature. It is an active research area. However, there is not a generalconsensus about the best detection, segmentation and classification methods.This choice is application dependent. An additional stake is that mobile map-ping systems produce a very large amount of data (a few TeraBytes per day),and handling such massive amounts is an additional stake for research. One ofthe main locks to research in this direction is the lack of large publicly availabledatasets and benchmarks.
This paper presents such a benchmark, along with a large dataset, that aimsat stimulating researchers from different fields such as Computer Vision, Com-puter Graphics, Geomatics and Remote Sensing, working on the common goalof processing 3D MLS data, and benchmarking segmentation and classificationmethods for this data. This will provide a ground for cross-fertilization and dis-cussions on the future challenges in this important research area. Moreover, thebenchmark focuses on processing large datasets. More information about thisbenchmark are available on the webpage: http://data.ign.fr/benchmarks/
UrbanAnalysis/index.html
In the literature, most available urban data consist in close-range, aerialand satellite images but few MLS datasets. Moreover, manual annotations andalgorithm outputs are rarely found in available 3D repositories. The annotated3D MLS datasets publicly available are:
• The Oakland 3D point cloud dataset [4]: it consists of 1.6 million pointswith only x,y,z coordinates and a label, separated in a training, validationand testing dataset.
• The RSE-RSS dataset [10] was collected from a velodyne scanner on theground with a 360 field of view. It contains 10 scans of approximately65,000 points each.
• The Paris-rue-Madame dataset [9] was produced by the StereopolisII mo-bile mapping system. The test zone contains approximatively a 160 mlong street section between rue Mzires and rue Vaugirard and consists of20 million points.
Note that these are labelled datasets (which is already very useful), not bench-marks. The only related benchmark that we are aware of is an EuroSDR bench-mark from 2012 [3] which scope was limited to facade classification and treetrunk and poles detection. The trajectory length was 1.7km and the sensorused was a FARO Photon 80 laser scanner, but the number of points is notgiven in the report.
Compared to the aforementioned datasets, our dataset is roughly between10 (Paris-rue-Madame, EuroSDR) and 100 (Oakland 3D, RSE-RSS) times larger.This represents both a challenge for the efficiency of the processing, but alsoregarding the diversity of the scene. Moreover, it has much broader objectivesthan the EuroSDR benchmark (cf Section3).
The paper is organized as follows: the dataset used in the benchmark ispresented in Section 2, the problem that participants have to solve is described
2

Figure 1: 3D View of the dataset.
in Section 3 and Section 4 explains how the ground truth was produced. Theevaluation protocol is presented in Section 5, the participants are listed in Sec-tion 6 and their results are evaluated in Section 7. Finally some conclusions aredrawn in Section 8.
2. Experimental Dataset
The dataset consists of 3D MLS data from a dense urban environment inParis (France). It has been acquired by Stereopolis II [5], a MLS system devel-oped at the French National Mapping Agency (IGN) in the framework of theiQmulus and TerraMobilita projects.
The acquisition covers approximately 10 km of streets within a square km ofthe 6th district of Paris and consists of 300 million points acquired in January2013.. Most streets are covered in this square kilometer area so the dataset isrepresentative of this part of Paris. All coordinates are geo-referenced (E,N,U)in Lambert 93 and altitude IGN1969 (grid RAF09) reference system, reflectanceis the laser intensity. An offset has been subtracted from the XY coordinateswith the aim of increasing data precision: X0 = 649000 m and Y0 = 6840000m. The accuracy on point positions relative to the vehicle is subcentimetric, sowe can expect a local noise below 1cm. The drift between the real trajectoryand the one produced by the georeferencing system is very slow (below 1mm permeter) so it can be neglected. Each vertex contains the attributes presented intable 1. The data is split into ten separate zones (each of which was annotatedby a different person) of exactly a tenth of the scan (in number of points).
In this dataset, the entire 3D point cloud is segmented and classified, i.e. eachpoint contains a label and a class (cf Section 4). Thus, point-wise evaluation ofdetection-segmentation-classification methods becomes possible. The datasetsand their processing results must be presented in PLY format with little endianencoding.
3

Type Properties Descriptionfloat32 x,y,z Measured positionfloat32 x0,y0,z0 Sensor positionfloat32 reflectance backscattered intensity
corrected for distanceuint8 num echo number of the echo (to
handle multiple echoes)uint32 id object identifier in the seg-
mentationuint32 class class label assigned to its
segmented object.
Table 1: Vertex Properties. Positions are expressed in the Lambert 93 system. Two pointshaving the same id must have the same class. Since each point of the dataset contains an idand a class, the evaluation will be carried out in a point-wise way.
3. Analysis Problem Statement
The problem addressed by this benchmark is to perform a point-wise segmen-tation and classification, which we call analysis but is also called scene parsing orcontextual classification by some authors. Each processed file, provided by eachparticipant, must be a PLY file containing the original points (in the originalorder), their original attributes and two additional attributes: id and class. Allthe 3D points belonging to the same object will have the same object identifier(id). Thus, the number of different ids in the 3D point cloud corresponds tothe number of objects. In the classification step, a category is assigned to eachsegmented object. Each class represents a semantic urban entity, as defined inthe following subsection. If two points have the same label, they must have thesame class.
Figure 2 shows an example of labels and classes on a 3D point cloud. In theleft image, note that ground, facades, pedestrians and cars are represented withdifferent colors because they are different objects and have different labels. Inthe right image, the colors represent the object classes: ground in gray, facadesin blue, cars in yellow, pedestrians in skin color, and furniture in red and cyan.
3.1. Classification Ontology
In this benchmark, a hierarchy of semantic classes has been defined. Theclass tree is downloadable as an xml file from http://data.ign.fr/benchmarks/
UrbanAnalysis/download/classes.xml and its first levels are composed as fol-lows:
Surface Surface of unbounded or very large objects
Ground Ground surface
Building All points lying on the outside surface of a building
4

Figure 2: (left) Ids. (right) Classes.
Other Surface Surface of unbounded objects that does not fit in one ofthe following categories
Object All semantic objects
Static Objects that are not made to be easily moved
Dynamic Individuals or objects that can move easily
Natural Natural objects or vegetation
Other Object Objects that do not fit in the other categories
Other Undefined points, outliers, points inside buildings...
Unclassified Not classified yet
The tree is voluntarily very detailed as we aim at producing a ground truththat can be useful to a wide range of methods. Participants can choose theclasses that they want in this tree and the evaluation will be performed accord-ingly. The Unclassified label is used to only focus the evaluation on the portionof the point cloud that has been classified only. Other X labels are scatteredthroughout the hierarchy so that the classifications may differentiate between aclassification that did not try to distinguish among the more specialized childlabels of an inner node of the classification hierarchy, and a classification thatexpresses that the relevant label is not part of the classification hierarchy.
5

3.2. Previous works
This joint segmentation/classification problem has been scarcely studied inthe litterature, where it is sometimes called scene understanding, parsing orrecognition. A major previous work [1] relies on four steps:
1. Localization: Potential objects locations are found based on point density
2. Segmentation: Objects are separated from their background.
3. Feature extration: a set of features is computed for each objects
4. Classification: each object is labelled according to its features.
Most other related work perform directly a point cloud classification, usuallyby adapting techniques from aerial lidar scanning to the terrestrial perspectiveand relying on local shape descriptors extracted from the point cloud. Section 7will compare an object based approach similar to [1] with one pure classificationapproach. An intermediate approach is proposed by [4] using Functional Max-Margin Markov Networks to perform a classification that is context aware (thusnot limited to the neighborhood analysis of each point).
4. Semi-Automatic Ground Truth Production
As soon as any form of algorithm is used to produce the Ground Truth thatwill be used to evaluate a classification result, this particular algorithm willbias the results to favour similar approaches. That is why we have aimed topropose an annotation method that is as manual as possible, thereby reduc-ing algorithmic bias, while providing an editing tool that enables an efficientsegmentation and classification of the benchmark dataset. Therefore, we haveset up a semi-automatic approach where the user has a full control over theresulting segmentation and classification.
4.1. Segmentation
Navigating and selecting through a point cloud is a counter-intuitive task,due to the absence of proper occlusion and its sparse nature. As the segmen-tation was to be performed at the point level rather than alternative represen-tations such as bounding boxes, an efficient browsing and segmentation of thepoint cloud was a key issue. We tackled this problem by proposing an interfacethat shows the point cloud in sensor space (figure 3). This was made possibleand convenient by the geometry of acquisition and the availability of its twoparameters in the raw dataset : the constant time step dtpulse between two con-secutive emitted pulse and the constant time step dtturn between each rotationof the lidar. Please note that we do not require that each turn is composed ofan integral number of pulses, which yield overall shear in figure 3. This param-eter allows to recover a regular topology out of the point cloud stream : thepulse neighbours are the immediately preceding and succeeding pulses and theclosest ones on the preceding and succeeding rotations. The recovery of such a2D topology with 4-connectivity enables the use of traditional image processingtechniques. A particularity is on its topological boundary : it is composed of
6

Figure 3: Lidar point cloud viewed in sensor-space : horizontal axis corresponds to time andvertical axis corresponds to rotation angle.
two topological circles corresponding to the pulses of the first and last rotations.This is due to the continuous sampling of the particular scanner used to acquirethis dataset : the last pulse of a rotation is connected to the first pulse of thefollowing one.
In this 2D sensor-space, it is then trivial to create, maintain a 2D segmenta-tion by providing to the user a graph edition tool : node creation and deletion,edge creation between existing nodes, poly-line input, insertion of a node bysplitting an edge... In order for this graph to define a partition of the sen-sor measurements, nodes are placed at pixel corners and edges are Manhattancurves along pixel boundaries. The user experience is improved by allowingzooming, panning, and snapping.
The only automatic task used in this editing tool applies when a user addsan edge between two nodes or when one is modified by a moving end node. Twomodes are available to rasterize a path between the two end nodes of the pathon the pixel boundaries :
Sensor-space Line This is a simple rasterization of the sensor-space line seg-ment as a Manhattan curve passing through pixel corners.
Optimal Path This mode performs an A∗ search to provide the rasterizedpath which is optimal with respect to the sum of weights of the traversedpixel boundaries. This cost is expressed in terms of the absolute differencesof the measured quantities ∆α,∆d,∆r, where α is the angle between thenormal and the vertical direction, d is the measured distance and r is the
7

Figure 4: Segmentation-inducing graph.
measured reflectance, and λ, α0, d0, r0 are empirical weights :
cost = max
(1, λ
(1−max
(∆α
α0,
∆d
d0,
∆r
r0
)))(1)
The user experience is improved by preprocessing the shortest path fromthe selected node as a background process, so that the optimal path may beupdated efficiently as the mouse moves. The user click then only validatesthe already optimized and displayed path, increasing the productivity.
4.2. Classification
As the number of objects is limited compared to the massive size of the pointcloud, assignation of class labels to an already segmented lidar point cloud isperformed by a paint-bucket-like interface : the user selects a class label froma drop-down list of available labels and then clicks on the point cloud to assignthis label to the segmented object id. The display mode may be either set tosegmentation mode that applies a random palette according to the segment idsor a classification mode where the visualization depends on the class label. Tofurther help this process, points to be rendered may be filtered base on thereclass labels.
8

5. Submission Evaluation
The proposed semantic tree is very detailed and probably no existing methodtreats the whole problem. This is why, the participants to the benchmark canchoose to analyse the scene using any subset of labels from the semantic tree,and a label ”other” to the classes they do not detect. The evaluation will beperformed accordingly and only the relevant metrics will be given.
The benchmark does not aim at ranking the participants but at providinginsights on the strengths and weaknesses of each methods. We consider thatthe quality of a method is subjective and application dependent, and the resultsof this benchmark should only help a user choosing the approach that best fitsits own specific requirements. Results will be evaluated at three levels: as aclassification, as a detection and as a segmentation. Details of the evaluationmetrics used are given in the following subsection.
5.1. Classification quality
The classification quality will be evaluated point-wise. The results of theevaluation will be a confusion matrix for each node of the tree that the evaluatedmethod handles. Rows and columns will be the subclass labels from the groundtruth and the evaluated method respectively, and matrix values are the numberof points with the corresponding labels. For easier reading, these numbers aregiven as a percentage of the total number of points. Also for binary classification(only 2 classes), only the classification accuracy will be given. The classificationaccuracy is the trace of the confusion matrix and can be simply interpreted asthe percentage of points well classified by the algorithm. All nodes from thesemantic tree have an ”other” class, so participants can classify into less classesthan what is given in the tree.
5.2. Detection quality
The detection quality work measures the capacity of the method to detectthe objects present in the scene. Thus it requires to choose a criterion to decideif an object from the ground truth is detected or not. This biases the evaluationas this choice will impact the result. The solution that we propose is to givethe evaluation result for a varying threshold m on the minimum object overlap.In this benchmark, an object is defined by the subset of points with the sameobject identifier. For a such subsets SGT of the Ground Truth and SAR of theevaluated Algorithm Result, we will validate SAR as a correct detection of SGT
(a match) iff:
|SGT ∩ SAR||SGT |
> m and|SGT ∩ SAR||SAR|
> m (2)
where | · | denotes the cardinal (number of points in our case) of a set. Notethat the intersection of a GT and AR object is a set of points with the same id
9

in both the GT and the AR. The standard precision/recall are then functionsof m:
precision(m) =number of detected objects matched
number of detected objects
recall(m) =number of detected objects matched
number of ground truth objects
Precision/Recall will be evaluated for each object types at each level of thesemantic tree that the participants have handled and results will be presentedas two curves. Precision/Recall are decreasing in m and this decay indicatesthe geometric quality of the detection (good geometry implies slower decay).
Precision/Recall does not depend on object size so it gives the same weightto small and large objects. On the opposite classification metrics are point basedso they favour large objects composed of many points on them. This is whywe give both metrics: depending on the application, one or the other might bemore appropriate.
5.3. Segmentation quality
When the threshold m is below 0.5, the criterion (2) does not guarantee thatobjects are uniquely matched. Whenm < 1/n, n objects from the Ground Truth(GT ) can be matched to a single object of the Algorithm Result (AR), or theopposite. Thus for m < 0.5 we will also give the curves of over-segmentation (1-to-n) and under-segmentation (n-to-1) by averaging n over the matches definedby (2). Note that m = 0.5 is often used, which we consider too strict as itpenalizes over-segmentation too much (an object of the GT can only match asingle object of the AR and vice versa), which was our initial motivation for avarying threshold.
The three metrics defined above also indirectly measure robustness as ourscene is very large an present major challenges (occlusions, outliers, ...) so theclassification detection and segmentation quality will be higher for a methodrobust to these problems.
5.4. Efficiency
Requiring for the participants to provide standalone executables is makesit really hard for them because research protoypes usually have manual stepswhich automation might be very time consuming, which is why we asked forthe participants to download the data and upload their results. Because of thischoice, we cannot benchmark the timings objectively (in the same conditions).Thus the timings will be given based on declarations of the participants.
6. Participants
For the moment, two participants have shown interest, but the benchmarkwill stay open at least until the end of 2016.
10

6.1. IPF - KIT
The institute of Photogrammetry and Remote Sensing (IPF) from the Karl-sruhe Institute of Technology (KIT) will participate with a method that theypresent as follows:
We propose a new methodology for large-scale urban 3D scene analysis interms of automatically assigning 3D points respective semantic labels. Themethodology focuses on simplicity and reproducibility of the involved compo-nents as well as performance in terms of accuracy and computational effort.Exploiting a variety of low-level geometric features and considering recent ad-vancements in order to improve their distinctiveness, the methodology is inprincipal designed to process point clouds with a few millions of 3D points.For analysing huge 3D point clouds with possibly billions of points for a wholecity like Paris, however, an adaptation has to be introduced. For this purpose,we propose an adaptation which is based on a tiling of the scene and thus al-lows a successive processing in reasonable time without affecting the quality ofthe classification results. We demonstrate the performance of our methodologyon two adequate, labelled 3D point cloud datasets with respect to robustness,efficiency and scalability.
The method relies on random forest classification based on a very large set offeatures, including some with automatic scale selection, and a thorough featureselection framework. For further details, the reader is encouraged to review [11].
6.2. CMM - MINES ParisTech
The Centre de Morphologie Mathematiques (CMM) from MINES ParisTechwill participate with a method that they present as follows:
Our method is based on elevation images and it uses image processing tech-niques, specially Mathematical Morphology, and machine learning techniques.Our general workflow is presented in Fig. 5 and it consists in the followingsteps: i) the 3D point cloud is projected onto an elevation image; ii) ground issegmented using the λ–flat zones labelling algorithm, curbs are segmented andtheir accessibility is analysed; iii) facades are segmented as the highest verti-cal structures in the urban scenario; iv) objects are detected as discontinuitieson the ground; v) small and isolated structures are eliminated and connectedobjects are separated using a constrained watershed; vi) objects are classifiedin several categories using a SVM approach with geometrical and contextualfeatures; and, vii) the segmented and classified images can be reprojected to the3D point cloud for visualization purposes.
For further details and complete analyses in each step, the reader is encour-aged to review [2, 6, 7, 8].
The main difference with the approach of [1] is that the ground and facadeare extracted prior to object individualization.
7. Results
The results of the benchmark were presented at the IQmulus workshop tak-ing place on July 8th, 2014 in Cardiff (UK), in conjunction with SGP’14. For
11
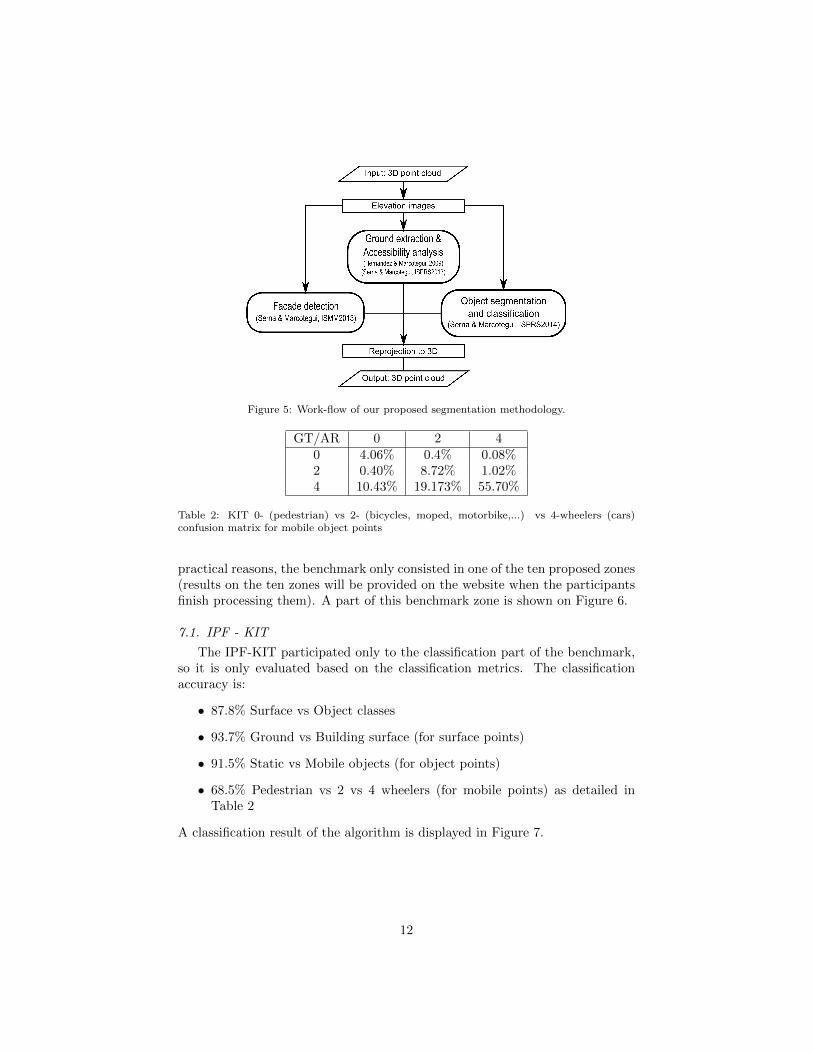
Figure 5: Work-flow of our proposed segmentation methodology.
GT/AR 0 2 40 4.06% 0.4% 0.08%2 0.40% 8.72% 1.02%4 10.43% 19.173% 55.70%
Table 2: KIT 0- (pedestrian) vs 2- (bicycles, moped, motorbike,...) vs 4-wheelers (cars)confusion matrix for mobile object points
practical reasons, the benchmark only consisted in one of the ten proposed zones(results on the ten zones will be provided on the website when the participantsfinish processing them). A part of this benchmark zone is shown on Figure 6.
7.1. IPF - KIT
The IPF-KIT participated only to the classification part of the benchmark,so it is only evaluated based on the classification metrics. The classificationaccuracy is:
• 87.8% Surface vs Object classes
• 93.7% Ground vs Building surface (for surface points)
• 91.5% Static vs Mobile objects (for object points)
• 68.5% Pedestrian vs 2 vs 4 wheelers (for mobile points) as detailed inTable 2
A classification result of the algorithm is displayed in Figure 7.
12

Figure 6: Ground truth on a part of the benchmark area. Main classes are road (dark gray),sidewalk (gray), curb (light gray), building (yellow), car (green), pedestrians (blue), 2-wheelers(cyan), punctual objects (magenta)
GT/AR Horz VertRoad 71.8% 0.68%
Sidewalk 25.7% 0.68%Curb 0.18% 0.89%
GT/AR 0 2 40 1.63% 0.00% 0.12%2 0.39% 0.65% 0.00%4 0.11% 0.03% 97.06%
Table 3: Left: CMM horizontal (road, sidewalk, islands) vs vertical (curb) confusion matrixfor ground surface points. Right: CMM 0- (pedestrian) vs 2- (bicycles, moped, motorbike,...)vs 4-wheelers (cars) confusion matrix for mobile object points
7.2. CMM - MINES ParisTech
The CMM - MINES ParisTech participated only to both the classificationand segmentation parts of the benchmark. The classification result of the algo-rithm is displayed in Figure 8. The classification accuracy is:
• 92.6% Surface vs object classes
• 98.3% Ground vs Building surface (for surface points)
• 98.4% Curb vs road/sidewalk (for ground surface points) as detailed inTable 3 (left)
• 91.8% Static vs Mobile objects (for object points).
• 99.3% Pedestrian vs 2 vs 4 wheelers (for mobile points) as detailed inTable 3 (right)
The detection quality is given by precision/recall and topologic quality (1-n= oversegmentation, m-1 = undersegmentation) in Figure 9 and 10. They are
13

Figure 7: IPF-KIT result on a part of the benchmark area.
shown as curves depending on the threshold used for matching as explained inSection 5. They show a 100% recall for sufficiently low thresholds and a preci-sion around 80% for both static and mobile objects demonstrating a tendencyto over-detection. Low thresholds induce topological errors (both under andover-segmentation). A threshold of 0.5 is a good compromise for this method(precision/recalls stay high while topological errors decrease significantly).
7.3. Discussion
It is quite obvious from the results that the CMM method outperforms theKIT method in all aspects. The explanation is quite simple: the KIT methodis a point based classification only using a local information (neighbourhoodanalysis) to make its decision. As many classes are composed of objects, aneighbourhood base method fails to classify all the objects points in the cor-rect object class. This issue is discussed in [10]. This would tend to show thatthe combined segmentation/classification problem should be solved by first seg-menting, then classifying the results. A more local classification as that of KITmight be useful as a pre-processing step to help the segmentation and the ob-ject classification, but should probably restrict to less semantised (and moregeometric) classes (plane, corner, round object, scattered). Finally, we see aninteresting common point between the CMM method and [1]: they separate thebackground (surface classes, mainly ground and faades) from the foreground(objects). This is very coherent with our semantic tree where this distinctionis the highest level one. This would tend to show that generic point cloud seg-mentation tools should be adapted to urban scenes to take this particularityinto account. It would thus be very informative to have [1] participating to ourbenchmark to find out whether it is better to perform the background separationbefore or after object localization.
14
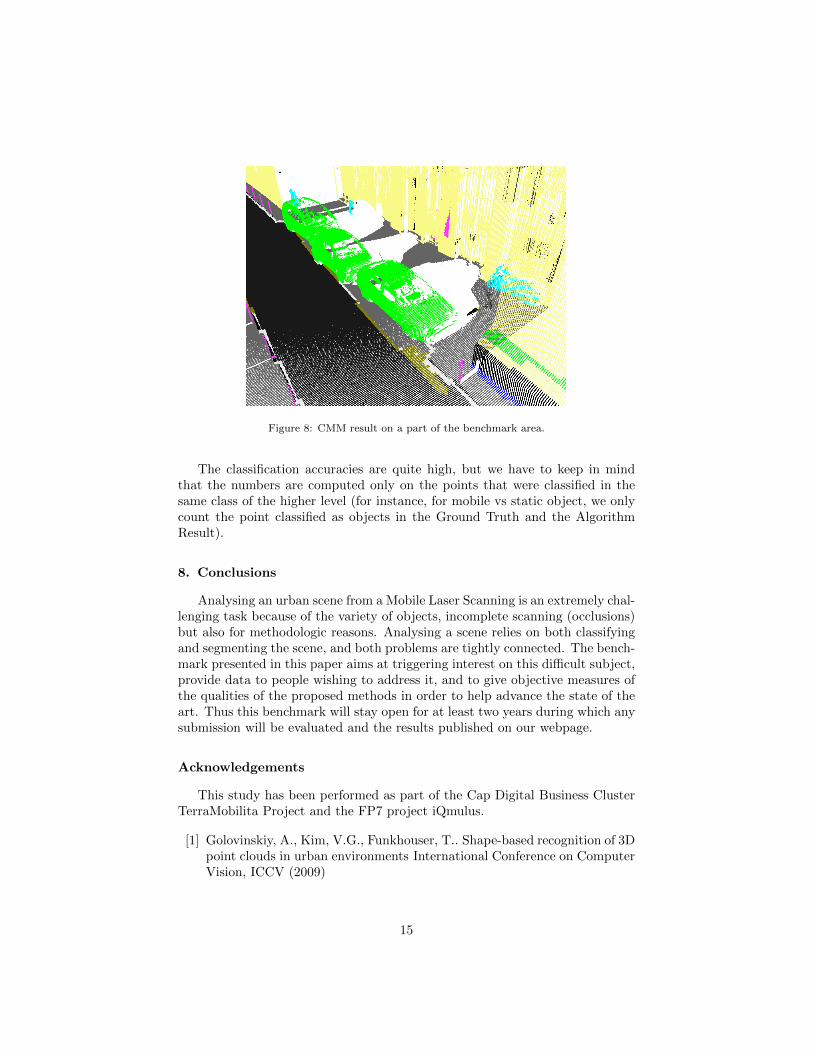
Figure 8: CMM result on a part of the benchmark area.
The classification accuracies are quite high, but we have to keep in mindthat the numbers are computed only on the points that were classified in thesame class of the higher level (for instance, for mobile vs static object, we onlycount the point classified as objects in the Ground Truth and the AlgorithmResult).
8. Conclusions
Analysing an urban scene from a Mobile Laser Scanning is an extremely chal-lenging task because of the variety of objects, incomplete scanning (occlusions)but also for methodologic reasons. Analysing a scene relies on both classifyingand segmenting the scene, and both problems are tightly connected. The bench-mark presented in this paper aims at triggering interest on this difficult subject,provide data to people wishing to address it, and to give objective measures ofthe qualities of the proposed methods in order to help advance the state of theart. Thus this benchmark will stay open for at least two years during which anysubmission will be evaluated and the results published on our webpage.
Acknowledgements
This study has been performed as part of the Cap Digital Business ClusterTerraMobilita Project and the FP7 project iQmulus.
[1] Golovinskiy, A., Kim, V.G., Funkhouser, T.. Shape-based recognition of 3Dpoint clouds in urban environments International Conference on ComputerVision, ICCV (2009)
15

Figure 9: CMM Precision/Recall (left) and topologic (right) quality for all objects.
Figure 10: CMM Precision/Recall for static (left) and mobile (right) objects.
[2] Hernandez, J., Marcotegui, B.. Filtering of artifacts and pavement seg-mentation from mobile LiDAR data. In: Bretar, F., Pierrot-Deseilligny,M., Vosselman, M.G., editors. ISPRS workshop Laser scanning ’09; vol.XXXVIII-3/W8 of The International Archives of the Photogrammetry, Re-mote Sensing and Spatial Information Sciences. Paris, France; 2009, p.329–333.
[3] Kaartinen, H., Kukko, A. , Hyypp, J., Lehtomki, M. EuroSDR bench-marking of Mobile Mapping Algorithms and Systems. EuroSDR report,2012
[4] Munoz, D., Bagnell, J. A., Vandapel, N. and Hebert, M.. Contextual Clas-sification with Functional Max-Margin Markov Networks. IEEE ComputerSociety Conference on Computer Vision and Pattern Recognition (CVPR),June, 2009.
[5] Paparoditis N., Papelard, J.-P., Cannelle, B., Devaux, A., Soheilian, B.,
16

David, N., Houzay, E. Stereopolis II: A multi-purpose and multi-sensor 3Dmobile mapping system for street visualisation and 3D metrology. RevueFranaise de Photogrammtrie et de Tldtection 200: 69-79, October 2012.
[6] Serna, A., Marcotegui, B.. Attribute controlled reconstruction andadaptive mathematical morphology. In: 11th International Symposiumon Mathematical Morphology. Uppsala, Sweden; 2013, p. 205–216.
[7] Serna, A., Marcotegui, B.. Urban accessibility diagnosis from mobile laserscanning data. ISPRS Journal of Photogrammetry and Remote Sensing2013;84:23–32.
[8] Serna, A., Marcotegui, B.. Detection, segmentation and classification of3D urban objects using mathematical morphology and supervised learning.ISPRS Journal of Photogrammetry and Remote Sensing 2014;93:243–255.
[9] Serna, A., Marcotegui, B., Goulette, F., Deschaud, J.-E. Paris-rue-Madame database: a 3D mobile laser scanner dataset for benchmarkingurban detection, segmentation and classification methods. ICPRAM 2014.http://cmm.ensmp.fr/~serna/rueMadameDataset.html
[10] Shapovalov, R., Velizhev, A. and Barinova, O. Non-associative Markovnetworks for 3D point cloud classification. The International Archives ofthe Photogrammetry, Remote Sensing and Spatial Information Sciences,Vol. XXXVIII, Part 3A, pp. 103?108, 2010.
[11] Weinmann, M., Jutzi, B., Mallet, C. Feature relevance assessment for thesemantic interpretation of 3D point cloud data. ISPRS Workshop on LaserScanning, Antalya, 2013.
17