terrorist group behavior prediction by wavelet transform...
TRANSCRIPT
Research ArticleTerrorist Group Behavior Prediction by WaveletTransform-Based Pattern Recognition
Ze Li 1 Duoyong Sun1 Bo Li 2 Zhanfeng Li1 and Aobo Li3
1College of Information System and Management National University of Defense Technology Changsha 410072 China2Xirsquoan Hi-Tech Research Institute Hongqing Town Xirsquoan 710025 China3Space Engineering University Beijing 101400 China
Correspondence should be addressed to Ze Li plalizenudteducn
Received 24 August 2017 Revised 17 December 2017 Accepted 31 December 2017 Published 28 January 2018
Academic Editor Seenith Sivasundaram
Copyright copy 2018 Ze Li et al This is an open access article distributed under the Creative Commons Attribution License whichpermits unrestricted use distribution and reproduction in any medium provided the original work is properly cited
Predicting terrorist attacks by group networks is an important but difficult issue in intelligence and security informatics Effectiveprediction of the behavior not only facilitates the understanding of the dynamics of organizational behaviors but also supportshomeland securityrsquos missions in prevention preparedness and response to terrorist acts There are certain dynamic characteristicsof terrorist groups such as periodic features and correlations between the behavior and the network In this paper we proposea comprehensive framework that combines social network analysis wavelet transform and the pattern recognition approach toinvestigate the dynamics and eventually predict the attack behavior of terrorist group Our ideas rely on social network analysis tomodel the terrorist group and extract relevant features for group behaviors Next based on wavelet transform the group networks(features) are predicted and mutually checked from two aspects Finally based on the predicted network the behavior of the groupis recognized based on the correlation between the network and behavior The Al-Qaeda data are investigated with the proposedframework to show the strength of our approaches The results show that the proposed framework is highly accurate and is ofpractical value in predicting the behavior of terrorist groups
1 Introduction
A terrorist group is fundamentally a social systemThe groupis formed as a unified whole by fanatics determined to inflictcivilian and economic damage on specific targets in pursuitof their extremist goals [1] Currently as terrorist groupsare becoming more international allied and networked thesocial systems are transforming into complex sociotechnicalsystems For a continuous active terrorist group the behavioris influenced by both the interactional environment andthe organizational mechanism and thus is a continuouslyevolving phenomenon [2]The structure and efficiency of thegroup will fluctuate and finally reach a relatively stable statebecause of its covert nature and self-defense mechanism [3]Even though it is as a complex system the terrorist groupis also dynamic The dynamics result from multiple changeprocesses such as natural evolutionary processes includinglearning birth and aging as well as intervention processessuch as altering the set of individuals who lead a group [4]
The relationships and interactions between terrorists at themicrolevel leads to continuous development of the groupbehavior at themacrolevel [5]The process in which terroristslook for and cooperate with other terrorists which has amul-titude of purposes such as propaganda training defendingor sanctuary also drives the system to change dynamicallyThus studies on terrorist group behavior are becoming com-plex dynamic system problems which require new methodsfor understanding the system behavior and dynamics
At present there is an intense interest in predicting whata terrorist group behavior will be in the future Predictingterrorist group behavior is of great importance especiallyfor attack behavior Once such behavior is predicted weare able to monitor the dynamics of the group and detectearly warning signs of the behavior change [6] We can alsohave the intervention strategy and counterterrorism policyimplemented before the attack is executed Several stud-ies on behavior prediction have been effectively employedby various researchers and research groups Studies have
HindawiDiscrete Dynamics in Nature and SocietyVolume 2018 Article ID 5676712 16 pageshttpsdoiorg10115520185676712
2 Discrete Dynamics in Nature and Society
suggested that although the predictors of terrorist behaviorare unclear there are still factors that can provide earlywarning signals of future terrorist threats [7] These studiesfocus on developing a model of the behavior of the terroristgroup and using that to predict what the group might doin the future Specifically Enders and Sandler [8] use clas-sical time-series analysis techniques to propose a thresholdautoregressive model and study both the short-run as well asthe long-run swells in world terrorist activity Raghavan et al[9] quantitatively classify the group dynamics into Active andInactive and use the Hidden Markov Model (HMM) to trackand predict the state of terrorist groups Subrahmanian et al[10] introduceTemporal Probabilistic (TP) rules andmachineleaning techniques to predict terrorist behaviors and majorterror attacks by a Pakistani-backed terrorist group Lashkar-e-Taiba Furthermore these researchers develop a StochasticTemporal Analysis of Terrorist Events (STATE) system basedon the IP rule-mining engine for predicting terrorist attacksby Indian Mujahideen [11] Najgebauer et al [12] propose anearly warning system of semantic network analysis that isbased on an ontology data model to predict terrorist actionpreparation activities Xue et al [13] propose a predictionalgorithm based on context subspace (PBCS) of terroristattacks The proposed algorithm first extracts the contextsubspace according to the association between the contextattributes and the behavior attributes then it predicts theterrorist behavior based on the extracted context subspaceTutun et al [14] propose an ESALLOR model to select keyfeatures for similarity function anduse the similarity functionto understand how terrorist groups will attack in the future
Several of the studies focus on modeling the intraorga-nizational relationships into networks and applying socialnetwork analysis (SNA) to predict the group behavior Dis-covering suspicious and illicit behavior in social networkshas become a significant problem in SNA [15] These studiesfocus on the correlation between external behavior and theinternal network [16] Correlation-based SNA studies arenow being extended to more comprehensive frameworkswith other techniques offering ever-increasing power toidentify characteristic patterns of terrorist group in organi-zational behaviors [17] Social networks that knit terroristsand constitute terrorist groups are a resource for analysissystem emergence produced by the individual interactionsThere is growing evidence that strengthening of the terroristsrsquoconnection may lead to some of the attack behaviors andthus it is much easier to predict the group behavior bypredicting the networks [18 19] Specifically Carley [4] usesdynamic network analysis (DNA) to predict the dynamicrelations among various entities such as actors events andresources and the impact of such dynamics on individualand group behavior Mcdaniel and Schaefer [20] design anapproach based on SNA and activity analysis to detect andpredict anomalous terrorist activities Clauset and Gleditsch[21] use group-level dynamic analysis and a simulationmodel to make quantitative predictions of the frequencyand severity of the group attacks by taking the correlationwith organization size Desmarais and Cranmer [22] inte-grate a deterministic similarity-based and link predictionframework into a probabilistic modeling approach and show
its ability to accurately forecast during a terrorist campaignand the onset of terrorist hostilities between a source and atargetMcCulloh andCarley [6] applymultiagents to simulatethe group dynamics in the social network and predict thepotential terrorist events
Related work has yielded important insights into howthe behavior of a terrorist group is predicted with differentmodels First it has been established that SNA is a powerfultool capable of providing a predictive and explanatory valueto the field of terrorism studies [23] Second time-seriesanalysis can be used to predict the future behavior suchas autoregression and the Markov model Some possibleterrorist activities in the future could be tracked by analyzingthe characteristics of previous events [24]Third themachineleaning and pattern recognition approach can be used topredict the future behavior once the useful features areextracted [10 11] However previous studies have also leftblind spots First these studies have relatively low accuracyand efficiency in predicting the future behavior of terroristgroup In terms of common properties of the system terroristbehavior falls somewhere between the purely chaotic and thefully deterministic realmswhich is represented as a nonlineardynamical system characterized by a low-order chaoticattractor [25] As terrorist behavior is in a nonlinear and non-stationary dynamic process traditional analysis approachessuch as traditional SNA link analysis and autoregressiveanalysis are limited in their ability to handle the dynamicdata that are needed to characterize terrorist networks [4]while several methods such as agent based simulation havedeficiencies in setting parameter values which produce highfalse positives or incorrect predictions [24]The reason lies inthe complex mechanism of terrorism terrorism has multiplepolitical cultural economic and social facets as well asindividual psychological and ideological dimensions [26] Onthe other hand previous studies are not designed particularlyfor terrorist groups Several of the specific features of theterrorist activities such as periodicity which terrorist groupbehavior has are not taken into consideration Consequentlyresearch that goes beyond traditional methods and considersthe dynamic characteristics of terrorist behavior needs to beimproved
Inspired by previous studies we integrate SNA wavelettransform and pattern recognition approaches into a com-prehensive framework We approach the problem of predict-ing terrorist behavior from a network analytic perspectivewith the supposition that the internal structure of the groupnetwork may be a good predictor of its external behaviorWe use the wavelet transform framework as the time-seriespredictor for grouprsquos dynamic network from two aspectsqualitative inference and quantitative prediction After thegroup network is predicted a supervised classification andpattern recognition technique Support Vector Machines(SVM) is used to recognize the attack behavior based on thecorrelation between the network and behavior
The remainder of the paper is organized as follows In Sec-tion 2 we provide a brief description of the problem charac-teristics In Section 3 the research framework is introducedIn Section 4 the wavelet transform-based prediction methodis demonstrated in detail In Section 5 we introduce the
Discrete Dynamics in Nature and Society 3
experimental design In Section 6 the Al-Qaeda group dataare described and the results are presented with the implica-tions discussed Section 7 presents the paperrsquos conclusions
2 Problem Characteristics
Different from general social groups operation-orientedterrorist groups have some specific characteristics Onlywith thorough understanding of the characteristics can weeffectively predict its behavior In this section we analyzethe dynamic characteristics of the terrorist group from twoaspects the periodic features of the group and the correlationbetween the behavior and the network
21 Periodic Features A recent discovery in terrorism studieshas highlighted that terror activities have some regulari-ties such as periodicity [27] and tendency [28] Moreoverterrorist behavior has multiple time-scale characteristics inthe nonlinear and nonstationary time series [29] Theseregularities are results of both internal interactions and theexternal environment of the social system and are also acritical property of terrorist behavior
Intuitively terroristsrsquo communication patterns maychange in cycles over time [6] Terrorists tend to interact andcommunicate frequently with each other during the attackor at a certain time before the attack during the planningphase [30] Terrorists and the government are in a largercomplex social system They have interactive rational choicewhere adversaries (terrorists and governments) must takeactions to anticipate the responses of each other [31] Toprepare for an attack there are several steps that terroristgroups take carefully towards the ultimate operation suchas recruiting training and looking for financial supportDuring these processes terrorists are facing interventionfrom the government However the intervention repeats andoscillates cyclically as the focus of the government goes upand down As terrorists will trade off risk and return whenchoosing their targets [31] thus the strategies of terroristgroup shift dynamically to avoid being eliminated [27]On the other hand terrorist groups are deeply covert andtheir scale usually oscillates gradually and periodically onlarge time-scales (years or decades) As both the scale of theterrorist group and the group behavior are periodic featuresit becomes easier to predict the future trends of the networkonce the periodic features are obtained
Although terror activities often appear irrational studiesdemonstrate that rational choice explanations are neverthe-less useful for understanding the phenomenon of periodicity[32] Crenshaw [33] characterizes terrorist violence as ldquoanexpression of political strategyrdquo and Sandler and Arce [34]suggest that the predictable responses of terrorist groups tochanges in sanctions and rewards aimed at constraining theirbehavior are strong evidence for their rationality Howeverthe regularity and rationality are overlooked by researcherswhen predicting their future behavior and the correspondingmethods remain rare in terrorism studies
22 Correlation between the Network and Behavior Theinternal structure and interactions among terrorists within
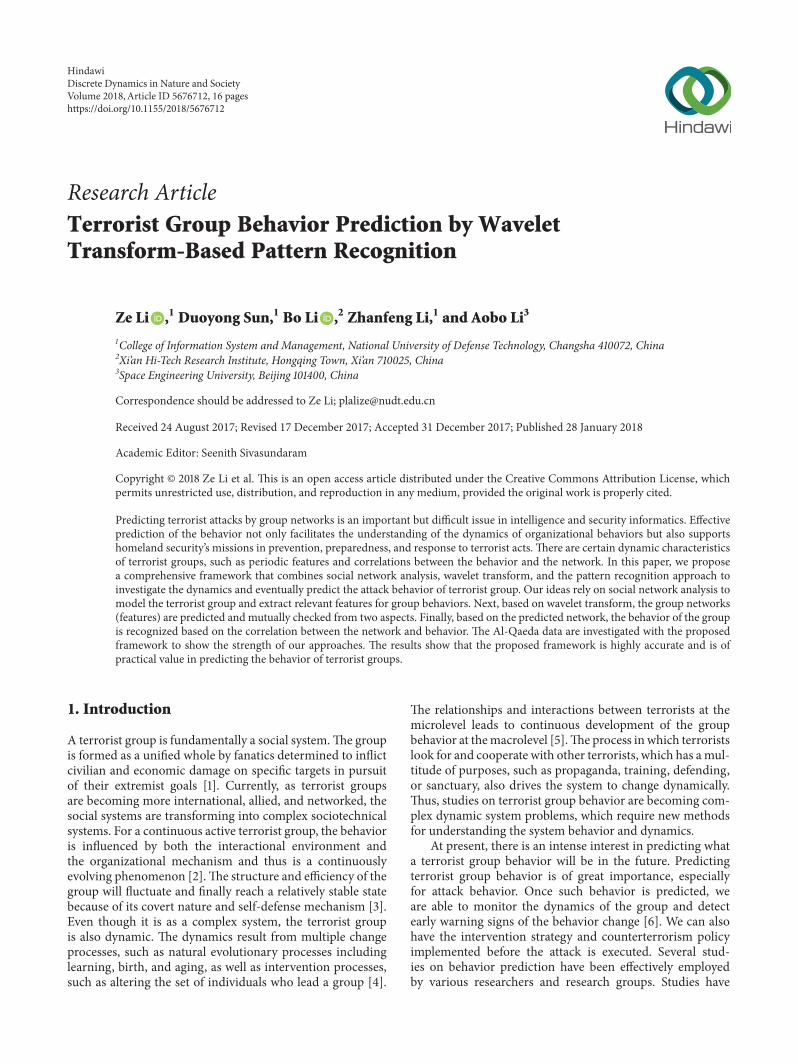
the group drive the behavior to change dynamically Thesocial network can model the internal interactive patternof elements within the social system Previous studies haveproven that there exists a correlation between group behaviorand the network [6 35] From the system dynamics perspec-tive issues within the system can lead to the dynamics ofthe behavior From the dynamic network analysis perspectiveadding and dropping of nodes andor relations of the networkwill have positive and negative influences on the group andthe overarching goals [36] In otherwords the groupbehavioris driven by the interactive evolution of terrorists in thenetwork and the social network model as the group structurereacts to the interactive patterns in the system In this paperwe are not concernedwith all of the behaviors but rather onlybehaviors that are highly related to terrorist events whichare regarded as attack behavior Attack behavior is definedas one kind of terrorist behavior that occurs when the groupexecutes a terrorist attack For example the terrorist attackin the United States on September 11 2001 is regarded as anattack behavior of the Al-Qaeda terrorist group Otherwisethe behavior is regarded as normal behavior A correlationbetween the network and behavior exists therefore thestructures of corresponding networks are different Figure 1gives the description of the correlation From the figurea grouprsquos network with abnormal connections may lead toan attack behavior of the group providing evidence forthe ldquocorrelationrdquo From the perspective of system dynamicsthe behavior of the system is predicted by referencing theinteractive patterns of the elements within the system Afterthe internal structure is predicted we can then translate theminto external behavior with the pattern recognition mecha-nism As we use pattern recognition to identify the attackbehavior then a group has an attack behavior if its feature setmatches the abnormal pattern Consequently the predictionproblem is transformed into a pattern classification problemwith two classes of results
3 Research Framework
Based on the characteristics of the problem in this sectionwe design a behavior prediction framework as depicted inFigure 2The framework tightly integrates group network andgroup behavior with respect to both the network predictionand behavior recognition dimensions We are not predictingthe group behavior directly but rather predicting the groupbehavior through the group network By extracting behavior-related features (a measure set) from the group network andefficiently predicting the group network we can recognize thefuture behavior of the group
There are two logic flows in the framework the behaviorrecognition flow and the network predicting flowThe behav-ior recognition flow is designed to mine the behavior patternof the group which is based on the correlation between thegroup network (GN) and group behavior (GB) as mentionedin Section 22 We are convinced of the importance ofmeasuring the structural properties of evolving networks tocharacterize how the behavior patterns of the investigatedgroup change over time Therefore the behavior prediction
4 Discrete Dynamics in Nature and Society
Socialnetworklayer
Grouplayer
Regular behavior
Regular behavior
Attack behavior
Featurelayer
Behaviorlayer
Ms2Ms1 Ms3
t1 t2t3
Figure 1 Descriptive figure of correlation between the network and behavior of a terrorist group
Wavelet transform
WNN
Periodic analysis
Qualitativeinference
Quantitativeprediction
Terrorist group characterization
Wavelet transform-based prediction
Terrorist group
Groupbehavior(GB)
Groupnetwork(GN)
Measureset(MS)
Mutualcheck
Predicted MS
Attack Behavior
Normal Behavior
Abnormal GN
NormalGN
NormalMS
Abnormal MS
SVM
Predicting data
Future behavior recognition
Trainingdata
Attack behavior
Normal behavior
Time
Attack behavior
The behavior recognition flow
The network predicting flow
Predicted GB
Feature extraction
Tk+1Tk+2 Tk+n
Figure 2 Framework of predicting attack behavior of a terrorist group through the group network
problem is transformed into a behavior pattern recognitionproblem on the basis of effective network predictions Asshown in Figure 2 we propose two classes of behaviorpatterns of terrorist group Attack behavior and Normalbehavior Thus the behavior recognition problem can beregarded as a pattern classification problem In this paperthe extracted features of the group network are represented
by a measure set (MS) Each measure presents a specifictopological feature of the network and highly influences thedynamics of processes executed on the network [12] Networkmeasures are therefore essential in our investigation As isshown in Figure 2 the measure set is also classified into twoclasses Abnormal and Normal Here as there is a consistentone-to-one match between each class of the measure set and
Discrete Dynamics in Nature and Society 5
each pattern of behavior then we can detect whether a grouphas an Attack behavior by matching its measure set to thepatterns
We intend to classify the group behavior through thenetwork measures Our objective is to develop a detectionmodel
119891 MS 997891997888rarr GB = 119891 (MS) (1)
Suppose there are a total of 119879 timestamps included inthe time-series dataset of the terrorist group MS119895GB119895 |119895 = 1 2 119879 where MS119895 denotes the extracted featuresassociated with the 119895th network For timestamp 119895 themeasure set can be represented as MS119895 = [1198981119895 1198982119895 119898119902119895 ]119879where 119898119894119895 119894 isin [1 119902] denotes the 119894th measure in the set and 119902denotes the total number of extracted measures GB119895 isin 0 1denotes the behavior pattern of the terrorist groupThe groupbehavior pattern is also known as the classification label suchthat GB119895 = 1 if and only if the group is determined as havingan Attack behavior In the simplest example of behaviorpattern recognition the grouprsquos behavior is recognized withthe states reflecting a normal pattern of behavior (GB119895 =0) and an abnormal pattern of behavior (GB119895 = 1) Inthis paper we use the supervised classification and patternrecognitionmethod SVM as119891(sdot) due to its superior detectionaccuracy computing efficiency and modeling flexibility [37]119891(sdot) is used to assign classification labels (01) for the behaviorpattern of the group and equivalently
119891 (MS) = 1 Attack behavior
0 Normal behavior(2)
In summary the behavior pattern recognition problemcan be expressed as follows
Input Time sequence of extracted measure set MS of theterrorist group network
Output Set of group behaviors denoted by behavior patternset GB
Our framework for predicting behavior in group net-works via some network measures focuses on the futurebehaviors of the terrorist group We are not recognizingthe current nor historical behavior but rather efficientlyidentifying how the group will behave in the future Tothis end we will introduce the network predicting flowin the next section As mentioned in Section 21 there issome regularities in the terrorist group dynamic process Webelieve that the group networks exhibit periodicity over timeand the periodic variations can be used to predict futuretrends of the group network In addition a future measureset of the network can be predicted from the current andhistorical data In this paper we design a wavelet transform-based framework to predict the networks which is discussedin detail in the following section
4 Wavelet Transform-BasedPrediction Method
The key component of the framework proposed in Section 3is to predict the group network efficiently As a complexsocial system group network prediction is quite challengingespecially for terrorist groups Usually the terrorist data arebased on open source information The limitations of theterrorist data make it a difficult prediction problem becausewe cannot be sure that all the communication and cooper-ation networks are included Therefore the best approachis not simply to predict the network from the quantitativeanalysis but to combine both the qualitative and quantitativepredictions Here we proposed an integrated method withwavelet transform for the prediction Wavelet transform hasbeen applied in the signal processing studies as well as inother time-series analyses [29 38ndash40] Here we are the firstto explore the application of wavelet transform theory tobetter understand the structural changes in terrorist groupnetworks The proposed method with wavelet transformtheory combines qualitative and quantitative predictions tocharacterize the terrorist group network in terms of itsstructural and functional features
Firstly we apply wavelet transform to obtain the periodicfeatures of the network Based on the wavelet transformthe nonlinear and nonstationary process of terrorist net-work dynamics can be decomposed into quasi-stationaryby multiscale characteristics for time-series prediction Bythe presence of multiscale decomposition the advantage isautomatically localized time-frequency by wavelet transform[29] After determining both the dominant modes of vari-ability and how those modes vary in time we have thequalitative inference of the network trend in the futureThena combination of wavelet transform and Artificial NeuralNetwork (ANN) that is Wavelet Neural Network (WNN)is used to predict the network from the quantitative aspectThe concept of time-series predicting with a wavelet is simplypredicting by using the data which are preprocessed throughthe wavelet transform Finally the predictive future networksare combined and mutually checked by both qualitativeinference and quantitative prediction
41 Periodic Analysis-Based Qualitative Inference The qual-itative inference can be implemented based on periodicityanalysis The application of wavelet theory in particularmay provide insight into the periodic behavior of networkdynamics Given the multiple time-scale characteristics ofeachmeasure large-scale periodsmay be used to characterizethe future trends while small-scale periods provide detailedcharacterizations of the measure change within the large-scale periods [33]
The wavelet transform of a time series is its convolutionthe local base functions or wavelets can be stretched andtranslated with a flexible resolution in both frequency andtime [38] Choosing a proper mother wavelet is the key towavelet transform analysisThis depends on the nature of thesignal and on the type of information to be extracted from thesignal Here the Morlet wavelet a complex nonorthogonal
6 Discrete Dynamics in Nature and Society
Input layer Hidden layer Output layer
X1
X2
Xm
wij
(w minus b1a1)
(w minus b2a2)
(w minus bhah)
wjk Y1
Y2
Yn
Figure 3 The network topology of WNN
continuous wavelet is applied to analyze inherent periodicityand to qualitatively appraise the trends of MS of the networkAs a complex wavelet transform theMorlet wavelet providesa good balance between time and frequency localization andcan provide both amplitude and phase simultaneously
TheMorlet function representing a wave modulated by aGaussian envelope is defined as [40]
120595 (119905) = 119890minus119894119888119905119890minus11990522 (3)
where 119894 is the unit of an imaginary number and 1198942 = minus1 119888 isthe constant number The Constant Wavelet Transformation(CWT) of time series 119891(119905) isin 1198712(119877) is defined as [40 41]
119882119891 (119886 119887) = minus |119886|minus12 int119877119891 (119905) 120595(119905 minus 119887119886 ) d119905 (4)
where 119882119891(119886 119887) is the wavelet transform coefficient 119891(119905) isa signal or square integrable function 120595(119905) is the motherwavelet and 120595(119905) denotes the complex conjugate function of120595(119905) 119886 is scale factor as the length of the wavelet periodand 119887 is the time factor as the translation time The variationcharacteristics and the range of the periodic changes of theselect measures at different time-scales can be analyzed basedon the isograms about119882119891(119886 119887)
In this paper we also introduce the wavelet variance andwavelet power spectrum to further identify the dominant andlocal periods The wavelet variance is defined as the integralof any wavelet coefficient of different time-scales in the timedomain The equation of wavelet variance is defined as
var (119886) = int+infinminusinfin
10038161003816100381610038161003816119882119891 (119886 119887)100381610038161003816100381610038162 d119887 (5)
The dominate time-scales of a certain time series namelythe significant periods dominating network evolution willbe verified through tests of wavelet variance The wavelet
variance change with scale factor 119886 is represented by a waveletvariance graph Each peak in the graph corresponds to asignificant period [38] The diagram of wavelet variance andwavelet power spectrum along with the isograms of thewavelet transform coefficient could be used to identify theperiodic features efficiently With the periodic features of themeasures detected their future trends can be qualitativelyinferred
42 WNN-Based Quantitative Prediction In the quantitativeprediction aspect we use WNN for time-series predictionWNNs are recently developed neural network models andhave been successfully applied to forecasting modeling andfunction approximations [42] WNN models combine thestrengths of wavelet transform and ANNs processing toachieve strong nonlinear approximations [39] WNNs aregenerally divided into the relax-type and the close-type by thedifferent wavelet-basis functions In this paper we adopt theclose-type WNN with a three-layer structure as is shown inFigure 3
The main difference between WNNs and ANNs lies inthe activation functions of the hidden layermdashas ANNs arewith tangent sigmoids whileWNNs are with discrete waveletfunctions We select WNNs rather than ANNs because theANNs have some potential disadvantages when applied tocomplex nonlinear optimization problems including slow-ness in convergence and an inability to escape local optimaFurthermore because WNNs combine the function of time-frequency localization bywavelet transformand self-studyingby ANNs the network capacity is approximate and robust[39] In this paper the WNN was designed with one hiddenlayer (Figure 3) We select Morlet as the mother waveletfunction in the node activation function as in (3)
We design a time-series prediction approach based on thehypothesis that the current value of the network measure canbe captured completely by certain attributes of the historical
Discrete Dynamics in Nature and Society 7
values [9] Let119898119894119895 = 119892(119872119894119895) and119872119894119895 = (119898119894119895minus1 119898119894119895minus2 119898119894119895minus119905)that is the values of extracted measure 119898119894 at past 119905 times-tamps 119892(119909) is our prediction function and is representedby WNN with its hidden layer of the Morlet wavelet Forthe WNN the input variable is 119872119894119895 and the output variableis 119898119894119895 Finally the predicted results are mutually checkedfrom the two aspects of qualitative inference and quantitativeprediction to obtain more reasonable results
5 Experimental Design
51 Feature Extraction In both the twoflows a key phase is toextract features from the group networks As we use networkmeasures (MS) as the features this implies the very importantquestion of how to choose the most appropriate measuresfor the given network which are directly related to thebehavior pattern and affect the prediction performance [12]The extracted measures should not only help us understandthe characteristics of the networks but also help us predictthe group behavior As the terrorist network data are usuallyof low quality we should extract multidimensional measures(a measure set) as the input variables to adequately representthe whole network As discussed in Section 42 WNNs canachieve a high accuracy with the ability to address multipleinputs and overcome the local convergence problem fornonlinear optimization problems However in the patternrecognition flow too many features involved would createthe problem of the curse of dimensionality [43]The problemincreases as the number of extracted features increases expo-nentially To alleviate this problem we can apply a featureselection phase that selects only discriminating and relevantfeatures for each class [44]
It is notably challenging to determine proper measures tocharacterize the network As the field is still in its formativestages we do not yet know which specific measures bestdifferentiate behavior patterns or change the most in thedynamic process In previous research [6 12 35] measuresare extracted subjectively by manual selection and may notbe significant characteristics of the network
In this paper we initially consider using the followingcriteria to extract measures from the time sequence Thefirst criterion is Spearmanrsquos Rank Correlation coefficientWiththis criterion measures that have top correlation coefficientswith the group behavior are extracted The second criterionis Information Entropy based selection of discriminatingmeasures [45] The Information Entropy IE(119898119894) of extractedmeasure119898119894 is expressed as follows
IE (119898119894) = minus 119867sum119896=1
119901119896 log (119901119896) (6)
where 119901119896 is the probability of a measurersquos visit into eachregion119867119896 divided uniformly from the range of theminimumand maximum values of the measure The IE(119898119894) value givesthe total information that could be obtained from 119898119894 Thelarger the entropy is themore uncertainty and complexity themeasure has With (6) the measures with larger InformationEntropy values are extracted With the above two criteria for
extractingmeasures we are then able to perform the networkprediction as well as the behavior recognition
52 Measure Prediction For the measure prediction weapply the method proposed in Section 4 to obtain theprediction results for the MS To demonstrate the superiorityof our method we compare the performance with severalmodels including ARIMA BP GABP ANFIS SVR andRBF To evaluate the prediction ability and efficiency of thedifferent methods we apply MAE and RMSE to compare thepredicted and actual values defined as
MAE = 1119873119873sum119895=1
10038161003816100381610038161003816119901119898119894119895 minus 11989811989411989510038161003816100381610038161003816
RMSE = radic 1119873119873sum119895=1
(119901119898119894119895 minus 119898119894119895)2(7)
where 119901119898119894119895 and 119898119894119895 denote the predicted and actual valuesof the extracted measure 119898119894 at timestamp 119895 119873 denotes thenumber of timestamps for the prediction and 119895 isin [1119873]For each MAE and RMSE a smaller value indicates betterprediction accuracy
53 Behavior Recognition and Risk Assessment Thepredictedresults of the extracted measures are then imported intofunctions (1) and (2) for future behavior recognition Toreduce the randomness of the analysis we run the behaviorpattern recognition with SVM many times and use the ratioof the times of Attack behavior (GB119895 = 1) by the total times(119871) to assess the future attack risk (119877119895) at timestamp 119895 definedas
119877119895 = sum119871GB119895119871 (8)
6 Results and Discussion
61 Data and Network Creation We test the proposed frame-work on the data from the JJATT database [46] JJATT isa transnational terrorism database on a selection of radicalIslamists their associates and case studies on their collectivebehavior We use the data from the Al-Qaeda attack seriesto analyze the terrorist group behaviors The Al-Qaeda dataare collected from open source However in theory the datainclude all of the information and are as complete as reliableopen source data allow These data are chosen primarilybecause Al-Qaeda is a typical terrorist group that shares rep-resentative characteristics of militant Islamist organizationsThe other reason is that Al-Qaeda data include attack datato describe the terrorist events that terrorists participated inwhich is useful for testing how relevant social relationshipsare to Attack behaviors
Al-Qaeda data in JJATT describe the members whohave directly contributed to a ldquocorerdquo network and rela-tionships that core members shared Hence the data areuseful for developing networks describing group structure
8 Discrete Dynamics in Nature and Society
Table 1 Extracted measures for Al-Qaeda Networks
Criteria Node count Component size Clustering coefficient Clique countCorrelation coefficient 0578lowast 0778lowast 0562lowast 0563lowast
Information entropy 1555 1845 1594 1915lowastSignificant at 1 level (2-tailed)
Table 2 Comparison of selected measures between networks with Normal and Attack behaviors
Measures Normal behavior Attack behavior 119901 valueMean SD Mean SD
Node count 156767 48797 204765 13419 00002Component size 12443 3117 17707 1269 87119864 minus 09Clustering coefficient 0254 0103 0365 0021 46119864 minus 05Clique count 66395 32164 97529 5501 00002and understanding the grouprsquos behavior Al-Qaeda data alsohave individual interaction information according to thetime axis which makes it possible to build the dynamicnetworks of the group The data are collected by year butin this study we further refine the data into quarters andthe networks are constructed quarterly after preprocessingThe time domain is 1989sim2003 thus the time domain isdivided into 60 timestamps (1198791ndash11987960) For each timestamp agroup network is created The networkrsquos nodes are defined asterrorists and edges are defined as relationships among theterrorists Here the edges are labeled by binary values (01)such that the value is equal to 1 if the two nodes are connectedand is equal to 0 otherwise In other words the Al-Qaedanetworks are undirected simple networks Consequently webuild a time sequence of 60 networks which are labeled withthe IDs of GN1GN2 GN6062 Results Summary
621 Feature Extraction The Attack behaviors of Al-Qaedarefer to the verified terrorist events For example the eventldquoWTC bombing in New York City USA on February 26 1993rdquo[46] is an Attack behavior of Al-Qaeda in 11987917 thereforeGB17 = 1 Under this rule the 60 timestamps (1198791ndash11987960)are assigned labels of 01 in which 17 GNs and GBs arelabeled ldquo1rdquo and the rest are labeled ldquo0rdquo Using the measureextraction criteria fromSection 51 we extract four significantmeasures of the Al-Qaeda network Node count ComponentsizeClustering coefficient andClique count Table 1 shows theperformance of the four extracted measures
Figure 4 plots the trends of the extracted features Thisfigure intuitively illustrates the sparsely connected networkswith Normal behaviors qualitatively compared to those withAttack behaviors Figure 5 plots the distributions of the fourmeasures of Attack and Normal behaviors
From Figure 5 we can find that the differences areobvious between relevant features of networks with Normaland Attack behaviors To verify that the given behaviors arecaused by the given patterns of the extracted measures wefurther apply Studentrsquos 119905-test with 95 confidence (119901 value lt005) Table 2 shows the 119901 values of the 119905-tests performed to
Node countComponent size
Clustering coefficientClique count
(a) (b) (c) (d)
0
02
04
06
08
1
Nor
mal
ized
val
ue
10 15 20 25 30 35 40 45 50 55 605Time (quarter)
Figure 4 Trends of the extracted features of Al-Qaeda networksThe four measures are normalized within [0 1] (a) (b) (c) and (d)are examples of network snapshots with IDs of GN16 GN23 GN40and GN54 while GB16 = 0 GB23 = 1 GB40 = 0 and GB54 = 1compare the measures between the groups with Normal andAttack behaviors
Unexpectedly the four measures are significantly higherin networks with Attack behaviors relative to networks withNormal behaviors (119901 value lt 005) From Figures 4 and 5 andTable 2 we can infer that when Attack behaviors happen theextracted relevant features of Al-Qaeda networks will havesome visible differences We find that the measured differ-ences between the two classes are statistically significantThisfinding provides evidence regarding the rationality of theextracted measures
622 Measure Prediction
(1) Qualitative Inference As mentioned in Section 41the qualitative inference of the extracted measures isimplemented based on wavelet transform First we need
Discrete Dynamics in Nature and Society 9
Normal behaviorAttack behavior
0
10
20
30
40
50
60
70Pr
opor
tion
()
130minus 150 160 170 180 190 200 210 220 230+140Observed value
(a) Node count
Normal behaviorAttack behavior
0
10
20
30
40
50
60
70
Prop
ortio
n (
)
11 12 13 14 15 16 17 18 19 20+10minusObserved value
(b) Component size
Normal behaviorAttack behavior
0
5
10
15
20
25
30
35
40
Prop
ortio
n (
)
022 024 026 028 03 032 034 036 038 04+02minusObserved value
(c) Clustering coefficient
Normal behaviorAttack behavior
0
10
20
30
40
50
60
70
Prop
ortio
n
40 50 60 70 80 90 100 110 120 130+30minusObserved value
(d) Clique count
Figure 5 Distributions of the select measures of Al-Qaeda network
to evaluate the presence and evolution of various peri-odicities from three aspects wavelet transform coeffi-cients (Figures 6(a)(1)ndash6(a)(4)) wavelet power spectrum(Figures 6(b)(1)ndash6(b)(4)) and wavelet variance (Figures6(c)(1)ndash6(c)(4))
We take the Node count as an example First from thehigh and low pattern of measures at different time-scalesin the time-frequency structure of the wavelet coefficientin Figure 6(a)(1) it is clear that the Node count has sig-nificant periodic features The contours in Figure 6(a)(1)provide information about the levels of the wavelet transformcoefficient with each one corresponding to a variation fordifferent time periods [38] We find that the upper contoursare sparse while the lower contours are dense which meansat the large time-scales the range of the corresponding periodis larger than that at the smaller ones Periodic changes inFigure 6(a)(1) indicate that there are multiple time-scalecharacteristics of the time series of the Node count At thetime-scale approximately 22q (quarter) there are four anda half ldquolow-highrdquo cycles from 1198791 to 11987960 This period lastsfor the entire time domain At approximately 12q there are
three ldquohigh-lowrdquo cycles only in the time domain 11987916ndash11987928and 11987953ndash11987958 At approximately 8q several ldquohigh-lowrdquo cyclesoccur only in the time domain11987923ndash11987953 Hence three are threeperiodic variations of theNode count where one of them is ina global period and the other two are in local periods
Second Figure 6(b)(1) of the wavelet power spectrumillustrates the oscillation power of the time series at differenttime-scales From this figure we find that at approximately22q the power of the time series is the strongest andthe periodic feature is the most significant The power atapproximately 12q comes in second place and its period ismedian significant followed by 8q
Third the main periods could be determined by waveletvariance using the corresponding peak values in Fig-ure 6(c)(1) From the figure we can conclude that the periodat the 22q time-scale is the first significant period (or large-scale period) as it corresponds to the highest peak denotedas 1198751 the period at the 8q time-scale is the second significantperiod denoted as 1198752 and the period at the 8q time-scale isthe third significant period denoted as 1198753 Both the 1198752 and 1198753periods are small-scale periods
10 Discrete Dynamics in Nature and Society
(a) Wavelet transform coefficient
0005
00200150010005
002
002
002
0008 0008
0008
002
002
002
minus0005
minus0005
00005001001500200250030035004004500500550060065
minus0005
minus0002000200060010014001800220026003003400380042004600500540058
000050010015002002500300350040045005005500600650070080075
000500150025003500450055006500750085
(1)
(2)
(3)
(4)
5 10 15 20 25 30Time (quarter)
35 40 45 50 55 60
30
20
10
Tim
e-sc
aleq
Tim
e-sc
aleq
Tim
e-sc
aleq
Tim
e-sc
aleq
5 10 15 20 25 30Time (quarter)
35 40 45 50 55 60
30
20
10
5 10 15 20 25 30Time (quarter)
35 40 45 50 55 60
30
20
10
5 10 15 20 25 30Time (quarter)
35 40 45 50 55 60
30
20
10
(b) Wavelet power spectrum (c) Wavelet variance
Figure 6 Time-frequency structures of wavelet transform coefficient (a) wavelet power spectrum (b) and wavelet variance (c) of the fourselect measures ((1)Node count (2) Component size (3) Clustering coefficient and (4) Clique count) The blue areas in (a) and (b) correspondto negative wavelet transform coefficients while red areas show regions with positive wavelet transform coefficients
Finally the wavelet transform coefficient curves at thethree time-scales are shown in Figure 7(a) From Figure 7(a)we find that the average time of each period of 1198751 1198752and 1198753 is 8 6 and 3 quarters respectively With the samemechanism the main periods and the average time periodof the remaining three measures can be obtained as shownin Figures 6 and 7 and Table 3
With the periodic feature captured the future trends ofthe extracted measures after 11987960 can subsequently be inferredqualitativelyThe large-scale period 1198751 in Table 3 and Figure 7is used to characterize the future trends In Figure 7 thepositive or negative wavelet coefficients reveal the high andlow values of measures in the time domain Here we alsotake Node count as an example The wavelet coefficient ofthe Node count in 11987960 is located in a low period with anupward tendency so the trend in subsequent timestampswill stay relatively low before reverting to a high period in11987964 In contrast For the 1198752 period as the correspondingwavelet coefficients in 11987960 are located in a high period with
an upward tendency before 11987961 they will then turn towarda downward tendency The 1198753 period is not considered asit only lasted for 11987923ndash11987953 Hence the Node count trend inthe subsequent four timestamps (11987961ndash11987964) will be relativelylow with weak oscillation The trends of the remaining threemeasures can also be inferred similarlyThe results are shownin Table 3
(2) Quantitative Prediction WNN is then used to predictthe future values of the four measures from the quantitativeperspective First the best architecture of WNN should beobserved For the input layer various numbers of nodes arechecked in the input layer to identify the best one As is shownin Figure 8 the number of nodes in the input layer whichleads to the lowest RMSE value is chosen as the optimal oneAs seen from this figure when the number of nodes in theinput layer of theNode count is 4WNNyields the best resultsIn other words the number of input variables inWNN for theNode count prediction is 1198721119895 = (1198981119895minus1 1198981119895minus2 1198981119895minus3 1198981119895minus4) that
Discrete Dynamics in Nature and Society 11
minus02
minus01
0
01
Wav
elet c
oeffi
cien
t
20 30 40 50 6010Time (quarter)
TS of 22qTS of 12qTS of 8q
(a) Node count
10 20 30 40 50 60Time (quarter)
minus03
minus02
minus01
0
01
02
03
Wav
elet c
oeffi
cien
t
TS of 22qTS of 12qTS of 7q
(b) Component size
minus03
minus02
minus01
0
01
02
Wav
elet c
oeffi
cien
t
20 30 40 50 6010Time (quarter)
TS of 28qTS of 16qTS of 10q
(c) Clustering coefficient
minus02
minus01
0
01
02
Wav
elet c
oeffi
cien
t
10 20 30 40 50 600Time (quarter)
TS of 8qTS of 4q
TS of 16q
(d) Clique count
Figure 7 Wavelet transform coefficients of four measures at different time-scales
Table 3 Main periods and trend inference of the four measures
Select measuresMain period time
Time-scaleaverage period time (quarter) Trend inference
1198751lowast 1198752 1198753 11987961 11987962 11987963 11987964Node count 2215 1275 85 119871 119871 119871 119871Component size 2215 1275 746 119871 119871 119871 119871Clustering coefficient 28185 1610 1063 119871 119871 119867 119867Clique count 2215 85 43 119871 119871 119871 119871119871 and119867 denote low and high trends and lowast denotes large-scale period
is the values of the past 4 timestamps are used in the time-series prediction Moreover for the hidden layer the numberof the nodes should also be appropriatemdashif the numberis too small WNN may not reflect the complex functionrelationship between input data and output value on thecontrary a large number may create such a complex networkthat might lead to an output error caused by overfitting of thetraining sample set [39] After several trials the suitable nodesin the hidden layer are set as 6Thus the architecture ofWNN
for the Node count is ldquo4-6-1rdquo Using the same method thearchitectures of Component size Clustering coefficient andClique count are also determined
Second to verify the superiority of our method we applythe baseline methods to the same data to compare the resultsWe have the data divided into training and test samples Thedata of the four measures include 60 timestamps (1198791ndash11987960)From these 40 data timestamps are used for training forall the methods and the remaining 20 data timestamps are
12 Discrete Dynamics in Nature and Society
Table 4 Comparison of prediction results of different models
Criteria Prediction modelsWNN BP ARIMA GABP ANFIS SVR RBF
MAENode count 7722 7773 9313 8407 8314 8157 8246Component size 0836 1348 1487 1189 0854 0875 1171Clustering coefficient 0019 0025 0028 0018 0033 0022 0026Clique count 4887 5066 6300 5231 6580 6012 6313
RMSENode count 10377 10187 12376 10991 12152 10198 13475Component size 1537 1733 1945 1552 1436 1385 1435Clustering coefficient 0026 0035 0038 0028 0044 0028 0030Clique count 8133 8777 7713 8294 9167 9631 9656
Node count
0
5
10
15
20
25
30
35
RMSE
2 3 4 5 6 7 8 9 101The number of input neurons
Clique countComponent size lowast 10
Clustering coefficient lowast 200
Figure 8 Dependence of RMSE on the number of neurons in theinput layer
used as the test dataset After running 100 times with WNNand baseline methods the average values of the predictionresults are obtained The MAE and RMSE of the models arepresented in Table 4We have several interesting observationswhich confirm our research motivation First the MAEs ofWNN are lower than most of those of the baseline methodsSecond some baseline methods perform somehow betterin RMSE However through a comprehensive comparisonwith the four measures we find that the WNN still performsthe best in RMSE Finally given the excellent performanceof WNN in Table 4 we are convinced that the ANN withwavelet transform (WNN) has the best fitting capacity andthe strongest capacity of time-series prediction in terroristnetworks with nonlinear and multiple time-scale character-istics
As the WNN has the best prediction performance wethen apply the WNN to quantitatively predict the measuresin the subsequent four timestampsWe run the trainedWNN100 times and the box plots in Figure 9 show the predictionresults of the four measures with WNN
Finally we have the predictive future networks mutu-ally checked by both qualitative inference and quantitativeprediction From Figure 9 we observe that the prediction
values of the four measures by WNN are consistent with thetrend we inferred qualitatively in Table 3 The actual valuesof Node count Component size Clustering coefficient andClique count in11987960 are 209 168 041 and 97 respectivelyThevalues ofNode countComponent size andClique count in thefollowing four timestamps are also located in a relatively lowposition and have weak oscillations Meanwhile the valuesof the Clustering coefficients in the following two timestampsare located in a relatively low position and then turn to ahigh position in the next two timestamps Thus we havemutually checked the predicted trends from the two aspectsof qualitative inference (Table 3) and quantitative prediction(Figure 9)
63 Behavior Pattern Recognition With the measures pre-dicted the next step is to recognize group behavior patternsand estimate the risk of attack in the future The combinedvalues of the predicted values of the extracted four measuresare imported into SVM Apply function (1) the future behav-ior of Al-Qaeda group is recognized After running 100 timesthe risk of terrorist attack in the subsequent timestamps isestimated with function (8) as is shown in Figure 10 Risklevels are categorized based on high (119877 = 08) medium (119877 =06) and general (119877 = 04) thresholds Then 11987961 and 11987964 areregarded as having high risk and larger probability of Attackbehavior of Al-Qaeda than the rest of the timestamps 11987962 isregarded as having the median risk of terrorist attack while11987963 is regarded as having a general risk of terrorist attack
64 Discussion The empirical study of the Al-Qaeda groupshows that the proposed wavelet transform-based patternrecognition framework is of high accuracy and practical valuein predicting the Attack behavior of terrorist groups
The results show that Al-Qaeda networks with Attackbehaviors have structure patterns that are different from thosewith Normal behaviors (Figures 4 and 5 and Table 2) Wecan infer that when Attack behaviors happen the extractedrelevant features of Al-Qaeda networks will have some visibledifferences For instance when the group carries out aterrorist attack the scale of interaction between memberswill increase (Figure 4) As a result the total number ofnodeswill grow and the Component size and Clique count will
Discrete Dynamics in Nature and Society 13
Time
190
195
200
205
210
215
220
225
230Pr
edic
ted
valu
e
T61 T62 T63 T64
(a) Node count
15
155
16
165
17
175
18
185
Time
Pred
icte
d va
lue
T61 T62 T63 T64
(b) Component size
Time
03
032
034
036
038
04
042
044
046
Pred
icte
d va
lue
T61 T62 T63 T64
(c) Clustering coefficient
85
90
95
100
105
110
Pred
icte
d va
lue
TimeT61 T62 T63 T64
(d) Clique count
Figure 9 Prediction results of four measures by WNN for the subsequent four timestamps
Time
059
078082092
High risk
Median risk
General risk
0
02
04
06
08
1
Prob
abili
ty o
f ter
roris
t atta
ck
T61 T62 T63 T64
Figure 10 The risk of Attack behavior of the Al-Qaeda group in thesubsequent timestamps
also increase (Figure 5 and Table 2) We can also infer thatwhenAttack behaviors happen the local information diffusesfaster and the terrorists are likely sharing information andreceiving intelligence from the communicators with a moredecentralized infrastructure In summary the frequencyand proportion of measures increase when Attack behaviorhappens These observations verify the basics of this study
that is a correlation exists between the social networks andevents of Al-Qaeda The four measures and their differencesare potentially useful for recognizing the behavior patterns ofAl-Qaeda
The results also show that measures of the Al-Qaedanetwork share similar features with some natural phenomenain periodicity and that the wavelet transform-based methodcan recognize the periodicity effectively Wavelet transformcan identify the main periods of the time series fromdifferent time-scales (Figures 6 and 7) The nonlinear andnonstationary dynamic processes of terrorist group networkmeasures are decomposed into quasi-stationary bymultiscalecharacteristics by wavelet transform Based on the periodicanalysis future trends (upward or downward trend) can beinferred from the qualitative aspect On the other handWNN can quantitatively predict the future trends basedon the wavelet transform The results show that WNN canaddress the time-series prediction problem with a strongnonlinear approximation ability after being well trained withhistorical data (Table 4 and Figure 9)The results suggest thatwavelet transform with periodic and prediction componentsis a meaningful approach and tool in the prediction forterrorist networks The power of this kind of analysis lies inthe fact that the quantitative analysis along with qualitativeinference can provide more faithful results than empirical
14 Discrete Dynamics in Nature and Society
Table 5 Time complexities for each technique
Techniques Time complexitySocial network analysis
Node count 119874 (119899)Component size 119874 (119899)Clustering coefficient 119874 (1198992)Clique count 119874(31198993)
Wavelet transformCWT 119874 (119899)WNN 119874 (1198992)
SVM 119874 (1198993)or qualitative analysis Moreover with predicted measuresand SVM the behavior pattern recognition can provide aquantitative estimation of future risk (Figure 10) In summarywith the proposed framework we can monitor the dynamicsand further predict the Attack behavior of terrorist groupswith high accuracy and efficiency
By glancing at the framework in Figure 2 one mightinitially guess that the computational complexity would berelatively high since it involves many techniques such asSNA wavelet transform methods and SVM However thefeature extractionmeasure prediction and behavior recogni-tion phases are implemented sequentially one after the otherTo be clear the time complexities for each technique aresummarized in Table 5 [47 48] Fortunately the networksof terrorist groups have not reached the level of complexnetworks Assume there are 119898 edges and 119899 nodes The rangeof 119899 is generally between 1 and 1000 with an average sizeof 840 [49] Moreover the core networks are even smaller[50 51] with a range of nodes between 43 and 228 in ourstudy The Al-Qaeda networks are also sparse networks with119898 = 119896119899 and 119896 le 5 Thus the total complexity for predictingterrorist group behavior by our wavelet transform-basedpattern recognition is within acceptable range
The Al-Qaeda study suggests that our proposed frame-work is able to perform well even when the information isincomplete In general one challenge in terrorism studiesis that it lacks terrorist data in depth due to confidentialityand some data just do not exist In our study the Al-Qaedadata are collected from open source and inevitably they areincomplete representations of the relationships in the real-world terrorist group The limitations of the terrorist datamake it difficult to predict the behaviors because we cannotbe sure that we included all communication and cooperationnetworks However even using this dataset we are able tosystematically predict the networks and behaviors whichhighlights the value of the proposed models
7 Conclusions
The steep rise in global terror necessitates deeper scien-tific understanding of the terrorist group and its behaviorNowadays preventing terrorist attacks before they happenis extremely important in counterterrorism Governmentsneed to understand how terrorist groups behavewith terrorist
attack in the future In this paper we proposed and applieda wavelet transform-based pattern recognition framework toinvestigate the dynamics and eventually predict the Attackbehavior of terrorist group
Specifically the terrorist group is first modeled as socialnetworks and the relevant measures are extracted with theproposed criteria Second a wavelet transform-based predic-tion method is established to predict the extracted measuresNext the Attack behavior of the group is recognized bybehavior pattern recognition with SVM Empirical researchof Al-Qaeda data demonstrates that the proposed frameworkis a meaningful approach and tool in the prediction ofterrorist group behavior
In summary we make the following contributions in thispaper (1) We analyze the dynamic characteristics of theterrorist group from two aspects the periodicity of a groupnetwork and the correlation between the behavior and thenetwork (2)We design an effective wavelet transform-basedpattern recognition framework that combines SNA wavelettransform methods and the pattern recognition approachto predict the Attack behavior of the terrorist group (3) Wepropose a novel network prediction method with wavelettransform from two aspects period analysis-based qualitativeinference and WNN-based quantitative prediction To ourknowledge this may be the first study to apply the theory ofwavelet transform as associated with terrorist behaviors
In light of the results and discussion presented up tonow the proposed framework enables us to derive sev-eral conclusions (1) The terrorist networks have shownsome periodic features during the dynamic process andthe features can be used to predict the future behaviorsbased on the correlation between the network and behavior(2) The prediction framework we proposed performs wellwith the periodicity and correlation considered (3) Wavelettransform-based prediction methods can effectively predictthe networks of terrorist group from both the qualitative andquantitative aspects
In conclusion this study helps to elucidate the dynamicsof terrorist groups using a wavelet transform-based patternrecognition framework Such a framework tightly integratesthe group network and behavior with respect to both thenetwork prediction and behavior recognition dimensionsThe approach used in this study provides analysts with greateranalytical power and facilitates assessing dynamic complexand nonlinear sociotechnical systems This paper also pro-vides an effective method for predicting collective behaviorin other extreme incidents emergency and security studydomains Overall predicting terrorism is so challenging thatthe added mathematical methods are likely to enhance ourunderstanding of the dynamic characteristics of its behaviors
Conflicts of Interest
The authors declare that they have no conflicts of interest
Acknowledgments
This research is supported by the National Natural ScienceFoundation of China nos 71473263 and 71704184
Discrete Dynamics in Nature and Society 15
References
[1] M Sageman Understanding Terror Networks University ofPennsylvania Press 2004
[2] A Sliva V S Subrahmanian V Martinez and G SimarildquoCAPE Automatically predicting changes in group behaviorrdquoMathematical Methods in Counterterrorism pp 253ndash269 2009
[3] B Li D Sun R Zhu and Z Li ldquoAgent basedmodeling on orga-nizational dynamics of terrorist networkrdquoDiscrete Dynamics inNature and Society vol 2015 Article ID 237809 2015
[4] K M Carley ldquoA dynamic network approach to the assessmentof terrorist groups and the impact of alternative courses ofactionrdquo 2006 DTIC Document
[5] B Li D Sun S Guo and Z Lin ldquoAgent based simulation ofgroup emotions evolution and strategy intervention in extremeeventsrdquo Discrete Dynamics in Nature and Society vol 2014Article ID 464190 2014
[6] I McCulloh and K M Carley ldquoDetecting change in longitudi-nal social networksrdquo 2011 DTIC Document
[7] A B Krueger and J Maleckova ldquoAttitudes and action publicopinion and the occurrence of international terrorismrdquo Sciencevol 325 no 5947 pp 1534ndash1536 2009
[8] W Enders and T Sandler ldquoIs transnational terrorism becomingmore threatening A time-series investigationrdquo Journal of Con-flict Resolution vol 44 no 3 pp 307ndash332 2000
[9] V Raghavan A Galstyan and A G Tartakovsky ldquoHiddenMarkov models for the activity profile of terrorist groupsrdquo TheAnnals of Applied Statistics vol 7 no 4 pp 2402ndash2430 2013
[10] V S Subrahmanian A Mannes A Sliva J Shakarian andJ P Dickerson Computational Analysis of Terrorist GroupsLashkar-e-Taiba Springer Science and Business Media 2012
[11] V Subrahmanian AMannes A Roul and R Raghavan IndianMujahideen Computational Analysis and Public Policy SpringerScience and Business Media 2013
[12] A Najgebauer R Antkiewicz M Chmielewski and RKasprzak ldquoThe prediction of terrorist threat on the basis ofsemantic association acquisition and complex network evolu-tionrdquo Journal of Telecommunications and Information Technol-ogy pp 14ndash20 2008
[13] A Xue W Wang and M Zhang ldquoTerrorist organizationbehavior prediction algorithm based on context subspacerdquoAdvanced Data Mining and Applications pp 332ndash345 2011
[14] S Tutun M T Khasawneh and J Zhuang ldquoNew frameworkthat uses patterns and relations to understand terrorist behav-iorsrdquoExpert SystemswithApplications vol 78 pp 358ndash375 2017
[15] P V Bindu P S Thilagam and D Ahuja ldquoDiscovering sus-picious behavior in multilayer social networksrdquo Computers inHuman Behavior vol 73 pp 568ndash582 2017
[16] I A McCulloh and K M CarleyDefense Technical InformationCenter 2008
[17] Z Li D Sun R Zhu Z Lin and Y Deng ldquoDetecting event-related changes in organizational networks using optimizedneural network modelsrdquo PLoS ONE vol 12 no 11 p e01887332017
[18] D Kasthurirathna M Piraveenan and M Harre ldquoInfluence oftopology in the evolution of coordination in complex networksunder information diffusion constraintsrdquoTheEuropean PhysicalJournal B vol 87 no 1 article no 3 2014
[19] A Anzo and J Barajas-Ramirez ldquoSynchronization in complexnetworks under structural evolutionrdquo Journal of The FranklinInstitute vol 351 no 1 pp 358ndash372 2014
[20] D McDaniel and G Schaefer ldquoA data fusion approach toindications and warnings of terrorist attacksrdquo in Proceedings ofthe Next-Generation Analyst II May 2014
[21] A Clauset and K S Gleditsch ldquoThe developmental dynamicsof terrorist organizationsrdquo PLoS ONE vol 7 no 11 Article IDe48633 2012
[22] B A Desmarais and S J Cranmer ldquoForecasting the loca-tional dynamics of transnational terrorism A network analyticapproachrdquo in Proceedings of the 2011 1st European Intelligenceand Security Informatics Conference EISIC 2011 pp 171ndash177Greece September 2011
[23] S Koschade ldquoA social network analysis of Jemaah IslamiyahThe applications to counterterrorism and intelligencerdquo Studiesin Conflict and Terrorism vol 29 no 6 pp 559ndash575 2006
[24] B Zhan and R Han ldquoModel based on hidden Markov modelfor predicting terrorism accidentrdquo journal of Pla University ofScience amp Technology vol 16 no 4 pp 385ndash393 2015
[25] P V Fellman and R Wright ldquoModeling terrorist networkscomplex systems at the mid-rangerdquo httpsarxivorgabs14056989v1
[26] Editorial ldquoUnderstanding and countering terrorismrdquo NatureHuman Behaviour vol 1 p 134 2017
[27] P J Phillips ldquoThe Life Cycle of Terrorist Organisationsrdquo SocialScience Electronic Publishing vol 17 no 4 pp 369ndash385 2010
[28] W Enders G F Parise and T Sandler ldquoA A time-series analysisof transnational terrorism Trends and cyclesrdquo Defence andPeace Economics vol 3 no 4 pp 305ndash320 1992
[29] K K Minu M C Lineesh and C Jessy John ldquoWaveletneural networks for nonlinear time series analysisrdquo AppliedMathematical Sciences vol 4 no 49-52 pp 2485ndash2495 2010
[30] M A Ruiz Estrada and E Koutronas ldquoTerrorist attack assess-ment Paris November 2015 and Brussels March 2016rdquo Journalof Policy Modeling vol 38 no 3 pp 553ndash571 2016
[31] T Sandler ldquoNew frontiers of terrorism research An introduc-tionrdquo Journal of Peace Research vol 48 no 3 pp 279ndash286 2011
[32] G LaFree L Dugan M Xie and P Singh ldquoSpatial andTemporal Patterns of Terrorist Attacks by ETA 1970 to 2007rdquoJournal of Quantitative Criminology vol 28 no 1 pp 7ndash29 2012
[33] M Crenshaw ldquoThe logic of terrorism Terrorist behavior asa product of strategic choicerdquo in Proceedings of the NationalAcademy of Sciences of the United States of America vol 98 pp15056ndash15061 1998
[34] T Sandler and D G M Arce ldquoTerrorism amp game theoryrdquoSimulation amp Gaming vol 34 no 3 pp 319ndash337 2003
[35] L Peel and A Clauset Detecting change points in the large-scalestructure of evolving networks
[36] K M Carley Dynamic Network Analysis Alphascript Publish-ing 2013
[37] B Scholkopf J C Platt J Shawe-Taylor A J Smola and RC Williamson ldquoEstimating the support of a high-dimensionaldistributionrdquo Neural Computation vol 13 no 7 pp 1443ndash14712001
[38] S Gao and Q Wu ldquoPeriod analysis and trend forecast forsoil temperature in the Qinghai-Xizang Highway by wavelettransformationrdquoEnvironmental Earth Sciences vol 74 no 4 pp2883ndash2891 2015
[39] H Esen F Ozgen M Esen and A Sengur ldquoArtificial neuralnetwork and wavelet neural network approaches for modellingof a solar air heaterrdquo Expert Systems with Applications vol 36no 8 pp 11240ndash11248 2009
16 Discrete Dynamics in Nature and Society
[40] M Farge ldquoWavelet transforms and their applications to turbu-lencerdquoAnnual Review of FluidMechanics vol 24 no 1 pp 395ndash457 1992
[41] C Torrence and G P Compo ldquoA practical guide to waveletanalysisrdquoBulletin of the AmericanMeteorological Society vol 79no 1 pp 61ndash78 1998
[42] Q Zhang and A Benveniste ldquoWavelet networksrdquo IEEE Trans-actions on Neural Networks and Learning Systems vol 3 no 6pp 889ndash898 1992
[43] P Kumar P RadhaKrishna and S Bapi Raju ldquoPattern discoveryusing sequence data mining Applications and studiesrdquo PatternDiscovery Using Sequence Data Mining Applications and Stud-ies pp 1ndash273 2011
[44] N Lesh M J Zaki and M Ogihara Mining Features forSequence Classification 342ndash346
[45] S Nedeltchev and A Shaikh ldquoA new method for identificationof themain transition velocities inmultiphase reactors based oninformation entropy theoryrdquo Chemical Engineering Science vol100 pp 2ndash14 2013
[46] John Jay and ARTIS ldquoARTIS Transnational TerrorismDatabaserdquo httpdoitappsjjaycunyedujjattdataphp
[47] E Tomita A Tanaka and H Takahashi ldquoThe worst-case timecomplexity for generating all maximal cliques and computa-tional experimentsrdquoTheoretical Computer Science vol 363 no1 pp 28ndash42 2006
[48] I W Tsang J T Kwok and P-M Cheung ldquoCore vectormachines fast SVM training on very large data setsrdquo Journalof Machine Learning Research vol 6 pp 363ndash392 2005
[49] S B Blomberg K Gaibulloev and T Sandler ldquoTerrorist groupsurvival Ideology tactics and base of operationsrdquo PublicChoice vol 149 no 3 pp 441ndash463 2011
[50] R Medina and G Hepner Geospatial Analysis of DynamicTerrorist Networks Springer Netherlands 2008
[51] M L Ouellet Terrorist Networks and the Collective Crim-inal Career The Relationship between Group Structure andTrajectories [ PhDthesis] Arts amp Social Sciences School ofCriminology 2016
Hindawiwwwhindawicom Volume 2018
MathematicsJournal of
Hindawiwwwhindawicom Volume 2018
Mathematical Problems in Engineering
Applied MathematicsJournal of
Hindawiwwwhindawicom Volume 2018
Probability and StatisticsHindawiwwwhindawicom Volume 2018
Journal of
Hindawiwwwhindawicom Volume 2018
Mathematical PhysicsAdvances in
Complex AnalysisJournal of
Hindawiwwwhindawicom Volume 2018
OptimizationJournal of
Hindawiwwwhindawicom Volume 2018
Hindawiwwwhindawicom Volume 2018
Engineering Mathematics
International Journal of
Hindawiwwwhindawicom Volume 2018
Operations ResearchAdvances in
Journal of
Hindawiwwwhindawicom Volume 2018
Function SpacesAbstract and Applied AnalysisHindawiwwwhindawicom Volume 2018
International Journal of Mathematics and Mathematical Sciences
Hindawiwwwhindawicom Volume 2018
Hindawi Publishing Corporation httpwwwhindawicom Volume 2013Hindawiwwwhindawicom
The Scientific World Journal
Volume 2018
Hindawiwwwhindawicom Volume 2018Volume 2018
Numerical AnalysisNumerical AnalysisNumerical AnalysisNumerical AnalysisNumerical AnalysisNumerical AnalysisNumerical AnalysisNumerical AnalysisNumerical AnalysisNumerical AnalysisNumerical AnalysisNumerical AnalysisAdvances inAdvances in Discrete Dynamics in
Nature and SocietyHindawiwwwhindawicom Volume 2018
Hindawiwwwhindawicom
Dierential EquationsInternational Journal of
Volume 2018
Hindawiwwwhindawicom Volume 2018
Decision SciencesAdvances in
Hindawiwwwhindawicom Volume 2018
AnalysisInternational Journal of
Hindawiwwwhindawicom Volume 2018
Stochastic AnalysisInternational Journal of
Submit your manuscripts atwwwhindawicom

2 Discrete Dynamics in Nature and Society
suggested that although the predictors of terrorist behaviorare unclear there are still factors that can provide earlywarning signals of future terrorist threats [7] These studiesfocus on developing a model of the behavior of the terroristgroup and using that to predict what the group might doin the future Specifically Enders and Sandler [8] use clas-sical time-series analysis techniques to propose a thresholdautoregressive model and study both the short-run as well asthe long-run swells in world terrorist activity Raghavan et al[9] quantitatively classify the group dynamics into Active andInactive and use the Hidden Markov Model (HMM) to trackand predict the state of terrorist groups Subrahmanian et al[10] introduceTemporal Probabilistic (TP) rules andmachineleaning techniques to predict terrorist behaviors and majorterror attacks by a Pakistani-backed terrorist group Lashkar-e-Taiba Furthermore these researchers develop a StochasticTemporal Analysis of Terrorist Events (STATE) system basedon the IP rule-mining engine for predicting terrorist attacksby Indian Mujahideen [11] Najgebauer et al [12] propose anearly warning system of semantic network analysis that isbased on an ontology data model to predict terrorist actionpreparation activities Xue et al [13] propose a predictionalgorithm based on context subspace (PBCS) of terroristattacks The proposed algorithm first extracts the contextsubspace according to the association between the contextattributes and the behavior attributes then it predicts theterrorist behavior based on the extracted context subspaceTutun et al [14] propose an ESALLOR model to select keyfeatures for similarity function anduse the similarity functionto understand how terrorist groups will attack in the future
Several of the studies focus on modeling the intraorga-nizational relationships into networks and applying socialnetwork analysis (SNA) to predict the group behavior Dis-covering suspicious and illicit behavior in social networkshas become a significant problem in SNA [15] These studiesfocus on the correlation between external behavior and theinternal network [16] Correlation-based SNA studies arenow being extended to more comprehensive frameworkswith other techniques offering ever-increasing power toidentify characteristic patterns of terrorist group in organi-zational behaviors [17] Social networks that knit terroristsand constitute terrorist groups are a resource for analysissystem emergence produced by the individual interactionsThere is growing evidence that strengthening of the terroristsrsquoconnection may lead to some of the attack behaviors andthus it is much easier to predict the group behavior bypredicting the networks [18 19] Specifically Carley [4] usesdynamic network analysis (DNA) to predict the dynamicrelations among various entities such as actors events andresources and the impact of such dynamics on individualand group behavior Mcdaniel and Schaefer [20] design anapproach based on SNA and activity analysis to detect andpredict anomalous terrorist activities Clauset and Gleditsch[21] use group-level dynamic analysis and a simulationmodel to make quantitative predictions of the frequencyand severity of the group attacks by taking the correlationwith organization size Desmarais and Cranmer [22] inte-grate a deterministic similarity-based and link predictionframework into a probabilistic modeling approach and show
its ability to accurately forecast during a terrorist campaignand the onset of terrorist hostilities between a source and atargetMcCulloh andCarley [6] applymultiagents to simulatethe group dynamics in the social network and predict thepotential terrorist events
Related work has yielded important insights into howthe behavior of a terrorist group is predicted with differentmodels First it has been established that SNA is a powerfultool capable of providing a predictive and explanatory valueto the field of terrorism studies [23] Second time-seriesanalysis can be used to predict the future behavior suchas autoregression and the Markov model Some possibleterrorist activities in the future could be tracked by analyzingthe characteristics of previous events [24]Third themachineleaning and pattern recognition approach can be used topredict the future behavior once the useful features areextracted [10 11] However previous studies have also leftblind spots First these studies have relatively low accuracyand efficiency in predicting the future behavior of terroristgroup In terms of common properties of the system terroristbehavior falls somewhere between the purely chaotic and thefully deterministic realmswhich is represented as a nonlineardynamical system characterized by a low-order chaoticattractor [25] As terrorist behavior is in a nonlinear and non-stationary dynamic process traditional analysis approachessuch as traditional SNA link analysis and autoregressiveanalysis are limited in their ability to handle the dynamicdata that are needed to characterize terrorist networks [4]while several methods such as agent based simulation havedeficiencies in setting parameter values which produce highfalse positives or incorrect predictions [24]The reason lies inthe complex mechanism of terrorism terrorism has multiplepolitical cultural economic and social facets as well asindividual psychological and ideological dimensions [26] Onthe other hand previous studies are not designed particularlyfor terrorist groups Several of the specific features of theterrorist activities such as periodicity which terrorist groupbehavior has are not taken into consideration Consequentlyresearch that goes beyond traditional methods and considersthe dynamic characteristics of terrorist behavior needs to beimproved
Inspired by previous studies we integrate SNA wavelettransform and pattern recognition approaches into a com-prehensive framework We approach the problem of predict-ing terrorist behavior from a network analytic perspectivewith the supposition that the internal structure of the groupnetwork may be a good predictor of its external behaviorWe use the wavelet transform framework as the time-seriespredictor for grouprsquos dynamic network from two aspectsqualitative inference and quantitative prediction After thegroup network is predicted a supervised classification andpattern recognition technique Support Vector Machines(SVM) is used to recognize the attack behavior based on thecorrelation between the network and behavior
The remainder of the paper is organized as follows In Sec-tion 2 we provide a brief description of the problem charac-teristics In Section 3 the research framework is introducedIn Section 4 the wavelet transform-based prediction methodis demonstrated in detail In Section 5 we introduce the
Discrete Dynamics in Nature and Society 3
experimental design In Section 6 the Al-Qaeda group dataare described and the results are presented with the implica-tions discussed Section 7 presents the paperrsquos conclusions
2 Problem Characteristics
Different from general social groups operation-orientedterrorist groups have some specific characteristics Onlywith thorough understanding of the characteristics can weeffectively predict its behavior In this section we analyzethe dynamic characteristics of the terrorist group from twoaspects the periodic features of the group and the correlationbetween the behavior and the network
21 Periodic Features A recent discovery in terrorism studieshas highlighted that terror activities have some regulari-ties such as periodicity [27] and tendency [28] Moreoverterrorist behavior has multiple time-scale characteristics inthe nonlinear and nonstationary time series [29] Theseregularities are results of both internal interactions and theexternal environment of the social system and are also acritical property of terrorist behavior
Intuitively terroristsrsquo communication patterns maychange in cycles over time [6] Terrorists tend to interact andcommunicate frequently with each other during the attackor at a certain time before the attack during the planningphase [30] Terrorists and the government are in a largercomplex social system They have interactive rational choicewhere adversaries (terrorists and governments) must takeactions to anticipate the responses of each other [31] Toprepare for an attack there are several steps that terroristgroups take carefully towards the ultimate operation suchas recruiting training and looking for financial supportDuring these processes terrorists are facing interventionfrom the government However the intervention repeats andoscillates cyclically as the focus of the government goes upand down As terrorists will trade off risk and return whenchoosing their targets [31] thus the strategies of terroristgroup shift dynamically to avoid being eliminated [27]On the other hand terrorist groups are deeply covert andtheir scale usually oscillates gradually and periodically onlarge time-scales (years or decades) As both the scale of theterrorist group and the group behavior are periodic featuresit becomes easier to predict the future trends of the networkonce the periodic features are obtained
Although terror activities often appear irrational studiesdemonstrate that rational choice explanations are neverthe-less useful for understanding the phenomenon of periodicity[32] Crenshaw [33] characterizes terrorist violence as ldquoanexpression of political strategyrdquo and Sandler and Arce [34]suggest that the predictable responses of terrorist groups tochanges in sanctions and rewards aimed at constraining theirbehavior are strong evidence for their rationality Howeverthe regularity and rationality are overlooked by researcherswhen predicting their future behavior and the correspondingmethods remain rare in terrorism studies
22 Correlation between the Network and Behavior Theinternal structure and interactions among terrorists within
the group drive the behavior to change dynamically Thesocial network can model the internal interactive patternof elements within the social system Previous studies haveproven that there exists a correlation between group behaviorand the network [6 35] From the system dynamics perspec-tive issues within the system can lead to the dynamics ofthe behavior From the dynamic network analysis perspectiveadding and dropping of nodes andor relations of the networkwill have positive and negative influences on the group andthe overarching goals [36] In otherwords the groupbehavioris driven by the interactive evolution of terrorists in thenetwork and the social network model as the group structurereacts to the interactive patterns in the system In this paperwe are not concernedwith all of the behaviors but rather onlybehaviors that are highly related to terrorist events whichare regarded as attack behavior Attack behavior is definedas one kind of terrorist behavior that occurs when the groupexecutes a terrorist attack For example the terrorist attackin the United States on September 11 2001 is regarded as anattack behavior of the Al-Qaeda terrorist group Otherwisethe behavior is regarded as normal behavior A correlationbetween the network and behavior exists therefore thestructures of corresponding networks are different Figure 1gives the description of the correlation From the figurea grouprsquos network with abnormal connections may lead toan attack behavior of the group providing evidence forthe ldquocorrelationrdquo From the perspective of system dynamicsthe behavior of the system is predicted by referencing theinteractive patterns of the elements within the system Afterthe internal structure is predicted we can then translate theminto external behavior with the pattern recognition mecha-nism As we use pattern recognition to identify the attackbehavior then a group has an attack behavior if its feature setmatches the abnormal pattern Consequently the predictionproblem is transformed into a pattern classification problemwith two classes of results
3 Research Framework
Based on the characteristics of the problem in this sectionwe design a behavior prediction framework as depicted inFigure 2The framework tightly integrates group network andgroup behavior with respect to both the network predictionand behavior recognition dimensions We are not predictingthe group behavior directly but rather predicting the groupbehavior through the group network By extracting behavior-related features (a measure set) from the group network andefficiently predicting the group network we can recognize thefuture behavior of the group
There are two logic flows in the framework the behaviorrecognition flow and the network predicting flowThe behav-ior recognition flow is designed to mine the behavior patternof the group which is based on the correlation between thegroup network (GN) and group behavior (GB) as mentionedin Section 22 We are convinced of the importance ofmeasuring the structural properties of evolving networks tocharacterize how the behavior patterns of the investigatedgroup change over time Therefore the behavior prediction
4 Discrete Dynamics in Nature and Society
Socialnetworklayer
Grouplayer
Regular behavior
Regular behavior
Attack behavior
Featurelayer
Behaviorlayer
Ms2Ms1 Ms3
t1 t2t3
Figure 1 Descriptive figure of correlation between the network and behavior of a terrorist group
Wavelet transform
WNN
Periodic analysis
Qualitativeinference
Quantitativeprediction
Terrorist group characterization
Wavelet transform-based prediction
Terrorist group
Groupbehavior(GB)
Groupnetwork(GN)
Measureset(MS)
Mutualcheck
Predicted MS
Attack Behavior
Normal Behavior
Abnormal GN
NormalGN
NormalMS
Abnormal MS
SVM
Predicting data
Future behavior recognition
Trainingdata
Attack behavior
Normal behavior
Time
Attack behavior
The behavior recognition flow
The network predicting flow
Predicted GB
Feature extraction
Tk+1Tk+2 Tk+n
Figure 2 Framework of predicting attack behavior of a terrorist group through the group network
problem is transformed into a behavior pattern recognitionproblem on the basis of effective network predictions Asshown in Figure 2 we propose two classes of behaviorpatterns of terrorist group Attack behavior and Normalbehavior Thus the behavior recognition problem can beregarded as a pattern classification problem In this paperthe extracted features of the group network are represented
by a measure set (MS) Each measure presents a specifictopological feature of the network and highly influences thedynamics of processes executed on the network [12] Networkmeasures are therefore essential in our investigation As isshown in Figure 2 the measure set is also classified into twoclasses Abnormal and Normal Here as there is a consistentone-to-one match between each class of the measure set and
Discrete Dynamics in Nature and Society 5
each pattern of behavior then we can detect whether a grouphas an Attack behavior by matching its measure set to thepatterns
We intend to classify the group behavior through thenetwork measures Our objective is to develop a detectionmodel
119891 MS 997891997888rarr GB = 119891 (MS) (1)
Suppose there are a total of 119879 timestamps included inthe time-series dataset of the terrorist group MS119895GB119895 |119895 = 1 2 119879 where MS119895 denotes the extracted featuresassociated with the 119895th network For timestamp 119895 themeasure set can be represented as MS119895 = [1198981119895 1198982119895 119898119902119895 ]119879where 119898119894119895 119894 isin [1 119902] denotes the 119894th measure in the set and 119902denotes the total number of extracted measures GB119895 isin 0 1denotes the behavior pattern of the terrorist groupThe groupbehavior pattern is also known as the classification label suchthat GB119895 = 1 if and only if the group is determined as havingan Attack behavior In the simplest example of behaviorpattern recognition the grouprsquos behavior is recognized withthe states reflecting a normal pattern of behavior (GB119895 =0) and an abnormal pattern of behavior (GB119895 = 1) Inthis paper we use the supervised classification and patternrecognitionmethod SVM as119891(sdot) due to its superior detectionaccuracy computing efficiency and modeling flexibility [37]119891(sdot) is used to assign classification labels (01) for the behaviorpattern of the group and equivalently
119891 (MS) = 1 Attack behavior
0 Normal behavior(2)
In summary the behavior pattern recognition problemcan be expressed as follows
Input Time sequence of extracted measure set MS of theterrorist group network
Output Set of group behaviors denoted by behavior patternset GB
Our framework for predicting behavior in group net-works via some network measures focuses on the futurebehaviors of the terrorist group We are not recognizingthe current nor historical behavior but rather efficientlyidentifying how the group will behave in the future Tothis end we will introduce the network predicting flowin the next section As mentioned in Section 21 there issome regularities in the terrorist group dynamic process Webelieve that the group networks exhibit periodicity over timeand the periodic variations can be used to predict futuretrends of the group network In addition a future measureset of the network can be predicted from the current andhistorical data In this paper we design a wavelet transform-based framework to predict the networks which is discussedin detail in the following section
4 Wavelet Transform-BasedPrediction Method
The key component of the framework proposed in Section 3is to predict the group network efficiently As a complexsocial system group network prediction is quite challengingespecially for terrorist groups Usually the terrorist data arebased on open source information The limitations of theterrorist data make it a difficult prediction problem becausewe cannot be sure that all the communication and cooper-ation networks are included Therefore the best approachis not simply to predict the network from the quantitativeanalysis but to combine both the qualitative and quantitativepredictions Here we proposed an integrated method withwavelet transform for the prediction Wavelet transform hasbeen applied in the signal processing studies as well as inother time-series analyses [29 38ndash40] Here we are the firstto explore the application of wavelet transform theory tobetter understand the structural changes in terrorist groupnetworks The proposed method with wavelet transformtheory combines qualitative and quantitative predictions tocharacterize the terrorist group network in terms of itsstructural and functional features
Firstly we apply wavelet transform to obtain the periodicfeatures of the network Based on the wavelet transformthe nonlinear and nonstationary process of terrorist net-work dynamics can be decomposed into quasi-stationaryby multiscale characteristics for time-series prediction Bythe presence of multiscale decomposition the advantage isautomatically localized time-frequency by wavelet transform[29] After determining both the dominant modes of vari-ability and how those modes vary in time we have thequalitative inference of the network trend in the futureThena combination of wavelet transform and Artificial NeuralNetwork (ANN) that is Wavelet Neural Network (WNN)is used to predict the network from the quantitative aspectThe concept of time-series predicting with a wavelet is simplypredicting by using the data which are preprocessed throughthe wavelet transform Finally the predictive future networksare combined and mutually checked by both qualitativeinference and quantitative prediction
41 Periodic Analysis-Based Qualitative Inference The qual-itative inference can be implemented based on periodicityanalysis The application of wavelet theory in particularmay provide insight into the periodic behavior of networkdynamics Given the multiple time-scale characteristics ofeachmeasure large-scale periodsmay be used to characterizethe future trends while small-scale periods provide detailedcharacterizations of the measure change within the large-scale periods [33]
The wavelet transform of a time series is its convolutionthe local base functions or wavelets can be stretched andtranslated with a flexible resolution in both frequency andtime [38] Choosing a proper mother wavelet is the key towavelet transform analysisThis depends on the nature of thesignal and on the type of information to be extracted from thesignal Here the Morlet wavelet a complex nonorthogonal
6 Discrete Dynamics in Nature and Society
Input layer Hidden layer Output layer
X1
X2
Xm
wij
(w minus b1a1)
(w minus b2a2)
(w minus bhah)
wjk Y1
Y2
Yn
Figure 3 The network topology of WNN
continuous wavelet is applied to analyze inherent periodicityand to qualitatively appraise the trends of MS of the networkAs a complex wavelet transform theMorlet wavelet providesa good balance between time and frequency localization andcan provide both amplitude and phase simultaneously
TheMorlet function representing a wave modulated by aGaussian envelope is defined as [40]
120595 (119905) = 119890minus119894119888119905119890minus11990522 (3)
where 119894 is the unit of an imaginary number and 1198942 = minus1 119888 isthe constant number The Constant Wavelet Transformation(CWT) of time series 119891(119905) isin 1198712(119877) is defined as [40 41]
119882119891 (119886 119887) = minus |119886|minus12 int119877119891 (119905) 120595(119905 minus 119887119886 ) d119905 (4)
where 119882119891(119886 119887) is the wavelet transform coefficient 119891(119905) isa signal or square integrable function 120595(119905) is the motherwavelet and 120595(119905) denotes the complex conjugate function of120595(119905) 119886 is scale factor as the length of the wavelet periodand 119887 is the time factor as the translation time The variationcharacteristics and the range of the periodic changes of theselect measures at different time-scales can be analyzed basedon the isograms about119882119891(119886 119887)
In this paper we also introduce the wavelet variance andwavelet power spectrum to further identify the dominant andlocal periods The wavelet variance is defined as the integralof any wavelet coefficient of different time-scales in the timedomain The equation of wavelet variance is defined as
var (119886) = int+infinminusinfin
10038161003816100381610038161003816119882119891 (119886 119887)100381610038161003816100381610038162 d119887 (5)
The dominate time-scales of a certain time series namelythe significant periods dominating network evolution willbe verified through tests of wavelet variance The wavelet
variance change with scale factor 119886 is represented by a waveletvariance graph Each peak in the graph corresponds to asignificant period [38] The diagram of wavelet variance andwavelet power spectrum along with the isograms of thewavelet transform coefficient could be used to identify theperiodic features efficiently With the periodic features of themeasures detected their future trends can be qualitativelyinferred
42 WNN-Based Quantitative Prediction In the quantitativeprediction aspect we use WNN for time-series predictionWNNs are recently developed neural network models andhave been successfully applied to forecasting modeling andfunction approximations [42] WNN models combine thestrengths of wavelet transform and ANNs processing toachieve strong nonlinear approximations [39] WNNs aregenerally divided into the relax-type and the close-type by thedifferent wavelet-basis functions In this paper we adopt theclose-type WNN with a three-layer structure as is shown inFigure 3
The main difference between WNNs and ANNs lies inthe activation functions of the hidden layermdashas ANNs arewith tangent sigmoids whileWNNs are with discrete waveletfunctions We select WNNs rather than ANNs because theANNs have some potential disadvantages when applied tocomplex nonlinear optimization problems including slow-ness in convergence and an inability to escape local optimaFurthermore because WNNs combine the function of time-frequency localization bywavelet transformand self-studyingby ANNs the network capacity is approximate and robust[39] In this paper the WNN was designed with one hiddenlayer (Figure 3) We select Morlet as the mother waveletfunction in the node activation function as in (3)
We design a time-series prediction approach based on thehypothesis that the current value of the network measure canbe captured completely by certain attributes of the historical
Discrete Dynamics in Nature and Society 7
values [9] Let119898119894119895 = 119892(119872119894119895) and119872119894119895 = (119898119894119895minus1 119898119894119895minus2 119898119894119895minus119905)that is the values of extracted measure 119898119894 at past 119905 times-tamps 119892(119909) is our prediction function and is representedby WNN with its hidden layer of the Morlet wavelet Forthe WNN the input variable is 119872119894119895 and the output variableis 119898119894119895 Finally the predicted results are mutually checkedfrom the two aspects of qualitative inference and quantitativeprediction to obtain more reasonable results
5 Experimental Design
51 Feature Extraction In both the twoflows a key phase is toextract features from the group networks As we use networkmeasures (MS) as the features this implies the very importantquestion of how to choose the most appropriate measuresfor the given network which are directly related to thebehavior pattern and affect the prediction performance [12]The extracted measures should not only help us understandthe characteristics of the networks but also help us predictthe group behavior As the terrorist network data are usuallyof low quality we should extract multidimensional measures(a measure set) as the input variables to adequately representthe whole network As discussed in Section 42 WNNs canachieve a high accuracy with the ability to address multipleinputs and overcome the local convergence problem fornonlinear optimization problems However in the patternrecognition flow too many features involved would createthe problem of the curse of dimensionality [43]The problemincreases as the number of extracted features increases expo-nentially To alleviate this problem we can apply a featureselection phase that selects only discriminating and relevantfeatures for each class [44]
It is notably challenging to determine proper measures tocharacterize the network As the field is still in its formativestages we do not yet know which specific measures bestdifferentiate behavior patterns or change the most in thedynamic process In previous research [6 12 35] measuresare extracted subjectively by manual selection and may notbe significant characteristics of the network
In this paper we initially consider using the followingcriteria to extract measures from the time sequence Thefirst criterion is Spearmanrsquos Rank Correlation coefficientWiththis criterion measures that have top correlation coefficientswith the group behavior are extracted The second criterionis Information Entropy based selection of discriminatingmeasures [45] The Information Entropy IE(119898119894) of extractedmeasure119898119894 is expressed as follows
IE (119898119894) = minus 119867sum119896=1
119901119896 log (119901119896) (6)
where 119901119896 is the probability of a measurersquos visit into eachregion119867119896 divided uniformly from the range of theminimumand maximum values of the measure The IE(119898119894) value givesthe total information that could be obtained from 119898119894 Thelarger the entropy is themore uncertainty and complexity themeasure has With (6) the measures with larger InformationEntropy values are extracted With the above two criteria for
extractingmeasures we are then able to perform the networkprediction as well as the behavior recognition
52 Measure Prediction For the measure prediction weapply the method proposed in Section 4 to obtain theprediction results for the MS To demonstrate the superiorityof our method we compare the performance with severalmodels including ARIMA BP GABP ANFIS SVR andRBF To evaluate the prediction ability and efficiency of thedifferent methods we apply MAE and RMSE to compare thepredicted and actual values defined as
MAE = 1119873119873sum119895=1
10038161003816100381610038161003816119901119898119894119895 minus 11989811989411989510038161003816100381610038161003816
RMSE = radic 1119873119873sum119895=1
(119901119898119894119895 minus 119898119894119895)2(7)
where 119901119898119894119895 and 119898119894119895 denote the predicted and actual valuesof the extracted measure 119898119894 at timestamp 119895 119873 denotes thenumber of timestamps for the prediction and 119895 isin [1119873]For each MAE and RMSE a smaller value indicates betterprediction accuracy
53 Behavior Recognition and Risk Assessment Thepredictedresults of the extracted measures are then imported intofunctions (1) and (2) for future behavior recognition Toreduce the randomness of the analysis we run the behaviorpattern recognition with SVM many times and use the ratioof the times of Attack behavior (GB119895 = 1) by the total times(119871) to assess the future attack risk (119877119895) at timestamp 119895 definedas
119877119895 = sum119871GB119895119871 (8)
6 Results and Discussion
61 Data and Network Creation We test the proposed frame-work on the data from the JJATT database [46] JJATT isa transnational terrorism database on a selection of radicalIslamists their associates and case studies on their collectivebehavior We use the data from the Al-Qaeda attack seriesto analyze the terrorist group behaviors The Al-Qaeda dataare collected from open source However in theory the datainclude all of the information and are as complete as reliableopen source data allow These data are chosen primarilybecause Al-Qaeda is a typical terrorist group that shares rep-resentative characteristics of militant Islamist organizationsThe other reason is that Al-Qaeda data include attack datato describe the terrorist events that terrorists participated inwhich is useful for testing how relevant social relationshipsare to Attack behaviors
Al-Qaeda data in JJATT describe the members whohave directly contributed to a ldquocorerdquo network and rela-tionships that core members shared Hence the data areuseful for developing networks describing group structure
8 Discrete Dynamics in Nature and Society
Table 1 Extracted measures for Al-Qaeda Networks
Criteria Node count Component size Clustering coefficient Clique countCorrelation coefficient 0578lowast 0778lowast 0562lowast 0563lowast
Information entropy 1555 1845 1594 1915lowastSignificant at 1 level (2-tailed)
Table 2 Comparison of selected measures between networks with Normal and Attack behaviors
Measures Normal behavior Attack behavior 119901 valueMean SD Mean SD
Node count 156767 48797 204765 13419 00002Component size 12443 3117 17707 1269 87119864 minus 09Clustering coefficient 0254 0103 0365 0021 46119864 minus 05Clique count 66395 32164 97529 5501 00002and understanding the grouprsquos behavior Al-Qaeda data alsohave individual interaction information according to thetime axis which makes it possible to build the dynamicnetworks of the group The data are collected by year butin this study we further refine the data into quarters andthe networks are constructed quarterly after preprocessingThe time domain is 1989sim2003 thus the time domain isdivided into 60 timestamps (1198791ndash11987960) For each timestamp agroup network is created The networkrsquos nodes are defined asterrorists and edges are defined as relationships among theterrorists Here the edges are labeled by binary values (01)such that the value is equal to 1 if the two nodes are connectedand is equal to 0 otherwise In other words the Al-Qaedanetworks are undirected simple networks Consequently webuild a time sequence of 60 networks which are labeled withthe IDs of GN1GN2 GN6062 Results Summary
621 Feature Extraction The Attack behaviors of Al-Qaedarefer to the verified terrorist events For example the eventldquoWTC bombing in New York City USA on February 26 1993rdquo[46] is an Attack behavior of Al-Qaeda in 11987917 thereforeGB17 = 1 Under this rule the 60 timestamps (1198791ndash11987960)are assigned labels of 01 in which 17 GNs and GBs arelabeled ldquo1rdquo and the rest are labeled ldquo0rdquo Using the measureextraction criteria fromSection 51 we extract four significantmeasures of the Al-Qaeda network Node count ComponentsizeClustering coefficient andClique count Table 1 shows theperformance of the four extracted measures
Figure 4 plots the trends of the extracted features Thisfigure intuitively illustrates the sparsely connected networkswith Normal behaviors qualitatively compared to those withAttack behaviors Figure 5 plots the distributions of the fourmeasures of Attack and Normal behaviors
From Figure 5 we can find that the differences areobvious between relevant features of networks with Normaland Attack behaviors To verify that the given behaviors arecaused by the given patterns of the extracted measures wefurther apply Studentrsquos 119905-test with 95 confidence (119901 value lt005) Table 2 shows the 119901 values of the 119905-tests performed to
Node countComponent size
Clustering coefficientClique count
(a) (b) (c) (d)
0
02
04
06
08
1
Nor
mal
ized
val
ue
10 15 20 25 30 35 40 45 50 55 605Time (quarter)
Figure 4 Trends of the extracted features of Al-Qaeda networksThe four measures are normalized within [0 1] (a) (b) (c) and (d)are examples of network snapshots with IDs of GN16 GN23 GN40and GN54 while GB16 = 0 GB23 = 1 GB40 = 0 and GB54 = 1compare the measures between the groups with Normal andAttack behaviors
Unexpectedly the four measures are significantly higherin networks with Attack behaviors relative to networks withNormal behaviors (119901 value lt 005) From Figures 4 and 5 andTable 2 we can infer that when Attack behaviors happen theextracted relevant features of Al-Qaeda networks will havesome visible differences We find that the measured differ-ences between the two classes are statistically significantThisfinding provides evidence regarding the rationality of theextracted measures
622 Measure Prediction
(1) Qualitative Inference As mentioned in Section 41the qualitative inference of the extracted measures isimplemented based on wavelet transform First we need
Discrete Dynamics in Nature and Society 9
Normal behaviorAttack behavior
0
10
20
30
40
50
60
70Pr
opor
tion
()
130minus 150 160 170 180 190 200 210 220 230+140Observed value
(a) Node count
Normal behaviorAttack behavior
0
10
20
30
40
50
60
70
Prop
ortio
n (
)
11 12 13 14 15 16 17 18 19 20+10minusObserved value
(b) Component size
Normal behaviorAttack behavior
0
5
10
15
20
25
30
35
40
Prop
ortio
n (
)
022 024 026 028 03 032 034 036 038 04+02minusObserved value
(c) Clustering coefficient
Normal behaviorAttack behavior
0
10
20
30
40
50
60
70
Prop
ortio
n
40 50 60 70 80 90 100 110 120 130+30minusObserved value
(d) Clique count
Figure 5 Distributions of the select measures of Al-Qaeda network
to evaluate the presence and evolution of various peri-odicities from three aspects wavelet transform coeffi-cients (Figures 6(a)(1)ndash6(a)(4)) wavelet power spectrum(Figures 6(b)(1)ndash6(b)(4)) and wavelet variance (Figures6(c)(1)ndash6(c)(4))
We take the Node count as an example First from thehigh and low pattern of measures at different time-scalesin the time-frequency structure of the wavelet coefficientin Figure 6(a)(1) it is clear that the Node count has sig-nificant periodic features The contours in Figure 6(a)(1)provide information about the levels of the wavelet transformcoefficient with each one corresponding to a variation fordifferent time periods [38] We find that the upper contoursare sparse while the lower contours are dense which meansat the large time-scales the range of the corresponding periodis larger than that at the smaller ones Periodic changes inFigure 6(a)(1) indicate that there are multiple time-scalecharacteristics of the time series of the Node count At thetime-scale approximately 22q (quarter) there are four anda half ldquolow-highrdquo cycles from 1198791 to 11987960 This period lastsfor the entire time domain At approximately 12q there are
three ldquohigh-lowrdquo cycles only in the time domain 11987916ndash11987928and 11987953ndash11987958 At approximately 8q several ldquohigh-lowrdquo cyclesoccur only in the time domain11987923ndash11987953 Hence three are threeperiodic variations of theNode count where one of them is ina global period and the other two are in local periods
Second Figure 6(b)(1) of the wavelet power spectrumillustrates the oscillation power of the time series at differenttime-scales From this figure we find that at approximately22q the power of the time series is the strongest andthe periodic feature is the most significant The power atapproximately 12q comes in second place and its period ismedian significant followed by 8q
Third the main periods could be determined by waveletvariance using the corresponding peak values in Fig-ure 6(c)(1) From the figure we can conclude that the periodat the 22q time-scale is the first significant period (or large-scale period) as it corresponds to the highest peak denotedas 1198751 the period at the 8q time-scale is the second significantperiod denoted as 1198752 and the period at the 8q time-scale isthe third significant period denoted as 1198753 Both the 1198752 and 1198753periods are small-scale periods
10 Discrete Dynamics in Nature and Society
(a) Wavelet transform coefficient
0005
00200150010005
002
002
002
0008 0008
0008
002
002
002
minus0005
minus0005
00005001001500200250030035004004500500550060065
minus0005
minus0002000200060010014001800220026003003400380042004600500540058
000050010015002002500300350040045005005500600650070080075
000500150025003500450055006500750085
(1)
(2)
(3)
(4)
5 10 15 20 25 30Time (quarter)
35 40 45 50 55 60
30
20
10
Tim
e-sc
aleq
Tim
e-sc
aleq
Tim
e-sc
aleq
Tim
e-sc
aleq
5 10 15 20 25 30Time (quarter)
35 40 45 50 55 60
30
20
10
5 10 15 20 25 30Time (quarter)
35 40 45 50 55 60
30
20
10
5 10 15 20 25 30Time (quarter)
35 40 45 50 55 60
30
20
10
(b) Wavelet power spectrum (c) Wavelet variance
Figure 6 Time-frequency structures of wavelet transform coefficient (a) wavelet power spectrum (b) and wavelet variance (c) of the fourselect measures ((1)Node count (2) Component size (3) Clustering coefficient and (4) Clique count) The blue areas in (a) and (b) correspondto negative wavelet transform coefficients while red areas show regions with positive wavelet transform coefficients
Finally the wavelet transform coefficient curves at thethree time-scales are shown in Figure 7(a) From Figure 7(a)we find that the average time of each period of 1198751 1198752and 1198753 is 8 6 and 3 quarters respectively With the samemechanism the main periods and the average time periodof the remaining three measures can be obtained as shownin Figures 6 and 7 and Table 3
With the periodic feature captured the future trends ofthe extracted measures after 11987960 can subsequently be inferredqualitativelyThe large-scale period 1198751 in Table 3 and Figure 7is used to characterize the future trends In Figure 7 thepositive or negative wavelet coefficients reveal the high andlow values of measures in the time domain Here we alsotake Node count as an example The wavelet coefficient ofthe Node count in 11987960 is located in a low period with anupward tendency so the trend in subsequent timestampswill stay relatively low before reverting to a high period in11987964 In contrast For the 1198752 period as the correspondingwavelet coefficients in 11987960 are located in a high period with
an upward tendency before 11987961 they will then turn towarda downward tendency The 1198753 period is not considered asit only lasted for 11987923ndash11987953 Hence the Node count trend inthe subsequent four timestamps (11987961ndash11987964) will be relativelylow with weak oscillation The trends of the remaining threemeasures can also be inferred similarlyThe results are shownin Table 3
(2) Quantitative Prediction WNN is then used to predictthe future values of the four measures from the quantitativeperspective First the best architecture of WNN should beobserved For the input layer various numbers of nodes arechecked in the input layer to identify the best one As is shownin Figure 8 the number of nodes in the input layer whichleads to the lowest RMSE value is chosen as the optimal oneAs seen from this figure when the number of nodes in theinput layer of theNode count is 4WNNyields the best resultsIn other words the number of input variables inWNN for theNode count prediction is 1198721119895 = (1198981119895minus1 1198981119895minus2 1198981119895minus3 1198981119895minus4) that
Discrete Dynamics in Nature and Society 11
minus02
minus01
0
01
Wav
elet c
oeffi
cien
t
20 30 40 50 6010Time (quarter)
TS of 22qTS of 12qTS of 8q
(a) Node count
10 20 30 40 50 60Time (quarter)
minus03
minus02
minus01
0
01
02
03
Wav
elet c
oeffi
cien
t
TS of 22qTS of 12qTS of 7q
(b) Component size
minus03
minus02
minus01
0
01
02
Wav
elet c
oeffi
cien
t
20 30 40 50 6010Time (quarter)
TS of 28qTS of 16qTS of 10q
(c) Clustering coefficient
minus02
minus01
0
01
02
Wav
elet c
oeffi
cien
t
10 20 30 40 50 600Time (quarter)
TS of 8qTS of 4q
TS of 16q
(d) Clique count
Figure 7 Wavelet transform coefficients of four measures at different time-scales
Table 3 Main periods and trend inference of the four measures
Select measuresMain period time
Time-scaleaverage period time (quarter) Trend inference
1198751lowast 1198752 1198753 11987961 11987962 11987963 11987964Node count 2215 1275 85 119871 119871 119871 119871Component size 2215 1275 746 119871 119871 119871 119871Clustering coefficient 28185 1610 1063 119871 119871 119867 119867Clique count 2215 85 43 119871 119871 119871 119871119871 and119867 denote low and high trends and lowast denotes large-scale period
is the values of the past 4 timestamps are used in the time-series prediction Moreover for the hidden layer the numberof the nodes should also be appropriatemdashif the numberis too small WNN may not reflect the complex functionrelationship between input data and output value on thecontrary a large number may create such a complex networkthat might lead to an output error caused by overfitting of thetraining sample set [39] After several trials the suitable nodesin the hidden layer are set as 6Thus the architecture ofWNN
for the Node count is ldquo4-6-1rdquo Using the same method thearchitectures of Component size Clustering coefficient andClique count are also determined
Second to verify the superiority of our method we applythe baseline methods to the same data to compare the resultsWe have the data divided into training and test samples Thedata of the four measures include 60 timestamps (1198791ndash11987960)From these 40 data timestamps are used for training forall the methods and the remaining 20 data timestamps are
12 Discrete Dynamics in Nature and Society
Table 4 Comparison of prediction results of different models
Criteria Prediction modelsWNN BP ARIMA GABP ANFIS SVR RBF
MAENode count 7722 7773 9313 8407 8314 8157 8246Component size 0836 1348 1487 1189 0854 0875 1171Clustering coefficient 0019 0025 0028 0018 0033 0022 0026Clique count 4887 5066 6300 5231 6580 6012 6313
RMSENode count 10377 10187 12376 10991 12152 10198 13475Component size 1537 1733 1945 1552 1436 1385 1435Clustering coefficient 0026 0035 0038 0028 0044 0028 0030Clique count 8133 8777 7713 8294 9167 9631 9656
Node count
0
5
10
15
20
25
30
35
RMSE
2 3 4 5 6 7 8 9 101The number of input neurons
Clique countComponent size lowast 10
Clustering coefficient lowast 200
Figure 8 Dependence of RMSE on the number of neurons in theinput layer
used as the test dataset After running 100 times with WNNand baseline methods the average values of the predictionresults are obtained The MAE and RMSE of the models arepresented in Table 4We have several interesting observationswhich confirm our research motivation First the MAEs ofWNN are lower than most of those of the baseline methodsSecond some baseline methods perform somehow betterin RMSE However through a comprehensive comparisonwith the four measures we find that the WNN still performsthe best in RMSE Finally given the excellent performanceof WNN in Table 4 we are convinced that the ANN withwavelet transform (WNN) has the best fitting capacity andthe strongest capacity of time-series prediction in terroristnetworks with nonlinear and multiple time-scale character-istics
As the WNN has the best prediction performance wethen apply the WNN to quantitatively predict the measuresin the subsequent four timestampsWe run the trainedWNN100 times and the box plots in Figure 9 show the predictionresults of the four measures with WNN
Finally we have the predictive future networks mutu-ally checked by both qualitative inference and quantitativeprediction From Figure 9 we observe that the prediction
values of the four measures by WNN are consistent with thetrend we inferred qualitatively in Table 3 The actual valuesof Node count Component size Clustering coefficient andClique count in11987960 are 209 168 041 and 97 respectivelyThevalues ofNode countComponent size andClique count in thefollowing four timestamps are also located in a relatively lowposition and have weak oscillations Meanwhile the valuesof the Clustering coefficients in the following two timestampsare located in a relatively low position and then turn to ahigh position in the next two timestamps Thus we havemutually checked the predicted trends from the two aspectsof qualitative inference (Table 3) and quantitative prediction(Figure 9)
63 Behavior Pattern Recognition With the measures pre-dicted the next step is to recognize group behavior patternsand estimate the risk of attack in the future The combinedvalues of the predicted values of the extracted four measuresare imported into SVM Apply function (1) the future behav-ior of Al-Qaeda group is recognized After running 100 timesthe risk of terrorist attack in the subsequent timestamps isestimated with function (8) as is shown in Figure 10 Risklevels are categorized based on high (119877 = 08) medium (119877 =06) and general (119877 = 04) thresholds Then 11987961 and 11987964 areregarded as having high risk and larger probability of Attackbehavior of Al-Qaeda than the rest of the timestamps 11987962 isregarded as having the median risk of terrorist attack while11987963 is regarded as having a general risk of terrorist attack
64 Discussion The empirical study of the Al-Qaeda groupshows that the proposed wavelet transform-based patternrecognition framework is of high accuracy and practical valuein predicting the Attack behavior of terrorist groups
The results show that Al-Qaeda networks with Attackbehaviors have structure patterns that are different from thosewith Normal behaviors (Figures 4 and 5 and Table 2) Wecan infer that when Attack behaviors happen the extractedrelevant features of Al-Qaeda networks will have some visibledifferences For instance when the group carries out aterrorist attack the scale of interaction between memberswill increase (Figure 4) As a result the total number ofnodeswill grow and the Component size and Clique count will
Discrete Dynamics in Nature and Society 13
Time
190
195
200
205
210
215
220
225
230Pr
edic
ted
valu
e
T61 T62 T63 T64
(a) Node count
15
155
16
165
17
175
18
185
Time
Pred
icte
d va
lue
T61 T62 T63 T64
(b) Component size
Time
03
032
034
036
038
04
042
044
046
Pred
icte
d va
lue
T61 T62 T63 T64
(c) Clustering coefficient
85
90
95
100
105
110
Pred
icte
d va
lue
TimeT61 T62 T63 T64
(d) Clique count
Figure 9 Prediction results of four measures by WNN for the subsequent four timestamps
Time
059
078082092
High risk
Median risk
General risk
0
02
04
06
08
1
Prob
abili
ty o
f ter
roris
t atta
ck
T61 T62 T63 T64
Figure 10 The risk of Attack behavior of the Al-Qaeda group in thesubsequent timestamps
also increase (Figure 5 and Table 2) We can also infer thatwhenAttack behaviors happen the local information diffusesfaster and the terrorists are likely sharing information andreceiving intelligence from the communicators with a moredecentralized infrastructure In summary the frequencyand proportion of measures increase when Attack behaviorhappens These observations verify the basics of this study
that is a correlation exists between the social networks andevents of Al-Qaeda The four measures and their differencesare potentially useful for recognizing the behavior patterns ofAl-Qaeda
The results also show that measures of the Al-Qaedanetwork share similar features with some natural phenomenain periodicity and that the wavelet transform-based methodcan recognize the periodicity effectively Wavelet transformcan identify the main periods of the time series fromdifferent time-scales (Figures 6 and 7) The nonlinear andnonstationary dynamic processes of terrorist group networkmeasures are decomposed into quasi-stationary bymultiscalecharacteristics by wavelet transform Based on the periodicanalysis future trends (upward or downward trend) can beinferred from the qualitative aspect On the other handWNN can quantitatively predict the future trends basedon the wavelet transform The results show that WNN canaddress the time-series prediction problem with a strongnonlinear approximation ability after being well trained withhistorical data (Table 4 and Figure 9)The results suggest thatwavelet transform with periodic and prediction componentsis a meaningful approach and tool in the prediction forterrorist networks The power of this kind of analysis lies inthe fact that the quantitative analysis along with qualitativeinference can provide more faithful results than empirical
14 Discrete Dynamics in Nature and Society
Table 5 Time complexities for each technique
Techniques Time complexitySocial network analysis
Node count 119874 (119899)Component size 119874 (119899)Clustering coefficient 119874 (1198992)Clique count 119874(31198993)
Wavelet transformCWT 119874 (119899)WNN 119874 (1198992)
SVM 119874 (1198993)or qualitative analysis Moreover with predicted measuresand SVM the behavior pattern recognition can provide aquantitative estimation of future risk (Figure 10) In summarywith the proposed framework we can monitor the dynamicsand further predict the Attack behavior of terrorist groupswith high accuracy and efficiency
By glancing at the framework in Figure 2 one mightinitially guess that the computational complexity would berelatively high since it involves many techniques such asSNA wavelet transform methods and SVM However thefeature extractionmeasure prediction and behavior recogni-tion phases are implemented sequentially one after the otherTo be clear the time complexities for each technique aresummarized in Table 5 [47 48] Fortunately the networksof terrorist groups have not reached the level of complexnetworks Assume there are 119898 edges and 119899 nodes The rangeof 119899 is generally between 1 and 1000 with an average sizeof 840 [49] Moreover the core networks are even smaller[50 51] with a range of nodes between 43 and 228 in ourstudy The Al-Qaeda networks are also sparse networks with119898 = 119896119899 and 119896 le 5 Thus the total complexity for predictingterrorist group behavior by our wavelet transform-basedpattern recognition is within acceptable range
The Al-Qaeda study suggests that our proposed frame-work is able to perform well even when the information isincomplete In general one challenge in terrorism studiesis that it lacks terrorist data in depth due to confidentialityand some data just do not exist In our study the Al-Qaedadata are collected from open source and inevitably they areincomplete representations of the relationships in the real-world terrorist group The limitations of the terrorist datamake it difficult to predict the behaviors because we cannotbe sure that we included all communication and cooperationnetworks However even using this dataset we are able tosystematically predict the networks and behaviors whichhighlights the value of the proposed models
7 Conclusions
The steep rise in global terror necessitates deeper scien-tific understanding of the terrorist group and its behaviorNowadays preventing terrorist attacks before they happenis extremely important in counterterrorism Governmentsneed to understand how terrorist groups behavewith terrorist
attack in the future In this paper we proposed and applieda wavelet transform-based pattern recognition framework toinvestigate the dynamics and eventually predict the Attackbehavior of terrorist group
Specifically the terrorist group is first modeled as socialnetworks and the relevant measures are extracted with theproposed criteria Second a wavelet transform-based predic-tion method is established to predict the extracted measuresNext the Attack behavior of the group is recognized bybehavior pattern recognition with SVM Empirical researchof Al-Qaeda data demonstrates that the proposed frameworkis a meaningful approach and tool in the prediction ofterrorist group behavior
In summary we make the following contributions in thispaper (1) We analyze the dynamic characteristics of theterrorist group from two aspects the periodicity of a groupnetwork and the correlation between the behavior and thenetwork (2)We design an effective wavelet transform-basedpattern recognition framework that combines SNA wavelettransform methods and the pattern recognition approachto predict the Attack behavior of the terrorist group (3) Wepropose a novel network prediction method with wavelettransform from two aspects period analysis-based qualitativeinference and WNN-based quantitative prediction To ourknowledge this may be the first study to apply the theory ofwavelet transform as associated with terrorist behaviors
In light of the results and discussion presented up tonow the proposed framework enables us to derive sev-eral conclusions (1) The terrorist networks have shownsome periodic features during the dynamic process andthe features can be used to predict the future behaviorsbased on the correlation between the network and behavior(2) The prediction framework we proposed performs wellwith the periodicity and correlation considered (3) Wavelettransform-based prediction methods can effectively predictthe networks of terrorist group from both the qualitative andquantitative aspects
In conclusion this study helps to elucidate the dynamicsof terrorist groups using a wavelet transform-based patternrecognition framework Such a framework tightly integratesthe group network and behavior with respect to both thenetwork prediction and behavior recognition dimensionsThe approach used in this study provides analysts with greateranalytical power and facilitates assessing dynamic complexand nonlinear sociotechnical systems This paper also pro-vides an effective method for predicting collective behaviorin other extreme incidents emergency and security studydomains Overall predicting terrorism is so challenging thatthe added mathematical methods are likely to enhance ourunderstanding of the dynamic characteristics of its behaviors
Conflicts of Interest
The authors declare that they have no conflicts of interest
Acknowledgments
This research is supported by the National Natural ScienceFoundation of China nos 71473263 and 71704184
Discrete Dynamics in Nature and Society 15
References
[1] M Sageman Understanding Terror Networks University ofPennsylvania Press 2004
[2] A Sliva V S Subrahmanian V Martinez and G SimarildquoCAPE Automatically predicting changes in group behaviorrdquoMathematical Methods in Counterterrorism pp 253ndash269 2009
[3] B Li D Sun R Zhu and Z Li ldquoAgent basedmodeling on orga-nizational dynamics of terrorist networkrdquoDiscrete Dynamics inNature and Society vol 2015 Article ID 237809 2015
[4] K M Carley ldquoA dynamic network approach to the assessmentof terrorist groups and the impact of alternative courses ofactionrdquo 2006 DTIC Document
[5] B Li D Sun S Guo and Z Lin ldquoAgent based simulation ofgroup emotions evolution and strategy intervention in extremeeventsrdquo Discrete Dynamics in Nature and Society vol 2014Article ID 464190 2014
[6] I McCulloh and K M Carley ldquoDetecting change in longitudi-nal social networksrdquo 2011 DTIC Document
[7] A B Krueger and J Maleckova ldquoAttitudes and action publicopinion and the occurrence of international terrorismrdquo Sciencevol 325 no 5947 pp 1534ndash1536 2009
[8] W Enders and T Sandler ldquoIs transnational terrorism becomingmore threatening A time-series investigationrdquo Journal of Con-flict Resolution vol 44 no 3 pp 307ndash332 2000
[9] V Raghavan A Galstyan and A G Tartakovsky ldquoHiddenMarkov models for the activity profile of terrorist groupsrdquo TheAnnals of Applied Statistics vol 7 no 4 pp 2402ndash2430 2013
[10] V S Subrahmanian A Mannes A Sliva J Shakarian andJ P Dickerson Computational Analysis of Terrorist GroupsLashkar-e-Taiba Springer Science and Business Media 2012
[11] V Subrahmanian AMannes A Roul and R Raghavan IndianMujahideen Computational Analysis and Public Policy SpringerScience and Business Media 2013
[12] A Najgebauer R Antkiewicz M Chmielewski and RKasprzak ldquoThe prediction of terrorist threat on the basis ofsemantic association acquisition and complex network evolu-tionrdquo Journal of Telecommunications and Information Technol-ogy pp 14ndash20 2008
[13] A Xue W Wang and M Zhang ldquoTerrorist organizationbehavior prediction algorithm based on context subspacerdquoAdvanced Data Mining and Applications pp 332ndash345 2011
[14] S Tutun M T Khasawneh and J Zhuang ldquoNew frameworkthat uses patterns and relations to understand terrorist behav-iorsrdquoExpert SystemswithApplications vol 78 pp 358ndash375 2017
[15] P V Bindu P S Thilagam and D Ahuja ldquoDiscovering sus-picious behavior in multilayer social networksrdquo Computers inHuman Behavior vol 73 pp 568ndash582 2017
[16] I A McCulloh and K M CarleyDefense Technical InformationCenter 2008
[17] Z Li D Sun R Zhu Z Lin and Y Deng ldquoDetecting event-related changes in organizational networks using optimizedneural network modelsrdquo PLoS ONE vol 12 no 11 p e01887332017
[18] D Kasthurirathna M Piraveenan and M Harre ldquoInfluence oftopology in the evolution of coordination in complex networksunder information diffusion constraintsrdquoTheEuropean PhysicalJournal B vol 87 no 1 article no 3 2014
[19] A Anzo and J Barajas-Ramirez ldquoSynchronization in complexnetworks under structural evolutionrdquo Journal of The FranklinInstitute vol 351 no 1 pp 358ndash372 2014
[20] D McDaniel and G Schaefer ldquoA data fusion approach toindications and warnings of terrorist attacksrdquo in Proceedings ofthe Next-Generation Analyst II May 2014
[21] A Clauset and K S Gleditsch ldquoThe developmental dynamicsof terrorist organizationsrdquo PLoS ONE vol 7 no 11 Article IDe48633 2012
[22] B A Desmarais and S J Cranmer ldquoForecasting the loca-tional dynamics of transnational terrorism A network analyticapproachrdquo in Proceedings of the 2011 1st European Intelligenceand Security Informatics Conference EISIC 2011 pp 171ndash177Greece September 2011
[23] S Koschade ldquoA social network analysis of Jemaah IslamiyahThe applications to counterterrorism and intelligencerdquo Studiesin Conflict and Terrorism vol 29 no 6 pp 559ndash575 2006
[24] B Zhan and R Han ldquoModel based on hidden Markov modelfor predicting terrorism accidentrdquo journal of Pla University ofScience amp Technology vol 16 no 4 pp 385ndash393 2015
[25] P V Fellman and R Wright ldquoModeling terrorist networkscomplex systems at the mid-rangerdquo httpsarxivorgabs14056989v1
[26] Editorial ldquoUnderstanding and countering terrorismrdquo NatureHuman Behaviour vol 1 p 134 2017
[27] P J Phillips ldquoThe Life Cycle of Terrorist Organisationsrdquo SocialScience Electronic Publishing vol 17 no 4 pp 369ndash385 2010
[28] W Enders G F Parise and T Sandler ldquoA A time-series analysisof transnational terrorism Trends and cyclesrdquo Defence andPeace Economics vol 3 no 4 pp 305ndash320 1992
[29] K K Minu M C Lineesh and C Jessy John ldquoWaveletneural networks for nonlinear time series analysisrdquo AppliedMathematical Sciences vol 4 no 49-52 pp 2485ndash2495 2010
[30] M A Ruiz Estrada and E Koutronas ldquoTerrorist attack assess-ment Paris November 2015 and Brussels March 2016rdquo Journalof Policy Modeling vol 38 no 3 pp 553ndash571 2016
[31] T Sandler ldquoNew frontiers of terrorism research An introduc-tionrdquo Journal of Peace Research vol 48 no 3 pp 279ndash286 2011
[32] G LaFree L Dugan M Xie and P Singh ldquoSpatial andTemporal Patterns of Terrorist Attacks by ETA 1970 to 2007rdquoJournal of Quantitative Criminology vol 28 no 1 pp 7ndash29 2012
[33] M Crenshaw ldquoThe logic of terrorism Terrorist behavior asa product of strategic choicerdquo in Proceedings of the NationalAcademy of Sciences of the United States of America vol 98 pp15056ndash15061 1998
[34] T Sandler and D G M Arce ldquoTerrorism amp game theoryrdquoSimulation amp Gaming vol 34 no 3 pp 319ndash337 2003
[35] L Peel and A Clauset Detecting change points in the large-scalestructure of evolving networks
[36] K M Carley Dynamic Network Analysis Alphascript Publish-ing 2013
[37] B Scholkopf J C Platt J Shawe-Taylor A J Smola and RC Williamson ldquoEstimating the support of a high-dimensionaldistributionrdquo Neural Computation vol 13 no 7 pp 1443ndash14712001
[38] S Gao and Q Wu ldquoPeriod analysis and trend forecast forsoil temperature in the Qinghai-Xizang Highway by wavelettransformationrdquoEnvironmental Earth Sciences vol 74 no 4 pp2883ndash2891 2015
[39] H Esen F Ozgen M Esen and A Sengur ldquoArtificial neuralnetwork and wavelet neural network approaches for modellingof a solar air heaterrdquo Expert Systems with Applications vol 36no 8 pp 11240ndash11248 2009
16 Discrete Dynamics in Nature and Society
[40] M Farge ldquoWavelet transforms and their applications to turbu-lencerdquoAnnual Review of FluidMechanics vol 24 no 1 pp 395ndash457 1992
[41] C Torrence and G P Compo ldquoA practical guide to waveletanalysisrdquoBulletin of the AmericanMeteorological Society vol 79no 1 pp 61ndash78 1998
[42] Q Zhang and A Benveniste ldquoWavelet networksrdquo IEEE Trans-actions on Neural Networks and Learning Systems vol 3 no 6pp 889ndash898 1992
[43] P Kumar P RadhaKrishna and S Bapi Raju ldquoPattern discoveryusing sequence data mining Applications and studiesrdquo PatternDiscovery Using Sequence Data Mining Applications and Stud-ies pp 1ndash273 2011
[44] N Lesh M J Zaki and M Ogihara Mining Features forSequence Classification 342ndash346
[45] S Nedeltchev and A Shaikh ldquoA new method for identificationof themain transition velocities inmultiphase reactors based oninformation entropy theoryrdquo Chemical Engineering Science vol100 pp 2ndash14 2013
[46] John Jay and ARTIS ldquoARTIS Transnational TerrorismDatabaserdquo httpdoitappsjjaycunyedujjattdataphp
[47] E Tomita A Tanaka and H Takahashi ldquoThe worst-case timecomplexity for generating all maximal cliques and computa-tional experimentsrdquoTheoretical Computer Science vol 363 no1 pp 28ndash42 2006
[48] I W Tsang J T Kwok and P-M Cheung ldquoCore vectormachines fast SVM training on very large data setsrdquo Journalof Machine Learning Research vol 6 pp 363ndash392 2005
[49] S B Blomberg K Gaibulloev and T Sandler ldquoTerrorist groupsurvival Ideology tactics and base of operationsrdquo PublicChoice vol 149 no 3 pp 441ndash463 2011
[50] R Medina and G Hepner Geospatial Analysis of DynamicTerrorist Networks Springer Netherlands 2008
[51] M L Ouellet Terrorist Networks and the Collective Crim-inal Career The Relationship between Group Structure andTrajectories [ PhDthesis] Arts amp Social Sciences School ofCriminology 2016
Hindawiwwwhindawicom Volume 2018
MathematicsJournal of
Hindawiwwwhindawicom Volume 2018
Mathematical Problems in Engineering
Applied MathematicsJournal of
Hindawiwwwhindawicom Volume 2018
Probability and StatisticsHindawiwwwhindawicom Volume 2018
Journal of
Hindawiwwwhindawicom Volume 2018
Mathematical PhysicsAdvances in
Complex AnalysisJournal of
Hindawiwwwhindawicom Volume 2018
OptimizationJournal of
Hindawiwwwhindawicom Volume 2018
Hindawiwwwhindawicom Volume 2018
Engineering Mathematics
International Journal of
Hindawiwwwhindawicom Volume 2018
Operations ResearchAdvances in
Journal of
Hindawiwwwhindawicom Volume 2018
Function SpacesAbstract and Applied AnalysisHindawiwwwhindawicom Volume 2018
International Journal of Mathematics and Mathematical Sciences
Hindawiwwwhindawicom Volume 2018
Hindawi Publishing Corporation httpwwwhindawicom Volume 2013Hindawiwwwhindawicom
The Scientific World Journal
Volume 2018
Hindawiwwwhindawicom Volume 2018Volume 2018
Numerical AnalysisNumerical AnalysisNumerical AnalysisNumerical AnalysisNumerical AnalysisNumerical AnalysisNumerical AnalysisNumerical AnalysisNumerical AnalysisNumerical AnalysisNumerical AnalysisNumerical AnalysisAdvances inAdvances in Discrete Dynamics in
Nature and SocietyHindawiwwwhindawicom Volume 2018
Hindawiwwwhindawicom
Dierential EquationsInternational Journal of
Volume 2018
Hindawiwwwhindawicom Volume 2018
Decision SciencesAdvances in
Hindawiwwwhindawicom Volume 2018
AnalysisInternational Journal of
Hindawiwwwhindawicom Volume 2018
Stochastic AnalysisInternational Journal of
Submit your manuscripts atwwwhindawicom
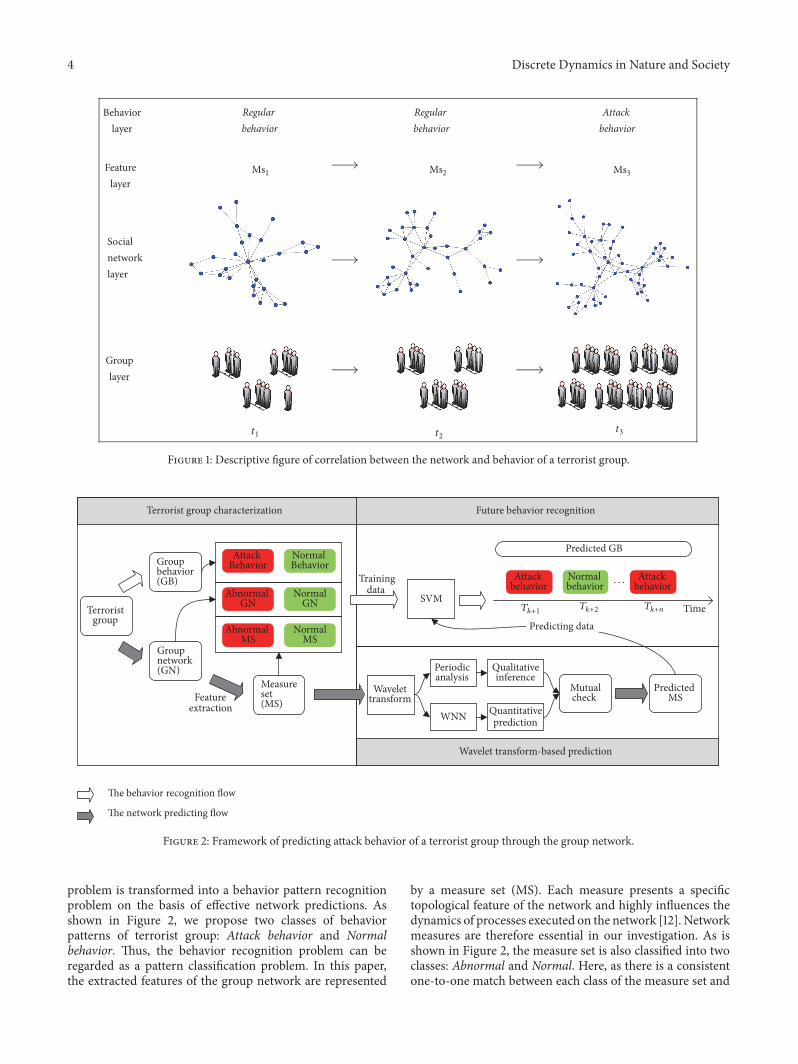
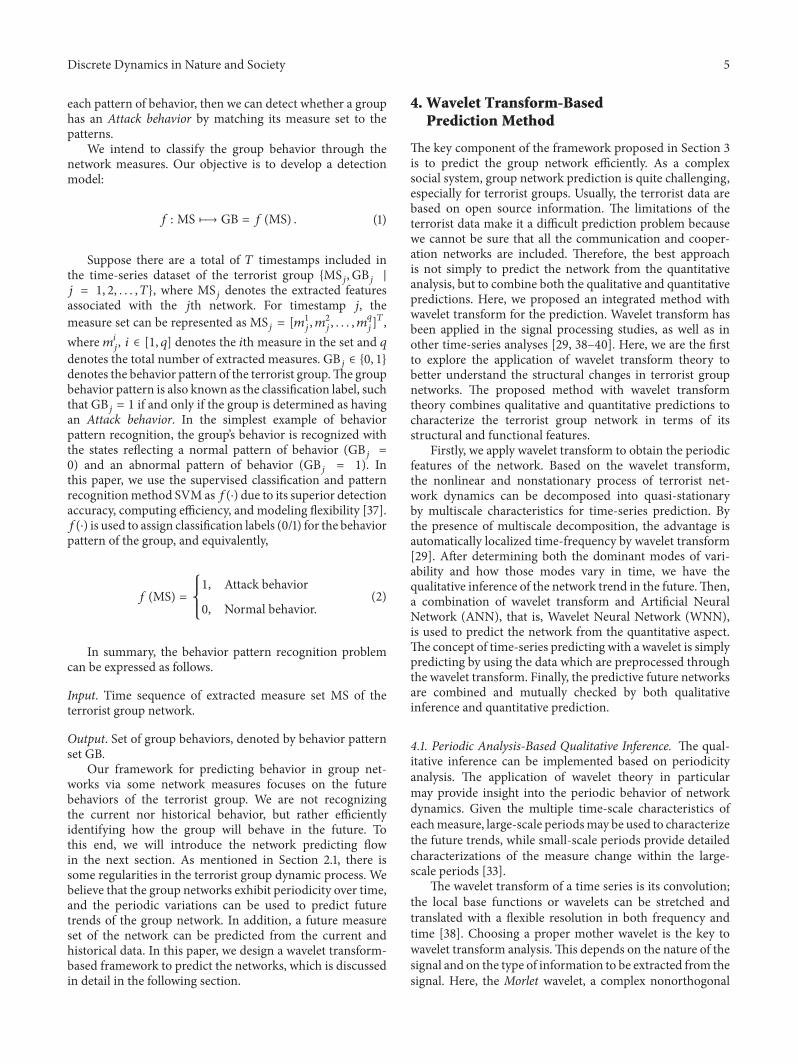
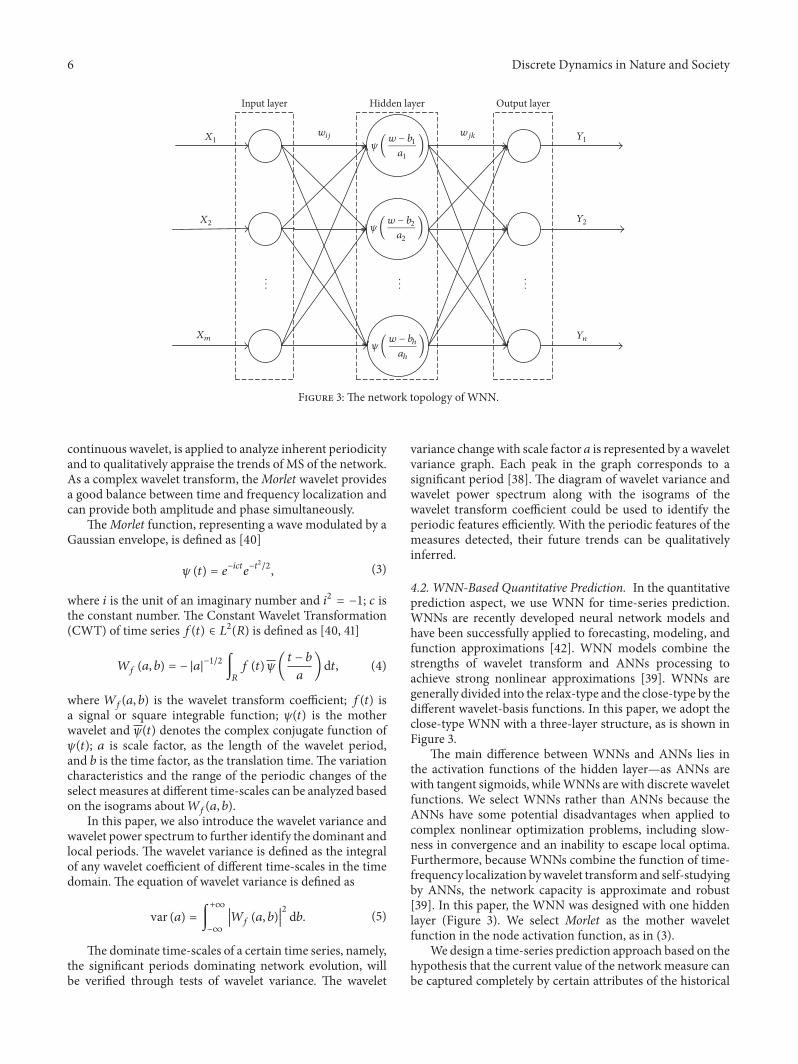
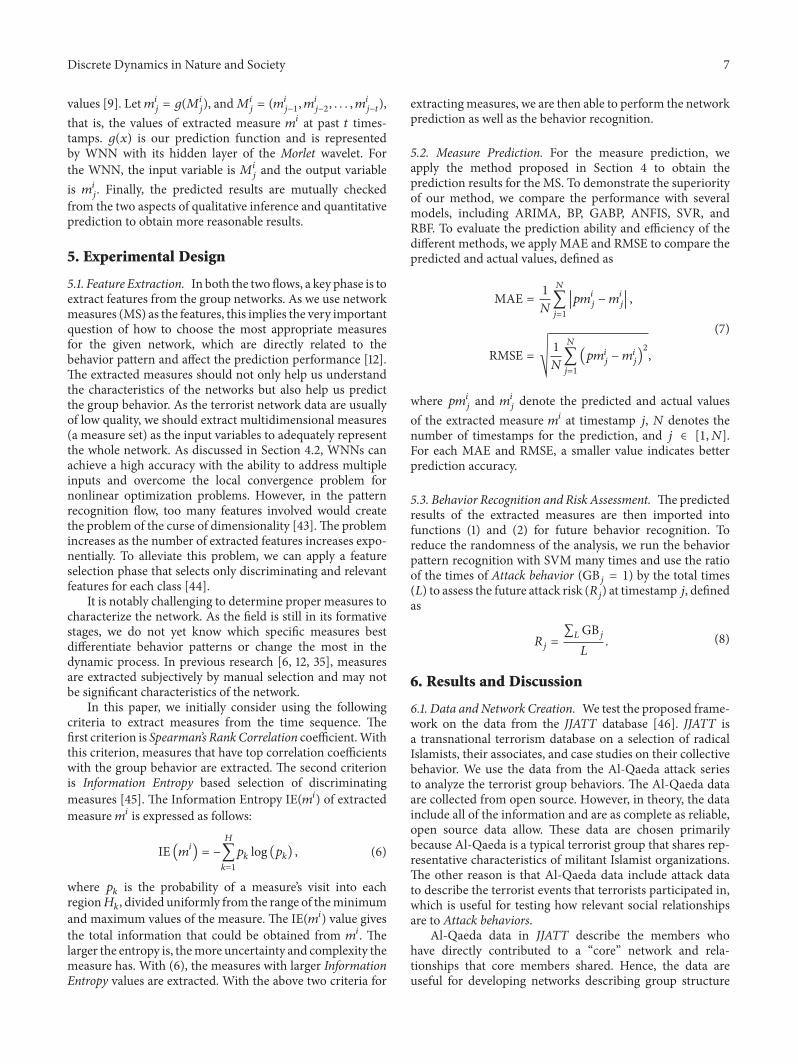
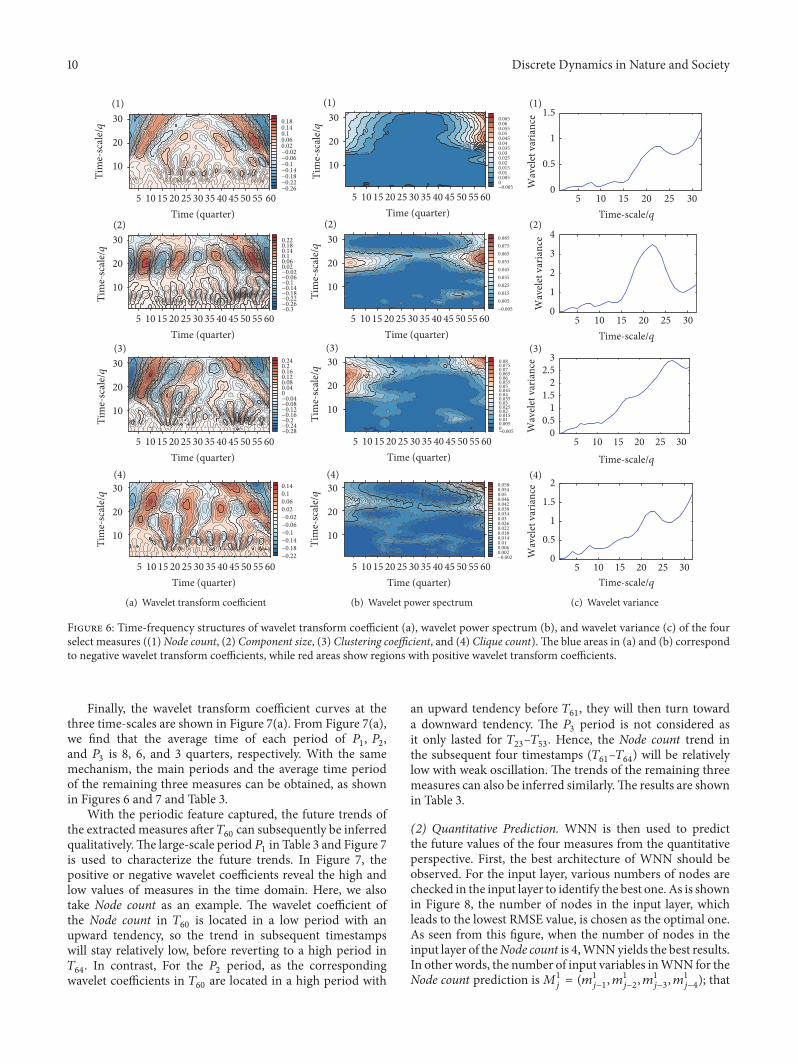
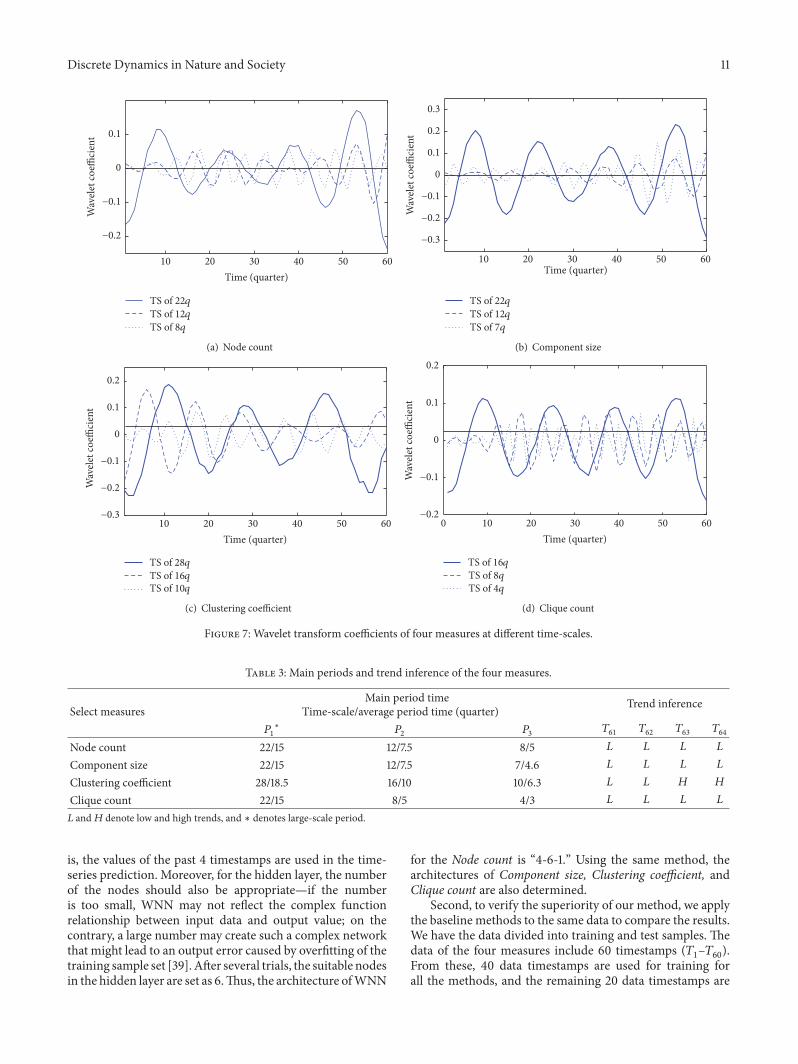
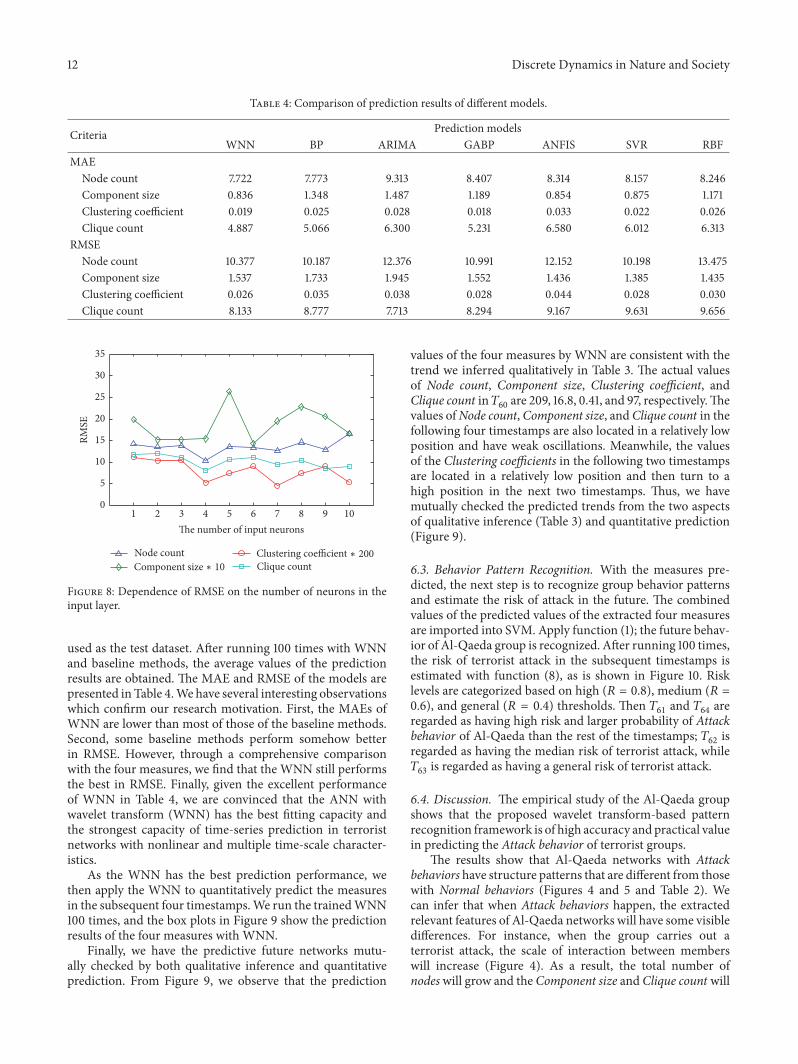
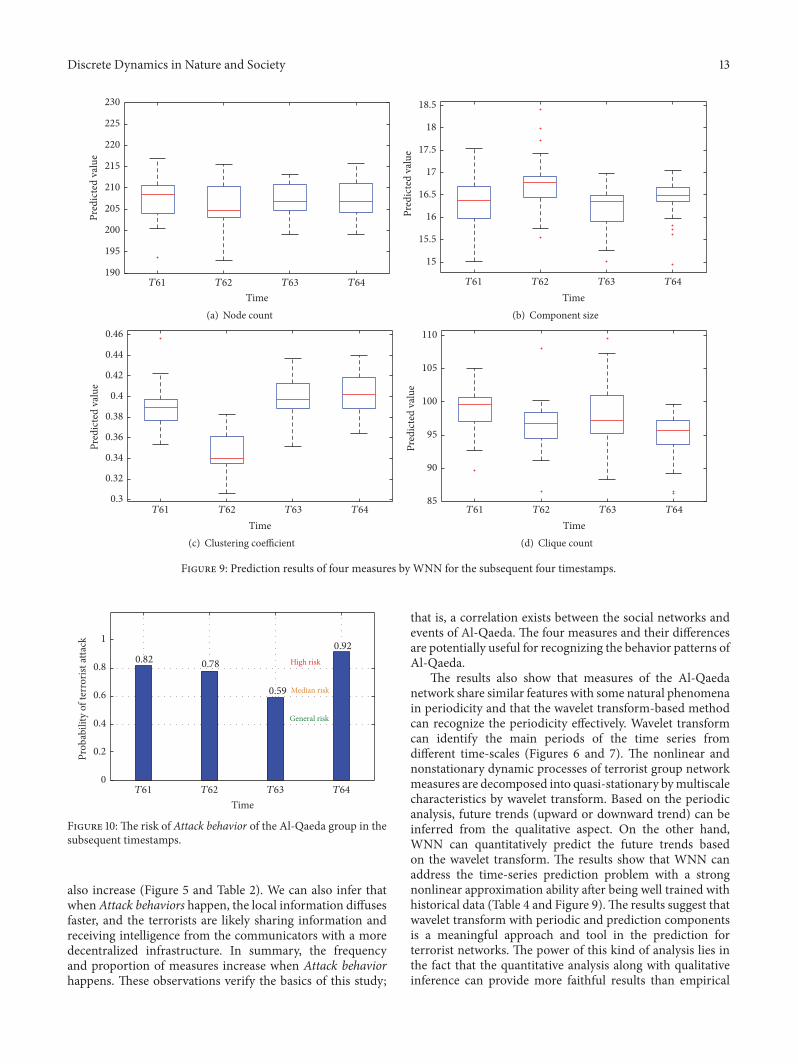
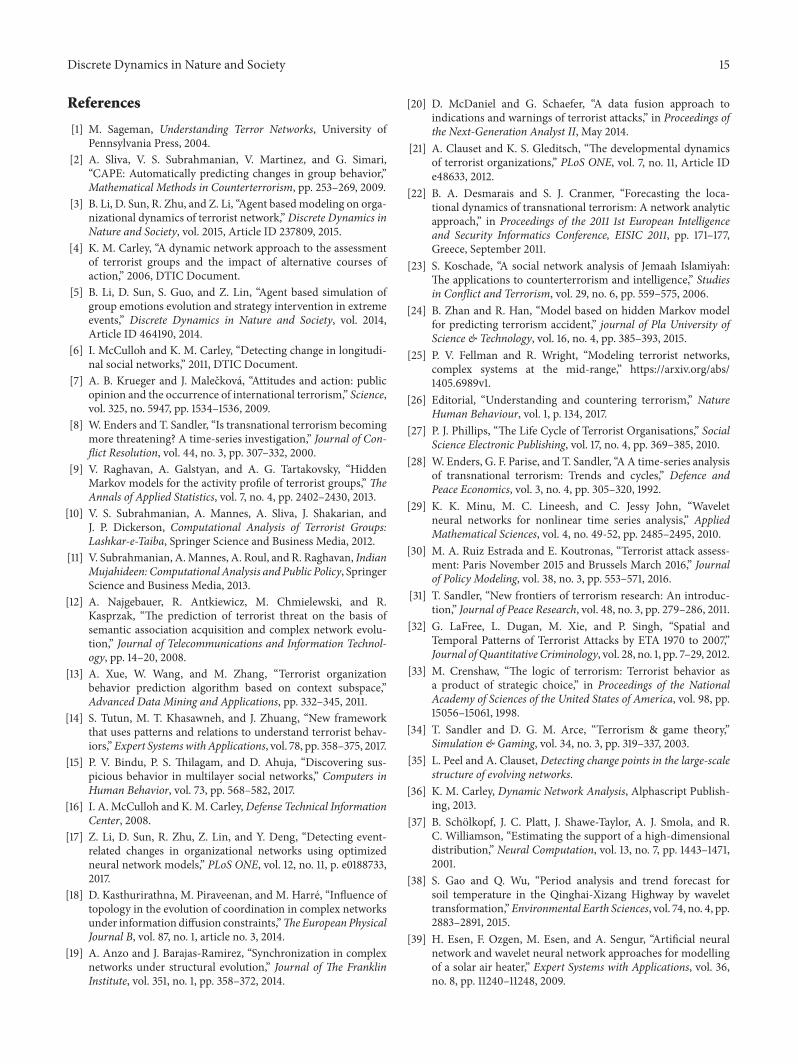

Hindawiwwwhindawicom Volume 2018
MathematicsJournal of
Hindawiwwwhindawicom Volume 2018
Mathematical Problems in Engineering
Applied MathematicsJournal of
Hindawiwwwhindawicom Volume 2018
Probability and StatisticsHindawiwwwhindawicom Volume 2018
Journal of
Hindawiwwwhindawicom Volume 2018
Mathematical PhysicsAdvances in
Complex AnalysisJournal of
Hindawiwwwhindawicom Volume 2018
OptimizationJournal of
Hindawiwwwhindawicom Volume 2018
Hindawiwwwhindawicom Volume 2018
Engineering Mathematics
International Journal of
Hindawiwwwhindawicom Volume 2018
Operations ResearchAdvances in
Journal of
Hindawiwwwhindawicom Volume 2018
Function SpacesAbstract and Applied AnalysisHindawiwwwhindawicom Volume 2018
International Journal of Mathematics and Mathematical Sciences
Hindawiwwwhindawicom Volume 2018
Hindawi Publishing Corporation httpwwwhindawicom Volume 2013Hindawiwwwhindawicom
The Scientific World Journal
Volume 2018
Hindawiwwwhindawicom Volume 2018Volume 2018
Numerical AnalysisNumerical AnalysisNumerical AnalysisNumerical AnalysisNumerical AnalysisNumerical AnalysisNumerical AnalysisNumerical AnalysisNumerical AnalysisNumerical AnalysisNumerical AnalysisNumerical AnalysisAdvances inAdvances in Discrete Dynamics in
Nature and SocietyHindawiwwwhindawicom Volume 2018
Hindawiwwwhindawicom
Dierential EquationsInternational Journal of
Volume 2018
Hindawiwwwhindawicom Volume 2018
Decision SciencesAdvances in
Hindawiwwwhindawicom Volume 2018
AnalysisInternational Journal of
Hindawiwwwhindawicom Volume 2018
Stochastic AnalysisInternational Journal of
Submit your manuscripts atwwwhindawicom