tesla motors inc. (tsla) november 18, 2015tippie.biz.uiowa.edu/henry/reports15/tsla_fa15.pdf ·...
TRANSCRIPT

Important disclosures appear on the last page of this report.
The Henry Fund
Henry B. Tippie School of Management
Krishnakumar Bakthisaran [[email protected]]
Tesla Motors Inc. (TSLA) November 18, 2015
Consumer Goods – Auto Manufacturers Stock Rating SELL
Investment Thesis Target Price $183-$189 Tesla is a first of its kind Electric Vehicles (EV) and Electric Vehicle components manufacturer that has successfully built highway capable vehicles such as the Roadster, the Model S and the Model X. We believe despite its solid performance, the company is currently highly overvalued and will require to take a significant amount of additional debt just to ensure it has a positive cash balances to run its operations. Drivers of Thesis
Tesla has frequently had difficulty in sticking with its bullish deadlines in terms of product launches and production ramp ups and we feel this will continue to be the case in the future. This is partly because of Tesla’s lack of expertise in operating and producing automobiles on a large scale.
Tesla is in a capital intensive industry but it currently does not have any positive earnings. Despite our modelling of positive earnings in 2017, the company would be required to raise significant debt to continue scaling up of operations for mass market operations.
When compared with peers Tesla looks extremely overvalued. We believe that despite its initial success over others in the EV space, the company does not warrant such a high price premium.
Risks to Thesis
If the company’s Model III launch is highly successful then that would definitely cause us to re-visit our valuations.
Rapid progress and commercialization of an autonomous EV would also cause us to re-calculate our valuations.
Henry Fund DCF $186.00 Henry Fund DDM NA Relative Multiple NA Price Data Current Price $221.07 52wk Range $181.40 – $286.65 Consensus 1yr Target $286.47 Key Statistics Market Cap (B) $28.95B Shares Outstanding (M) 130.95M Institutional Ownership 62.00% Five Year Beta 0.54 Dividend Yield 0.0% Est. 5yr Growth 43.3% Price/Earnings (TTM) NA Price/Earnings (FY1) NA Price/Sales (TTM) NA Price/Book (mrq) 21.3 Profitability Operating Margin -14.02% Profit Margin -17.84% Return on Assets (TTM) -5.11% Return on Equity (TTM) -59.48%
Earnings Estimates Year 2012 2013 2014 2015E 2016E 2017E
EPS $(3.68) $(0.62) $(2.36) $(0.09) $(2.18) $0.45
growth -46.0% 83.0% 281.0% -96.0% -245.7 % 121%
12 Month Performance Company Description
Tesla Motors, Inc. is a Palo Alto, California based automobile company that designs, develops, manufactures, and sells electric vehicles, electric vehicle powertrain components, and stationary energy storage systems in the US and internationally. It also provides third party development services of electric vehicle powertrain components and systems for other automotive manufacturers. The company sells its products through a network of Tesla stores and galleries, as well as through Internet.
21.3
-59.5
1.3
12.3
-0.8
15.8
-80
-60
-40
-20
0
20
40
P/B ROE
TSLA Industry Sector
Source: Yahoo Finance
-30%
-20%
-10%
0%
10%
20%
N D J F M A M J J A S O
TSLA S&P 500
Source: Yahoo Finance

Page 2
EXECUTIVE SUMMARY
Tesla has had resounding success with its Roadster, Model S and Model X launches and successful commercialization of its Model S electric vehicle. We laud the company for its achievements and think it definitely has revolutionized competition in the electric vehicle space. But we think management has often been too bullish on launch data and announcements only to revise them to a more practical deadline. We also think the company’s cash needs are immediate and continuous given that it is a capital intensive industry and significant cash outlay is required for mass-market volume production of electric vehicle which appears to be Tesla’s end-game.
Additionally, we think at the company’s current stock price it is overvalued by any relative comparison metric. On Price-to-Book comparison with its peers such as Daimler, Toyota and other auto industry giants, it is valued at 21 times book value against a peer average of 1.4. While Tesla’s products are certainly revolutionary, we do not think they warrant such an exorbitant price premium. We therefore recommend a ‘SELL’ of Tesla with a target price of $183 to $189.
COMPANY DESCRIPTION
Tesla Motors Inc., is an automotive and energy Storage Company based out of Palo Alto, California. The company is best known for its luxury electric cars such as Roadster, the Model S and Model X. However, unlike traditional auto manufacturers, the company also operates as an Original Equipment Manufacturer (OEM) manufacturing powertrain and battery components for Toyota and Daimler among others. In April 2015, the company unveiled its rechargeable lithium-ion battery product called Powerwall that could be used to store electricity for domestic consumption and/or as backup power for industrial purposes.
The company also sells and services its full powertrain systems and components to other manufacturers. Beginning in Q3, 2015, the company also began selling Powerwall energy storage systems for use in commercial and domestic settings.
The company’s revenue split up is as shown below:
Electric Vehicles
The company currently develops, manufactures and sells fully electric vehicles (EV) such as Roadster - the first fully electric sports car, Model S - the luxury hatchback and the recently launched Model X that claims to successfully crossover the “roominess” of a minivan and the style of an SUV1. With the company also announcing that it will launch a low cost Sedan Model III in 2017, we feel that this segment is crucial to Tesla’s overall performance and if it has to grow into its current rich valuations.
The company’s strategy so far has been to launch an expensive models in the price range of $69,000 to $101,000 while gaining crucial expertise on the mass production process and also collecting cash to offset major portions of the losses the company has been making. The Roadster, the Model S and the Model X all not only generated steady cash flows, but also raised the company’s public profile. We believe that all of these model launches are steps that lead to the mass manufacturing of the affordable sedan, Model III.
One of the biggest positives for a Tesla car owner is the ability to utilize the company’s supercharger network free of cost for the life of their Tesla cars. Another advantage is that these chargers typically charge much faster than other sources of power. The superchargers are also typically located in such a way that a charging of 80% is enough to reach a neighboring Supercharger station3.
2014 Revenues
Electric Vehicles Powertrain salesSource: Yahoo Finance

Page 3
However, this has backfired on the company as several reports of station abuse were brought to the company’s notice and it was forced to write to the Model S owners to decrease their local supercharging and promptly remove their cars once they had been charged2. With the expected number of superchargers set to increase at least till 20163 (see figure below), in addition to number of Tesla cars on the road, we believe the cost of operating a huge number of these supercharger networks will weigh heavily on Tesla’s bottom line.
We model the Electric Vehicles segment with the following growth percentages:
Year 2015E 2016E 2017E 2018E 2019E
Growth (%) 50.0% 50.0% 50.0% 40.0% 30.0%
Our 2015 to 2017 growth rate is based on the low end of the management estimates of 50% to 87% growth rate. We are also highly skeptical of the company’s ramp up in production facilities to meet the scale as evidenced by the frequent lowering of delivered units’ guidance by management. Once the Model III is also in the mix (from
2017 and beyond) we model a decreasing growth rate. Our reasoning is based on Tesla’s own statements that the Model X introduction could slow Model S production4. Besides our 30% assumption is based on the stable growth rate that the Model S was able to achieve after 2.5 years of its launch. We believe this will be the case once the Model III is launched as the company currently operates just one assembly line in its Fremont Manufacturing facility. In addition to this, the company’s focus and resources are also being put into Tesla Energy’s Powerwall launch.
Powertrain Segment
The company also has state of the art energy management that it not only uses in its own electric cars, but also sells it to Daimler (for use in its Mercedes Benz B Class EV) and to Toyota (for use in its RAV4 EV)5. In the absence of any clear guidance, we model an 18.7% growth rate y/y, in line with the expert estimates global growth outlook for EV market growth10.
Company Analysis
We believe Tesla’s crucial business segment is its Electric Vehicle segment that is supported by its vast supercharger network. Currently Tesla’s vehicles offer mile ranges double that of any other existing electric vehicle. Additionally, the proprietary on-board charging system recharges from any other available electric outlet, albeit much slowly in comparison1. We also believe the company deserves credit for the strategic positioning of its charging locations in with 80% of charge customers can reach the next closest Supercharger network. All of this has helped reduce the consumer uncertainty over range that has typically existed with electric vehicles in the past1.
Tesla’s Model S also ranks very highly on safety rating performance awarded by the National Highway Traffic Safety Administration (NHTSA). Model S was also awarded the highest customer satisfaction of any car in the entire automotive industry in 20151.
All of this are key differentiators for Tesla in the market place. However, we believe that Tesla has some significant headwinds too as it tries to scale up— free cash flow generation remains distant; most of its competitors have great expertise in the auto industry and have significantly greater resources. But Tesla’s pure focus on Electric
170
14 10
0
100
200
Miles of Range (after half an hour of charge)
Tesla Supercharger 40A HV Outlet
30A Public Charging Station
Source: Tesla Motors
765
557
1000*
2013 2014 2015E 2016E
Source: Tesla Motors Inc.*Henry Fund Estimate
Source: Tesla Motors Inc.

Page 4
Vehicles and its history of EV production does lend it some competitive edge in this regard.
RECENT DEVELOPMENTS
Tesla announces Q3 2015 earnings
Tesla announced its Q3, 2015 earnings on November 2015 with a loss of $0.58 against analyst expectations of $0.56 loss per share while meeting analyst’s revenue expectations. Tesla also lowered its estimates for full year deliveries of Model S by 5%. However the company’s successful roll out of its autopilot feature on over 40,000 vehicles proved to be one of the highlights, as company executives noted some of the early data that they had been collecting has been really positive7. There were also hints that the company might offer autonomous cars to ride-sharing companies like Uber or even offer its own platform. While we did not think there was enough information for us to factor this into our model, we believe that it is yet another avenue that Tesla might begin competing in and one that we will require us to revisit both our model growth assumptions and outlook. Overall, despite a weak guidance and falling short of estimates, we were surprised that the stock ran up 10%, though it has since fallen back to its pre earnings levels.
Tesla launches Model X
In September 2015, Tesla launched its Model X crossover SUV that marked its third entry into all-electric market9. The Model X can seat up to 7 adults, had a towing capacity of 5000 pounds and has a price range of $80,000 to $132,000. One of the key takeaways was the high safety rating that the Model X was able to obtain: a 5-star NHTSA rating making it one of the safest SUVs. It is also one of the most powerful SUVs currently in the market. The highest performance version goes from 0 to 60mph in 3.2 seconds outperforming several sports cars and the fastest SUVs9. While all these factors are really impressive, Tesla has struggled to roll out the Model X in time with the initial deadline being late 2013 for the launch and deliveries beginning in early 2014. Pre-orders for the Model X had begun in February 2012 and currently the timeline for delivery is anywhere between 12 and 18 months. This does show that Tesla has a strong customer base, but it also highlights the company’s struggles to meet its ambitious deadlines, which is why we have always tried to stick to the more conservative side of management’s guidance.
INDUSTRY TRENDS
Auto Industry goes green
The auto industry has seen an increased movement towards hybrid segment as automakers focus on developing vehicles that can run on both gas and electricity, while trying to cut exhaust emissions and increase fuel efficiency11. This trend is amplified by the introduction of Plug-in Hybrids (PHEV) that are gas-optional and can recharge their batteries through electrical outlets. However the price premiums on PHEV is are really high and we expect them to become more popular by the turn of the decade when battery technology is finally able to pack sufficient energy to make it more affordable6 (see chart below).
The fully electric vehicles (EV) are more popular among consumers as shown below:
Industry estimates forecast the EV market growth at a CAGR of 18.7% till 202410. We use this figure as a proxy for the powertrain segment growth of Tesla, as the company
Source: IEA.org
Source: IEA.org

Page 5
currently supplies powertrain and other electrical components to other EV manufacturers.
The race for the autonomous market
Currently, all electric autonomous vehicle market has no commercial players, but some of the tech giants like Google and Apple indicating that they already are some way into their pilot projects for into these segment13. Add to this, the traditional automakers such as Daimler, BMW, Audi and GM who already have years of expertise, this space could be very crowded and highly competitive. Despite recent glowing reviews about Tesla’s new autopilot 7.0 software feature that makes cars semi-autonomous, Daimler, Audi, BMW and GM are actually much ahead in the curve. Daimler’s self-driving truck has cruise controls and does not require human intervention except for particularly difficult conditions13. Audi’s A7 Sport back outfitted with Delphi Technology drove 560 miles without any human intervention13. Tesla’s autopilot feature in comparison is still in beta phase and the company advises against taking hands off the steering. While our opinion is that it is still pretty early to pick a winner, it will be crucial see each competitor’s learning curve. Additionally federal regulations for autonomous vehicles also needs to catch up and this is another key issue to monitor.12
MARKETS AND COMPETITION
The automobile manufacturing industry is at a mature life cycle stage. The concentration is moderate with the top four companies accounting for over half of the total industry output in 201511. With this level of concentration, high capital requirements and high technological progress it is extremely difficult for new entrants to this industry to be successful11.
Almost all of Tesla’s competitors have either years of expertise in the automobile manufacturing sector and/or the resources to not only sustain production but also compete. At this moment, Tesla is behind on the expertise of automobile manufacturing in general as well as the cash for this capital intensive industry. This is evidenced by the quite frequent revision of production and launch deadlines during the Model X launch. We feel the company’s strongest point however is its complete focus on the EV market and its considerable expertise in the electric powertrain systems.
But we feel that if Tesla can make its cars more affordable without compromising on the impeccable safety profile, while continuing to deliver technological advancement with both the engines and in-car entertainment, the company could turn out to be a major player by 2020. A lot depends on Tesla’s ability to scale up quickly and compete in this capital intensive industry.
Competition in this industry is typically on the basis of price, fuel economy, reliability, styling and utility11. Table below shows best performing electric vehicles and how they are positioned in the US market.
One thing that is apparent right away is that Tesla’s competition is against some of the giants in the global automobile industry who, as we have discussed in a few places already, have both the expertise and the resources to make this production and operation of EVs sustainable.
Vehicle
Cost (in
USD)
All Electric Range
(in miles)
Annual Fuel Cost
(in $)
Launch Date
Cumulative Sales since launch
Nissan Leaf 29,010 73 550 Dec-10 85,952
Chevrolet Volt 33,170 53 650 Dec-10 82,621
Toyota Prius 29,990 11 900 Feb-12 42,136
Tesla Model S 69,900 208 650 Jun-12 55,520
BMW i3 42,400 81 500 May-14 13,985
One of the best performers in this segment has been the Nissan Leaf, which is available in over 46 countries and is the world’s best-selling EV9. We believe that this is primarily due to the low cost of ownership. With the Tesla Model III set to debuting in the same price range, or slightly higher, we think the company can be a strong competitor to the Nissan Leaf, given the Tesla Supercharger network and the company’s learning curve with the powertrain and other components design.
Honda6%
Hyundai6%
Ford10%
Toyota14%
General Motors
14%Nissan
5%
Volkswagen AG5%
Tesla3%
Others37%
2015 MARKET SHARE
Source: IBIS World
Source: Wikipedia, Caranddriver.com

Page 6
Despite its high cost premium, we think the Model S has done really well in terms of the high All Electric Range as it has come to be recognized as more reliable and also relatively cheaper annual fuel costs. Also the Model S has a much superior design and a greater variety of in-car features. The high safety profile is another aspect that justifies the Model S’s premium price.
Overall the PEV segment has been held back from competing with conventional vehicles as the cost of batteries
Peer Comparisons
We compare Tesla against a cross section of some of the competitors who currently have an electric vehicle product or have plans to launch one soon. This really paints a stark picture in terms of market cap, operating metrics and even the price to book and price to sales ratios.
Company Market Cap ($
Billions) P/S P/B
Operating Margin
Interest Coverage
D/E
Tesla 28 7.2 21.3 -95.40% -1.8 1.5
Toyota 190 0.8 1.4 7.50% 127.5 0.6
Daimler 88 0.6 1.6 7.80% 12.5 1
Volkswagen 60 0.3 0.6 6.10% 10.3 0.8
Honda 59 0.5 1 5.30% 45.3 0.6
Ford 56 0.4 2 4.40% 6.4 4.1
GM 55 0.4 1.6 3.30% 11.5 1.2
Industry Average (ex TESLA)
25 0.5 1.4 5.73% 35.6 1.38
The Price-to-sales and the price-to-book ratios shows how overvalued Tesla’s stock currently is in comparison with other peers within the Automobile industry. While Tesla’s operating margin is negative, we believe that once the company is able to break positive in its operations, it might have a significantly higher operating margin than any of its peers. We feel this would be the case, primarily because of how Tesla’s products are priced at a premium due to a number of positives that we have already discussed.
Another concern is Tesla’s high Debt-to-Equity ratio. To compete in a capital intensive industry such as this one, easy and cheap access to credit is crucial. With Tesla
already burdened considerably with existing debt, it leaves very little room for financial flexibility.
Any relative metric actually paints a dire picture than actually the case, primarily because of Tesla’s cash burn with its negative earnings and also because of its current high stock prices. In our view, the one of the few reasons for the high valuation is the fact that Tesla’s sales has grown at close to a ~100% CAGR in the last 3 years, which dwarfs the auto industry average of 10.2%.
We feel the if management is able to manage for the current cash burn in the process of scaling up operations, then that would be a first step towards growing into the high valuations.
ECONOMIC OUTLOOK
The emerging market demand
The emerging markets currently account for 75% of the world population but only ~45% of total world output15. There has been a recent slowdown in the emerging market growth recently, but living conditions and purchasing power of these economies has increased drastically in the past 2 decades as shown by the GDP per Capita increase in the chart below. With the increasing GDP per capita, and a rising middle class, there will be considerable demand for luxury vehicles. Another interesting aspect is that a majority of these nations happen to be net oil importers and in many cases forms a big portion of the country’s imports and consumer spending. Electric vehicles not only offers a cheaper and better alternative, it ensures that the consumers’ spending is put to use locally and does not leave the economy thus having a multiplier effect. Overall we think this is a solid long term trend in Tesla’s favor but one that will begin panning out in a decade.
Source: Morningstar

Page 7
Air Quality in the emerging markets
Rapid growth in the emerging markets has also been accompanied by long term environmental degradation as evidenced by the particulate concentration which is in part caused by vehicular emissions. As incomes rise, greater resources will probably be devoted to restore the environment, several countries have already announced measures to adopt greener and more environmentally friendly methods of transportation. Several nations have also offered tax credits and other incentives for people who adopt such means of transportation. China for example, has almost 230 million e-bikes, 83,000 e-cars and 36,500 e-buses already6. Given that several cities in emerging countries have the worst air quality in the world14, it is only a matter of time before other local governments adopt greener and cleaner modes of transportation. We believe this combined with a rise of the middle class will strongly drive demand for Tesla in the long term.
CATALYSTS FOR GROWTH
Government incentives: Government Incentives forms a key portion of the electric vehicles market. In the US, there are both supply side incentives: assistance to new manufacturers and new suppliers of EVs such as ATVM loans to automakers to build fuel efficient vehicles and demand side initiatives such as EV purchase tax credits, charging station tax credits and local/state financing15. More government incentives would obviously increase adoption of electric vehicles.
Charging and battery performance: One of the primary stumbling blocks for EVs has been the poor battery performance and the ease of charging. Tesla has been able to alleviate both these problems to some extent with a better battery and a super
charging network that is ever expanding. If the company can continue to increase the efficiency of its batteries and make the charging stations more easily accessible.
INVESTMENT POSITIVES
Tesla is definitely a great innovator and in CEO Elon Musk, have the man that has led Tesla through far bleak times.
The company’s steadfast focus on Electric Vehicles has already paid off with contracts with Daimler and Toyota for supplying powertrain components. The company’s powertrain design will only get better with time and we think will drive Tesla’s growth long term
Like with Model X, Model III will meet a direct mass market need i.e. an affordable electric vehicle with driving range comparable to conventional cars. If Model III is successfully brought to market within a reasonable amount of time, Tesla surely will be a major player.
The race for a highway capable autonomous vehicle is already on and it is a crowded field with technology and automobile companies vying to get their products out as soon as possible. But we think Tesla has a considerable advantage in that the company has already implemented its semi-autonomous software update on several cars and the more cars it sells the more data it collects. Combining this an affordable car driven by people everywhere and the data collection and the subsequent learning curve to autonomous implementation could be very short.
INVESTMENT NEGATIVES
Tesla currently operates in the red and it will be for some time (2018, by our estimates) before the company begins making positive earnings. In a capital intensive industry this makes it highly risky despite the fact that it has a low stock beta of 0.54.
The company is currently highly overvalued by pretty much any relative valuation metric and we do not see that changing anytime in the future.
VALUATION
We forecast Tesla’s growth in the Automobile segment as shown below:

Page 8
Year 2015E 2016E 2017E 2018E 2019E
Growth (%) 50.0% 50.0% 50.0% 40.0% 30.0%
Our 2015 to 2017 growth rate is based on the low end of the management estimates of 50% to 87% growth rate. We are also highly skeptical of the company’s ramp up in production facilities to meet the scale as evidenced by the frequent lowering of delivered units’ guidance by management as we have discussed earlier.
For the powertrain segment, we model an 18.7% growth rate y/y, in line with the expert estimates global growth outlook for EV market growth10.
Our COGS is modelled as 65.2% of total sales based on 2014 cost structure. We think given Tesla’s rapid growth over the past 5 years, the companies COGS would be most similar to 2014 than a 5 year average.
We model depreciation at 6.4% of beginning PPE of every year based on the prior 5 year average.
We also model a lower SG&A of 10.00% compared to a 4 year average of 30.10% of total. We believe that the company has been able to sufficiently manage its SG&A and with its factory fully functional, we think there will be little addition to its SG&A while the ramping up of production happens.
We also model a lower R&D as a percentage of sales at 11.30% during 2016 and 2017 as we think the bulk of the company’s R&D is already complete and we model an even lesser R&D expenditure after 2017, given the Model III launch.
We model interest expense at 4.6% of total sales and higher than the historical percentage as the company will continue to take on additional short term debt to meet its operating cash needs.
Although Tesla currently does not pay any income taxes in the US, it still recognizes a provision for income taxes for operations abroad. We model this at 0.17% of total sales.
We model Tesla to break into a positive bottom line in 2017 based on the ramping of Model S and Model X production.
We model PPE to grow at 106.52% year over year in 2015 and 2016, given the launch of the Gigafactory for Tesla’s Lithium-Ion battery factory. Beyond 2016, we still grow PPE at 25% as we think the bulk of Tesla’s PPE would be over by the time the Gigafactory becomes fully operational.
We also model a higher Short Term debt in 2015 and 2016 at 20.0% of total sales as we believe this to be vital for the company’s cash required for operations. We also model an even higher Short term Debt at 35.0% of total sales beginning in 2017 in order to maintain requisite levels of cash.
We also grow long term debt at 48% of total non-cash assets in order to maintain a constant capital level.
Our $186 target price is from our DCF which we believe to be an accurate fundamental valuation and also incorporates all of our assumption. We do not use a DDM as Tesla does not pay a dividend or even have positive earnings. For the same reason we do not use a relative P/E as well.
KEYS TO MONITOR
Despite a SELL recommendation, we think Tesla is still a promising company and would definitely like to revisit our valuations once the Model III is launched.
We also want to point out that any future government incentives for EV in general would also cause us to re-visit our assumptions.
A change in the CEO will also cause re-evaluate our growth assumptions.
REFERENCES
1. Tesla 2015- 10K 2. Digital Trends http://www.digitaltrends.com/cars/tesla-sends-supercharging-station-abuse-letter/ 3. Tesla Motors: Supercharger 4. Bloomberg News: http://www.bloomberg.com/news/articles/2015-08-05/elon-musk-has-a-production-problem 5. Forbes News: http://www.forbes.com/sites/joannmuller/2013/06/01/what-do-toyota-and-mercedes-see-in-tesla-a-bit-of-themselves/
Page 9
6. IEA website: http://www.iea.org/evi/Global-EV-Outlook-2015-Update_1page.pdf 7. Seeking Alpha: http://seekingalpha.com/article/3642146-tesla-motors-tsla-elon-reeve-musk-on-q3-2015-results-earnings-call-transcript?part=single 8. IB Times http://www.ibtimes.com/tesla-model-x-release-date-superficial-production-next-year-deliveries-customers-full-effect-later 9. Wikipedia https://en.wikipedia.org/wiki/Tesla_Model_X 10. Green Car Congress: http://www.greencarcongress.com/forecasts/ 11. IBIS World Industry Reports 12. Green Biz: http://www.greenbiz.com/article/apple-google-tesla-and-race-electric-self-driving-cars 13. Industry Week: http://www.industryweek.com/emerging-technologies/daimler-audi-bmw-gm-lead-autonomous-vehicles-study 14. The Economist: http://www.economist.com/blogs/dailychart/2011/08/emerging-vs-developed-economies 15. IEDC Online: http://www.iedconline.org/clientuploads/Downloads/edrp/IEDC_Electric_Vehicle_Industry.pdf
IMPORTANT DISCLAIMER
Henry Fund reports are created by student enrolled in the Applied Securities Management (Henry Fund) program at the University of Iowa’s Tippie School of Management. These reports are intended to provide potential employers and other interested parties an example of the analytical skills, investment knowledge, and communication abilities of Henry Fund students. Henry Fund analysts are not registered investment advisors, brokers or officially licensed financial professionals. The investment opinion contained in this report does not represent an offer or solicitation to buy or sell any of the aforementioned securities. Unless otherwise noted, facts and figures included in this report are from publicly available sources. This report is not a complete compilation of data, and its accuracy is not guaranteed. From time to time, the University of Iowa, its faculty, staff, students, or the Henry
Fund may hold a financial interest in the companies mentioned in this report.

$186.29 0.48 0.5 0.52 0.54 0.56 0.58 0.6 0.62
2.75% 161.09 161.09 161.09 161.09 161.09 161.09 161.09 161.09
3.00% 168.74 168.74 168.74 168.74 168.74 168.74 168.74 168.74
3.25% 177.10 177.10 177.10 177.10 177.10 177.10 177.10 177.10
3.50% 186.29 186.29 186.29 186.29 186.29 186.29 186.29 186.29
3.75% 196.42 196.42 196.42 196.42 196.42 196.42 196.42 196.42
4.00% 207.65 207.65 207.65 207.65 207.65 207.65 207.65 207.65
4.25% 220.18 220.18 220.18 220.18 220.18 220.18 220.18 220.18
4.50% 234.23 234.23 234.23 234.23 234.23 234.23 234.23 234.23
$186.29 0.48 0.5 0.52 0.54 0.56 0.58 0.6 0.62
2.25% 240.14 240.14 240.14 240.14 240.14 240.14 240.14 240.14
2.50% 220.62 220.62 220.62 220.62 220.62 220.62 220.62 220.62
2.75% 202.96 202.96 202.96 202.96 202.96 202.96 202.96 202.96
3.00% 186.90 186.90 186.90 186.90 186.90 186.90 186.90 186.90
3.25% 172.25 172.25 172.25 172.25 172.25 172.25 172.25 172.25
3.50% 158.83 158.83 158.83 158.83 158.83 158.83 158.83 158.83
3.75% 146.49 146.49 146.49 146.49 146.49 146.49 146.49 146.49
4.00% 135.12 135.12 135.12 135.12 135.12 135.12 135.12 135.12
$186.29 20.00% 21.00% 22.00% 23.00% 24.00% 25.00% 26.00% 27.00%
8.00% 269.10 262.33 255.46 248.51 241.47 234.33 227.11 219.79
9.00% 245.08 238.30 231.44 224.49 217.45 210.31 203.09 195.77
10.00% 221.06 214.28 207.42 200.47 193.42 186.29 179.06 171.75
11.00% 197.03 190.26 183.40 176.44 169.40 162.27 155.04 147.72
12.00% 173.01 166.24 159.37 152.42 145.38 138.24 131.02 123.70
13.00% 148.99 142.21 135.35 128.40 121.35 114.22 106.99 99.68
14.00% 124.96 118.19 111.33 104.37 97.33 90.20 82.97 75.65
15.00% 100.94 94.17 87.30 80.35 73.31 66.17 58.95 51.63SG&A
2017 PPE
CV Growth Rate
Beta
Risk Free Rate
Beta
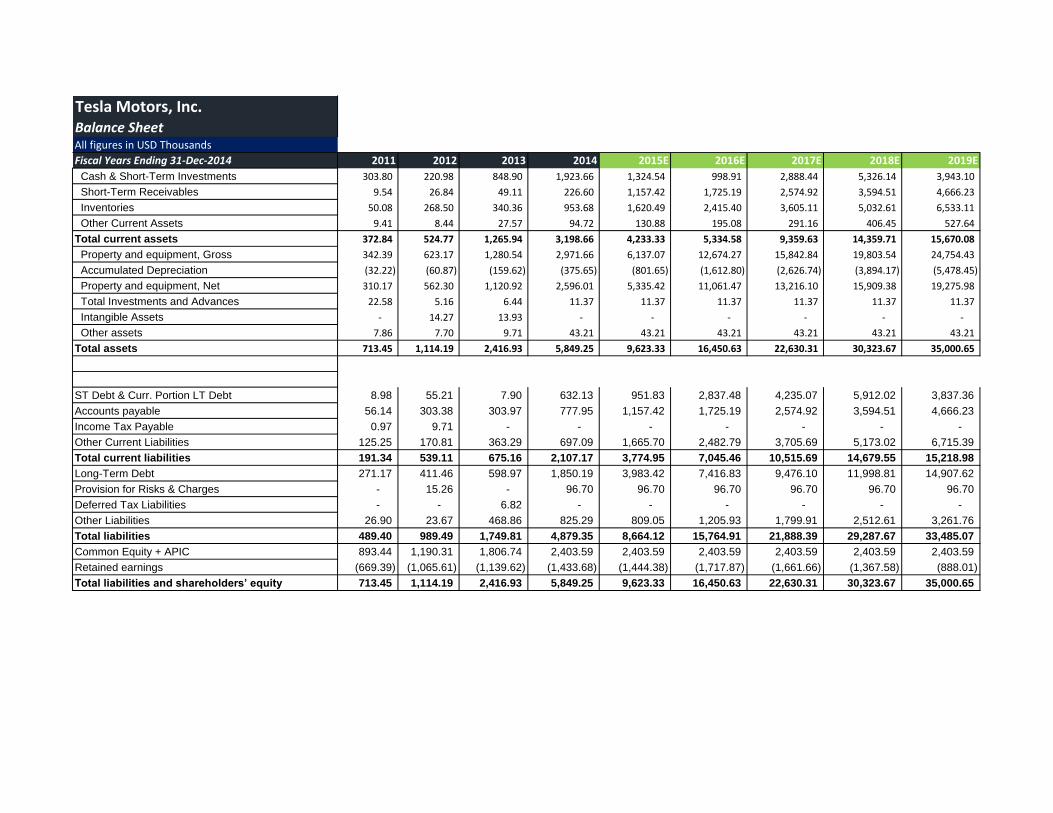
Tesla Motors, Inc.Balance SheetAll figures in USD Thousands
Fiscal Years Ending 31-Dec-2014 2011 2012 2013 2014 2015E 2016E 2017E 2018E 2019E
Cash & Short-Term Investments 303.80 220.98 848.90 1,923.66 1,324.54 998.91 2,888.44 5,326.14 3,943.10
Short-Term Receivables 9.54 26.84 49.11 226.60 1,157.42 1,725.19 2,574.92 3,594.51 4,666.23
Inventories 50.08 268.50 340.36 953.68 1,620.49 2,415.40 3,605.11 5,032.61 6,533.11
Other Current Assets 9.41 8.44 27.57 94.72 130.88 195.08 291.16 406.45 527.64
Total current assets 372.84 524.77 1,265.94 3,198.66 4,233.33 5,334.58 9,359.63 14,359.71 15,670.08
Property and equipment, Gross 342.39 623.17 1,280.54 2,971.66 6,137.07 12,674.27 15,842.84 19,803.54 24,754.43
Accumulated Depreciation (32.22) (60.87) (159.62) (375.65) (801.65) (1,612.80) (2,626.74) (3,894.17) (5,478.45)
Property and equipment, Net 310.17 562.30 1,120.92 2,596.01 5,335.42 11,061.47 13,216.10 15,909.38 19,275.98
Total Investments and Advances 22.58 5.16 6.44 11.37 11.37 11.37 11.37 11.37 11.37
Intangible Assets - 14.27 13.93 - - - - - -
Other assets 7.86 7.70 9.71 43.21 43.21 43.21 43.21 43.21 43.21
Total assets 713.45 1,114.19 2,416.93 5,849.25 9,623.33 16,450.63 22,630.31 30,323.67 35,000.65
ST Debt & Curr. Portion LT Debt 8.98 55.21 7.90 632.13 951.83 2,837.48 4,235.07 5,912.02 3,837.36
Accounts payable 56.14 303.38 303.97 777.95 1,157.42 1,725.19 2,574.92 3,594.51 4,666.23
Income Tax Payable 0.97 9.71 - - - - - - -
Other Current Liabilities 125.25 170.81 363.29 697.09 1,665.70 2,482.79 3,705.69 5,173.02 6,715.39
Total current liabilities 191.34 539.11 675.16 2,107.17 3,774.95 7,045.46 10,515.69 14,679.55 15,218.98
Long-Term Debt 271.17 411.46 598.97 1,850.19 3,983.42 7,416.83 9,476.10 11,998.81 14,907.62
Provision for Risks & Charges - 15.26 - 96.70 96.70 96.70 96.70 96.70 96.70
Deferred Tax Liabilities - - 6.82 - - - - - -
Other Liabilities 26.90 23.67 468.86 825.29 809.05 1,205.93 1,799.91 2,512.61 3,261.76
Total liabilities 489.40 989.49 1,749.81 4,879.35 8,664.12 15,764.91 21,888.39 29,287.67 33,485.07
Common Equity + APIC 893.44 1,190.31 1,806.74 2,403.59 2,403.59 2,403.59 2,403.59 2,403.59 2,403.59
Retained earnings (669.39) (1,065.61) (1,139.62) (1,433.68) (1,444.38) (1,717.87) (1,661.66) (1,367.58) (888.01)
Total liabilities and shareholders’ equity 713.45 1,114.19 2,416.93 5,849.25 9,623.33 16,450.63 22,630.31 30,323.67 35,000.65

Tesla Motors, Inc.Income StatementAll figures in USD Millions
Fiscal Years Ending Dec-31-2014 2011 2012 2013 2014 2015E 2016E 2017E 2018E 2019E
Sales 204.24 413.26 2,013.50 3,198.36 4,759.1 7,093.7 10,587.7 14,780.1 19,186.8
COGS excluding D&A (125.73) (354.36) (1,451.15) (2,084.75) (3,103.0) (4,625.1) (6,903.2) (9,636.6) (12,509.8)
Depreciation & Amortization Expense (16.92) (28.83) (106.08) (231.93) (426) (811) (1,014) (1,267) (1,584)
Gross Income 61.60 30.07 456.26 881.67 1,230.18 1,657.45 2,670.57 3,876.03 5,092.73
SG&A Expense (104.10) (150.37) (285.57) (603.66) (475.91) (709.37) (1,058.77) (1,478.01) (1,918.68)
Research & Development (208.98) (273.98) (231.98) (464.70) (537.78) (801.59) (1,016.42) (1,418.88) (1,841.93)
EBIT (Operating Income) (251.49) (394.28) (61.28) (186.69) 216.5 146.5 595.4 979.1 1,332.1
Nonoperating Income - Net 0.41 0.31 12.10 2.94 - - - - -
Interest Expense (0.04) (0.25) (22.13) (100.89) (219) (408) (521) (660) (820)
Unusual Expense - Net (2.80) (1.85) (0.11) - - - - - -
Pretax Income (253.92) (396.08) (71.43) (284.64) (2.60) (261.43) 74.20 319.21 512.19
Provision for Income Taxes (0.49) (0.14) (2.59) (9.40) (8.09) (12.06) (18.00) (25.13) (32.62)
Net Income available to Common (254.41) (396.21) (74.01) (294.04) (10.69) (273.49) 56.20 294.08 479.58
EPS (recurring) (2.51) (3.68) (0.62) (2.36) (0.09) (2.18) 0.45 2.34 3.82
Total Shares Outstanding 105 114.21 123.09 125.69 125.69 125.69 125.69 125.69 125.69

Tesla Motors, Inc.Revenue Decomposition
All figures in USD Millions
Fiscal Years Ending Dec-31-2014 2011 2012 2013 2014 2015E 2016E 2017E 2018E 2019E
Product Segment Revenue Breakdown
Vehicle, options and relate sales 101.71 354.34 1,952.68 3,079.42 4,619.12 6,928.68 10,393.03 14,550.24 18,915.31
Powertrain Component and related sales 46.86 31.36 45.10 113.31 134.38 159.38 189.02 224.18 265.88
Development Services 55.67 27.56 15.71 5.63 5.63 5.63 5.63 5.63 5.63
Total Sales 204.24 413.26 2,013.50 3,198.36 4,759.14 7,093.70 10,587.68 14,780.05 19,186.82
Segment Growth
Vehicle, options and relate sales 248% 451% 58% 50% 50% 50% 40% 30%
Powertrain Component and related sales -33% 44% 151% 19% 19% 19% 19% 19%
Development Services -51% -43% -64% 0% 0% 0% 0% 0%
Total Sales 102.3% 387.2% 58.8% 48.8% 49.1% 49.3% 39.6% 29.8%

Tesla Motors, Inc.Cash Flow StatementAll figures in USD ThousandsFiscal Years Ending Dec-31-2014 2015E 2016E 2017E 2018E 2019E
OPERATING ACTIVITIES
Net Income / Starting Line -10.7 -273.5 56.2 294.1 479.6
Depreciation, Depletion & Amortization 426.0 811.2 1013.9 1267.4 1584.3
Changes in Working Capital 34.0 1,843.6 1,334.7 1,601.5 (2,154.0)
Operating Activities - Net Cash Flow 449.30 2381.29 2404.85 3162.99 -90.12
INVESTING ACTIVITIES
Capital Expenditures (3,165.4) (6,537.2) (3,168.6) (3,960.7) (4,950.9)
Other Funds 0 0 0 0 0
Purchase/Sale of Investments - - - - -
Investing Activities - Net Cash Flow (3,165.4) (6,537.2) (3,168.6) (3,960.7) (4,950.9)
FINANCING ACTIVITIES
Change in Capital Stock - - - - -
Issuance/Reduction of Debt, Net 2,116.99 3,830.28 2,653.25 3,235.42 3,657.96
Other Funds - - - - -
Financing Activities - Net Cash Flow 2,116.99 3,830.28 2,653.25 3,235.42 3,657.96
Change in Cash (599.12) (325.63) 1,889.53 2,437.70 (1,383.04)
Cash at the Beginning of the year 1,923.66 1,324.54 998.91 2,888.44 5,326.14
Cash at the end of the year 1,324.54 998.91 2,888.44 5,326.14 3,943.10

Tesla Motors, Inc.Common Size Balance Sheet
Fiscal Years Ending Dec-31-2014 2011 2012 2013 2014 2015 2016 2017 2018 2019
Cash & Short-Term Investments 148.75% 53.47% 42.16% 60.15% 27.83% 14.08% 27.28% 36.04% 20.55%
Short-Term Receivables 4.67% 6.50% 2.44% 7.09% 24.32% 24.32% 24.32% 24.32% 24.32%
Inventories 24.52% 64.97% 16.90% 29.82% 34.05% 34.05% 34.05% 34.05% 34.05%
Other Current Assets 4.61% 2.04% 1.37% 2.96% 2.75% 2.75% 2.75% 2.75% 2.75%
Total current assets 182.55% 126.98% 62.87% 100.01% 88.95% 75.20% 88.40% 97.16% 81.67%
Property and equipment, Gross 167.64% 150.80% 63.60% 92.91% 128.95% 178.67% 149.63% 133.99% 129.02%
Accumulated Depreciation -15.78% -14.73% -7.93% -11.74% -16.84% -22.74% -24.81% -26.35% -28.55%
Property and equipment, Net 151.86% 136.07% 55.67% 81.17% 112.11% 155.93% 124.83% 107.64% 100.46%
Total Investments and Advances 11.05% 1.25% 0.32% 0.36% 0.24% 0.16% 0.11% 0.08% 0.06%
Intangible Assets 0.00% 3.45% 0.69% 0.00% 0.00% 0.00% 0.00% 0.00% 0.00%
Other assets 3.85% 1.86% 0.48% 1.35% 0.91% 0.61% 0.41% 0.29% 0.23%
Total assets 349.32% 269.61% 120.04% 182.88% 202.21% 231.90% 213.74% 205.17% 182.42%
ST Debt & Curr. Portion LT Debt 4.40% 13.36% 0.39% 19.76% 20.00% 40.00% 40.00% 40.00% 20.00%
Accounts payable 27.49% 73.41% 15.10% 24.32% 24.32% 24.32% 24.32% 24.32% 24.32%
Income Tax Payable 0.47% 2.35% 0.00% 0.00% 0.00% 0.00% 0.00% 0.00% 0.00%
Other Current Liabilities 61.32% 41.33% 18.04% 21.80% 35.00% 35.00% 35.00% 35.00% 35.00%
Total current liabilities 93.68% 130.45% 33.53% 65.88% 79.32% 99.32% 99.32% 99.32% 79.32%
Long-Term Debt 132.77% 99.57% 29.75% 57.85% 83.70% 104.56% 89.50% 81.18% 77.70%
Provision for Risks & Charges 0.00% 3.69% 0.00% 3.02% 2.03% 1.36% 0.91% 0.65% 0.50%
Deferred Tax Liabilities 0.00% 0.00% 0.34% 0.00% 0.00% 0.00% 0.00% 0.00% 0.00%
Other Liabilities 13.17% 5.73% 23.29% 25.80% 17.00% 17.00% 17.00% 17.00% 17.00%
Total liabilities 239.62% 239.44% 86.90% 152.56% 182.05% 222.24% 206.73% 198.16% 174.52%
Common Equity + APIC 437.44% 288.03% 89.73% 75.15% 50.50% 33.88% 22.70% 16.26% 12.53%
Retained earnings -327.74% -257.86% -56.60% -44.83% -30.35% -24.22% -15.69% -9.25% -4.63%
Total liabilities and shareholders’ equity 349.32% 269.61% 120.04% 182.88% 202.21% 231.90% 213.74% 205.17% 182.42%

Tesla Motors, Inc.Common Size Income Statement
Fiscal Years Ending Dec-31-2014 2011 2012 2013 2014 2015 2016 2017 2018 2019
Sales 100.00% 100.00% 100.00% 100.00% 100.00% 100.00% 100.00% 100.00% 100.00%
COGS excluding D&A -61.56% -85.75% -72.07% -65.18% -65.20% -65.20% -65.20% -65.20% -65.20%
Depreciation & Amortization Expense -8.28% -6.98% -5.27% -7.25% -8.95% -11.43% -9.58% -8.58% -8.26%
Gross Income 30.16% 7.28% 22.66% 27.57% 25.85% 23.37% 25.22% 26.22% 26.54%
SG&A Expense -50.97% -36.39% -14.18% -18.87% -10.00% -10.00% -10.00% -10.00% -10.00%
Research & Development -102.32% -66.30% -11.52% -14.53% -11.30% -11.30% -9.60% -9.60% -9.60%
EBIT (Operating Income) -123.13% -95.41% -3.04% -5.84% 4.55% 2.07% 5.62% 6.62% 6.94%
Nonoperating Income - Net 0.20% 0.08% 0.60% 0.09% 0.00% 0.00% 0.00% 0.00% 0.00%
Interest Expense -0.02% -0.06% -1.10% -3.15% -4.60% -5.75% -4.92% -4.47% -4.27%
Unusual Expense - Net -1.37% -0.45% -0.01% 0.00% 0.00% 0.00% 0.00% 0.00% 0.00%
Pretax Income -124.32% -95.84% -3.55% -8.90% -0.05% -3.69% 0.70% 2.16% 2.67%
Provision for Income Taxes -0.24% -0.03% -0.13% -0.29% -0.17% -0.17% -0.17% -0.17% -0.17%
Net Income available to Common -124.56% -95.88% -3.68% -9.19% -0.22% -3.86% 0.53% 1.99% 2.50%
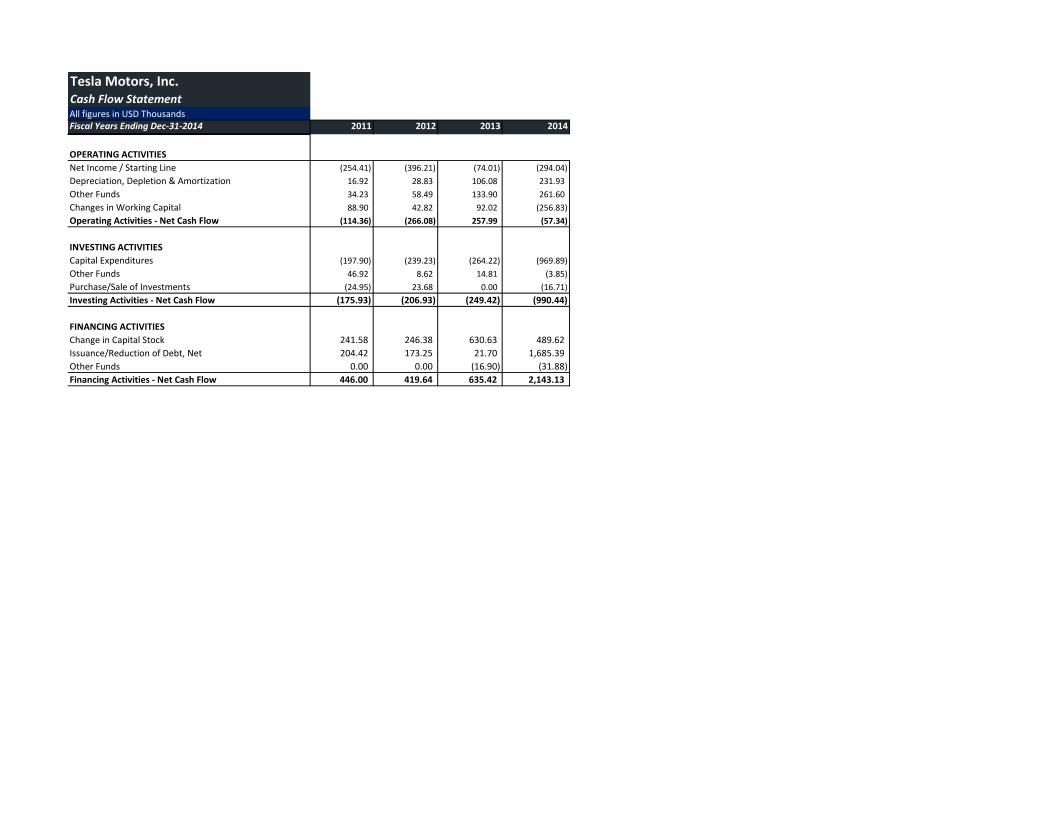
Tesla Motors, Inc.Cash Flow StatementAll figures in USD ThousandsFiscal Years Ending Dec-31-2014 2011 2012 2013 2014
OPERATING ACTIVITIES
Net Income / Starting Line (254.41) (396.21) (74.01) (294.04)
Depreciation, Depletion & Amortization 16.92 28.83 106.08 231.93
Other Funds 34.23 58.49 133.90 261.60
Changes in Working Capital 88.90 42.82 92.02 (256.83)
Operating Activities - Net Cash Flow (114.36) (266.08) 257.99 (57.34)
INVESTING ACTIVITIES
Capital Expenditures (197.90) (239.23) (264.22) (969.89)
Other Funds 46.92 8.62 14.81 (3.85)
Purchase/Sale of Investments (24.95) 23.68 0.00 (16.71)
Investing Activities - Net Cash Flow (175.93) (206.93) (249.42) (990.44)
FINANCING ACTIVITIES
Change in Capital Stock 241.58 246.38 630.63 489.62
Issuance/Reduction of Debt, Net 204.42 173.25 21.70 1,685.39
Other Funds 0.00 0.00 (16.90) (31.88)
Financing Activities - Net Cash Flow 446.00 419.64 635.42 2,143.13

Tesla Motors, Inc.Value Driver EstimationAll figures in USD ThousandsFiscal Years Ending Dec-31-2014 2011 2012 2013 2014 2015E 2016E 2017E 2018E 2019E
Net Sales 204 413 2,013 3,198 4,759 7,094 10,588 14,780 19,187
Cost of Goods Sold (after Depreciation removed) (126) (354) (1,451) (2,085) (3,103) (4,625) (6,903) (9,637) (12,510)
Selling, General & Administrative Expenses (104) (150) (286) (604) (476) (709) (1,059) (1,478) (1,919)
Depreciation & Amortization (17) (29) (106) (232) (426) (811) (1,014) (1,267) (1,584)
Add: Operating Lease Interest 3 5 9 22 22 22 22 22 22
Adjusted EBITA (39) (115) 180 300 777 971 1,634 2,420 3,196
Adjusted Taxes
Provision for Income Taxes 0 0 3 9 8 12 18 25 33
Add: Tax Shield on Interest Expense 0 - - - - - - - -
Add: Tax Shield on Implied Lease Interest 1 2 3 8 8 8 8 8 8
Less: Tax Shield on Other Income (Loss) - - - - - - - - -
Total Adjusted Taxes 2 2 6 17 16 20 26 33 40
Plus: Change in Deferred Tax Assets/Liabilities
Current Year Deferred Tax Assets - - - - - - - - -
Current Year Deferred Tax Liabilities - - 7 - - - - - -
Previous Year Deferred Tax Assets - - - - - - - - -
Previous Year Deferred Tax Liabilities - - - 7 - - - - -
Net Change in Deferred Taxes - - 7 (7) - - - - -
EBITA (39) (115) 180 300 777 971 1,634 2,420 3,196
Less: Total Adjusted Taxes 2 2 6 17 16 20 26 33 40
Add: Change in Deferred Taxes - - 7 (7) - - - - -
NOPLAT (38) (113) 192 311 793 990 1,660 2,453 3,237
Invested Capital Computation
Operating Current Assets:
Normal Cash 19 26 63 160 212 267 468 718 784
Accounts Receivable, Net 10 27 49 227 1,157 1,725 2,575 3,595 4,666
Inventory 50 269 340 954 1,620 2,415 3,605 5,033 6,533
Prepaid Expenses & Operating Current Assets 9 8 28 95 131 195 291 406 528
Total Operating Current Assets 88 330 480 1,435 3,120 4,602 6,939 9,752 12,510
Operating Current Liabilities:
Accounts Payable 56 303 304 778 1,157 1,725 2,575 3,595 4,666
Other liabilities 125 171 363 697 1,666 2,483 3,706 5,173 6,715
Total Operating Current Liabilities 181 474 667 1,475 2,823 4,208 6,281 8,768 11,382
Net Operating Working Capital (94) (144) (187) (40) 297 394 659 984 1,129
Net PPE 310 562 1,121 2,596 5,335 11,061 13,216 15,909 19,276
Total Investments and Advances 23 5 6 11 11 11 11 11 11
Other assets 7.863 7.696 9.707 43.209 43.209 43.209 43.209 43.209 43.209
PV of Operating Leases 42 45 74 129 320 320 320 320 320
Other Operating LT Assets 72 58 90 184 375 375 375 375 375
Deferred Tax Liabilities - - 7 - - - - - -
Other Operating LT Liabilities - - 7 - - - - - -
Invested Capital
Add: Net Operating Working Capital (94) (144) (187) (40) 297 394 659 984 1,129
Add: Net PPE 310 562 1,121 2,596 5,335 11,061 13,216 15,909 19,276
Add: Other Operating LT Assets 72 58 90 184 375 375 375 375 375
Less: Other Operating LT Liabilities - - (7) - - - - - -
Total Invested Capital 289 476 1,017 2,740 6,008 11,831 14,250 17,268 20,780
Return on Invested Capital
NOPLAT (38) (113) 192 311 793 990 1,660 2,453 3,237
/ Beginning Invested Capital 289 476 1,017 2,740 6,008 11,831 14,250 17,268
ROIC -39.2% 40.4% 30.6% 28.9% 16.5% 14.0% 17.2% 18.7%
Economic Profit
Beginning Invested Capital 289 476 1,017 2,740 6,008 11,831 14,250 17,268
ROIC -39.2% 40.4% 30.6% 28.9% 16.5% 14.0% 17.2% 18.7%
WACC 8.6% 8.6% 8.6% 8.6% 8.6% 8.6% 8.6% 8.6%
Economic Profit [Beg IC*(ROIC-WACC)] (138) 151 223 557 474 643 1,228 1,752
FCF
NOPLAT (113) 192 311 793 990 1,660 2,453 3,237
Add: Beg Invested Capital 289 476 1,017 2,740 6,008 11,831 14,250 17,268
Less: Current Invested Capital 476 1,017 2,740 6,008 11,831 14,250 17,268 20,780
FCF (301) (349) (1,412) (2,475) (4,833) (759) (565) (274)
Average Marginal Tax Rate
WACC

Present Value of Operating Lease Obligations (2014) Present Value of Operating Lease Obligations (2013) Present Value of Operating Lease Obligations (2012) Present Value of Operating Lease Obligations (2011) Present Value of Operating Lease Obligations (2010)
Operating Operating Operating Operating
Fiscal Years Ending Dec. 31 Leases Fiscal Years Ending 42061 Leases Fiscal Years Ending Leases Fiscal Years Ending Leases Fiscal Years Ending Leases
2015 56.522 2014 27.0 2013 13.9 2012 8.5 2011 6.8
2016 60.136 2015 27.4 2014 14.3 2013 8.5 2012 6.6
2017 56.566 2016 26.6 2015 13.7 2014 8.2 2013 6.6
2018 48.959 2017 24.7 2016 20.0 2015 7.3 2014 6.4
2019 & Thereafter 184.6 2018 & Thereafter 55.8 2017 & Thereafter 30.8 2016 & Thereafter 24.3 2015 & Thereafter 27.0
Total Minimum Payments 406.783 Total Minimum Payments 161.5 Total Minimum Payments 92.6 Total Minimum Payments 56.8 Total Minimum Payments 53.4
Less: Interest 86 Less: Interest 32.0 Less: Interest 18.8 Less: Interest 11.8 Less: Interest 11.8
PV of Minimum Payments 320 PV of Minimum Payments 129 PV of Minimum Payments 74 PV of Minimum Payments 45 PV of Minimum Payments 42
Capitalization of Operating Leases Capitalization of Operating Leases Capitalization of Operating Leases Capitalization of Operating Leases Capitalization of Operating Leases
Pre-Tax Cost of Debt 7.00% Pre-Tax Cost of Debt 7.00% Pre-Tax Cost of Debt 7.00% Pre-Tax Cost of Debt 7.00% Pre-Tax Cost of Debt 7.00%
Number Years Implied by Year 6 Payment 3.8 Number Years Implied by Year 6 Payment 2.3 Number Years Implied by Year 6 Payment 1.5 Number Years Implied by Year 6 Payment 3.3 Number Years Implied by Year 6 Payment 4.2
Lease PV Lease Lease PV Lease Lease PV Lease Lease PV Lease Lease PV Lease
Year Commitment Payment Year Commitment Payment Year Commitment Payment Year Commitment Payment Year Commitment Payment
1 56.522 52.8 1 27.004 25.2 1 13.866 13.0 1 8.48 7.9 1 6.793 6.3
2 60.136 52.5 2 27.372 23.9 2 14.298 12.5 2 8.489 7.4 2 6.625 5.8
3 56.566 46.2 3 26.621 21.7 3 13.692 11.2 3 8.163 6.7 3 6.561 5.4
4 48.959 37.4 4 24.706 18.8 4 19.967 15.2 4 7.33 5.6 4 6.431 4.9
5 184.6 131.6 5 55.785 39.8 5 30.816 22.0 5 24.306 17.3 5 27.021 19.3
PV of Minimum Payments 320.5 PV of Minimum Payments 129.5 PV of Minimum Payments 73.8 PV of Minimum Payments 44.9 PV of Minimum Payments 41.7

Marginal Tax Rate 35.00%
Cost of equity Calculation
Risk Free Rate 3.01% Link
+
Beta* 1.28
Market Risk Premium 4.85%
= Cost of Equity 9.22%
WACC Calculation All figures in millions
Shares outstanding* 129.800
MV of share $232.36
=Total MV of Equity [E] 30,160.33$
MV of debt [D] 3,307.61
Cost of Debt 4.55%
MV of equity 30,160.33$
+
MV of debt 3,307.61$
= MV of the firm [V] 33,467.94$
Cost of Equity * 9.22%
(E/V) 90.12%
+
Cost of Debt * 4.55%
(1-Marginal tax Rate) 65.00%
(D/V) 9.88%
= WACC 8.60%
YTM on bonds that mature in 2041
Tesla Motors, Inc.Weighted Average Cost of Capital (WACC) Estimation

Key Inputs:
CV Growth 3.50%
CV ROIC 18.74%
WACC 8.60%
Cost of Equity 9.22%
Fiscal Years Ending 42061 2015E 2016E 2017E 2018E 2019E
DCF Model
Discount period 1 2 3 4 5
NOPLAT 793 990 1660 2453 3237
Continuing Value 51,626
PV of Continuing Value 37,116
Free Cash Flow -2475 -4833 -759 -565 -274
PV of free cash flows -2279 -4098 -592 -406
Value of Operations 29740
Non Operating Assets
ST Investments 55
Excess Cash 1113
Value of Non Operating Assets 1167
Non Operating Liabilities
PV of Operating Leases 320
Total Debt 3983
PV of Pension Obligations
PV of employee stock options 3190
Value of Non Operating Liabilities 7494
Equity Value 23414
Shares outstanding 126
Intrinsic Share Price 186.29
EP Model
Periods to discount 1 2 3 4 5
Economic Profit 557 474 643 1228 1752
PV of Terminal Year EP 20374
PV of Incremental Reinvested EP 13984
Continuing Value 34358
PV of continuing value 24701
PV of Economic Profit 513 402 502 883
Initial Invested Capital 6008
Value of Operations 33008
Non Operating Assets
Excess Cash 3329
Value of Non Operating Assets 3329
Non Operating Liabilities
PV of Operating Leases 320
Total Debt 4080
PV of employee stock options 4992
Value of Non Operating Liabilities 9393
Equity Value 23414
Shares outstanding 126
Intrinsic Share Price 186.29
Tesla Motors, Inc.
Discounted Cash Flow (DCF) and Economic Profit (EP) Valuation Models

Tesla Motors, Inc.
Key Management Ratios
Fiscal Years Ending Dec-31-2014 2011 2012 2013 2014 2015E 2016E 2017E 2018E 2019E
Liquidity Ratios
Current Ratio (Current Assets/ Current Liabilities) 1.95 0.97 1.88 1.52 1.12 0.76 0.89 0.98 1.03
Operating Cash Flow Ratio (Operating CF/ Current Liabilities) -0.60 -0.49 0.38 -0.03 0.12 0.34 0.23 0.22 -0.01
Quick Ratio (current assets – inventories) / current liabilities -0.21 -0.48 -0.46 -0.41 -0.39 -0.32 -0.32 -0.32 -0.39
Activity or Asset-Management Ratios
Asset Turnover Ratio (Sales/Total Assets) 29% 37% 83% 55% 49% 43% 47% 49% 55%
Inventory Turnover Ratio (Sales/Total Inventory) 4.1 1.5 5.9 3.4 2.9 2.9 2.9 2.9 2.9
Receivables Turnover Ratio (Sales/Average Accounts Receivable) 11.2 10.9 14.6 4.6 3.3 3.3 3.4 3.6 4.1
Financial Leverage Ratios
Debt-to-Equity Ratio (Total Debt/Total Equity) 1.25 3.74 0.91 2.56 5.15 14.95 18.48 17.29 12.37
Equity Ratio (Shareholders Equity/ Total Assets) 0.31 0.11 0.28 0.17 0.10 0.04 0.03 0.03 0.04
Interest Coverage (Operating Income) / (Interest Expense) N/A N/A N/A N/A -0.99 -0.36 -1.14 -1.48 -1.62
Profitability Ratios
Return on Assets (Net Income/Total Assets) -35.7% -35.6% -3.1% -5.0% -0.1% -1.7% 0.2% 1.0% 1.4%
Return on Equity (Net Income/Shareholders Equity) -113.6% -317.7% -11.1% -30.3% -1.1% -39.9% 7.6% 28.4% 31.6%
Gross Margin (Revenue-COGS)/COGS 30.2% 7.3% 22.7% 27.6% 25.8% 23.4% 25.2% 26.2% 26.5%
EBIT Margin (EBIT/Sales) -123.1% -95.4% -3.0% -5.8% 4.5% 2.1% 5.6% 6.6% 6.9%
Profit Margin (Net Income/Sales) -124.6% -95.9% -3.7% -9.2% -0.2% -3.9% 0.5% 2.0% 2.5%
Payout Policy Ratios
Payout Ratio (Dividend Payout Ratio)
Total Payout Ratio (Dividends paid + Repurchases)/NI