test and development of microcapsules for rigid...
TRANSCRIPT

UNIVERSIDADE DE LISBOA
FACULDADE DE CIÊNCIAS
QUÍMICA E BIOQUÍMICA
Test and Development of Microcapsules for
Rigid Polyurethane Foam
Mestrado em Química Tecnológica
Dissertação Pública
Mónica de Jesus Veiga Loureiro
Dissertação orientada por:
Professora Doutora Maria José Vitoriano Lourenço (DQB/FCUL)
Doutora Ana Clara Lopes Marques (Greenseal Research, Ltd)

i

ii
Acknowledgement:
This thesis presents the work developed in a nine-month internship at Greenseal
Research Ltd. Its elaboration had the crucial support, dedication and patience of
several people.
To begin, I want to thank to Prof. Maria José Lourenço for all the support regarding
scientific knowledge and for providing me the opportunity to contact with Greenseal
Research.
I would like to thank Dr. Aster De Schrijver for the opportunity to develop my work at
Greenseal Research, and to all his team, in special Dra. Ana Clara Marques, who
supervised my work and provided me all the support I needed during this internship.
Also, I would like to thank Prof. João Bordado, for the scientific knowledge and all his
team for the laboratorial support provided.
To my family and friends, Ana Rita Antunes, Inês Sebastião, Cláudia Oliveira, Mónica
Araújo and Andreia Sofia, I would like to thank all the support, patient and
encouragement during this important step in my life.
Finally, I would like to thank to José Rodrigues for being my listener, for giving me his
time and support and for being there when I needed the most.

iii

iv
Abstract
The main purpose of this work was to produce microcapsules, with an encapsulated
curing agent, to incorporate in one component polyurethane foams, in order to
accelerate the foam curing process.
During this work, inorganic silica based microcapsules and also those organically
modified (hybrid composition) were produced, by an approach that combines the
micro-emulsion technique with the sol-gel method. Varied newly developed shell
compositions have been screened and assessed. In particular, the addition of silicones
and cork powder to the synthesis was studied, in an attempt to combine and achieve
desired properties. Also, several reactional parameters were studied, in order to
optimize the microencapsulation process and microcapsule features, reduce the
synthesis costs and increase the reaction yield. In a final part of this work, a “pre-scale-
up” of a previous selected synthesis was made.
All the microcapsules were subjected to physical and chemical characterization
technics. Scanning electron microscope, SEM, analysis was used to characterize the
microcapsules regarding their morphology, size and agglomeration. The Fourier
transform infrared spectroscopy, FTIR, characterization was useful to understand the
molecular structure of the shell, in order to confirm the presence of certain reactional
groups. The FTIR technique has also enabled to compare, between different syntheses,
the amount of glycerol that was encapsulated, however the thermogravimetric
analysis, TGA, characterization was fundamental to have a precise notion of its
amount. The other characterization techniques employed in this work had been
previously developed at Greenseal Research and were aimed at studying the leaching
of the encapsulated compound, as well as evaluating the effect of the microcapsules
on the OCF foams.
The hybrid (organically modified) microcapsules did not have a perfect spherical shape
and most of them were agglomerated. Nevertheless, they exhibited a lower leaching,
when comparing with inorganic silica based ones, and, in some cases, the amount of
encapsulated glycerol was almost the same.

v
Finally, the silica based microcapsules with a second shell of amino-functional silica
were found to be the best choice to apply in polyurethane foams, since the
microcapsules had a perfect spherical shape, were not very aggregated, were poly-
nucleated, did not exhibit significant leaching and led to a significant increase in the
curing rate.
Key Words: Microcapsules; Sol-Gel; Polyurethane Foams; Hybrid-microcapsules;
Curing; TEOS;

vi
vii
Resumo
O mercado dos poliuretanos encontra-se, de momento, em expansão. No ano de 2012,
a Asia foi o maior produtor de poliuretano, tendo sido responsável pela produção de
cerca de 10 milhões de toneladas, seguida pela Europa com uma produção anual de 4
milhões de toneladas. No ano de 2013 a produção mundial de latas de espuma de
poliuretano atingiu as 600 mil toneladas, sendo esperado que em 2018 a sua produção
a nível mundial atinja as 820 mil toneladas [1].
No que diz respeito às espumas de poliuretano de um componente, o mercado tem
apresentado um crescimento anual, sendo mais notório em mercados emergentes. No
ano de 2013 foram produzidas mundialmente 535 milhões de latas e estima-se que em
2018 sejam produzidas cerca de 668 milhões de latas [1].
As espumas de poliuretano de um componente têm tido uma utilização crescente na
indústria de construção civil, por exemplo na fixação e vedação em portas e janelas,
preenchimento de buracos, isolamento em edifícios, etc. Ao contrário das espumas de
poliuretano de dois componentes, em que os polióis e os isocianatos não são
armazenados em conjunto, no caso de espumas de poliuretano de um componente,
estes encontram-se misturados e reagidos numa lata pressurizada, juntamente com os
gases propulsores. À mistura, no interior de uma lata pressurizada, composta pelos
polióis e o isocianato é dado o nome de quasi-pré-polímero, sendo que o processo de
cura será apenas completo após a dispensa (“spray”) da espuma, quando ocorre
contacto com a humidade do ar, formando-se uma espuma de poliuretano-poliureia
rígida. Deste modo, a velocidade de cura deste tipo de espuma encontra-se
fortemente dependente da humidade do meio em que foi feito o spray, levando a que
seja mais lenta que no caso das espumas de poliuretano de dois componentes.
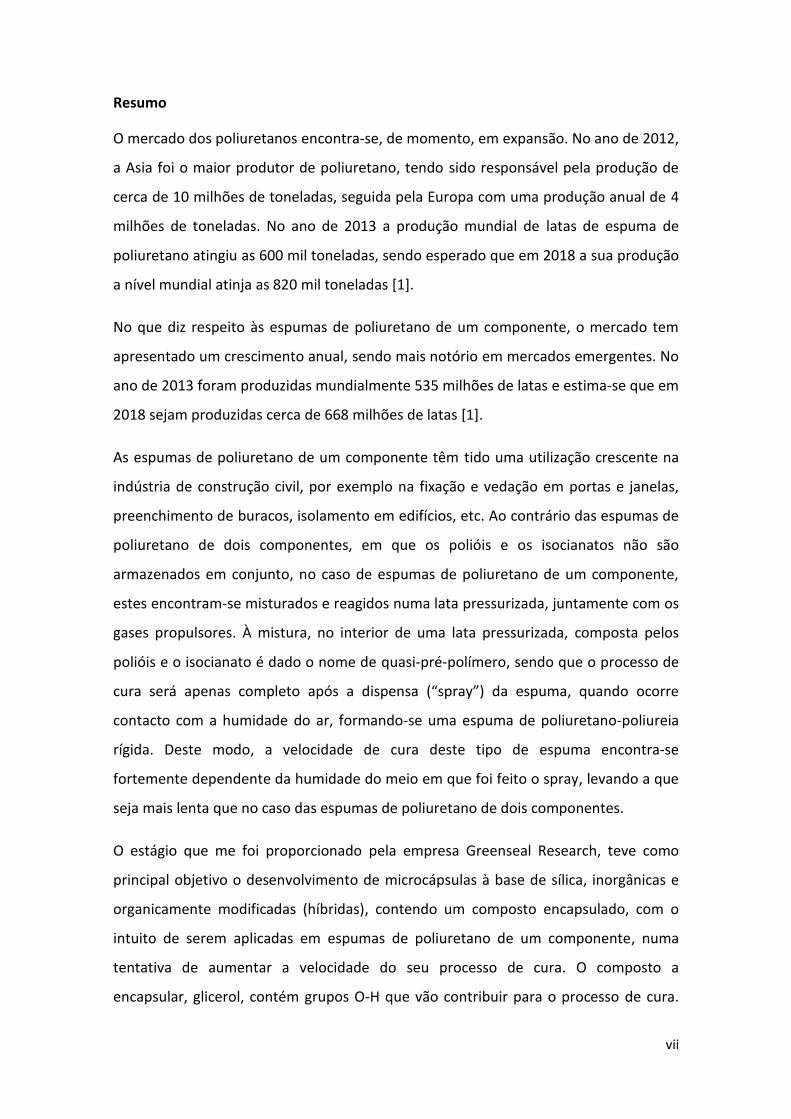
O estágio que me foi proporcionado pela empresa Greenseal Research, teve como
principal objetivo o desenvolvimento de microcápsulas à base de sílica, inorgânicas e
organicamente modificadas (híbridas), contendo um composto encapsulado, com o
intuito de serem aplicadas em espumas de poliuretano de um componente, numa
tentativa de aumentar a velocidade do seu processo de cura. O composto a
encapsular, glicerol, contém grupos O-H que vão contribuir para o processo de cura.

viii
Durante o processo de spray do poliuretano, as microcápsulas deverão ser quebradas
mecanicamente, devido à diferença de pressão a que se encontram no interior da lata
e a pressão a que são sujeitas no exterior. Após a quebra das microcápsulas, o
composto encapsulado é libertado, entrando em contacto com o pré-polímero e, em
conjunto com a humidade do meio ambiente, contribuir para o processo de cura da
espuma, acelerando-o.
Foram sintetizadas e caracterizadas diversas microcápsulas ao longo deste trabalho.
Para a sua síntese foi utilizada a técnica sol-gel, combinada com a tecnologia das
emulsões. Esta técnica baseia-se na polimerização de um percursor (alcóxido),
previamente hidrolisado, em torno das gotículas das micro-emulsões, que contém o
composto a encapsular. Observou-se que a polimerização ocorre do exterior para o
interior da gotícula, levando à formação de uma cápsula que contem no seu interior o
composto desejado. Através desta técnica foi possível sintetizar tanto microcápsulas
inorgânicas, a partir do percursor tetraetilortossilicato, TEOS, como microcápsulas
híbridas, utilizando para isso os percursores metil-trietoxisilano (MTES) e (3-glicidiloxi-
propil)trimetoxi-silano (GPTMS), com funcionalidade orgânica metil e glicidilóxi,
respetivamente, em conjunto com o tetraetilortosilicato. Foram também sintetizadas
microcápsulas de sílica com uma dupla parede utilizando, em adição ao
tetraetilortossilicato, um aminosilano. Para além das sínteses referidas, foram ainda
sintetizadas microcápsulas às quais se adicionaram outros constituintes, como
silicones e pó de cortiça, na tentativa de estas adquirirem algumas características dos
compostos adicionados, obtendo-se as propriedades desejadas. Foram ainda feitos
estudos de vários parâmetros reacionais, como a possibilidade de adição de dois
tensioactivos, um em cada fase da emulsão (dispersa e contínua), a adição de um
catalisador, a quantidade de tensioactivo a adicionar, entre outros, numa tentativa de
conseguir otimizar o processo de encapsulação e as características das cápsulas,
diminuir os custos de produção das mesmas e ainda tentar aumentar o rendimento da
reação.
Na fase de incorporação das microcápsulas nas latas de espuma foi necessário ter em
atenção alguns aspetos, de modo a garantir que a qualidade e tempo de vida do
material dentro da lata não diminuíssem com a adição das microcápsulas. Foi assim

ix
necessário garantir que as microcápsulas não se encontrassem agregadas, nem
apresentarem grandes dimensões, o que poderia levar à ocorrência de acumulação das
mesmas com consequente obstrução do “nozzle” logo após o primeiro “spray”,
impossibilitando uma posterior utilização da lata. Foi ainda necessário garantir que o
composto encapsulado não estava a ser libertado do interior das cápsulas, o que, caso
acontecesse, levaria à cura antecipada do pré-polímero ainda dentro da lata,
inviabilizando o produto. A libertação do glicerol prévia ao “spray”, pode ocorrer quer
por saída do mesmo através dos poros da cápsula, quer por quebra das microcápsulas
no interior da lata.
Durante o estágio foram utilizadas diversas técnicas de caracterização químicas e
físicas. A técnica “microscopia electrónica de varrimento”, permitiu caracterizar as
microcápsulas ao nível morfológico, ou seja se estas são mononucleadas,
polinucleadas ou se do tipo matriz porosa, perceber se existe e qual o nível de
aglomeração das microcápsulas e ainda ter uma noção da sua dimensão e da sua gama
de tamanhos. A técnica de espectroscopia de infravermelho por transformada de
Fourier permitiu a deteção de grupos químicos específicos nas microcápsulas, o que
possibilitou confirmar a existência de determinados compostos e assim a ocorrência de
algumas reações químicas durante a síntese. Esta técnica foi ainda importante pois
permitiu ter uma noção da quantidade do composto encapsulado, por comparação da
banda correspondente aos grupos O-H e das restantes bandas relativas ao glicerol,
entre espectros de diferentes sínteses. No entanto a análise termogravimétrica foi
fundamental para obter uma noção quantitativa do glicerol encapsulado. Foram ainda
feitos alguns testes, previamente desenvolvidos na Greenseal Research, que
permitiram perceber se as microcápsulas apresentavam lixiviação e ainda qual a
contribuição das mesmas para o processo de cura das espumas.
As microcápsulas de sílica apresentam uma forma esférica perfeita, pouca
aglomeração e são as cápsulas que apresentam maior quantidade de glicerol
encapsulado, no entanto são de grandes dimensões e apresentam um grau de
lixiviação não aceitável para a aplicação, levando a uma diminuição significativa do
tempo de vida da lata. Comparativamente, as microcápsulas que foram obtidas com os
percursores metil-trietoxisilano e (3-glicidiloxi-propil)trimetoxi-silano não apresentam
x
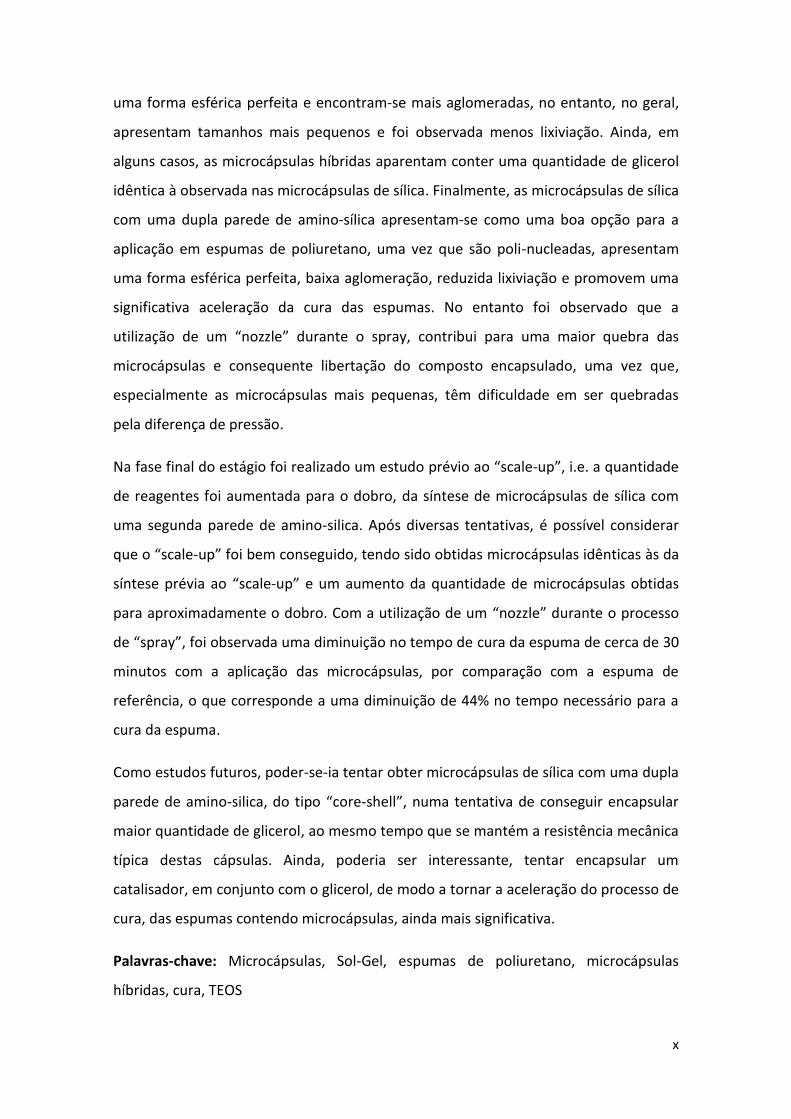
uma forma esférica perfeita e encontram-se mais aglomeradas, no entanto, no geral,
apresentam tamanhos mais pequenos e foi observada menos lixiviação. Ainda, em
alguns casos, as microcápsulas híbridas aparentam conter uma quantidade de glicerol
idêntica à observada nas microcápsulas de sílica. Finalmente, as microcápsulas de sílica
com uma dupla parede de amino-sílica apresentam-se como uma boa opção para a
aplicação em espumas de poliuretano, uma vez que são poli-nucleadas, apresentam
uma forma esférica perfeita, baixa aglomeração, reduzida lixiviação e promovem uma
significativa aceleração da cura das espumas. No entanto foi observado que a
utilização de um “nozzle” durante o spray, contribui para uma maior quebra das
microcápsulas e consequente libertação do composto encapsulado, uma vez que,
especialmente as microcápsulas mais pequenas, têm dificuldade em ser quebradas
pela diferença de pressão.
Na fase final do estágio foi realizado um estudo prévio ao “scale-up”, i.e. a quantidade
de reagentes foi aumentada para o dobro, da síntese de microcápsulas de sílica com
uma segunda parede de amino-silica. Após diversas tentativas, é possível considerar
que o “scale-up” foi bem conseguido, tendo sido obtidas microcápsulas idênticas às da
síntese prévia ao “scale-up” e um aumento da quantidade de microcápsulas obtidas
para aproximadamente o dobro. Com a utilização de um “nozzle” durante o processo
de “spray”, foi observada uma diminuição no tempo de cura da espuma de cerca de 30
minutos com a aplicação das microcápsulas, por comparação com a espuma de
referência, o que corresponde a uma diminuição de 44% no tempo necessário para a
cura da espuma.
Como estudos futuros, poder-se-ia tentar obter microcápsulas de sílica com uma dupla
parede de amino-silica, do tipo “core-shell”, numa tentativa de conseguir encapsular
maior quantidade de glicerol, ao mesmo tempo que se mantém a resistência mecânica
típica destas cápsulas. Ainda, poderia ser interessante, tentar encapsular um
catalisador, em conjunto com o glicerol, de modo a tornar a aceleração do processo de
cura, das espumas contendo microcápsulas, ainda mais significativa.
Palavras-chave: Microcápsulas, Sol-Gel, espumas de poliuretano, microcápsulas
híbridas, cura, TEOS

xi
xii
Index Acknowledgement:....................................................................................................................................... ii
Table Index ................................................................................................................................................xvii
Graphic Index .............................................................................................................................................xix
Glossary of abbreviations ........................................................................................................................... xx
1. Scope and Objectives ........................................................................................................................... 1
2. Greenseal Research ............................................................................................................................. 2
3. Introduction ......................................................................................................................................... 4
3.1. Polyurethane .......................................................................................................................... 4
3.1.1. Polyurethane History .............................................................................................................. 4
3.1.2. Polyurethane’s chemistry ....................................................................................................... 5
3.1.3. Polyurethane foams ............................................................................................................... 7
3.1.3.1. One component polyurethane foams (OCF) .......................................................................... 8
3.1.3.2. Polyurethane production and consumption ........................................................................... 8
3.2. Microcapsules and microencapsulation ............................................................................... 11
3.2.1. Microencapsulation .............................................................................................................. 11
3.2.1.1. Release of the encapsulated compounds ............................................................................. 13
3.2.1.2. Silica- based microcapsules .................................................................................................. 15
3.2.1.3. Hybrid microcapsules ........................................................................................................... 15
3.2.2. Sol-gel microencapsulation process ..................................................................................... 16
3.2.2.1. Sol-gel process ...................................................................................................................... 16
3.2.2.2. Emulsion technology ............................................................................................................ 17
3.2.2.2.1. Surfactant ............................................................................................................................. 18
3.2.2.3. Sol-gel reaction steps............................................................................................................ 21
3.2.2.3.1. Hydrolysis ............................................................................................................................. 21
3.2.2.4. Gelation and aging ................................................................................................................ 23
3.2.2.4.1. Drying ................................................................................................................................... 24
3.2.2.5. Catalysis ................................................................................................................................ 24
4. Experimental Part .............................................................................................................................. 27
4.1. Testing and characterization ................................................................................................ 27
4.1.1. Physical testing and characterization ................................................................................... 27
4.1.1.1. Optical microscope ............................................................................................................... 27
4.1.1.2. Scanning Electron Microscopy .............................................................................................. 27
4.1.1.3. Leaching test ......................................................................................................................... 28
4.1.1.4. Testing microcapsules in OCF ............................................................................................... 29
4.1.1.4.1. String, tack free and cutting time test .................................................................................. 30
4.1.1.4.2. Curing time test .................................................................................................................... 30

xiii
4.1.1.4.3. Shaking Rate test .................................................................................................................. 31
4.1.2. Chemical characterization .................................................................................................... 32
4.1.2.1. Fourier transform infrared spectroscopy ............................................................................. 32
4.1.1.1. Thermogravimetric analysis.................................................................................................. 32
4.2. Presentation and discussion of results ................................................................................. 33
4.2.1. Synthesis of silica based microcapsules ............................................................................... 36
4.2.2. Synthesis of hybrid microcapsules........................................................................................ 40
4.2.2.1. TEOS and MTES microcapsules ............................................................................................. 41
4.2.2.2. TEOS and GPTMS microcapsules .......................................................................................... 48
4.2.2.3. TEOS, MTES and GPTMS microcapsules: .............................................................................. 53
4.2.3. Study of reaction parameters ............................................................................................... 58
4.2.3.1. Catalyst: ................................................................................................................................ 59
4.2.3.2. Surfactant ............................................................................................................................. 60
4.2.3.2.1. Surfactant quantity ............................................................................................................... 62
4.2.3.2.2. Use of two surfactants .......................................................................................................... 64
4.2.3.3. Hydrolysis ............................................................................................................................. 67
4.2.3.4. Quantity of the encapsulated compound ............................................................................. 69
4.2.4. Changes in shell material ...................................................................................................... 72
4.2.4.1. Silica/Epoxy in TEOS/GPTMS synthesis:................................................................................ 73
4.2.4.2. Silica/ Silicone synthesis: ...................................................................................................... 77
4.2.4.3. Cork addition: ....................................................................................................................... 82
4.2.4.4. Production of a second shell of amino-functional silica ....................................................... 91
4.2.4.5. Post-treatment of amino-functional silica second shell microcapsules ............................... 96
4.2.4.6. Encapsulation of different compounds - glycerol, diethylene glycol, glycerol carbonate .... 99
4.2.5. “Pre-scale-up” ..................................................................................................................... 104
4.2.6. Comparison between microcapsules and microspheres .................................................... 110
5. Comparison between TGA test results ............................................................................................ 111
6. Waste disposal ................................................................................................................................. 114
7. Main conclusions and suggestions of future work .......................................................................... 115
References: ............................................................................................................................................... 119
Appendix A – Sample acronym table .......................................................................................................... A1
Appendix B – FTIR spectra .......................................................................................................................... B1
Appendix C – Viscosity Tests ...................................................................................................................... C1
Appendix D – TGA SThermograms ............................................................................................................ D1

xiv
Image Index
Fig. 1 – Schematic representation of the Greenseal Research R&D areas ................................................... 2
Fig. 2 - Polyurethane classifications criteria.[4] ............................................................................................ 5
Fig. 3 - Urethane group ................................................................................................................................. 5
Fig. 4 - Reaction between an isocyanate and an alcohol, forming an urethane group ................................ 6
Fig. 5 – Global production of one component foam by region, 2013 [1] ..................................................... 9
Fig. 6- Percentage of global consumption of plastics in 2012. Polyethylene includes all densities;
styrenics includes all copolymers along with atactic polystyrene [3]. ............................................... 10
Fig. 7 – European plastics demand, 2011. Source: Plastics Europe Market Research Group (PEMRG) [14]
........................................................................................................................................................... 10
Fig. 8 – Schematic representation of the diferent microcapsules morphology, a) matrix microcapsule b)
mononuclear microcapsule c) poly-nuclear micarocapsule (Adapted from [24]) ............................. 12
Fig. 9 – Different techniques used for microencapsulation[23] ................................................................. 13
Fig. 10 – Schematic representation of some release mechanisms. a) Example of release by breakage of
the shell, by mechanical rupture. b) Example of release by breakage of the shell, by dissolution. c)
Example of release by fracture of the shell, by swelling. (Adapted from [23]) ................................ 14
Fig.11- Representation of a tetraethyl orthosilicate molecule ................................................................... 17
Fig. 12- a) Oil in water emulsion b) (O/W) b) Water in oil emulsion (W/O) ............................................... 18
Fig. 13- a) Oil in water in oil emulsion (O/W/O) b) water in oil in water emulsion (W/O/W) .................... 18
Fig. 14 – Schematic representation of the distribution of a surfactant in the interface of an emulsion. a)
O/W emulsion b) W/O emulsion ....................................................................................................... 19
Fig. 15 – Hydrolysis of a Si alkoxide ............................................................................................................ 21
Fig. 16- Example of acid – catalyzed hydrolysis, of a Si alkoxide [23]......................................................... 22
Fig. 17- Example of basic – catalyzed hydrolysis of a Si alkoxide [23] ........................................................ 22
Fig. 18 – Condensation reactions of a Si alkoxide ...................................................................................... 23
Fig. 19 – Sematic representation of the effect of a catalyst in hydrolysis, condensation and final particle
characteristics .................................................................................................................................... 25
Fig. 20 - Schematic representation of the studies regarding reactional parameters described in this work
........................................................................................................................................................... 34
Fig. 21- Schematic representation of the synthesis described in this work ............................................... 35
Fig. 22 – Laboratorial set-up used for the microcapsule synthesis ............................................................ 36
Fig. 23- SEM photomicrographs of 20T:0M:0G microcapsules. A) 90x magnification B) 500x magnification
........................................................................................................................................................... 37
Fig. 24 – SEM photomicrograph of 20T:0M:0G microcapsule cross-section. 20000x magnification ......... 38
Fig. 25 – a) Representation of MTES, Methyltriethoxysilane, molecule and b) GPTMS, Glycidoxypropyl
Trimethoxysilane, molecule ............................................................................................................... 41
Fig. 26- SEM images of 10T:10M:0T microcapsules. A) 90x magnification B) 500x magnification ............ 42
xv
Fig. 27 - A) SEM image of a silica based microcapsule surface, 5000x magnification B) SEM image from
10T:10M:0G microcapsule surface, 7500x magnification ................................................................. 43
Fig. 28 – A) image of sílica based microcapsule interior, obtained from a microcapsule cross section,
30000x magnification B) SEM image from 10T:10M:0G microcapsule interior, 30000x magnification
........................................................................................................................................................... 44
Fig. 29 – SEM images of 5T:15M:0G A) 150x magnification B) 300x magnification ................................... 44
Fig. 30 - SEM images of 10T:0M:10G microcapsules. A) 90x magnification B) 1500x magnification ......... 49
Fig. 31 – A) SEM image of 10T:0M10G microcapsules interior, 20000x magnification B) SEM image of
sílica based microcapule interior, 20000x magnification .................................................................. 49
Fig. 32 – SEM images of 5T:10M:5G microcapsules. A) 90X magnification B) microcapsule interior, 750x
magnification ..................................................................................................................................... 54
Fig. 33 – SEM images of 5T:10M:5G interior. A) 2500x magnification B)30000x magnification ................ 54
Fig. 34 – SEM images of 5T:5M:10G. A) 90xmagnification B) 1500x magnification ................................... 55
Fig. 35 - SPAN 80 molecule ........................................................................................................................ 61
Fig. 36- DC193 molecule ............................................................................................................................. 61
Fig. 37 – SEM of 5T:15M:0G(+surfactant) microcapsules. A)100x magnification B) 90x magnification..... 63
Fig. 38 – SEM characterization of the reference microcapsules (5T:15M:0G microcapsules, with 2g of
SPAN80) A) 300 x magnification B) 150x magnification .................................................................... 63
Fig. 39- Photograph taken under optical microscope. The microcapsules were subjected to 45C heating
for 48h ............................................................................................................................................... 65
Fig. 40- SEM images of silica based microcapsules with two surfactants A) 90x magnification B) 900x
magnification ..................................................................................................................................... 65
Fig. 41 – SEM images of reference microcapsules A) 90x magnification B) 500x magnification ................ 66
Fig. 42 – SEM of 20T:0M:0G(-hydrolysis) microcapsules, with acidic water in the emulsion .................... 68
Fig. 43 – SEM of the microcapsules obtained with an increased amount of glycerol A) 90x magnification
B) 300x magnification ........................................................................................................................ 70
Fig. 44 – Representation of the reaction between EDA and GPTMS .......................................................... 73
Fig. 45 – SEM images of microcapsules synthetized with EDA. a) 90x magnification b) 550x magnification
........................................................................................................................................................... 75
Fig. 46 – SEM image of the microcapsules obtained from synthesis (S4) .................................................. 81
Fig. 47 – Microcapsules obtained in synthesis (S1), under optical microscope ......................................... 84
Fig. 48 – SEM images of the microcapsules obtained from Synthesis (S3) microcapsules. a) 90x
magnification b) 850x magnification. ................................................................................................ 85
Fig. 49- Silica/Epoxy microcapsules obtained with 0,07g of cork. .............................................................. 88
Fig. 50- Silica/Epoxy microcapsules obtained with C3 as the amount of cork, under optical microscope 88
Fig. 51 – SEM images of 10T:0M:10G (+EDA + cork) microcapsules. a) 500x magnification b) 1700x
magnification ..................................................................................................................................... 89
Fig. 52 – SEM results of silica based microcapsules with a double amino-functional silica shell a) 90x
magnification b)500x magnification. ................................................................................................. 92

xvi
Fig. 53 – SEM images with 90x magnification of the microcapsules obtained through the two syntheses
........................................................................................................................................................... 95
Fig. 54 – Urea linkage formation ................................................................................................................ 96
Fig. 55 – a) 20T:0M:0G:10A shell; 500x magnification. b) 20T.0M:0G:10A(+Ongronat®2500) .................. 97
Fig. 56 – a) Glycerol molecule b) Glycerol Carbonate molecule c) Dyethilene Glycol molecule ................ 99
Fig. 57 – SEM of 10T:0M:10G(+glycerol carbonate) microcapsules, with 90x magnification. ................. 101
Fig. 58- Emulsion obtained with 9800rpm with the ultra-turrax, under optical microscope ................... 105
Fig. 59 - Following of the pre-scale-up synthesis after the optimization ................................................. 106
Fig. 60 pre-scale-up microcapsules observed under optical microscope ................................................. 107
Fig. 61– SEM of pre-scale-up microcapsules, with 400x magnification.................................................... 107
Fig. 62 – SEM results for core shell silica based microcapsules. ............................................................... 110
Fig. 63- TGA test results obtained for some of the microcapsules synthetized during this work ............ 113

xvii
Table Index
Table 1 – Final applications for polyurethane foams [4][7][8] ..................................................................... 7
Table 2 – Shaking rate test results for silica based microcapsules ............................................................. 39
Table 3 – Curing time test results with silica based microcapsules ............................................................ 40
Table 4 - Precursors used, and their properties, for hybrid microcapsules synthesis ................................ 41
Table 5 – Shaking rate test results for microcapsules with MTES .............................................................. 46
Table 6 – Curing time test results for microcapsules with MTES ............................................................... 47
Table 7 – Tring, tack and cutting time tests results for microcapsules with MTES .................................... 47
Table 8 –TGA analysis results of microcapsules synthetized with 10g of TEOS and 10g of GPTMS ........... 51
Table 9- Shaking rate tests results of 10T:0M:10G..................................................................................... 52
Table 10 –Curing time test results with 10T:0M:10GP microcapsules ....................................................... 52
Table 11 – String, tack and cutting time results of 10gTEOS 10g GPTMS microcapsules .......................... 52
Table 12- TGA results obtained with 5T:5M:10G microcapsules ............................................................... 56
Table 13 – Shaking rate test results of microcapsules synthetized with TEOS, MTES and GPTMS ........... 57
Table 14 – Curing time test results for TEOS,MTES,GPTMS microcapsules ............................................... 58
Table 15- HF properties .............................................................................................................................. 59
Table 16- SPAN80 and DC193 principal characteristics .............................................................................. 61
Table 17 - Curing time test results of microcapsules synthetized without the pre-hydrolysis step, and the
respective references ........................................................................................................................ 69
Table 18- Curing time results of silica based microcapsules synthetized with an increased amount of
glycerol and respective references .................................................................................................... 71
Table 19 - String, tack free and cutting time results with silica based microcapsules obtained with an
increased amount of glycerol ............................................................................................................ 71
Table 20 – Principal characteristics of the reagents used for changes in the shell composition ............... 73
Table 21 - TGA results obtained with the microcapsules 10T:0M:10G(+EDA) ........................................... 76
Table 22 - Shaking rate test results of 10T:0M:10G and synthesis (S2) microcapsules ............................. 76
Table 23 - Curing time test results obtained with 10T:0M:10G, synthesis (S2) and (S4) microcapsules ... 77
Table 24 – Curing time test results for the microcapsules synthetized with Silopren, as well as for silica
based microcapsules .......................................................................................................................... 82
Table 25 - String, tack and cutting time test results for the microcapsules synthetized with Silopren ..... 82
Table 26 - TGA results of the microcapsules obtained through the synthesis (S3) and (S4) ...................... 86
Table 27 - Curing time test results with the synthesis (S2), (S3) and (S4) microcapsules and respective
references .......................................................................................................................................... 86
Table 28 - String, tack and cutting time results with the synthesis (S1), (S2) and (S3) microcapsules ....... 87
Table 29- Curing time test results of 10T:0M:10G(+EDA), synthesis (S1) and Synthesis (S3)
microcapsules, as well as the respecting references. ........................................................................ 90

xviii
Table 30 - String, tack and cutting time results of 10T:0M:10G(+EDA) microcapsules, synthesis (S1) and
(S2) microcapsules, as well as the respective references. ................................................................. 90
Table 31 – TGA analysis of the silica based microcapsules with a double amino-functional silica shell,
with acidified water in the emulsion. ................................................................................................ 93
Table 32 – Curing time test results for the microcapsules obtained through the synthesis (S1) and (S2), as
well as the respective references. ..................................................................................................... 93
Table 33 – Curing time test results with synthesis (S2) microcapsules, when the foam is sprayed with
nozzles ............................................................................................................................................... 93
Table 34 – String, tack and cutting time results obtained with the synthesis (S1) and (S2) microcapsules
........................................................................................................................................................... 94
Table 35 – String, tack and cutting time results obtained with synthesis (S2), when the foam is sprayed
with nozzle ......................................................................................................................................... 94
Table 36- Ongronat®2500 principal characteristics.................................................................................... 96
Table 37 - String and tack free and cutting time results with the polyuria microcapsules ........................ 98
Table 38 - Curing time test results with the polyuria microcapsules ......................................................... 98
Table 39 – Reagent characteristics ............................................................................................................. 99
Table 40 – String, tack and cutting time results obtained for the 10gTEOS 10gGPTMS microcapsules with
glycerol, glycerol carbonate, and respective references ................................................................. 102
Table 41 – Curing time results obtained with the 10gTEOS 10gGPTMS microcapsules with glycerol and
glycerol carbonate, and respective references................................................................................ 102
Table 42- String, tack and cutting time results with the 10T:0M:10G microcapsules with glycerol and
DEG, and the respective references ................................................................................................ 103
Table 43 – Curing time results with 10T:0M:10G microcapsules with glycerol and DEG, and the
respective references ...................................................................................................................... 103
Table 44 –TGA results obtained with the microcapsules synthetized through the pre-scale-up synthesis
......................................................................................................................................................... 108
Table 45 String, tack-free and cutting time results for the pre-scale-up microcapsules and
20T:0M:0G:10A, as well as the respective references. Not all the synthesis were sprayed in the
same day. Therefore, there are two different references. The reference (1) corresponds to the
synthesis (1). The same is applied to reference (2) ......................................................................... 109
Table 46 - Curing time results for the pre-scale-up microcapsules and silica based with second amino-
functional silica shell, as well as for the respective references ....................................................... 109
Table 47 - Curing time test results for matrix and core Shell silica based microcapsules ........................ 111
Table 48 –Results obtained through the analysis of the TGA graphics, for all the analysis made during this
work ................................................................................................................................................. 113

xix
Graphic Index
Graphic 1 – FTIR spectrum for 20T:0M:0G microcapsules. ........................................................................ 38
Graphic 2 – Leaching test result for 20T:0M:0G microcapsules in Ongronat®2500 ................................... 39
Graphic 3 – FTIR results for hybrid microcapsules ..................................................................................... 45
Graphic 4 –Leaching tests results for hybrid microcapsules ...................................................................... 46
Graphic 5- FTIR results of 10T:0M:10G as well as of silica based microcapsules ....................................... 50
Graphic 6 – Leaching test result of hybrid microcapsules with GPTMS ..................................................... 51
Graphic 7 - FTIR results of 5T:10M:5G, 5T:5M:10G and silica based microcapsules .................................. 56
Graphic 8 – Leaching test results for microcapsules synthetized with TEOS, MTES and GPTMS ............... 57
Graphic 9 – Leaching test results for silica based and silica/Baysilone microcapsules .............................. 79
Graphic 10 – FTIR results of silica based and Synthesis (S2) microcapsules............................................... 80

xx
Glossary of abbreviations
DEG – Diethylene Glycol
DME- Dimethyl Ether
EDA – Ethylenediamine
FTIR – Fourier Transform Infrared Spectroscopy
GPTMS - Glycidoxypropyl Trimethoxysilane
HLB- Hydrophilic-Lipophilic Balance
LPG- Liquefied Petroleum Gas. In this work, it is considered to be a mixture of
isobutane and propane of known proportions
MTES- Methyltriethoxysilane
OCF- One Component Foam
TEOS- Tetraethyl Orthosilicate
TGA- Thermogravimetric Analysis

1
1. Scope and Objectives
The one component polyurethane foams, OCF, market has been showing an annual
growth, mainly taking place in emerging markets. The OCF foams have also been
increasingly used by professionals in the construction industry, for example, in doors
and window frames, to seal gaps, to insulate buildings, among others applications.
The internship at Greenseal Research, to conclude the master’s degree in
Technological Chemistry at Faculdade de Ciências of Universidade de Lisboa, had as
main goal the development of hybrid microcapsules, using the sol-gel technique, to
encapsulate a curing agent, for the application in OCF rigid foams, with the purpose of
accelerating the foam curing process. The OCF foams cure is dependent of the room
humidity, which makes this process much slower in comparison with two components
polyurethane foams. The present work has an ultimate goal of finding a new reliable
way to decrease this difference, by accelerating the foam curing process and making it
independent of the environment moisture. This will lead to an increase of the OCF
performance and, therefore, enlarging the range of potential applications.
The microcapsules developed must fulfil the following requirements:
Ensure that microcapsules will not diminish the quality of the foams:
o Lifetime of the (quasi) pre-polymer inside the can; which can be affected
by the occurrence of leaching of the encapsulated material and by the
breakage of the microcapsules before spraying;
o Obstruction of the spraying nozzle; if the microcapsules size is too big,
after one spray, there can be accumulation of microcapsules in the
spraying nozzle, making the can unusable.
Control the release of the encapsulated compound:
o If the microcapsules break before spraying, the pre-polymer will cure
inside the can, making it unusable;
o If the microcapsules do not break after spray, the encapsulated
compound will not be released and will not contribute to the foam
curing process.

2
2. Greenseal Research
To accomplish my master's degree, an opportunity to work as an internee at
Greenseal Research Ltd. was provided.
Greenseal Chem is a Belgium chemical company, which main goal is to respond to
the demands of OCF formulators for specialty chemicals raw materials, having into
account the production of green and sustainable foams.
Greenseal Chemicals Research Center located in Lisbon, where the internship took
place, is specialized in the production and development of raw materials and
formulations for OFC as well as in the development of microcapsules, with an
encapsulated curing agent, to added to OCF, which is expectable to lead to fast
and self-curing foams.
In Fig. 1 a scheme is represented with the R&D areas in which Greenseal Chemicals
Research Center is committed. During my internship I worked as a research
technician in the microencapsulation investigation department of Greenseal
Research, helping to achieve the desired microcapsules to add to the OCF
formulation.
Fig. 1 – Schematic representation of the Greenseal Research R&D areas
Greenseal Research
Foam formulation and development
GSR Portugall; GSR Bulgaria
Microencapsulation U. Palermo; GSR
Bulgaria; GSR Portugal
Hardware (equipment &
acessories) GSR Portugal
Isocyanate-free OCF U. Ghent; GSR
Portugal
Adhesives and sealents GSR Portugal; GSR
Bulgaria
Chemical and physical analysis &
services GSR Portugal; IST

3

4
3. Introduction
3.1. Polyurethane
3.1.1. Polyurethane History
The beginnings of the plastic industry is dated back to 1868, with the synthesis of
cellulose nitrate [2]. But it was only after the early 1900’s, that the most used synthetic
polymers of our days began to appear: with one of the first being the polyvinyl chloride
(PVC) in 1930, followed by polyethylene and polyvinylidene chloride, both in 1933,
polyamides in 1934 and polytetrafluoroethylene (Teflon) in 1938 [3].
It was in 1849 that Wurtz and Hoffmann found the urethane linkage, essential for the
appearance of polyurethane, by studying the reaction between an isocyanate and a
compound with an alcohol functional group [4]. However it was only in 1937 that Otto
Bayer and the research team he led at I.G. Farben AG chemical company discovered
the polyurethane chemistry [3][5]. It was also in this year that these compounds began
to be industrially produced, and the first patent associated with polyurethanes was
also filled. Later, numerous other patents related to polyurethanes were filed [2][3][4].
The commercial development of polyurethanes began in Germany in the late 1930’s
with production of rigid polyurethane foams, adhesives and inks, while elastomers only
began to be produced in 1940, in Germany and England [5]. During the Second World
War, there was some development in the polyurethane science, however it was only
after 1946 that the polyurethane market showed a big increase [5]. The commercial
development of flexible polyurethane foams occurred in the 1950’s decade, but it was
only in the 1970’s that semi-flexible foams and semi-rigid foams began to be used,
coated with thermoplastic materials, in automobile industry [5]. It was also in that
decade, that one component polyurethane foams (OCF) was developed, by the
chemical group Imperial Chemical Industries, however, several years passed before
OCF was used. Sweden was the first country to use these foams, but it was in Germany
that OCF was fully developed and became successful [6].

5
3.1.2. Polyurethane’s chemistry
There is more than one criteria to classify polyurethanes. They can be classified
regarding their method of application, typological classification or shape of the
polymer, as represented in Fig. 2
The four principal types of polyurethane products are elastomers, foams, fibers and
coatings. However the major application of this polymer is as rigid or flexible foams [2].
Polyurethane is a polymer characterized by having urethane interunit linkages in its
chain, represented in Fig. 3, but not necessary in a regular order. The formation of this
group occurs by the reaction of an isocyanate group with a hydroxyl group (R-OH),
however isocyanates can also react with compounds with free hydrogens, like water,
primary and secondary amines, carboxylic acids, amides, and others, leading to the
formation of other chemical groups [2][4][7][8], such as urea, ester, amine, ether, etc.
that can also be present in the polymer molecule [3][4][7][8].
Fig. 3 - Urethane group
Fig. 2 - Polyurethane classifications criteria.[4]

6
The most common process for polyurethane production involves the reaction between
a di or polyisocyanate, and a compound with two or more alcohol groups, for example
polyester polyol or polyether polyol, represented in Fig. 4 [2][4][7][8]. Typically, the
reaction medium has the following constituents: polyol; catalyst, expansion agent,
surfactant, polyisocyanate and other specific additives.
For the production of a tridimensional polyurethane structure it is necessary that at
least one of the reagents, involved in the reaction, represented in Fig. 4, have three or
more functional groups, otherwise the product obtained will be a straight
polyurethane chain [4]. There are other secondary reactions that also contribute for
the reticulation of the polymer, for example the reaction of an isocyanate with an
urethane group, which leads to the production of allophanate, and the reaction of an
isocyanate with an urea group, which leads to the production of a biuret species, as
well as the reaction of dimerization and trimerization of the isocyanates. These
reactions take place under certain reactional conditions of temperature or in the
presence of a catalyst [4], and are responsible for the increase of the pre-polymer
viscosity inside the can.
The reactions described above lead to the increase of the reactional medium
temperature as well as of the viscosity of the liquid, leading to the formation of a
macroscopic solid. Furthermore, in the case of the production of polyurethane foams
or micromolecular elastomers, the process of expansion is also fundamental to obtain
the final product [4].
Fig. 4 - Reaction between an isocyanate and an alcohol, forming an urethane group

7
3.1.3. Polyurethane foams
Polyurethane foams can be divided into rigid foams, flexible foams and micromolecular
foams. In the Table 1 are presented some final applications [4][8].
Table 1 – Final applications for polyurethane foams [4][7][8]
Final applications
Rigid polyurethane foams Flexible foams Micromolecular foams
Thermal insulation of buildings and
refrigerators Automotive seating Soles
Packaging Textile laminates Application in joints
Buoyancy aids in boats and flotation
equipment
Cushioning for diverse
industrial applications Insoles
Flexible polyurethane foams are obtained from low functional polyols with high
molecular weight. This leads to the formation of a low number of crosslinking and,
consequently, a flexible molecular structure. In order to obtain rigid polyurethane
foams, high functional polyols with low molecular weight are used, since a great level
of crosslinking is desired [4].
As referred above, in 3.1.2, for the production of polyurethane foams, as well for the
production of micromolecular elastomers, the final expansion, during the synthesis, is
fundamental to obtain the desired product. Essentially, the expansion results from the
formation of gas in the reactional medium, leading to the increase of the global
volume. The expansion stops when the pressure inside the cells equals the resistant
tension of the walls of the foam cells [4]. The gas used in the expansion process can be
derived from a chemical or a physical process. In the case of a chemical process, the
gas is formed from the reaction between an isocyanate group and water, with the
formation of urea. In the case of a physical process, the gas is formed from the
vaporization of a low ebullition liquid that is added to the reactional medium [4].

8
3.1.3.1. One component polyurethane foams (OCF)
In one component polyurethane foams, OCF, the polyols and the isocyanates are
mixed and reacted together in an aerosol can or pressure vessel, and stored along with
the propellants, producing a mixture called (quasi) pre-polymer, with isocyanate in
excess [9][10]. Contrariwise, in the case of two components polyurethane foams, the
two components, isocyanate and polyols, are not mixed together until the application
of the foam [6].
In OCF, the three referred components are mixed together in the aerosol can or
pressure vessel, with all the polyols reacting with the isocyanate groups, so that the
OCF product mixture, the polyurethane (quasi) pre-polymer, remains with an excess of
isocyanate groups and, therefore, remains liquid. The completion of the curing process
of the fresh foam takes place after spraying, between the isocyanate groups (in excess)
and the humidity in the environment. Being so, the velocity of the curing process is
dependent of the humidity of the local where it is applied [6][9][10].
In more detail, the OCF chemical process involves four stages. In the first stage, polyol,
isocyanates and propellants are added to the aerosol can or pressure vessel. In this
stage, the pre-polymer is formed, with formation of urethane bonds. After spraying,
because of the fast evaporation of the propellants, the pre-polymer rapidly expands
into a low-density froth. The fresh foam, in contact with air, reacts with the ambient
humidity, resulting in conversion of the remaining –NCO groups of the isocyanate, into
amino groups with production of CO2. The CO2 produced in this stage will lead to a
second expansion of the foam and heat release. The sprayed foam will thus expand
and produce a fully cured foam of polyurethane-polyurea composition [9][11].
3.1.3.2. Polyurethane production and consumption
The polyurethane market is currently a growing market. It was estimated that, the
global polyurethane market revenue was worth 35,89 billion euros in the year of 2012,
and is expected to reach 55,40 billion euros by 2018 [12].

9
In the year of 2012, Asia was the major global polyurethane producer, with about
10million tons of polyurethane produced, followed by Europe, with about 4 million
tons[13]. In the following year, 2013, the major producer of polyurethane foams was
China, with 35% of the global production, followed by America with 41% [1]. In that
year the total global production of polyurethane sprays foam was about 600 thousand
tons and nowadays this value is still growing, being estimated to reach 820 thousand
tons by 2018 [1].
Regarding OCF, in that same year, 2013, the global production was about 534.5 million
cans and it is estimated that by 2018 the number of cans produced will reach 667.7
million cans [1]. In this year, the world larger producer of OCF cans, with 34% of the
global production was also China, which can be seen in Fig. 5. However, EMEA, i.e.
Europe, the Middle East and Africa region group, still represents the largest region in
terms of OCF production, with 55% of the total global production, as shown in Fig. 5.
From the EMEA region, most of the production is centered in Eastern Europe, with
Estonia and Poland being the largest producers [1].
Fig. 5 – Global production of one component foam by region, 2013 [1]
In the year of 2012, polyurethane was the commodity polymer not characterized by a
simple structure that had a larger consumption, with 6% of the global plastic
9%
34%
2%
55%
Americas
China
Asia-Pacific (except China)
EMEA
China was the major global producer of polyurethane in 2012, as well as
the major polyurethane foam producer, and specifically OCF, in 2013;
From the EMEA group, Eastern Europe, with Estonia and Poland had the
major OCF production, in 2013.

10
consumption, as can be seen in Fig. 6, 22% of the total of the polyurethane produced
this year, 22% was rigid polyurethane foams, with the higher value registered for
production corresponding to 28% of all the polyurethane production. In this year,
China and the U.S. together share 35,9% of the total polyurethane foam consumed
[13][12].
In the year of 2011, in Europe, the polyurethane demand reached 7% of the total
plastic request, as it can be seen in Fig. 7, and in comparison with the year 2010, the
demand of this polymer showed a significant growth, mainly for uses in construction
and isolation [14]. Regarding OCF, in the year 2013, Europe was considered the most
knowledgeable and demanding market of the EMEA region [8].
Fig. 6- Percentage of global consumption of plastics in 2012. Polyethylene includes all densities; styrenics includes all copolymers along with atactic polystyrene [3].
Fig. 7 – European plastics demand, 2011. Source: Plastics Europe Market Research Group (PEMRG) [14]
6% 7%
20%
17% 12%
19%
11%
8%
PET
PUR
Others
PE-LD, PE-LLD
PE-HD
PP
PVC
PS, PS-E
6% 7%
7%
13%
19%
29%
Polyurethane
Styrenics
PolyethyleneTerephthalatePolyvinylChloridePolypropylene

11
3.2. Microcapsules and microencapsulation
3.2.1. Microencapsulation
Microencapsulation can be described as the process of enclosing micron-sized particles
of solids or droplets of liquids or gases, inside a second material, using an inert
encapsulating agent, providing them protection and isolation from the external
environment. The capsules are characterized as microcapsules when their diameter is
between 1 and 1000 µm [15][16][17]. The inert surrounding material will be referred,
in this work, as “shell”.
Encapsulation of different compounds is an evolving area in chemistry with a
significant importance in many industrial sectors, such as pharmaceutical,
agrochemical, food, textile and cosmetic industries [18][19][20]. Microcapsules are
used to ensure that the encapsulated compound reaches the desired area of action
without being affected by the environment, for example by acting as a carrier system,
by protecting the encapsulated materials from detrimental conditions and separating
the encapsulated material from incompatible components. Microcapsules are also
used to control the rate and the moment in which the encapsulated compound is
released, for example delaying the external chemical reactions and controlling the
moment of capsule rupture and the release profile of the encapsulated agent [21][22].
Microcapsules may have spherical or irregular shape, and can be divided into two
distinct parts, the core and the shell. While the core contains the active ingredient and
is the intrinsic part of the microcapsule, the shell protects the core material from the
external atmosphere and corresponds to the extrinsic part of the microcapsule [23].
In 2012, 6% of the global plastic consumption was polyurethane;
22% of the total polyurethane produced in 2012, 22% was rigid
polyurethane foams;
In 2011, in Europe, the polyurethane demand reached 7% of the
total plastic request.
12
The release of the encapsulated material can occur for example by rupture, outside
pressure, by melting, drying, dissolution in solvent or by degradation of the shell [23].
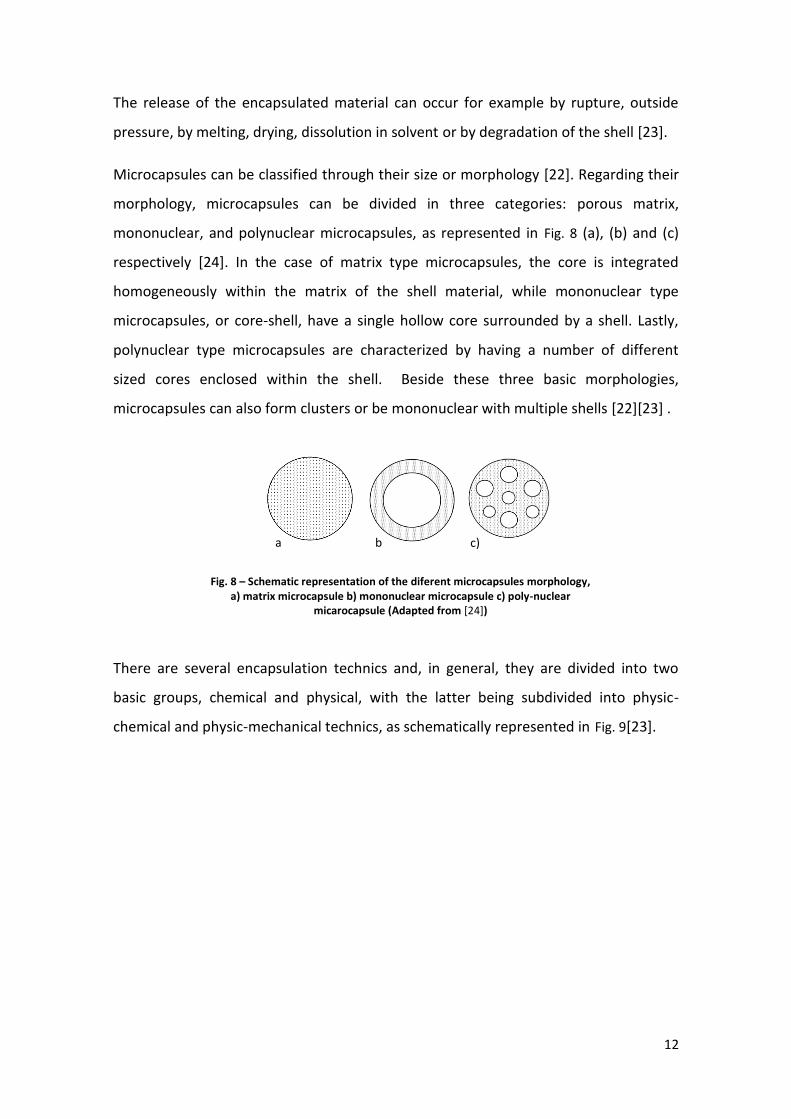
Microcapsules can be classified through their size or morphology [22]. Regarding their
morphology, microcapsules can be divided in three categories: porous matrix,
mononuclear, and polynuclear microcapsules, as represented in Fig. 8 (a), (b) and (c)
respectively [24]. In the case of matrix type microcapsules, the core is integrated
homogeneously within the matrix of the shell material, while mononuclear type
microcapsules, or core-shell, have a single hollow core surrounded by a shell. Lastly,
polynuclear type microcapsules are characterized by having a number of different
sized cores enclosed within the shell. Beside these three basic morphologies,
microcapsules can also form clusters or be mononuclear with multiple shells [22][23] .
There are several encapsulation technics and, in general, they are divided into two
basic groups, chemical and physical, with the latter being subdivided into physic-
chemical and physic-mechanical technics, as schematically represented in Fig. 9[23].
a
)
b
)
c)
Fig. 8 – Schematic representation of the diferent microcapsules morphology, a) matrix microcapsule b) mononuclear microcapsule c) poly-nuclear
micarocapsule (Adapted from [24])

13
3.2.1.1. Release of the encapsulated compounds
Microencapsulation is an ideal method to achieve a desired delay of the release of the
active compound; therefore one of the most important characteristic of microcapsules
is the control of the release profile [23].
The release of the encapsulated compound can be achieved by two different
processes: controlled release or targeted release [16][22][23]. In the case of controlled
release, the encapsulated molecules are slowly released. This type of release is desired
when long-term effects are required. In the case of targeted release, the encapsulated
substances are released at once, for example, when the shell material is dissolved or
pressure is applied to the capsule [23].
There are several mechanisms in which microcapsules can release their content at
appropriate time. For the release to happen, it is necessary a stimulus, for example a
mechanical, chemical or a thermal stimulus [23]. The most common mechanisms in
which the encapsulated compounds are released is by mechanical rupture, dissolution
or melting of the microcapsule. However, there are other release mechanisms,
although less common, like ablation or biodegradation [22].
Fig. 9 – Different techniques used for microencapsulation[23]

14
The control of the final microcapsule characteristics, such as pore size, shell thickness
and permeability of the shell, is of major importance for the control of the release
profile. For example, in case of release by breakage of the shell, by a mechanical
rupture, as schematically represented in Fig. 10 an optimal combination of shell
thickness is necessary; if the shell wall is too thick the microcapsule will not be easy to
rupture, however if the shell is too thin, it might be too fragile [25]. In case of release
by degradation of the shell, for example by dissolution as in represented in Fig. 10, the
release of the encapsulated compound is delayed until certain environmental
conditions occur, for example a chemical stimulus. In this case, the rate of the release
can be tailored by controlling the thickness of the shell as well as the composition, its
solubility in the dissolution fluid [23]. As for a final example the fracture of the shell
upon swelling of the core, also represented in Fig. 10. In this case, the shell must act as
a semi permeable membrane, since it has to allow the creation of an osmotic pressure
difference between the inside and the outside of the microcapsule, which will lead to
drive the encapsulated compound out of the capsule, through its small pores. In this
case, the control of the permeability of the shell is of great importance, since it must
allow the diffusion of the solvent into the core [17][23].
Fig. 10 – Schematic representation of some release mechanisms. a) Example of release by breakage of the shell, by mechanical rupture. b) Example of release by breakage of the shell, by dissolution. c) Example of release by
fracture of the shell, by swelling. (Adapted from [23])
a)
b)
c)

15
3.2.1.2. Silica- based microcapsules
Historically, organic compounds such as synthetic polymers, have been used more
often than inorganic compounds as the encapsulating material, however polymer-
based microcapsules normally suffer from poor chemical and physical stability
[18][26]. Until 2008, very few inorganic, silica-based, controlled-release microcapsules
have been industrially produced, due to relative difficulty in manipulating the internal
structure of the particles and the high processing temperature employed, which makes
the synthesis process unviable [16].
Recently, studies have been made to optimize the synthesis of silica-based capsules.
The increased interest in inorganic microcapsules is due to their distinguishing
characteristics, like robustness, thermal and mechanical stability, chemical resistance,
non-toxic quality for the environment, biocompatibility, and the ability to easily
incorporate additional functional groups [16][18][20][21].
Sol-gel technology emulsion method, an abbreviation for “solution-gelling”, has shown
to be the most effective and economical method for the synthesis of hollow silica
microspheres. This technic allows the synthesis of inorganic structures without lacking
the control of the microstructure of the particles and the need of high processing
temperatures, thus offering a cost-saving process [16][20][23]. With this method it is
possible to control the micro or nanostructure of the particle, pore size, shape, capsule
size and density of the particle, through thoughtful choice of the parameters of the
reaction [20][27].
3.2.1.3. Hybrid microcapsules
Organic– inorganic hybrid microparticles, which have been called “organically modified
silica” (“Ormosil”), are of great interest because of the potential of combining
properties of organic and inorganic components. Organic compounds offer structural
flexibility and inorganic materials provide stability, robustness and chemical resistance
[28].
16
Using the sol-gel technique, Ormosil compounds are easy to obtain, just like inorganic
microparticles. They can be obtained with the same approach using organically-
modified silicon alkoxides as co-precursors [29]. Furthermore, Ormosil compounds
also have the advantage, enabled by the sol-gel process, to control the shape, density,
and surface properties, such as in case of the inorganic materials [24].
3.2.2. Sol-gel microencapsulation process
3.2.2.1. Sol-gel process
Sol-gel science has been rediscovered during the second half of the twentieth century
and, since then, it has led to a great number of applications and spin-offs. This
technique has shown to be an important synthesis method in several domains of
research, such as in optics, electronics, biomaterials, and semi- and superconductors,
mainly because of the diversity of the materials obtained, versatility and low cost
compared to other techniques [23].
In a brief manner, the sol-gel technique can be divided into the following reactional
steps: hydrolysis; condensation; gelation; aging; and drying [20][27].
It is also important to refer that this technique is usually combined with emulsion
technology, in order to result in a microencapsulation process [20]. The emulsion
droplets are said to act as a micro-reactors; when an active compound is located inside
an emulsion droplet, encapsulation will occur as the pre-hydrolyzed precursors
polymerize to build a cage around the active compound, at the interface between the
dispersed and continuous phase [16].
As the name suggests, the process begins with the preparation of a “sol”, which leads
to a posterior formation of a “gel”. A “sol” is defined as a colloidal suspension of solid
particles in a liquid. Colloids are suspensions of particles, with linear dimensions
between 10nm and 1m, with particle interactions dominated by short range forces
such Van der Waals attractions or hydrogen bonding [23][30]. The precursors to

17
prepare a colloid, consist of a metal or metalloid element surrounded by ligands, not
consisting of another metal or metalloid atom. The class of precursors most widely
used for sol-gel technique is alkoxides, a member of the family of the metalorganic
compounds. Metal alkoxides have the general formula M(OR)z, where M is the metal
ion, R is an alkyl group and z is the valence state of the metal and they are most
commonly used because they react readily with water, facilitating the hydrolysis
reactional step. The alkoxide most thoroughly studied example is tetraethyl
orthosilicate, TEOS, Si(OC2H5)4, represented in Fig.11 [23][30].
Fig.11- Representation of a tetraethyl orthosilicate molecule
3.2.2.2. Emulsion technology
An emulsion can be defined as an heterogeneous system containing two immiscible
phases composed by at least two liquids, one in the form of a droplet dispersed into
the other [20]. Emulsions are typically obtained through mixing of the two components
and are, usually, in the presence of an emulsifier, so that a stable emulsion is produced
[31][32]. In the particular case of microemulsions, they are composed by two
immiscible liquids, with particles of diameter ranging, approximately from 1 to 100
nm, usually 10 to 50 nm, according to IUPAC definition [31][33].
Typically, emulsions are composed by an aqueous liquid phase and a hydrocarbon
phase, or so called oil phase. Given this, there can be four types of emulsions; W/O
emulsions, in the case of water droplets dispersed in oil and O/W emulsions, for oil
droplets dispersed in water, as represented in Fig. 12, and double emulsions;
combinations like W/O/W and O/W/O emulsion. For example, O/W/O emulsions are
the abbreviation for oil droplets dispersed in aqueous droplets that are, in turn

18
dispersed, in a continuous oil phase, as can be seen in Fig. 13 [18][32][34]. Emulsions
can also be O/O, oil in oil, when two oils have different polarities [33].
For sol-gel encapsulation technique, the type of emulsion chosen is dependent on the
solubility of the molecules to be encapsulated [18]. As for water soluble molecules,
they can be directly encapsulated in a W/O emulsion. In this case, the molecule is
located in the aqueous droplet, which is dispersed in the nonpolar solvent. By the
contrary, if the molecules to be encapsulated are not water soluble, an O/W emulsion
is used, with the compound located in the oil phase [20].
3.2.2.2.1. Surfactant
Surfactants are molecules with an amphipathic (or amphiphilic) structure; this means
the molecule has both a hydrophilic and a hydrophobic group. Usually, the
hydrophobic group consists of a long hydrocarbon chain, while the hydrophilic group is
composed by an ionic or highly polar group. On an emulsion system, the hydrophobic
portion of the surfactant molecules orient themselves with the hydrophobic phase, i.e.
the oil phase, while the hydrophilic portion orients toward the hydrophilic phase, i.e.
water, as schematically represented in Fig. 14 [33].
Fig. 13- a) Oil in water in oil emulsion (O/W/O) b) water in oil in water emulsion (W/O/W)
a) b)
a) b)
Fig. 12- a) Oil in water emulsion b) (O/W) b) Water in oil emulsion (W/O)

19
Depending on the nature of hydrophilic group, surfactants can be classified as: anionic;
cationic; zwitterionic; and nonionic [31]. The presence of a surfactant helps to stabilize
the emulsion, and the solvent-surfactant combination as well as the nature of the
surfactant, helps to control the droplet size distribution and the emulsion viscosity
[16][20][34][35]. For the sol-gel encapsulation technique, it is of great importance to
control the size and stability of the emulsion droplet, since it acts as a nano-reactor
and therefore influences the size of the final particles [16].
The word surfactant is a contraction of the term “surface-active agent” and, as the
name suggests, it is a substance that act on the surface or interfaces. An interface can
be described as a boundary between two immiscible phases, whereas a surface is an
interface where one phase is a gas and the other liquid. A surfactant, when added at
low concentration to a system, has the capability to be absorbed by some or all the
surfaces or interfaces in the system and change their free energy. The interfacial free
energy is described as the minimum amount of work required to create the interface.
It can be used to determine the interfacial tension between two phases, since it is a
measure of the interfacial free energy per unit area, as seen in (Equation 1). The
interfacial/surface tension is also a measure of the difference between the two phases
intersection at the interface/surface. A bigger dissimilarity between their nature leads
to higher value of the surface or interfacial/surface tension [31][33][34].
Fig. 14 – Schematic representation of the distribution of a surfactant in the interface of an emulsion. a) O/W emulsion b) W/O emulsion
a
)
b
)

20
A surfactant, by lowering the interface free energy, leads to a lower superficial tension
and, consequently, to a decrease in the pressure difference across the drop interface,
as seen in (Equation 2) [33].
∆𝐺 = 𝛾 ×∪ ∆𝐴 (Equation 1) [36]
Where ∆G is the interface/surface free energy, Nm/J; ∆A is the total interfacial area of
the disperse phase, m2; ɣ is the interfacial tension, N/m.
∆𝑃 = 𝛾 × (1
𝑅1+
1
𝑅2) (Equation 2) [33]
For a perfectly spherical droplet, R1=R2=R and;
∆𝑃 =2𝛾
𝑅 (Equation 3) [33]
Where ∆P is the pressure difference across the drop interface, ɣ is the surface tension,
R1 and R2 are the principal radii o curvature and R is the radii of the droplet.
An important surfactant characteristic is the HLB, hydrophilic-lipophilic balance. The
HLB of a surfactant represents the affinity of the surfactant to the water and to oil. Its
value is expressed as a ratio between the hydrophilic and lipophilic groups of the
amphiphilic surfactant molecule [20]. When HLB value is higher than 10, it indicates
hydrophilicity of the surfactant, and when HLB value is lower than 10 it indicates
lipophilicity [20]. Thus, in general, surfactants with low HLB value, between 3 and 8,
are incorporated into the oil based solution. Contrariwise, surfactants with high HLB
value, between 8 and 18, are incorporated into water-based solutions, due to their
hydrophilic character [20][24][31][32]. However, HLB value only gives information
about the emulsifying characteristics of the surfactant, not its efficiency. For example,
all surfactants with high HLB value are O/W emulsifiers (if placed in the continuous
phase), however not all of them have the same efficiency for a particular system. The
HLB is important for the stability of the emulsion, nevertheless the chemical type of
the emulsifier is important as well [32][34].

21
3.2.2.3. Sol-gel reaction steps
3.2.2.3.1. Hydrolysis
The hydrolysis reaction of the alkoxide precursors leads to the formation of a
hydroxide specie [23]. Through the mixing of water with the alkoxide precursor, the
alkoxysilane’s alkoxy groups (OR) are replaced with hydroxyl groups (OH), as
represented in Fig. 15. The reactional parameters that most influence the hydrolysis
reaction are the pH of the reaction medium (nature of the catalyst) and the
concentration of the catalyst. However, there are other secondary parameters that
have also some influence in the hydrolysis; the H2O/Si molar ratio, temperature, and
solvent used [23][30].
Fig. 15 – Hydrolysis of a Si alkoxide
Hydrolysis reaction can occur without the addition of a catalyst, however, it is most
rapid and complete when they are employed. The catalyst for this reaction is a basic or
acidic catalyst. The rate of hydrolysis reaction has a minimum at pH 7 and increases
when pH gets higher or smaller than 7. However, for an equivalent catalyst
concentration, acidic-catalyzed hydrolysis reaction is faster than basic catalyzed-
hydrolysis [18][20][23][30].
In acidic conditions, it is likely that, in a first step, the alkoxy group of the alkoxysilane
is rapidly protonated, as represented in Fig. 16. After this first step, the electron density
of the silicon atom is removed, making it more electrophilic and therefore more
susceptible for an attack from water, Fig. 16 [23][30].

22
In basic conditions, it is likely that the hydrolysis reaction begins with a rapid first step
of dissociating water to produce hydroxyl anions, which will then attack the silicon
atom, represented in Fig. 17 [23]. Basic hydrolysis, is a much slower process than
acidic-hydrolysis, because basic alkoxide oxygens tend to repel the nucleophilic –OH.
Nevertheless, after an initial hydrolysis reaction occurs, the following reactions
proceed stepwise with each subsequent extraction of an alkoxide group easier than
the previous one [23].
3.2.2.3.2. Condensation
Through following condensation reaction, oxide species are formed. This reaction
involving the silanol groups (Si-OH) obtained in the previous hydrolysis reaction, leads
to the formation of siloxane bonds (Si-O-Si), and the byproducts alcohol, if the
condensation occurs via dealcoholation, or water, if via dehydration, as represented in
Fig. 16- Example of acid – catalyzed hydrolysis, of a Si alkoxide [23]
Fig. 17- Example of basic – catalyzed hydrolysis of a Si alkoxide [23]

23
Fig. 18 a) and b) [20][23][30]. When preparing multi-metal-oxides, condensation can
occur both as self-condensation, and M-O-M bonds are obtained, or as cross-
condensation, where M-O-M’ bonds are formed [23].
As the number of siloxane bonds increases, the individual molecules are bridged and
aggregate in the “sol” and an inorganic oxide network is built up progressively [23].
Under most conditions, condensation reactions begin before hydrolysis is complete.
Nevertheless, certain reactional conditions like pH, H2O/Si molar ratio and catalyst can
lead to a complete hydrolysis reaction, before the condensation reactions begin [23].
As in hydrolysis reactions, condensation can occur without the use of a catalyst.
However, their use can be helpful. The catalysis in sol-gel technique is of the same
nature in either hydrolysis or condensation reactions, acting as a basic or acidic
catalysis [23]. However, the rate of condensation, contrariwise to hydrolysis, shows a
minimum around pH 2 and obtains a maximum at pH 7, starting to decline as pH gets
higher than 7 [18][20][30].
3.2.2.4. Gelation and aging
Gelation can be defined as the changes in properties that occur as a sol, when
transforming into a gel [30]. In a simple way, clusters are formed by hydrolysis and
condensation reactions, until they collide; at this point links are formed between the
clusters to produce a single one called a gel. While the gel forms, there will be many
clusters present in the sol phase, which will progressively become connected to the
a)
b)
Fig. 18 – Condensation reactions of a Si alkoxide

24
network and increase the stiffness of the gel, until the last link is formed and a
spanning cluster is created [30].
The next step of a sol-gel reaction is the aging process and it can be defined as the
mechanism in which changes in structure and properties occur. Through this stage,
there is the formation of further crosslinks, with covalent links replacing the
nonbonded contacts. The network becomes stronger, stiffer and shrinks. Structural
evolution with changings in pore sizes and pore wall strengths also occur [23][30].
3.2.2.4.1. Drying
Lastly, the product must be dried, in order to lose the remaining water, alcohol and
other volatile components [23]. In case of porous materials, the process of drying
encompasses several stages. It begins with liquid evaporation, which causes shrinkage
of the body, which corresponds to the volume of the liquid lost. In this stage, the
liquid-vapor interface is at the surface of the body. When it becomes too stiff to shrink,
the liquid recedes to the interior, which leads to air filling the pores at the surface.
Nevertheless, a continuous liquid film supports the flow to the exterior and
evaporation continues at the surface. In a last stage, drying can only occur by
evaporation of the liquid within the body, while the vapor diffuses to the outside [30].
3.2.2.5. Catalysis
The catalysis in the sol-gel technique is achieved using a basic or acid catalyst. The pH
at which the synthesis takes place dictates the type of silica particle produced, since it
has influence in the porosity, size and homogeneity of the final particle, as seen Fig. 19
[18][20][23]. The catalysts more widely used in sol-gel technology are mineral acids or
ammonia, but acetic acid, potassium hydroxide (KOH), amines, potassium fluoride (KF),
hydrofluoric acid (HF), titanium alkoxides, and vanadium alkoxides and oxides are also
generally used [30].

25
In the case of an acid-catalyzed reaction, the hydrolysis step has the higher rate of
velocity, being the condensation the rate-limiting step. Consequently, a small growth is
observed and small particles are formed, with loose and open structure [20][24].
Contrariwise, when the sol-gel process is catalyzed by a basic catalyst, the
condensation reaction of the pre-hydrolyzed silanes has the higher rate of velocity,
and the reaction of hydrolysis is hindered at some extent. The rapid condensation of
the hydrolyzed precursors leads to the production of large and dense particles, with
essentially no porosity [23][24]. The Sol-Gel synthesis can also be done through a “two-
step” approach. In this method, the hydrolysis takes place under strong acidic
conditions, followed by condensation catalyzed by a base. The resulting material is
large mesoporous microspheres [24].
Fig. 19 – Sematic representation of the effect of a catalyst in hydrolysis, condensation and final particle characteristics

26

27
4. Experimental Part
4.1. Testing and characterization
In this chapter, the tests and characterizations used during the internship, for the
microcapsules evaluation, will be explained. Some physical characterizations and tests
were made including: optical microscope observation, scanning electron microscopy
(SEM), leaching tests in Ongronat® 2500, which is an oligomeric MDI, and tests to
evaluate the effect of the microcapsules in OCF foams. Regarding the chemical
characterization, the techniques used were Fourier transform infrared spectroscopy
(FTIR) and thermogravimetric analysis (TGA).
4.1.1. Physical testing and characterization
4.1.1.1. Optical microscope
The observation under optical microscope was the characterization technique used
right after the synthesis. It allowed a first perspective of the obtained microcapsules,
regarding its morphology type, i.e. porous matrix, core-shell or poly-nucleated,
dimensions and aggregation.
The microscope used was a Kruss, MSZ 5600optical microscope.
4.1.1.2. Scanning Electron Microscopy
Scanning electron microscopy (SEM) was used to complement the evaluation obtained
from the optical microscope. The SEM analysis provided information regarding the
topographical features, morphology, size distribution and agglomeration.
Previously to this analysis, the microcapsules were subjected to heating for 24 hours at
45C in order to remove possible remaining water. The microcapsules were fixed to a

28
carbon conductive tape and glued in a sample holder. Lastly, the sample was coated
with gold.
The SEM analysis was made using a JEOL JSM7001F with a FEG (field emission gun)
microscope.
4.1.1.3. Leaching test
The leaching test was made with the purpose of understanding if the encapsulated
glycerol was leaching out from the microcapsules without their breakage, i.e. through
their porosity. It is important to understand the microcapsules leaching behavior, since
it can compromise the OFC can’s life span.
In this test, the microcapsules were mixed with Ongronat® 2500 and its viscosity was
measured over several days. The Ongronat®2500 was used in this test since it has
isocyanate groups that react with the glycerol’s OH groups and residual water, leading
to an increase of its viscosity and, thus, enabling the detection of the leaching
phenomenon, as well as OH contamination of the outer surface of the capsules. The
solution used for this test was composed of 5%, in weight, of microcapsules and 95% of
Ongronat® 2500.
For the leaching test, a multi speed digital cone and plate viscometer with variable
temperature control from REL was used. For the analysis, a small sample of the
Ongronat®2500 was collected, and placed in the viscometer. The amount of sample
must be enough to cover the area where the pendulum touches. The analysis started
with the limit of 20cP, however if the viscosity of the Ongronat® 2500 was too close to
this value, it should be increased to a next limit.
Greenseal Research has defined a maximum viscosity value acceptable for this test. If
the Ongronat® 2500 viscosity reached 5000cP, the microcapsules of such formulation
were not acceptable to be used in the OFC cans.

29
4.1.1.4. Testing microcapsules in OCF
The following tests were made with the purpose of understanding the effect of the
microcapsules in the OCF foams’s curing process.
For performing these tests, an OCF aerosol can must be previously filled with the
component B, an isocyanate-based pre-polymer, component A, composed mainly of
polyols, the microcapsules to be tested, in a selected amount, and finally the
propellant gases, as explained below, according to a proprietary formulation
previously developed by Greenseal Research.
Can preparation
The method presented in this work for the OCF cans preparation was previously
developed by Greenseal Research.
An OCF can is composed by the microcapsules and three components: Component A,
composed by a mixture of polyols, catalyst, plasticizers, silicones and flame retardants;
component B, an isocyanate-based pre-polymer; and component C, the liquefied
gases, liquefied petroleum gas (LPG) and dimethyl ether (DME). The microcapsules
must be subjected to drying at 100ºC before being added to the can, in order to
eliminate some possible water contamination at their surface. The amount of
microcapsules added to the formulation was 6,8% of component A + B in weight.
The protocol method starts with the preparation of the component A, followed by its
mechanical stirring for one hour. Then, the aerosol can starts to be filled with
component B, followed by the microcapsules and lastly the component A is added.
The amount of component A and B is such that the ratio NCO/OH is equal to 3,5. The
can is then sealed with an aerosol valve. Then, LPG and DME (component C) gases,
previously measured in the burettes, are forced to enter into the can. Finally, the can
must be vigorously shaken.

30
4.1.1.4.1. String, tack free and cutting time test
One day after preparing the can, containing the microcapsules, the froth can already
be sprayed onto paper substrate. Through this test, three parameters, related to the
curing process of the OCF foam, are evaluated: string time, tack free time and cutting
time.
The referred test was performed according to a protocol previously established by
Greenseal Research, based on the OCF tests proposed by FEICA “Association of the
European Adhesive & Sealant Industry”, a multinational association that represents
the European adhesives and sealants industry.
In this test, the OCF foam must be sprayed horizontally on paper. The string time is
reached when the sprayed foam begins to be sticky and, when touching slightly on the
surface with a paper, a string is formed. The tack free time is reached when the surface
is no longer sticky. Lastly, the cutting time test is reached when, by cutting the foam,
the cut surface is not sticky, the knife is clean, without pre-polymer residues, and the
foam cells are not compressed.
In this test, a reference foam was always sprayed, i.e. a foam without microcapsules, in
the same conditions as the foam containing microcapsules, so that a comparison
(benchmark test) is done.
In some studies, a foam bid was also sprayed with different nozzles, which would
mechanically contribute for the microcapsules’ breakage.
A decrease in the string, tack-free and cutting times means an acceleration of the foam
curing process.
4.1.1.4.2. Curing time test
The curing time test was made with the purpose of understanding the effect of the
microcapsules in the foams’ curing process. This test was performed according to a
protocol previously defined by Greenseal Research.

31
In this test, a small bid was sprayed inside a plastic bag, which was previously purged
with N2 gas and immediately sealed, in order to avoid the entrance of air. The bag was
then stored in a desiccator, in a low moisture environment. The foams were evaluated
in a scale of “-5” to “5”, being “ -5” the evaluation given if the sprayed foam was still in
liquid state and “5” if the foam was completely cured (solid). The evaluation must be
followed until the foam is completely cured. In this test, a reference foam was always
evaluated, i.e. without microcapsules.
In some studies, foam bids were also tested through spraying with different nozzles.
4.1.1.4.3. Shaking Rate test
The shaking rate test was made with the purpose of understanding if the
microcapsules were influencing the OCF can’s life span, through leaching of the
encapsulated compound.
Through this test, the agitation of the pre-polymer was measured inside the can. If the
microcapsules were leaching, the pre-polymer viscosity would increase and, thus, its
agitation would decrease.
The shaking rate test was performed according to a protocol previously defined by
Greenseal Research. It comprises the shaking of the can, for a short period, during
several days after the can preparation. The agitation was evaluated in a scale from “5”
to “-5”, being “5” the value given to a good agitation and “-5” the value given if the
material inside the can did not agitate at all.
In this test a reference can was always evaluated, i.e. without microcapsules.

32
4.1.2. Chemical characterization
4.1.2.1. Fourier transform infrared spectroscopy
The Fourier transform infrared spectrometry (FTIR) characterization was used in this
work to confirm the presence of the encapsulated compound as well as to make a
comparative evaluation of its quantity, among different syntheses. This
characterization technique was also used to confirm the presence of characteristic
groups, in order to verify the presence of certain compounds in the shell surface.
Before being characterized by FTIR, the microcapsules were subjected to a heat
treatment at 45C for 24h. The FTIR equipment used was a Nicolet 5700 FT-IR (Thermo
Electron Corporation), with an ATR accessory with a diamond crystal. The transmission
spectrum was obtained between 4000 and 600 cm-1.
4.1.1.1. Thermogravimetric analysis
The thermogravimetric analysis (TGA), was made with the principal purpose of
determining the amount of encapsulated compound in the microcapsules. This
technique was used as a necessary complement to the FTIR characterization analysis,
for this purpose. The TGA analyses were made in two different laboratories, in one
case the TGA equipment used was a TGA 92 16-18 SETARAM, in the other one a
Netzsch Luxx STA 409 PC was used. In both cases, the analyses were made in an air
controlled atmosphere, at 10C/ min
The microcapsules that were analyzed through TGA were previously subjected to a
heat treatment at 45C for 24h, in order to evaporate possible superficial water.

33
4.2. Presentation and discussion of results
In this chapter, the experimental procedures used during this internship, for different
microcapsule’s synthesis, will be described.
This chapter begins with an analysis on some reproducibility studies related to
microcapsules previously synthetized in Greenseal Research, also obtained through
sol-gel technique. Some studies regarding the optimization of reactional parameters
for the microcapsules synthesis are described, as well as some studies regarding shell
material modifications and encapsulation of different compounds. In the final part of
this work, a pre- scale-up study of a previously selected synthesis is presented.
The general synthesis procedure used in this work was adopted from a previously
developed protocol. During this internship, some studies were made that led to
changes to this protocol. Adding to the referred studies, a new heating mantle was
acquired in the final month of the internship (to improve reproducibility of the
achieved product), which resulted in forced and additional process optimization
activities.
The syntheses presented in this work were named according to the acronyms
presented in the Table A 1, Appendix A. The given acronyms took into account the mol
percentage of the silanes used in each synthesis.
In Fig. 20 a scheme of some studies is presented, regarding reactional parameters that
were carried on during the internship. In Fig. 21 a scheme regarding the synthesis made
during the internship is presented, which will be described in the present work.

34
Fig. 20 - Schematic representation of the studies regarding reactional parameters described in this work

35
Fig. 21- Schematic representation of the synthesis described in this work

36
4.2.1. Synthesis of silica based microcapsules
Silica based microcapsules were synthetized following an experimental base
procedure, previously developed in Greenseal Research. Throughout this work, this
protocol will be referred as “experimental base procedure”. The alterations described
from now on will be carried on having this protocol as a starting point.
The experimental procedure for the microcapsules’ synthesis encompassed the
following steps: pre-hydrolysis of the alkoxysilanes; preparation of an emulsion
solution with the encapsulating compound in the aqueous phase of the emulsion
system; mixture of the emulsion system with the pre-hydrolyzed silanes, with
mechanical agitation, in a reactional balloon; submission of the reactional medium to
three temperatures, referred through this work as T1, T2 and T3, while the
polycondensation reactions of the pre-hydrolyzed silanes occurs; filtration of the
obtained microcapsules; drying of the microcapsules and storage in a moisture-free
environment. Further details regarding the experimental base procedure are
confidential.
The Fig. 22 presents the laboratorial montage used for the microcapsules syntheses,
before the arrival of the heating mantle.
Fig. 22 – Laboratorial set-up used for the microcapsule synthesis

37
Experimental Results:
The synthesis of silica based microcapsules, 20T:0M:0G, had already been previously
made in Greenseal Research. In this work, the referred synthesis was carried out with
the purpose of studying its reproducibility, as well as to have more microcapsules
available for some further characterization and for comparison with the microcapsules
obtained in the following studies.
From the results obtained by SEM, observed in Fig. 23, it is possible to conclude that
the silica based microcapsules have an almost perfect spherical shape and can be
classified as porous matrix microcapsules. However, it is also possible to observe a
large size dispersion, along with some agglomeration. In the Fig. 23, it is possible to
observe capsules with diameters of about 30m as well as with almost 300m. The
existence of agglomerated capsules, as well as their significant size, can lead to
obstruction of the spray nozzle, after the first spray. These microcapsules’ porosity is
visible in Fig. 24.
Fig. 23- SEM photomicrographs of 20T:0M:0G microcapsules. A) 90x magnification B) 500x magnification

38
In the Graphic 1 it is presented the FTIR’s results for these microcapsules. The broad
FTIR band peaked at ca. 3300 cm-1 is due to the presence of O-H groups (O-H
stretching), derived from the encapsulated glycerol, but also from the existence of
some remaining water (inorganic silica is hygroscopic) and possibly some uncondensed
silanol groups. Additionally, the peaks at 1640 cm-1 and ca. 650 cm-1 show the presence
of H2O (HOH bending). Another evidence for the presence of glycerol is the band
between ca. 1500 and 1300 cm-1, due to CH2 and OH bending). The FTIR peaks at ca.
3000-2750 cm-1 are ascribed to the C-H stretching in CH3, CH2, and CH moieties. The
FTIR peak presented at 1070cm-1
corresponds to the asymmetric stretching of the
siloxane bonds Si-O-Si and its presence is due to the polycondensated TEOS.
4500 4000 3500 3000 2500 2000 1500 1000 500
20
40
60
80
100
stretching of the siloxane bonds
C-H stretching
O-H stretching
Tra
nsm
itta
nce
(%
)
Wavelength (cm-1)
Silica Based microcapsules
Graphic 1 – FTIR spectrum for 20T:0M:0G microcapsules.
Fig. 24 – SEM photomicrograph of 20T:0M:0G microcapsule cross-section. 20000x magnification

39
From results obtained from the leaching tests it is possible to conclude that a fast
release of the encapsulated compound happened. From the Graphic 2 it is possible to
verify that, after only 100 hours, the Ongronat® 2500 solution was already very
viscous, with a viscosity value of 5000 cP. This high viscosity value can be explained not
only by the leaching of the glycerol, but also due to some possible water present in the
microcapsules, since the silica is a very hygroscopic material, and may lead to a
possible accumulation of superficial water.
The Table 2 shows the results for the shaking rate test of silica based microcapsules in
OCF. As it can be seen, after 120 hours, the difference in the shaking rate between the
two cans is notorious, with a difference of five values. This confirms that leaching was
occurring. This result shows a diminution of the lifetime of the can with the
incorporation of the microcapsules.
Table 2 – Shaking rate test results for silica based microcapsules
Synthesis SR (Shaking Rate)
0h 72h 96h 120h
Reference 5 5 3 3
20T:0M:0G 5 4 1 -2
In the Table 3 the results obtained for OCF curing time tests with silica based
microcapsules are presented. Although the precise time of the complete curing of the
0 20 40 60 80 1000
1000
2000
3000
4000
5000
6000
Vis
cocity (
cP
)
Time (Hours)
Silica based microcapsules
Graphic 2 – Leaching test result for 20T:0M:0G microcapsules in Ongronat®2500
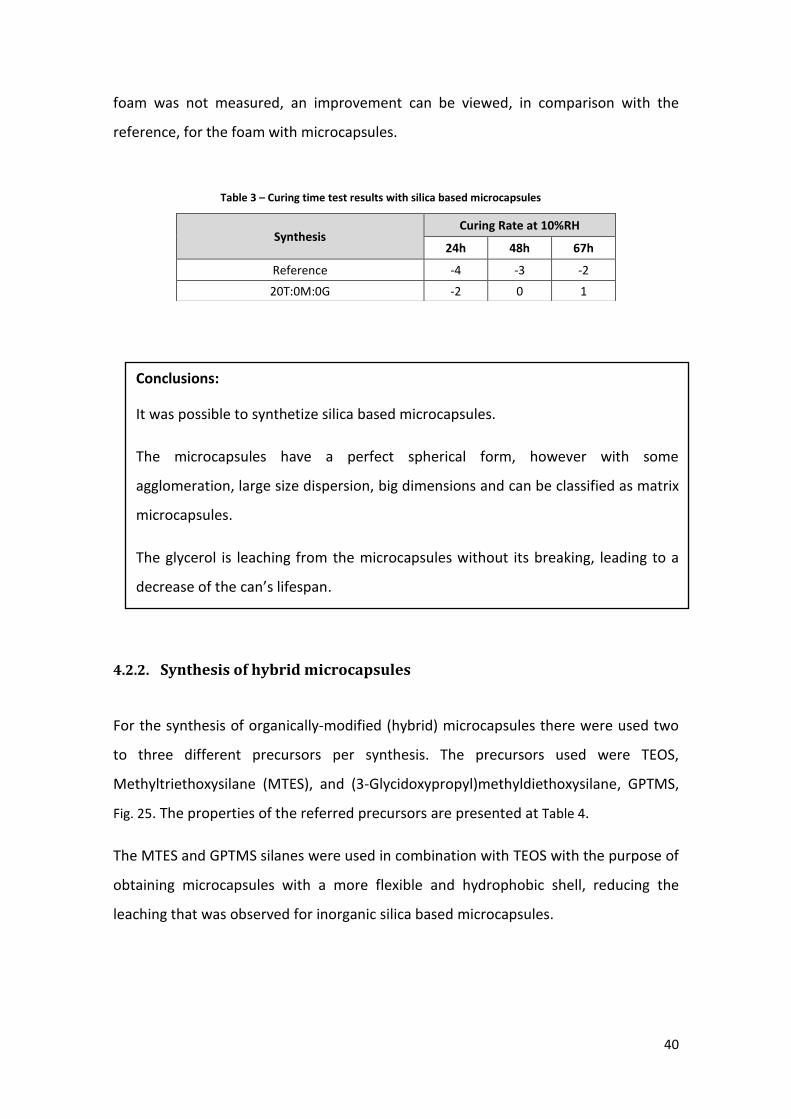
40
foam was not measured, an improvement can be viewed, in comparison with the
reference, for the foam with microcapsules.
4.2.2. Synthesis of hybrid microcapsules
For the synthesis of organically-modified (hybrid) microcapsules there were used two
to three different precursors per synthesis. The precursors used were TEOS,
Methyltriethoxysilane (MTES), and (3-Glycidoxypropyl)methyldiethoxysilane, GPTMS,
Fig. 25. The properties of the referred precursors are presented at Table 4.
The MTES and GPTMS silanes were used in combination with TEOS with the purpose of
obtaining microcapsules with a more flexible and hydrophobic shell, reducing the
leaching that was observed for inorganic silica based microcapsules.
Table 3 – Curing time test results with silica based microcapsules
Synthesis Curing Rate at 10%RH
24h 48h 67h
Reference -4 -3 -2
20T:0M:0G -2 0 1
Conclusions:
It was possible to synthetize silica based microcapsules.
The microcapsules have a perfect spherical form, however with some
agglomeration, large size dispersion, big dimensions and can be classified as matrix
microcapsules.
The glycerol is leaching from the microcapsules without its breaking, leading to a
decrease of the can’s lifespan.

41
For the synthesis of hybrid microcapsules, the experimental procedure adopted was
also the experimental base procedure, described in 4.2.1. However, in some cases, it
was required to optimize the process and make some modifications, since the
polycondensation reaction time differs among the different precursors. The quantity,
in grams, of precursors used in each synthesis was maintained and was equal to the
amount used for silica based microcapsules.
4.2.2.1. TEOS and MTES microcapsules
Experimental procedure:
There were made three different syntheses with TEOS and MTES: synthesis one:
15T:5MTES:0G; synthesis two: 10T10M:0G; synthesis three: 5T:15:M:0G.
Synthesis one and two had already been previously done in Greenseal Research. The
repetitions of these syntheses were made with the purpose of having more
Table 4 - Precursors used, and their properties, for hybrid microcapsules synthesis
Reagents Brand Density (g/ml)
Viscosity
(20C)
Purity grade
(%)
Methyltriethoxysilane (MTES) Dow Corning 0.90 _ 99
Glycidoxypropyl Trimethoxysilane (GPTMS)
Dow Corning 0.98 2.9 mPa.s 99
Tetraethyl orthosilicate (TEOS) VWR
Chemicals 0.93 0,72 mm
2s
-1 99
Fig. 25 – a) Representation of MTES, Methyltriethoxysilane, molecule and b) GPTMS, Glycidoxypropyl Trimethoxysilane, molecule
(a (b

42
microcapsules for some further characterization, as well as to ensure that the results
of the three syntheses were obtained in the exactly same reactional conditions.
In the case of synthesis one, it was necessary a reaction time of 2h30 at T3. For
reactions two and three it was necessary to react over night at T3. It is possible to
conclude that MTES polycondensation might be slower than TEOS, and so a larger
reaction time was needed.
Experimental Results:
SEM characterization was made only for the microcapsules obtained with 10T:10M:0G,
i.e. synthesis two, and 5T:15M:0G, i.e. synthesis three.
From Fig. 26 A), it is possible to observe some microcapsules aggregation. Also, it is
possible to observe that the microcapsules sizes range between 33m and 150m,
indicating not only a decrease in the size range distribution but also in the average
microcapsules size, when comparing with silica based ones, decreasing the nozzle
obstruction possibility. From the Fig. 26 B) it is possible to conclude that the
microcapsules obtained from synthesis two are core shell. However, the core size is
small in comparison with the diameter of the microcapsule.
Fig. 26- SEM images of 10T:10M:0T microcapsules. A) 90x magnification B) 500x magnification
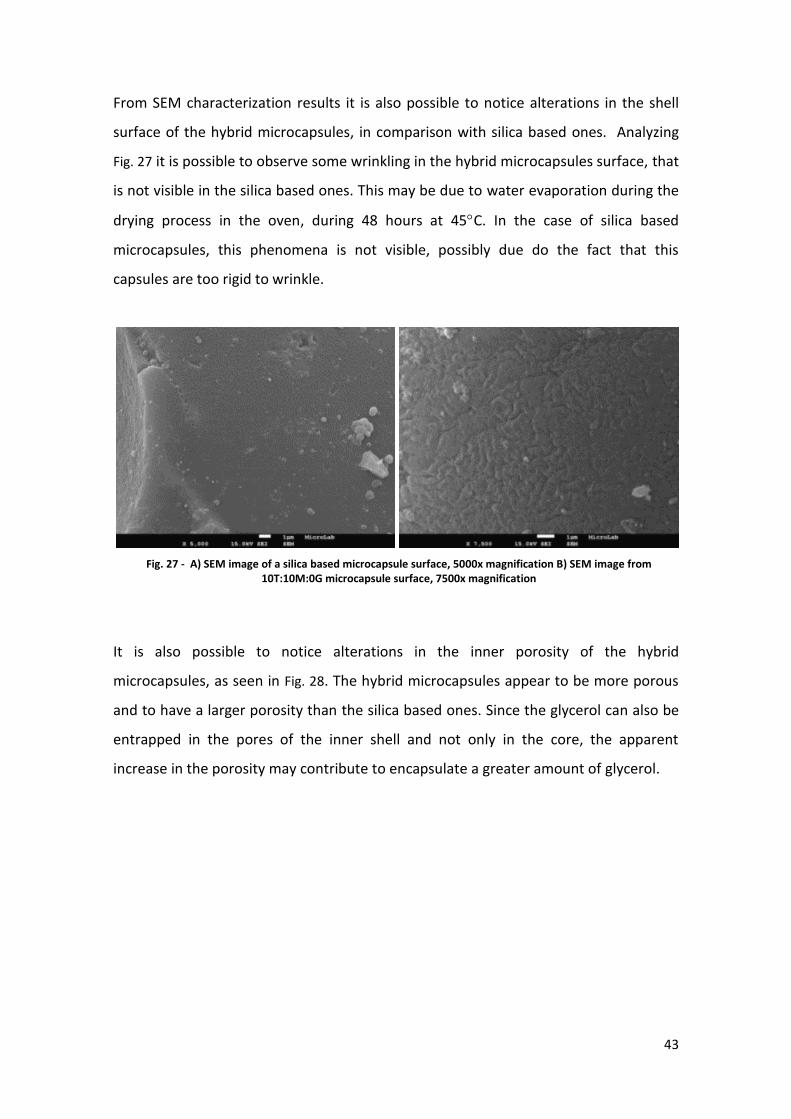
43
From SEM characterization results it is also possible to notice alterations in the shell
surface of the hybrid microcapsules, in comparison with silica based ones. Analyzing
Fig. 27 it is possible to observe some wrinkling in the hybrid microcapsules surface, that
is not visible in the silica based ones. This may be due to water evaporation during the
drying process in the oven, during 48 hours at 45C. In the case of silica based
microcapsules, this phenomena is not visible, possibly due do the fact that this
capsules are too rigid to wrinkle.
It is also possible to notice alterations in the inner porosity of the hybrid
microcapsules, as seen in Fig. 28. The hybrid microcapsules appear to be more porous
and to have a larger porosity than the silica based ones. Since the glycerol can also be
entrapped in the pores of the inner shell and not only in the core, the apparent
increase in the porosity may contribute to encapsulate a greater amount of glycerol.
Fig. 27 - A) SEM image of a silica based microcapsule surface, 5000x magnification B) SEM image from 10T:10M:0G microcapsule surface, 7500x magnification

44
As it is possible to observe in Fig. 29, the microcapsules obtained through the synthesis
three do not have a perfectly spherical shape, and the majority appears to be broken.
Also, they have larger dimensions, in comparison with both silica based and
10T:10M:0G microcapsules having about 700m (Fig. 29 A). However, this synthesis
resulted in poly-nucleated microcapsules, with larger cores, which is a desired factor,
since they may allow the encapsulation of a larger amount of glycerol.
Fig. 29 – SEM images of 5T:15M:0G A) 150x magnification B) 300x magnification
Fig. 28 – A) image of sílica based microcapsule interior, obtained from a microcapsule cross section, 30000x magnification B) SEM image from 10T:10M:0G microcapsule interior, 30000x magnification

45
For the results presented in the further characterizations, it is important to note that
the majority of the microcapsules obtained in the synthesis three may be broken.
From FTIR characterization, presented in Graphic 3, it is possible to observe that as the
amount of MTES in the microcapsules increases, the intensity of O-H band, peaked at
ca. 3300 cm-1, decreases, indicating a decrease of water in the system (the band at
1640 cm-1 also decreases) and a possible reduction of the encapsulated compound
(glycerol). The peak within the range 2750-2900 cm-1, due to C-H stretching in CH3
moieties, also increases, which is derived from the larger amount of MTES used. It is
also visible a band at around 1275cm-1 and another at 770cm-1, both related with the
presence of the Si-CH3 group. Also, the intensity of the referred bands rises with the
increase of the amount of MTES in the microcapsules. These bands can be a
confirmation that this precursor reacted with the hydrolyzed TEOS and, thereby, is
present in the microcapsules shell.
4000 3000 2000 1000
20
40
60
80
100
Si-CH3 symetric stretch
Si-CH3 stretching
stretching of the siloxane bonds
C-H stretching
O-H stretching
Tra
nsm
itta
nce
(%
)
Wavelength cm-1
15T:5M:0G
10T:10M:0G
5T:15M:0G
Graphic 3 – FTIR results for hybrid microcapsules
From the leaching test results it is possible to conclude that the leaching decreases
with the increase of MTES amount used in the synthesis, as can be seen in Graphic 4.
The synthesis with 5T:15M:0G does not show a significant leaching, however, as
observed by SEM, the majority of this synthesis microcapsules might be broken. Such
reduction in the leaching is corroborated by the FTIR results: the reduction in water

46
observed by FTIR (the more MTES the MCs contain, the more hydrophobic they are),
and possibly also some reduction in the encapsulated glycerol content.
-20 0 20 40 60 80 100 120 140 160 180 200 220 2400
1000
2000
3000
4000
5000
6000
Vis
co
sity(c
P)
Time(Hours)
15T:5M:0G
10T:10M:0G
5T:15M:0G
Graphic 4 –Leaching tests results for hybrid microcapsules
Table 5 presents the results of the shaking rate test, obtained with the microcapsules
synthetized with TEOS and MTES silanes. As it can be seen, the results obtained with
these microcapsules are not very different from the ones obtained with the reference
foams, i.e., the foam without microcapsules. Comparing with the shaking rate results
obtained with silica based microcapsules, presented in Table 2, it is possible to verify
that there was a decreasing in the leaching in OCF cans with the microcapsules
synthetized with MTES.
Table 5 – Shaking rate test results for microcapsules with MTES
Synthesis SR (Sharking Rate)
0h 72h 96h 120h
Reference foam 5 5 3 3
15T:5M:0G microcapsules 5 4 3 3
10T:10M:0G microcapsules 5 4 4 4

47
The Table 6 presents the results of the curing time test with microcapsules synthetized
with TEOS and MTES. Although the precise time of the complete curing of the foam
was not measured, an improvement in the results can be verified. The test results
obtained for the foam with 10T:10M:0G microcapsules are very similar to the ones
obtained with the silica-based microcapsules.
Table 7 presents the results obtained for string, tack free and cutting time tests for OCF
with 10T:10M:0G microcapsules. As it can be seen, the string time result was not
affected by the presence of the microcapsules. Regarding tack free and cutting times,
some difference was observed between the results obtained with and without the
microcapsules. A decrease by half in the tack free time was observed in comparison
with the reference and, in the case of the cutting time, an improvement of one hour
was perceived, which corresponds to an improvement of 40%, when comparing with
the reference results.
Table 6 – Curing time test results for microcapsules with MTES
Synthesis Curing Rate at 10%RH
24h 48h 67h
Reference -4 -3 -2
15T5M:0G microcapsules -3 -1 0
10T:10M:0G microcapsules -3 0 1
Table 7 – Tring, tack and cutting time tests results for microcapsules with MTES
Synthesis String Time Tack free Time Cutting Time
Seconds Minutes Minutes
Reference 120 39 150
10T10M:0G microcapsules 120 20 90

48
4.2.2.2. TEOS and GPTMS microcapsules
Experimental Procedure:
Two different syntheses were conducted with TEOS and GPTMS; Synthesis one:
15T:0M:5G; Synthesis two: 10T:0M:10G.
For the first synthesis there was no need for alterations to the experimental base
procedure. In the case of the second synthesis, was necessary a reaction time of 2h at
T3 for the polycondensation to fully occur.
Experimental Results:
SEM characterization was made only for the microcapsules obtained through the
second synthesis, 10T:0M:10G. It is possible to observe, from Fig. 30 A) that the
microcapsules obtained through the referred synthesis do not have a spherical form.
Instead, they appear to have an irregular shape, interconnected morphology. From Fig.
30 B), it is possible to verify that the shell surface appears to have slight circular
depressions, which differs from both silica based and MTES microcapsules. The
microcapsules diameters vary between about 70m to almost 300m, a larger range
than in the case of microcapsules synthetized with MTES.
Conclusions:
It was possible to synthetize microcapsules with TEOS and MTES precursors in
particular higher quantities of MTES (10 and 15g MTES within 20 grams total of
silanes), which is not reported in the literature up to the moment.
The microcapsules 10T:10M:0G showed the best compromise between
quality/morphology, leaching and curing speed.
Comparing to the reference foam (without microcapsules) the tack free time was
reduced by half the time and the cutting time was reduced by 40%.

49
From SEM characterization it was also possible to conclude that the interior of the
microcapsules 10T:0M:10G, Fig. 31 A), shows more similarity to the interior of silica
based ones than to 10T:10M:0G, since they seem to have a low porosity.
FTIR characterization was only made for 10T:0M:10G synthesis; therefore the results
will be compared with the ones obtained for silica based microcapsules. From Graphic 5
it is possible to observe a broad band (OH stretching) peaked at ca. 3300 cm-1, for
10T:0M:10G, which is much less intense than in the case of inorganic silica
microcapsules. Also, the peak at 1640 cm-1 and the bands between ca. 1500 and 1300
Fig. 31 – A) SEM image of 10T:0M10G microcapsules interior, 20000x magnification B) SEM image of sílica based microcapule interior, 20000x magnification
Fig. 30 - SEM images of 10T:0M:10G microcapsules. A) 90x magnification B) 1500x magnification

50
cm-1 also decrease, which means that there is less water moieties and less glycerol in
these capsules. From the Graphic 5 it is also possible to observe a shoulder at around
1097cm-1, in the band located at ca. 1000cm-1, presented only in the FTIR results for
microcapsules with the GPTMS silane. This is due to the presence of the C-O-C group,
which has stretch bands located between 1050cm-1 and 1150 cm-1. Also there is a small
peak at 915 cm-1 and 831 cm-1, ascribed to C-O and C-O-C stretching of the epoxy
(oxirane) groups of GPTMS, which reveals that the epoxy groups are still present in the
microcapsule shell and there was no ring opening polymerization phenomenon
occurring.
3600 3000 2400 1800 1200 600
20
40
60
80
100
C-O-C group stretching
stretching of the siloxane bonds
C-H stretching
O-H stretching
Tra
nsm
itta
nce
(%
)
Wavelength (cm-1)
20T:0M:0G
10T:0M:10G
In Table 8 the principal results obtained through the TGA analysis are presented. The
respective TGA thermogram is presented in Appendix D, Fig.D 2. The percentage of
mass lost until 300C was calculated, since, from the TGA thermogram of the glycerol,
presented in appendix D, Fig.D 1, it can be seen that its loss occurs until the referred
temperature. Besides the glycerol loss, some water loss can also be visible, which is
presented in the Table 8.
From Table 8, it can be seen that the microcapsules synthetized with 10T:0M:10G do
not have a high amount of encapsulated compound, since they only seem to have
Graphic 5- FTIR results of 10T:0M:10G as well as of silica based microcapsules

51
about 17,87% in mass of glycerol, which is a small amount of the overall
microcapsules’ weight.
In the Graphic 6 is represented the leaching results. As it is possible to observe, there
was a decreasing in the leaching with the increase of GPTMS amount used in the
syntheses. The Ongronat® 2500 with these microcapsules barely showed any
increasing in viscosity. However, comparing with the results obtained from FTIR
characterization, it is possible that the decreasing in leaching observed in this synthesis
may be due to a reduced amount of encapsulated glycerol.
The Table 9 shows the results obtained for the shaking rate test with 10T:0M:10G
microcapsules in OCF. As can be seen even after 120 hours, there is no difference in
the shaking rate between the reference can and the one with microcapsules. This
result indicates that there was a decreasing in the leaching in comparison with silica
based microcapsules.
Onset Temperature,C Average Temperature,C % of mass lost until 300C % of water
185,51 257 19,6 1,73
Table 8 –TGA analysis results of microcapsules synthetized with 10g of TEOS and 10g of GPTMS
0 50 100 150 200 250
0
1000
2000
3000
4000
5000
6000
Vis
co
sity (
cP
)
Time (Hours)
10T:0M:10G
15T:0M:5G
Graphic 6 – Leaching test result of hybrid microcapsules with GPTMS

52
The Table 10 presents the results of the curing time test for 10T:0M:10G microcapsules
in OCF. Although the precise time for the complete curing of the foam was not
measured, it can be seen there were no significant improvement in the curing time of
the foams with this microcapsules. When comparing with the results obtained from
silica based ones it is possible to conclude that the 10T:0M:10G microcapsules have
less effect in the curing of the foam, in line with the fact that these capsules exhibited
less glycerol encapsulated (in the FTIR spectrum).
The results obtained for string, tack free and cutting time with 10T:0M:10G
microcapsules in OCF foams are presented in the Table 11. Comparing with the results
obtained for the reference, it is possible to say that, for all the parameters studied,
there was an improvement in the results obtained with the application of the
microcapsules in the foam. A reduction of the cutting time by 40% was observed.
Synthesis SR (Sharking Rate)( hours)
0 72 96 120
Reference 5 5 3 3
10T:0M:10G microcapsules 5 4 3 3
Table 10 –Curing time test results with 10T:0M:10GP microcapsules
Synthesis Curing Rate at 10%RH
24h 48h 67h
Reference -4 -3 -2
10T:0M:10G microcapsules -3 -1 -1
Table 11 – String, tack and cutting time results of 10gTEOS 10g GPTMS microcapsules
Synthesis String Time Tack free Time Cuting Time
Seconds Minutes Minutes
Reference 120 39 150
10:T:0M:10G microcapsules 60 24 90
Table 9- Shaking rate tests results of 10T:0M:10G
53
4.2.2.3. TEOS, MTES and GPTMS microcapsules:
Experimental Procedure:
Two different syntheses were made with the TEOS, MTES and GPTMS precursors;
Synthesis one: 5T:10M:5G, synthesis two: 5T5M:10G. The first synthesis had already
been previously done in Greenseal Research. Its repetition was made with the purpose
of having more microcapsules for some further characterization as well as to ensure
that all the results of this study were obtained in the exactly same reactional
conditions.
In the case of the first synthesis it was necessary that the reaction remained at T3
during the night. For the second synthesis it was only needed that the reaction
remained at T3, for 3h30.
Experimental Results :
5T:10M:5G:
It is possible to observe that microcapsules obtained with 5T:10M:5G do not have a
perfect spherical form, instead they have an irregular shape, Fig. 32 A). In Fig. 32 B) it is
possible to observe the inside of a broken microcapsule, which seems composed by
several agglomerated microcapsules. From Fig. 32 A) it is also possible to observe that
Conclusions:
It was possible to synthetize microcapsules with TEOS and GPTMS.
The obtained microcapsules do not have a perfectly spherical shape and have a
large diameter range when comparing with the microcapsules obtained with
MTES.
These microcapsules showed a decreasing in the leaching, in comparison with the
silica based ones and did not influence the shaking rate.

54
the microcapsules have diameters ranging from about 50m to 250m, which is a
smaller range size when compared with silica based ones.
In Fig. 33 it is possible to observe a transversal section of the microcapsules, showing
the agglomerates in the inside. As it can be seen, they have a low porosity. The interior
seems similar to the ones obtained with silica based microcapsules. It is also
observable some circular depressions (interconnected morphology) in the surface of
this microcapsules, as was also observed in the ones synthetized with 10T:0M:10G.
Fig. 32 – SEM images of 5T:10M:5G microcapsules. A) 90X magnification B) microcapsule interior, 750x magnification
Fig. 33 – SEM images of 5T:10M:5G interior. A) 2500x magnification B)30000x magnification

55
5T:5M:10G:
The microcapsules obtained with 5T:5M:10G do not have a spherical shape, as seen in
Fig. 34. Instead, they seem to be composed by several microcapsules that, at some
point during the synthesis, suffered coalescence.
These microcapsules have bigger dimensions, when comparing with the 5T:10M:5G
ones. As it is visible in Fig. 34 A), they have about 400m and 700m of diameter. As
seen from Fig. 34 B), the capsule surface has several circular depressions which was
also visible in the previous synthesis, although in a smaller amount. In all the synthesis
with GPTMS, this type of circular depressions on the surface was observed.
In Graphic 7, the FTIR results obtained for the microcapsules synthetized with TEOS,
MTES and GPTMS precursors are presented, as well as the results obtained for silica
based microcapsules. As it can be seen, the O-H band, visible at ca. 3300 cm-1, is 14%
more intense in the silica based spectra, compared to the transmittance registered for
5T:5M:10G microcapsules, and 12% more intense when compared to 5T:10M:5G
microcapsules FTIR spectra. It is also possible to observe that, the more GPTMS used in
the synthesis, the lower the intensity of the O-H band.
In MTES derived microcapsules the bands corresponding to the Si-CH3 group are also
visible, at 1275cm-1 and 770cm-1. As expected, these bands have a slightly higher
Fig. 34 – SEM images of 5T:5M:10G. A) 90xmagnification B) 1500x magnification

56
transmittance intensity for the synthesis with more MTES. On the other hand, the
bands corresponding to the presence of the epoxy ring for GPTMS derived capsules are
also detected for the corresponding samples (the inset in Graphic 7).
4000 2000
20
40
60
80
100
915 cm-1
1200 1000 800
30
60
90
Tra
ns
mit
tan
ce
(%
)
W avelength (cm-1
)
5g TEOS 10g MTES 5g GPTMS
5g TEOS 5g MTES 10g GPTMS
Tra
nsm
itta
nce
(%
)
Wavelength (cm-1)
5g TEOS 10g MTES 5g GPTMS
5g TEOS 5g MTES 10g GPTMS
TEOS
more H2O and
more glycerolSi-CH3
831 cm-1
From TGA analysis, with the results presented in Table 12 and the respective
thermogram in the appendix D,Fig.D 3 , it was possible to conclude that only 15,87% of
the total weight of 5T:5M:10G microcapsules corresponds to encapsulated glycerol.
When comparing with the results obtained from the TGA for the microcapsules
synthetized with 10T:0M:10G, it is possible to conclude that the ones obtained in this
study have a lower percentage of both encapsulated glycerol and water, with a
difference of 2% and 0,34% respectively.
Onset Temperature,C Average Temperature,C % of mass lost until 300C % of water
159 259 17,26 1,39
Table 12- TGA results obtained with 5T:5M:10G microcapsules
Graphic 7 - FTIR results of 5T:10M:5G, 5T:5M:10G and silica based microcapsules

57
The leaching results for the microcapsules composed of TEOS, MTES and GPTMS
silanes are represented in Graphic 8. As it can be seen, there was no significant increase
in the viscosity of Ongronat® 2500 in the 350h range. The synthesis with more GPTMS
had, after the 350 hours, the lowest leaching value. However, it may be due to a lower
amount of glycerol encapsulated, as concluded from Graphic 7.
-50 0 50 100 150 200 250 300 350
0
2000
Vis
co
sity (
cP
)
Time (Hours)
5T:10M:5G
5T:5M:10G
The results for the shaking rate test are presented in the Table 13. As it can be seen, the
difference between the reference and the microcapsules obtained in this study is not
significant, indicating that there was a decreasing in leaching in comparison with silica
based microcapsules. However by FTIR, it was observed that the hybrid microcapsules
also have less glycerol encapsulated.
The results of the test of curing time with the microcapsules composed of TEOS, MTES
and GPTMS silanes are presented in the Table 14. Although the precise time of the
complete curing of the foam was not measured, it can be seen that, the microcapsules
Synthesis SR (Shaking Rate)( horas)
0h 72h 96h 120h
Reference 5 5 3 3
5T:10M:5G microcapsules 5 4 4 -
5T:5M:10G microcapsules 5 4 4 3
Table 13 – Shaking rate test results of microcapsules synthetized with TEOS, MTES and GPTMS
Graphic 8 – Leaching test results for microcapsules synthetized with TEOS, MTES and GPTMS
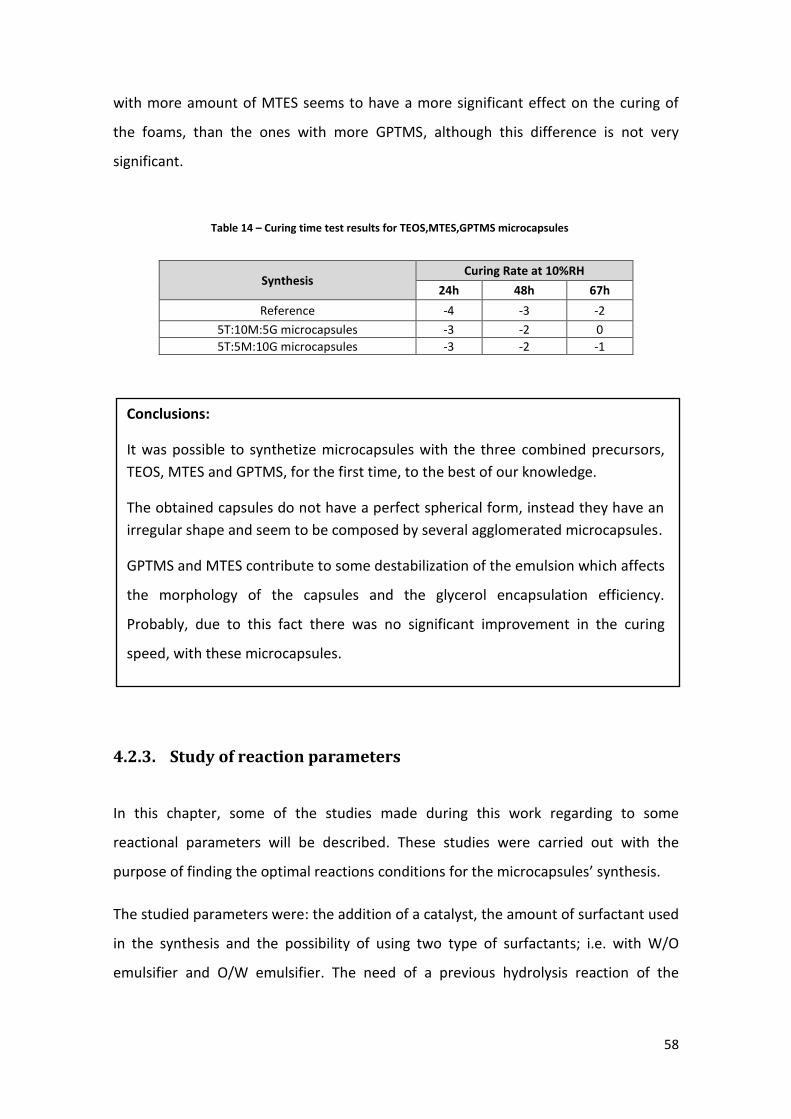
58
with more amount of MTES seems to have a more significant effect on the curing of
the foams, than the ones with more GPTMS, although this difference is not very
significant.
4.2.3. Study of reaction parameters
In this chapter, some of the studies made during this work regarding to some
reactional parameters will be described. These studies were carried out with the
purpose of finding the optimal reactions conditions for the microcapsules’ synthesis.
The studied parameters were: the addition of a catalyst, the amount of surfactant used
in the synthesis and the possibility of using two type of surfactants; i.e. with W/O
emulsifier and O/W emulsifier. The need of a previous hydrolysis reaction of the
Table 14 – Curing time test results for TEOS,MTES,GPTMS microcapsules
Synthesis Curing Rate at 10%RH
24h 48h 67h
Reference -4 -3 -2
5T:10M:5G microcapsules -3 -2 0
5T:5M:10G microcapsules -3 -2 -1
Conclusions:
It was possible to synthetize microcapsules with the three combined precursors,
TEOS, MTES and GPTMS, for the first time, to the best of our knowledge.
The obtained capsules do not have a perfect spherical form, instead they have an
irregular shape and seem to be composed by several agglomerated microcapsules.
GPTMS and MTES contribute to some destabilization of the emulsion which affects
the morphology of the capsules and the glycerol encapsulation efficiency.
Probably, due to this fact there was no significant improvement in the curing
speed, with these microcapsules.

59
silanes was also studied and finally the possibility of increasing the amount of
encapsulated glycerol.
4.2.3.1. Catalyst:
The main purpose of this study was to lower the cost of future microcapsules
production at a large scale, by decreasing the time of reaction. With the use of a
catalyst, the period of time necessary to apply heating decreased, also, this reaction
alteration may allow a future increase in the production scale, since more
microcapsules can be produced in the same amount of time.
For this study an acidic catalysis was used; hydrofluoric acid, HF. The catalyst
properties are present at Table 15.
The syntheses chosen for this study were the one with 10T:10M:0G, since it is the
synthesis that requires more reaction time, and the one with 10T:0M:10G, in
continuation with the previous study, 4.2.2.1, as a new attempt to diminish the price
production of this synthesis.
Experimental procedure:
In these syntheses, the microcapsules were not subjected to heating at T3. After one
hour reacting at T2, three droplets of HF were added to the reaction. The HF was let to
react during one minute, after which another three droplets were added to the
solution.
The “reference”, in this study, are the equivalent synthesis, i.e. 10T:0M:10G and
10T:10M:0G, without the HF addition.
Table 15- HF properties
Reagents Brand Density (g/ml)
Viscosity (mPaS)
(20C) Purity grade (%)
Hydrofluoric Acid (HF) Riedel-de
Haёn 1,15 0.9810 40
60
Experimental results:
In both syntheses, after the addition of the three droplets of HF, the microcapsules
were formed almost instantaneously. However, in both cases the synthesis’ yield was
significantly lower. In the case of 10T:0M:10G(+HF) synthesis, a decrease of about
14,94% was observed and, in the case of 10T:10M:0G(+HF), of about 12.89% in the
reaction yield, when comparing with the respective references.
The FTIR results obtained for these syntheses confirm the presence of encapsulated
material. The FTIR spectrum is presented in appendix B, Fig.B 1. However, it is not
conclusive regarding the amount of glycerol encapsulated in the microcapsules
obtained through catalyzed syntheses in comparison with the non-catalyzed ones. In
one case of 10T:0M:10G (+HF) microcapsules, the O-H broad band is more intense for
the microcapsules obtained through the catalyzed synthesis. For the 10T:10M:0G
synthesis, the O-H band of the reference is more intense.
4.2.3.2. Surfactant
In the first study of this chapter, the amount of surfactant used for the emulsion
formation was increased, as a possibility to obtain a better emulsion stability and to
avoid aggregated and big sized microcapsules. The syntheses chosen for this study
Conclusions:
The synthesis of microcapsules with an acidic catalyst is a possibility; the addition
of a catalyst has led to an instantaneous microcapsule formation, as desired, and it
was confirmed that glycerol was encapsulated.
The yield decreased significantly when the catalyst was used, in comparison with
the reference.
More studies might be needed to obtain the optimal reaction conditions for the
microcapsules’ synthesis with the addition of a catalyst.

61
were the ones with 10T:10M:0G and with 5T:15M:0G, since the microcapsules
obtained through them were aggregated.
In the second study, the possibility of using two different types of surfactant, W/O and
O/W, for the emulsion formation was investigated. This study was carried out with the
surfactants SPAN 80,Fig. 35, and DC193, Fig. 36, with the respective characteristics
presented in Table 16. The synthesis chosen was the 20T:0M:0G. With this alteration,
smaller microcapsules were hoped to be obtained, as well as with a narrower diameter
range.
Table 16- SPAN80 and DC193 principal characteristics
Reagents Brand Density (g/ml) Viscosity
(20C)
Purity grade (%)
HLB
SPAN80 Merck 0.93 1200 mPas
99 4.3
DC193 Dow Corning 1,07 260cSt _ 12
Fig. 35 - SPAN 80 molecule
Fig. 36- DC193 molecule

62
4.2.3.2.1. Surfactant quantity
Experimental procedure:
In this study, the amount of surfactant used was increased by 1/2 in comparison with
the amount used in the experimental base procedure. Being so, for the emulsion
formation, 3g of SPAN 80 was used instead of 2g. The reactions were also subjected to
heating at T3 for more than an hour, since, as already discussed, the syntheses with
MTES require more reaction time.
The “references”, in this study, are the equivalent synthesis, i.e. 10T:10M:0G and
5T:15M:0G, in which the emulsion was formed with only 2g of SPAN 80.
Experimental results:
The surfactant increase in the synthesis with 10T:10M:0G(+ surfactant) did not lead to
microcapsule formation. More than one attempt was made however with no positive
results.
Two syntheses with 5T:15M:0G(+surfactant) were made. The reaction yields were
lower than the ones of the reference syntheses, with a decrease of 6% and 4.84%. In
the Fig. 37 the SEM results for the microcapsules obtained in the two syntheses of this
study are presented. As it can be seen, in both cases all the microcapsules appear to be
broken.

63
By comparing the SEM results of the microcapsules obtained in this study with the
reference ones, Fig. 38, it can be seen that, in both cases the microcapsules appear to
be core shell. Despite the fact that the microcapsules are still broken, they have
smaller sizes and, it seems, a more spherical form. One major difference observed in
the microcapsules synthetized with more amount of SPAN80 is the existence of more
holes in the surface of the shell.
Fig. 37 – SEM of 5T:15M:0G(+surfactant) microcapsules. A)100x magnification B) 90x magnification
Fig. 38 – SEM characterization of the reference microcapsules (5T:15M:0G microcapsules, with 2g of SPAN80) A) 300 x magnification B) 150x magnification

64
4.2.3.2.2. Use of two surfactants
Experimental Procedure:
In this study, two different surfactants were used, SPAN 80 and DC193, with the
principal characteristics presented in Table 16. The two surfactants have different HLB
values, SPAN 80 is a W/O emulsifier, while the DC193 is an O/W emulsifier. Being so,
the SPAN 80 (lower HLB value) was added to the oil phase and the DC193 (higher HLB
value) was added to the water phase. The total amount of surfactant used in this study
was equal to the amount used in the experimental base procedure; instead of 2g of
SPAN 80, it was used 1,5g g of SPAN 80 and 0,5g of DC193.
The “reference”, in this study, are the equivalent synthesis, i.e. 20T:0M:0G, for which
the emulsion was formed only with one surfactant, SPAN 80.
Experimental results:
Two syntheses with 20T:0M:0G(2 surfactants) were made. After the filtration step, the
microcapsules were observed under optical microscope. The results obtained in the
two syntheses were not similar, since the microcapsules obtained in the second one
Conclusions:
The increase of the surfactant amount contributed to a decrease of the
microcapsules’ size, as well as for the formation of microcapsules with a more
spherical shape.
In the case of the synthesis with 10T:10M:0G(+surfactant), it was not possible to
obtain microcapsules.
For the synthesis with 5T:15M:0G(+surfactant), all the microcapsules seemed to
be broken and showed more holes in the shell surface, when comparing with the
reference ones.

65
seemed more immature and aggregated, not with a loose powder appearance, as the
ones obtained in the first synthesis, as seen in Fig. 39.
In the Fig. 40, it is possible to observe the SEM images of the same microcapsules
presented in the Fig. 39.
Comparing with the reference, Fig. 41 it can be seen that the spherical form of the
microcapsules was maintained, as well as its aggregation, which was hoped to have
decreased. However, one significant improvement was observed in microcapsules
obtained in this study; they were core shell microcapsules, which is a desired
characteristic. Another alteration observed was the holes in the shell surface, which
may lead to an eventual loss of the encapsulated material, however these might have
Fig. 40- SEM images of silica based microcapsules with two surfactants A) 90x magnification B) 900x magnification
Fig. 39- Photograph taken under optical microscope.
The microcapsules were subjected to 45C heating for 48h
100m

66
been formed during the sample preparation for the SEM analysis and/or at the vacuum
chamber of the equipment.
From the FTIR results, presented in appendix B, Fig.B 2, it was possible to observe that
the intensity of the microcapsules’ O-H bands obtained with two surfactants is similar
to the reference microcapsules. It was expected, from core shell microcapsules, that
the amount of glycerol encapsulated would be higher. However, since the
microcapsules appear to be broken, this result may not be representative of the
storage capacity of these capsules.
Fig. 41 – SEM images of reference microcapsules A) 90x magnification B) 500x magnification
Conclusions:
The use of two surfactants for the emulsion formation has showed both negative
and positive results:
The microcapsules obtained were core shell, which can contribute to a higher
amount of encapsulated glycerol;
However, holes were observable in the shell surface, which may lead to a loss of
the encapsulated compound. It was hoped that, with this alteration, the
microcapsules aggregation would decrease, which was not observed.

67
4.2.3.3. Hydrolysis
In this study the need for a previous hydrolysis reaction was tested, replacing this step
with the addition of acidic water in the aqueous phase of the emulsion. Being so, the
silanes would hydrolyze as the contact with the water phase was made.
The final purpose of this alteration was to obtain core shell silica based microcapsules.
This study was based on the article “Preparation of Mannitol@Silica core–shell
capsules via an interfacial polymerization process from water-in-oil emulsion” [37],
where it is stated that it was possible to synthetize core shell microcapsules without
the pre-hydrolysis step, since the shell growth that occurs outside-in regarding to the
emulsion droplets, stops when the shell is too compact for the precursor to penetrate
inside.
Experimental procedure:
For the Sol-Gel technique to succeed, it is necessary that the precursor undergoes
successive hydrolysis and condensation reactions. However, in this study, instead of a
previous hydrolysis reaction step, the precursor was directly added to the emulsion,
while at T1 subjected to mechanical agitation. The water used for the emulsion
formation was the acidified water that was used for the pre-hydrolysis reaction step in
the experimental base procedure. In this study, the precursors should hydrolyze when
in contact with the acidified water present in the emulsion droplets.
The amount of time at which the syntheses reacted under T3 increased was increased.
Two syntheses were made, in one case 1h30 at T3 was needed while for the other it
was necessary 2h00. The need for more reaction time can be explained by the fact that
the silane precursor is not yet hydrolyzed, when added to the emulsion.
The “reference” in this study was the 20T:0M:0G microcapsules synthetized with the
pre-hydrolysis step.

68
Experimental results:
The microcapsules obtained through the first synthesis, that reacted at T3 during 1h30,
looked immature and a poorly aggregated, when observed under optical microscope.
Some core shell microcapsules could be found, however the majority seemed to be
porous matrix microcapsules. The ones obtained with more reaction time at T3
seemed more mature than the previous ones, however, it was only possible to observe
matrix microcapsules.
Since the objective of this study was to obtain core shell microcapsules, the
characterizations were made for the first synthesis.
From the Fig. 42 it is possible to observe that, in fact, the microcapsules obtained were
matrix microcapsules and not core shell, as expected. As it was already observed by
optical microscope, the microcapsules are aggregated.
As seen in Table 17, some significant results were observed regarding the curing time of
OCF, not only comparing with the foam without microcapsules but also with the foam
with the reference microcapsules. This result can be due to a difference in the
microcapsules porosity, due to the alteration of the hydrolysis step.
Fig. 42 – SEM of 20T:0M:0G(-hydrolysis) microcapsules, with acidic water in the emulsion

69
The leaching in Ongrontat2500 was also studied. The test results are presented in Fig.C
1, appendix C. In comparison with the reference, no improvements were observed
with these microcapsules. After 168 hours the Ongronat was already solid, as was
observed with the reference microcapsules.
4.2.3.4. Quantity of the encapsulated compound
In this chapter, the possibility of changing the amount of glycerol to be encapsulated
was studied.
The emulsion system is composed by an oil and water phase, with glycerol in the
water droplets. The water is necessary for the emulsion formation, but it is not desired
in the final product. So, the possibility of the emulsion to be composed of more
quantity of encapsulating compound than water was studied, with the purpose of
Synthesis Curing Rate at 10%RH
0h 24h 48h 67h 72h
Reference of 20T:0M:0G - -4 -3 -2 -
20T:0M:0G microcapsules - -2 0 1 -
Reference of 20T:0M:0G (-hydrolysis) -5 -4 -2 - -1
20T:0M:0G (-hydrolysis) -4 0 3 - 5
Table 17 - Curing time test results of microcapsules synthetized without the pre-hydrolysis step, and the respective references
Conclusions:
Although the microcapsules obtained through this method were not core shell, as
desired, some improvements in the OCF tests results were observed, when
comparing with the reference ones.
For the application of these microcapsules in OCF foams, it would be necessary to
previously decrease the observed leaching.
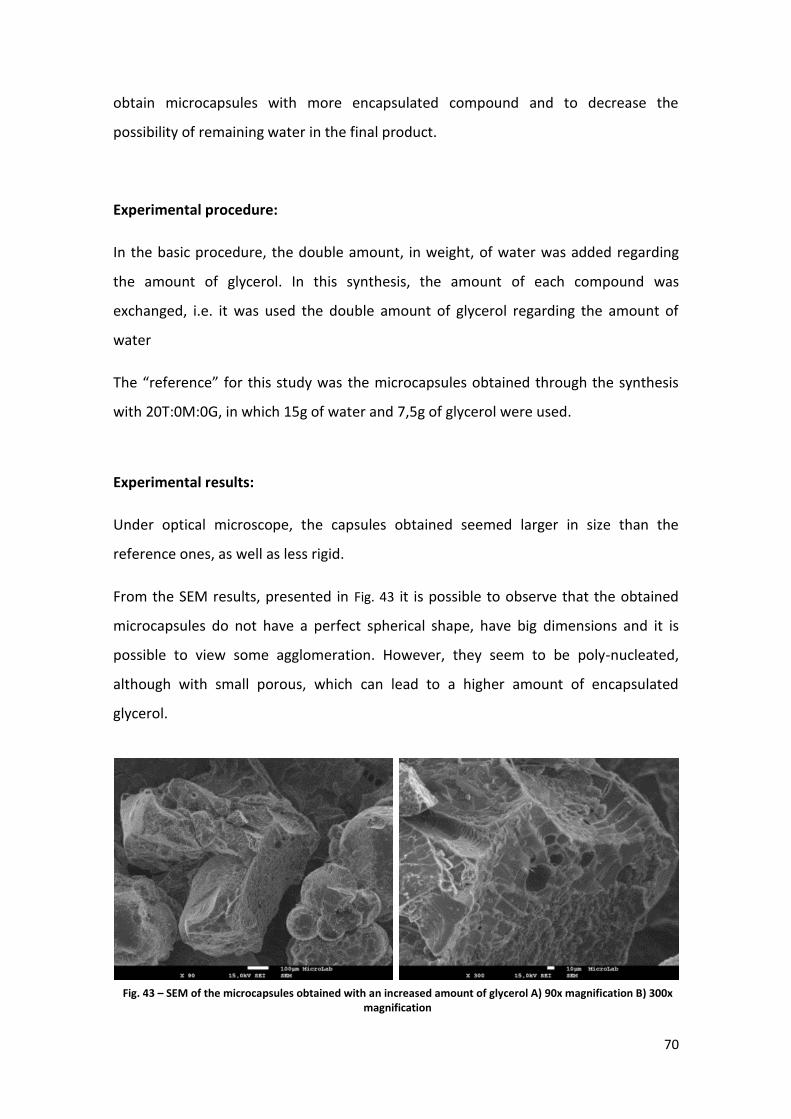
70
obtain microcapsules with more encapsulated compound and to decrease the
possibility of remaining water in the final product.
Experimental procedure:
In the basic procedure, the double amount, in weight, of water was added regarding
the amount of glycerol. In this synthesis, the amount of each compound was
exchanged, i.e. it was used the double amount of glycerol regarding the amount of
water
The “reference” for this study was the microcapsules obtained through the synthesis
with 20T:0M:0G, in which 15g of water and 7,5g of glycerol were used.
Experimental results:
Under optical microscope, the capsules obtained seemed larger in size than the
reference ones, as well as less rigid.
From the SEM results, presented in Fig. 43 it is possible to observe that the obtained
microcapsules do not have a perfect spherical shape, have big dimensions and it is
possible to view some agglomeration. However, they seem to be poly-nucleated,
although with small porous, which can lead to a higher amount of encapsulated
glycerol.
Fig. 43 – SEM of the microcapsules obtained with an increased amount of glycerol A) 90x magnification B) 300x magnification

71
From FTIR results, presented in appendix B, Fig.B 3, it was possible to conclude that, in
comparison with the reference, the microcapsules obtained through this synthesis
have an O-H band with a 3,3% more intensity and the peaks within the 1500 and 1300
cm-1 range, due to CH2 and OH bending of glycerol are also slightly more intense, which
reveals indeed more glycerol encapsulated in the microcapsules structure.
The results for the curing time test are presented in Table 18. The results with the
microcapsules obtained in this study do not show a significant effect in the curing of
the foam. In comparison, the reference microcapsules seem to have a more significant
effect, which was not expected since the amount of glycerol encapsulated seem to be
inferior.
The results obtained for the string, tack free and cutting time were only compared with
the ones obtained with the OCF foam without capsules. As seen in the Table 19 the
results obtained with these microcapsules did not present a significant improvement in
the curing time, when comparing with the results obtained for the OCF without
capsules.
Synthesis Curing Rate at 10%RH
24h 48h 67h 120h
Reference of 20T:0M:0G -4 -3 -2 -
20T:0M:OG -2 0 1 -
Reference 20T:0M:0G (+glycerol) 0 2 - 4
20T:0M:0G (+glycerol) 0 1 - 5
Table 18- Curing time results of silica based microcapsules synthetized with an increased amount of glycerol and respective references
Table 19 - String, tack free and cutting time results with silica based microcapsules obtained with an increased amount of glycerol
Synthesis String Time Tack free Time Cutting Time
Seconds Minutes Minutes
Reference of 20T:0M:0G (+glycerol) 29 15 110
20T:0M:0G (+glycerol) 36 15 94

72
Viscosity studies with Ongronat® 2500 were also made. The test results are presented
in Fig.C 2, appendix C. Some leaching was observed with the microcapsules synthetized
in this study, however not as significant as the observed with the reference
microcapsules.
4.2.4. Changes in shell material
In this chapter, some studies regarding to alterations made to the shell’s materials of
some microcapsules will be described. These studies were carried out with the
purpose of improving some microcapsules’ characteristics, such as the mechanical
resistance, the hydrophobicity of the shell and the decrease of the observed leaching.
The alterations that are described in this chapter were performed with the addition of
different precursors and chemical components, presented in Table 20. In some cases,
additives with desired characteristics were also added to the synthesis, which did not
reacted with the precursor, but were entrapped in the silica matrix, inducing to desired
alterations in the properties of shell. The last study presented in this chapter describes
a post-treatment performed in microcapsules that were already subjected to 45C
heating for 48h.
Conclusions:
The results were not very conclusive. Although the O-H band was more intense than
the reference, indicating that there was more glycerol encapsulated, the results
obtained in the tests in OCF foams showed that these microcapsules had a less
significant effect in the curing process. This might possibly be due to the fact that
the microcapsules did not break during the spray
It would be important to try to decrease the size of the obtained microcapsules, in
order to prevent accumulation in the nozzle after the first spray in OCF cans.

73
4.2.4.1. Silica/Epoxy in TEOS/GPTMS synthesis:
In this study, an attempt to produce silica based microcapsules displaying epoxy resin
rich regions was conducted, in order to create hybrid capsules, as well as to add amine
groups to the shell, which will be fundamental to a study presented later on this work.
The silica/epoxy microcapsules were obtained with the silanes TEOS and GPTMS and
the curing agent EDA. As already mentioned in this work, the GPTMS precursor has an
epoxy ring. The EDA curing agent reacts with the epoxy ring, opening it (ring opening
polymerization), leading to the formation of an organic matrix, and the nitrogen
molecule becomes part of the structure, as presented in Fig. 44. The structure will be
more reticulated as more nitrogen groups the curing agent has.
Epoxy resins are used in many applications mostly because of their desirable
properties: heat, solvent, moisture and chemical resistance, good mechanical and
electrical properties and great adherence to many substrates.[38][39]
Reagents Brand Density (g/ml) Viscosity
(mPas) (20C)
Purity grade (%)
EDA – Ethylenediamine Fluka
analytica 0,899 1.7 <99,5
Aminosilane Alfa Aesar 1,010 _ 90
Ongronat® 2500 BorsodChem 1,24 520 _
Table 20 – Principal characteristics of the reagents used for changes in the shell composition
Fig. 44 – Representation of the reaction between EDA and GPTMS

74
Experimental Procedure:
In this study, the microcapsules were synthetized with 10T:0M:10G. The ratio of EDA
used was 0,55 EDA to one GPTMS molecule, since EDA has two amine groups and the
GPTMS one epoxy group.
With the addition of EDA, neither high temperatures nor so much reactional time was
needed, since EDA is a strong basis and, consequently, a reactional catalyst. Also, an
ice bath was used while adding the hydrolysis solution to the emulsion, to which the
EDA was added, and it was maintained for 30 more minutes. The ice bath was used in
order to decrease the EDA reaction, since it was desired that the TEOS and GPTMS
would react with each other at some extent before the EDA would react with the
GPTMS silane.
The “reference” in this study will be the microcapsules 10T:0M:10G.
Experimental results:
The first synthesis (S1) was subjected to 30 minutes of reaction in an ice bath, one
hour at T1 and one hour at T2. After 15 minutes reacting at T1, some polymerized
material was already seen in the reactional balloon.
As seen in Fig. 45 the obtained microcapsules have a perfect spherical shape, being
more similar to the ones obtained with 20T:0M:0G than to the reference ones. It can
be seen in Fig. 45 a) that there is a big size distribution, 25m to 225m, however the
microcapsules have relatively smaller sizes when compared with both silica based and
the reference microcapsules. In Fig. 45 b) it is possible to observe that the
microcapsules obtained are poly-nucleated microcapsules, although the pores are very
small when comparing with the microcapsule’s diameter.

75
In an attempt to obtain more microcapsules, a synthesis was made, (S2), in which all
the reagents used were increased to more ½ of its initial amount, i.e. 15T:0M:15G
were used.
From the viscosity test results, presented in Fig.C 3, appendix C, it is possible to
conclude that the microcapsules obtained through the synthesis (S1) have more
leaching than the ones obtained through the synthesis (S2) and the reference.
However, no significant changes were observed when comparing, for example, to the
silica based ones.
From the FTIR results, presented in appendix B, Fig.B 4, it can be seen that the synthesis
(S1) may have much more OH groups, from possibly more abundant encapsulated
glycerol, but also those OH groups formed by ring opening polymerization (Fig. 43),
which also can explain the results obtained from the viscosity tests. It is also possible
to observe that, the broad O-H band of the (S1) microcapsules is shifted to shorter
wavenumbers and the bands in the range of 1470 and 1430 cm-1 are more intense.
Both these facts are an evidence of the presence of NH groups, formed by epoxy ring
opening polymerization, which is a clear evidence of the successful reaction between
EDA and GPTMS, forming a hybrid, silica-rich and epoxy–rich shell.
Fig. 45 – SEM images of microcapsules synthetized with EDA. a) 90x magnification b) 550x magnification

76
TGA analysis was also made for the synthesis (S1) microcapsules, its results are
presented in Table 21 and its thermogram is presented in appendix D, Fig.D 4. It was
possible to conclude that about 26,51% of the total weight of these capsules is
encapsulated glycerol. When comparing with the results obtained for the reference
capsules, it is possible to conclude that the ones obtained in this study have an higher
percentage of encapsulated glycerol, with an increase of about 8,64%, which is
accordant with the FTIR results. Regarding to water, no water loss was visible through
the TGA analysis.
From Table 22 it is possible to observe that there was no significant decrease in shaking
rate results with the microcapsules obtained from synthesis (S1). The results obtained
with these microcapsules are also similar to the reference.
From Table 23 it is possible to observe that the foam with the microcapsules obtained
from synthesis (S2) does not show any improvement in the curing time results, when
comparing with the reference foam. The microcapsules obtained from synthesis (S1)
were the ones that had shown a more significant effect on the curing time.
Table 21 - TGA results obtained with the microcapsules 10T:0M:10G(+EDA)
Onset Temperature,C Average Temperature,C % of mass lost until 300C % of water
137,29 215,64 26,51 0
Synthesis SR (Shaking Rate) (hours)
0h 72h 96h 120h
Foam with no MCs 5 5 3 3
Reference 5 4 3 3
Synthesis (S1) 5 4 4 2
Table 22 - Shaking rate test results of 10T:0M:10G and synthesis (S2) microcapsules

77
4.2.4.2. Silica/ Silicone synthesis:
The purpose of this study was to incorporate silicone (polysiloxane) in the shell, as an
attempt to add Polydimethylsiloxane (PDMS) structures to the shell, since they might
confer hydrophobicity to the microcapsules and, consequently, contribute to decrease
the amount of superficial water, as well as the leaching, observed in some
microcapsules.
Two different silicones were used for this purpose, with the trade names Baysilone and
a Silopren, both from Momentive. Both silicones have OH terminated dimethylsiloxane
groups, which may allow polycondensation between the silicones and the silanes, and
thus covalently incorporate the silicones in the microcapsule’s structure.
Table 23 - Curing time test results obtained with 10T:0M:10G, synthesis (S2) and (S4) microcapsules
Synthesis Curing Rate at 10%RH
24h 48h 67h 72h
Reference of 10T:0M:10G and Synhtesis (S1) -4 -3 -2 -
10T:0M:10G microcapsules -3 -1 -1 -
Synthesis (S1) -2 0 0 -
Reference of Synthesis (S2) -1 1 - 4
Synthesis (S2) -1 1 - 4
Conclusions:
It was possible to synthetize hybrid microcapsules with EDA incorporated in the
shell structure.
These microcapsules have a perfectly spherical shape, in contrast with 10:0M:10G
and, in case of (S1) microcapsules, the results in the foam test showed some
improvements.
Some improvement might be needed, regarding the synthesis reproducibility.
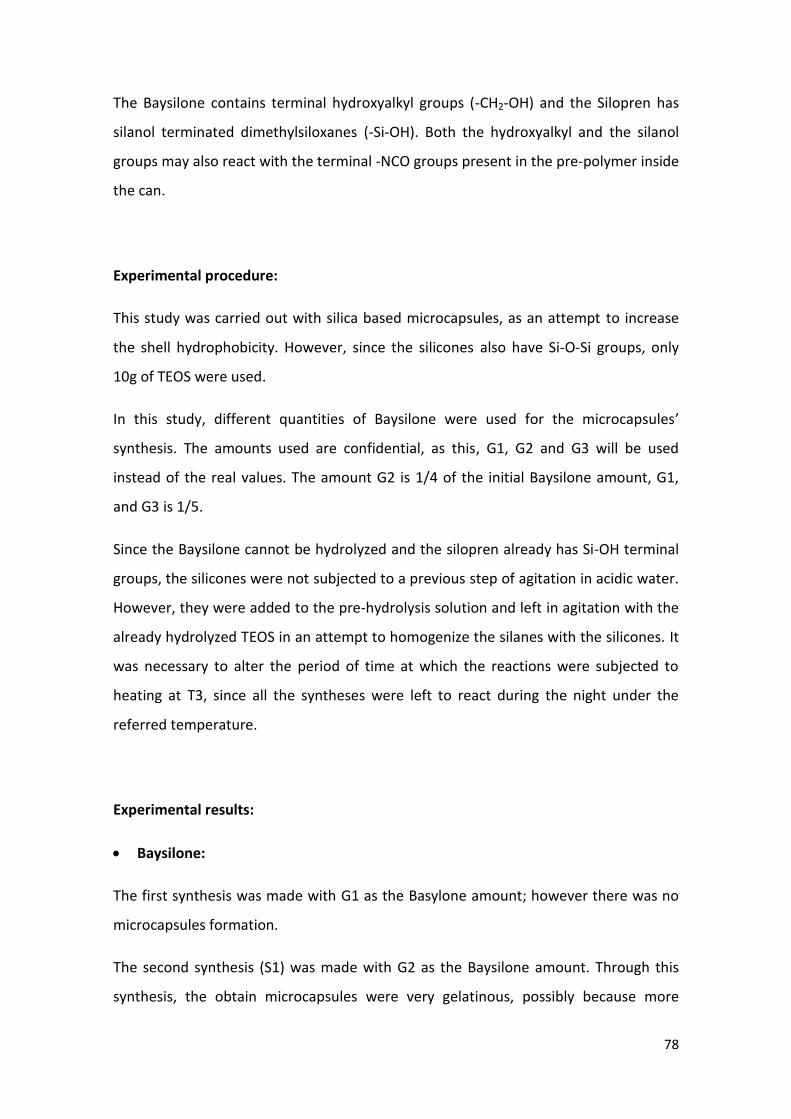
78
The Baysilone contains terminal hydroxyalkyl groups (-CH2-OH) and the Silopren has
silanol terminated dimethylsiloxanes (-Si-OH). Both the hydroxyalkyl and the silanol
groups may also react with the terminal -NCO groups present in the pre-polymer inside
the can.
Experimental procedure:
This study was carried out with silica based microcapsules, as an attempt to increase
the shell hydrophobicity. However, since the silicones also have Si-O-Si groups, only
10g of TEOS were used.
In this study, different quantities of Baysilone were used for the microcapsules’
synthesis. The amounts used are confidential, as this, G1, G2 and G3 will be used
instead of the real values. The amount G2 is 1/4 of the initial Baysilone amount, G1,
and G3 is 1/5.
Since the Baysilone cannot be hydrolyzed and the silopren already has Si-OH terminal
groups, the silicones were not subjected to a previous step of agitation in acidic water.
However, they were added to the pre-hydrolysis solution and left in agitation with the
already hydrolyzed TEOS in an attempt to homogenize the silanes with the silicones. It
was necessary to alter the period of time at which the reactions were subjected to
heating at T3, since all the syntheses were left to react during the night under the
referred temperature.
Experimental results:
Baysilone:
The first synthesis was made with G1 as the Basylone amount; however there was no
microcapsules formation.
The second synthesis (S1) was made with G2 as the Baysilone amount. Through this
synthesis, the obtain microcapsules were very gelatinous, possibly because more
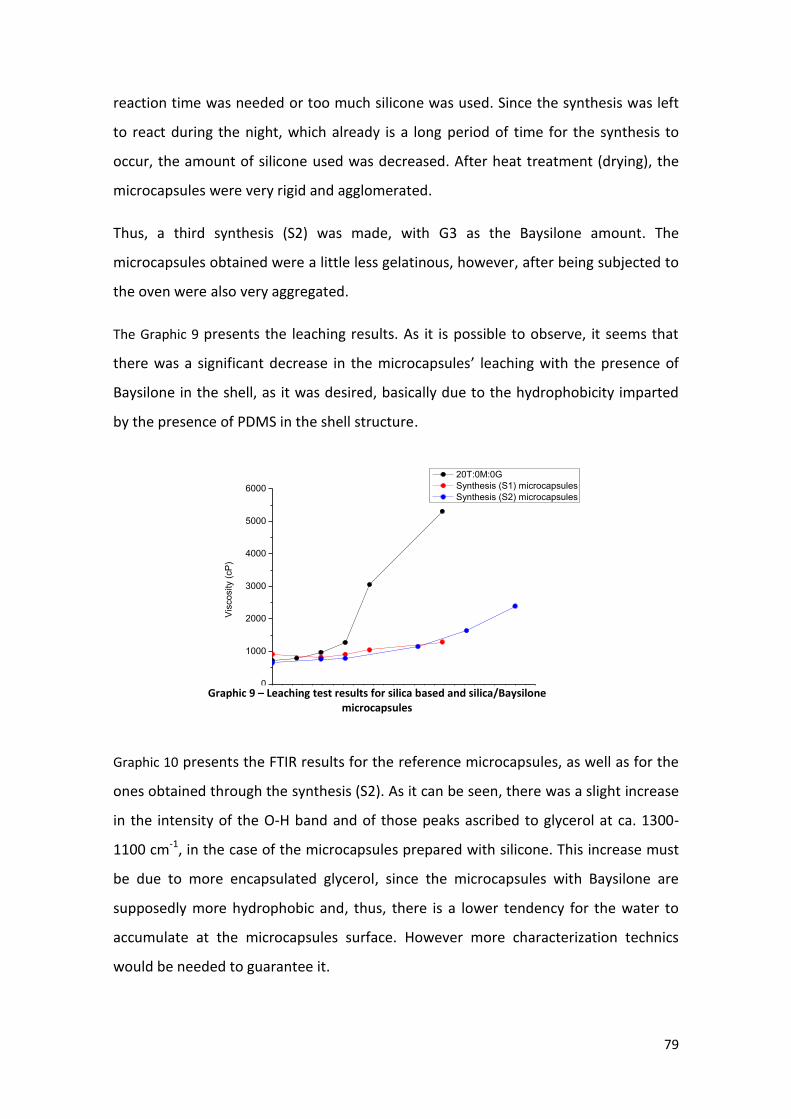
79
reaction time was needed or too much silicone was used. Since the synthesis was left
to react during the night, which already is a long period of time for the synthesis to
occur, the amount of silicone used was decreased. After heat treatment (drying), the
microcapsules were very rigid and agglomerated.
Thus, a third synthesis (S2) was made, with G3 as the Baysilone amount. The
microcapsules obtained were a little less gelatinous, however, after being subjected to
the oven were also very aggregated.
The Graphic 9 presents the leaching results. As it is possible to observe, it seems that
there was a significant decrease in the microcapsules’ leaching with the presence of
Baysilone in the shell, as it was desired, basically due to the hydrophobicity imparted
by the presence of PDMS in the shell structure.
Graphic 10 presents the FTIR results for the reference microcapsules, as well as for the
ones obtained through the synthesis (S2). As it can be seen, there was a slight increase
in the intensity of the O-H band and of those peaks ascribed to glycerol at ca. 1300-
1100 cm-1, in the case of the microcapsules prepared with silicone. This increase must
be due to more encapsulated glycerol, since the microcapsules with Baysilone are
supposedly more hydrophobic and, thus, there is a lower tendency for the water to
accumulate at the microcapsules surface. However more characterization technics
would be needed to guarantee it.
0 20 40 60 80 100 120 140 160 180 200 220 240 260
0
1000
2000
3000
4000
5000
6000
Vis
co
sity (
cP
)
Time (Hours)
20T:0M:0G
Synthesis (S1) microcapsules
Synthesis (S2) microcapsules
Graphic 9 – Leaching test results for silica based and silica/Baysilone microcapsules

80
4000 3000 2000 1000
20
40
60
80
100
Tra
nsm
itta
nce
(%
)
Wavelength cm-1
20T:0M:0G
Synthesis (S2) microcapsules
Graphic 10 – FTIR results of silica based and Synthesis (S2) microcapsules
Silopren:
Two syntheses with Silopren were made. In both synthesis the amount of Silopren
used was G3, which is the same amount referred in the case of Baysilone. The first one,
synthesis (S3) was left to react during the night at T3. The microcapsules obtained
through this synthesis were not gelatinous, as the ones obtained with Baysilone.
Since the microcapsules obtained through synthesis (S3) did not seem gelatinous, in
the second synthesis (S4) the reaction was stopped after 4h at T3, in an attempt to
decrease the synthesis time needed. The result was identical to the one obtained in
synthesis (S3).
Fig. 46, presents the SEM results of the microcapsules obtained through the synthesis
(S4). As it can be seen, the obtained microcapsules are very different from the
reference ones. Its shape is irregular, instead of perfectly spherical, and the surface
seems rough, not as smooth as the reference microcapsules’ surface.
From the cross section of a broke microcapsule it is possible to observe that it has two
minimal cores in the center, however too small in comparison with the microcapsule
diameter.

81
The leaching test results are presented in Fig.C 4, appendix C. As it can be seen,
distinguish results were obtained, from synthesis (S3) and synthesis (S4). An
improvement was observed in the case of the microcapsules obtained from the
synthesis (S3), while, in the case of synthesis (S4) microcapsules, more leaching was
observed, when comparing with the reference microcapsules. This difference might be
due to the different reaction times at which the microcapsules were subjected.
From FTIR results, presented in appendix B, Fig.B 5, it is possible to observe that the
microcapsules with Silopren have a more intense O-H band than the silica-based ones,
which was also observed in the microcapsules with Baysilone. The increase in the O-H
band intensity might be due to more glycerol encapsulated, in comparison with the
reference microcapsules. Since, due to the hydrophobicity conferred by the silicones,
an increase of the superficial water was not expected.
From Table 24 and Table 25 it is possible to conclude that, the results obtained from the
foams with the capsules do not show any improvements when comparing to the
reference foams without capsules. Since the microcapsules might have a higher
amount of encapsulated glycerol, as was observed from the FTIR spectra, these results
may be due to the fact the microcapsules might not breaking during the spray process.
Fig. 46 – SEM image of the microcapsules obtained from synthesis (S4)

82
4.2.4.3. Cork addition:
The purpose of this study was to incorporate cork powder in the microcapsules’ shell
structure, forming a composite material. Indeed, the cork powder will not react with
Synthesis Curing Rate at 10%RH
24h 48h 67h 72h 120h
Reference of Synhtesis (S3) -1 1 - 4 -
Synthesis (S3) 0 2 - 5 -
Reference of synthesis (S4) 0 2 - - 4
Synthesis (S4) -2 0 - - 3
Reference of 20T:0M:0G microcapsules -4 -3 -2 - -
20T:0M:0G microcapsules -2 0 1 - -
Table 24 – Curing time test results for the microcapsules synthetized with Silopren, as well as for silica based microcapsules
Table 25 - String, tack and cutting time test results for the microcapsules synthetized with Silopren
Synthesis String Time
Tack free Time
Cutting Time
Seconds Minutes Minutes
Reference of Synthesis (S3) 45 19 97
Synthesis (S3) 28 20 102
Reference of synthesis (S4) 29 15 110
Synthesis (S4) 40 15 115
Conclusions:
In the case of the microcapsules with Baysilone, it was observed an improvement in
the leaching test results, indicating a possible increase in the hydrophobicity of the
shell.
For the microcapsules with Silopren, it was not possible to conclude about their
hydrophobicity, since opposite results were obtained in the leaching tests with
these microcapsules.
Also, although there might be more encapsulated compound, no effect was
observed in the curing of the OCF foams, indicating that the microcapsules might
not be breaking during the spray process.

83
the silanes used in the synthesis; instead it will be entrapped in the silica matrix. The
principal aim of this study is to provide some of the cork’s desirable characteristics to
the microcapsules, such as: more elasticity, in an attempt to produce less fragile
microcapsules; and impermeability to water, which is desired as a way to decrease the
superficial water and the leaching of the encapsulated glycerol.[41]
Since Portugal is the major cork producer, with about 55% of the cork global
production, the use of this sub-product for the microcapsule synthesis could also be
interesting, as a way to give use to a sub-product of a major national industry. [42]
This study was made with the silica based microcapsules, since those are the ones that
need more shell elasticity, as well as some hydrophobicity. Afterwards, the cork was
also applied to silica/epoxy microcapsules, in continuity to the referred microcapsules
study.
Silica based microcapsules:
Experimental procedure:
Two syntheses were made, with C1 and C2 amounts of cork, in which C1 is a higher
value than C2. The exact amount of cork used for the synthesis is confidential. The cork
was added to the hydrolysis solution, and left under stirring for 15 minutes, in order to
obtain a good homogenization.
Two more syntheses were made, with the water used for the hydrolysis in the
emulsion system and with C3 as the cork amount, in which C3 is inferior value than C2.
The pre-hydrolysis was not made.
The “reference”, in this study, is the 20T:0M:0G microcapsules, without the cork.

84
Experimental results:
The first synthesis was made with C1 as the cork amount, synthesis (S1). The
microcapsules obtained through this synthesis were gelatinous and aggregated, as
seen in Fig. 47.
Therefore, the amount of cork used was decreased to C2, synthesis (S2). However, the
resulting microcapsules were identical. Two more syntheses were made, without the
pre-hydrolysis step and decreasing the amount of cork used to C3. In the synthesis
(S3), the microcapsules obtained were loose and not as rigid as the previous ones. As
seen in Fig. 48 the microcapsules have a more spherical shape and are less aggregated
than the ones obtained from synthesis (S1). From Fig. 48 b) it is possible to observe
core shell microcapsules.
An attempt to reproduce the synthesis (S3) was conducted, however without a
satisfactory result, under optical microscope the obtained microcapsules seemed
identical to the ones obtained from the syntheses (S1) and (S2).
Fig. 47 – Microcapsules obtained in synthesis (S1), under optical microscope
100m 100m

85
Viscosity tests were made to the microcapsules obtained from the synthesis (S1), (S2)
and (S4). The test results are presented in Fig.C 5, appendix C. It is possible to conclude
that, except for the ones obtained from the synthesis (S1), the microcapsules present
less leaching than the reference ones. While the Ongronat® 2500 reached the 5000 cP
value after 168h with the reference microcapsules, it was necessary more than 300h to
reach that value with the microcapsules obtained from synthesis (S2) and (S4).
FTIR tests were made for the microcapsules obtained from synthesis (S1) and (S2).
From the obtained results, presented in appendix B, Fig.B 6, it is possible to observe
that the O-H band from microcapsules with cork have approximately the same
intensity as the one obtained with the reference, which means that the encapsulation
should be identical in both cases.
The FTIR results were also compared with the ones obtained with the cork powder.
The characteristically cork FTIR bands are at 1736cm-1, from ester groups of suberin,
and at 2920 cm-1 from C-H stretching of suberin aliphatic chains[43][44]. From the FTIR
results it is possible to conclude that there are no bands visible at 1736cm-1. The band
presented at 2920cm-1, also visible for silica based microcapsules since they also have
Fig. 48 – SEM images of the microcapsules obtained from Synthesis (S3) microcapsules. a) 90x magnification b) 850x magnification.
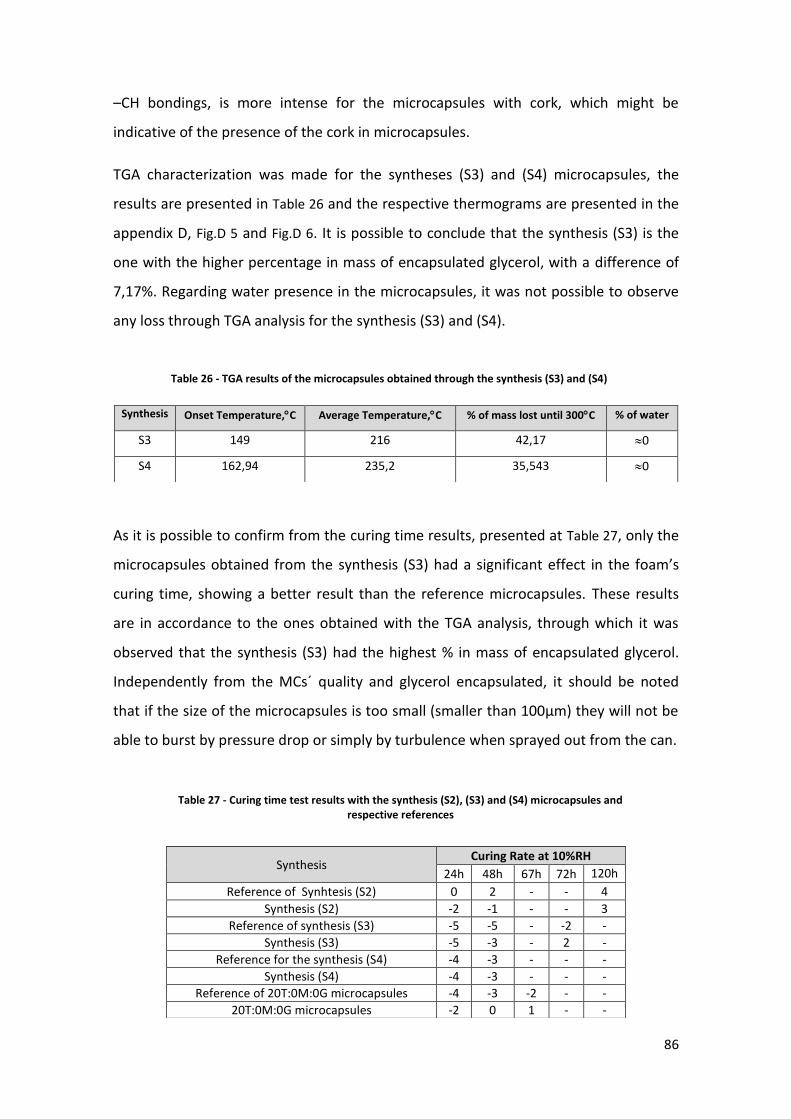
86
–CH bondings, is more intense for the microcapsules with cork, which might be
indicative of the presence of the cork in microcapsules.
TGA characterization was made for the syntheses (S3) and (S4) microcapsules, the
results are presented in Table 26 and the respective thermograms are presented in the
appendix D, Fig.D 5 and Fig.D 6. It is possible to conclude that the synthesis (S3) is the
one with the higher percentage in mass of encapsulated glycerol, with a difference of
7,17%. Regarding water presence in the microcapsules, it was not possible to observe
any loss through TGA analysis for the synthesis (S3) and (S4).
As it is possible to confirm from the curing time results, presented at Table 27, only the
microcapsules obtained from the synthesis (S3) had a significant effect in the foam’s
curing time, showing a better result than the reference microcapsules. These results
are in accordance to the ones obtained with the TGA analysis, through which it was
observed that the synthesis (S3) had the highest % in mass of encapsulated glycerol.
Independently from the MCs´ quality and glycerol encapsulated, it should be noted
that if the size of the microcapsules is too small (smaller than 100µm) they will not be
able to burst by pressure drop or simply by turbulence when sprayed out from the can.
Synthesis Onset Temperature,C Average Temperature,C % of mass lost until 300C % of water
S3 149 216 42,17 0
S4 162,94 235,2 35,543 0
Table 26 - TGA results of the microcapsules obtained through the synthesis (S3) and (S4)
Synthesis Curing Rate at 10%RH
24h 48h 67h 72h 120h
Reference of Synhtesis (S2) 0 2 - - 4
Synthesis (S2) -2 -1 - - 3
Reference of synthesis (S3) -5 -5 - -2 -
Synthesis (S3) -5 -3 - 2 -
Reference for the synthesis (S4) -4 -3 - - -
Synthesis (S4) -4 -3 - - -
Reference of 20T:0M:0G microcapsules -4 -3 -2 - -
20T:0M:0G microcapsules -2 0 1 - -
Table 27 - Curing time test results with the synthesis (S2), (S3) and (S4) microcapsules and respective references
Table 28– Curing time test results with the synthesis (S2), (S3) and (S4) microcapsules and respective references.

87
Table 28 presents the results obtained for the string, tack and cutting time tests. As it is
possible to confirm, there are no significate improvements in the results with the
microcapsules obtained from this synthesis.
Silica/Epoxy microcapsules:
Experimental procedure:
In these syntheses, the pre-hydrolysis solution was added to a reactional balloon in an
ice bath. After 30minutes reacting at low temperature, they were left for 1h at T1 and
posteriorly for 2h at T2. The syntheses did not react at T3.
The amount of EDA used in the synthesis was 1,33g, which is the same amount used
for the silica/Epoxy microcapsules synthesis, presented in on chapter 5.2.4.1 .
Synthesis String Time
Tack free Time
Cutting Time
Seconds Minutes Minutes
Reference for synthesis (S2) 29 15 110
Synthesis (S2) 16 15 118
Reference for synthesis (S3) 140 28 111
Synthesis (S3) 75 27 -
Reference for synthesis (S4) 88 31 118
Synthesis (S4) 135 22 -
Table 28 - String, tack and cutting time results with the synthesis (S1), (S2) and (S3) microcapsules
Conclusions:
It was possible to synthesize 20T:0M:0G(+cork), although the synthesis
reproducibility has to be improved.
The microcapsules obtained in this study contain approximately the same amount
of encapsulated glycerol than the silica based ones, with the benefit of a lower
leaching.
However, from all the synthesis made, only one led to the formation of
microcapsules that contributed to a significate improvement in the foam curing
times.

88
The “reference”, in this study, are the 10T:OM:10G (+EDA) microcapsules, without
cork.
Experimental results:
Initially, two types of materials were obtained, as seen in Fig. 49. Small spherical
shaped microcapsules of pale yellow and big amorphous shaped spheres of darker
yellow were visible, the latter being the most abundant.
In the previous syntheses, the EDA was added to the water phase of the emulsion
system, as in the study presented in 5.2.4.1. For the next syntheses, the EDA was only
added after the silanes were already in the reaction balloon, while in an ice bath. Thus,
mostly small microcapsules were obtained, as seen in Fig. 50.
Fig. 49- Silica/Epoxy microcapsules obtained with 0,07g of cork.
100m 100m
Fig. 50- Silica/Epoxy microcapsules obtained with C3 as the amount of cork, under optical microscope
100m

89
Three syntheses were made (S1), (S2) and (S3) through the last referred method.
However, some differences were observed between the obtained microcapsules; the
color of the capsules varied as well as the amount of big spheres, although it was
always substantially inferior when comparing to the first synthesis.
Fig. 51 presents the SEM results for the microcapsules presented in Fig. 50. As it can be
seen, they have a perfectly spherical shape and a smooth surface, similar to the
reference microcapsules. However, instead of poly-nucleated, the microcapsules seem
to be core shell, although with a small core. The microcapsules obtained through this
synthesis are the smallest microcapsules presented so far, with some having diameters
with less than 10m and the larger ones having about 20m. In comparison, the
reference ones are significantly larger, with the smallest microcapsules having around
50m.
The leaching test results are presented in Fig.C 6, appendix C. From this test, it was
observed that, contrariwise to what was expected, the microcapsules synthetized with
cork seem to have more leaching than the reference ones.
Through the comparison of the FTIR results, presented in appendix B, Fig.B 7, it is
possible to conclude that the intensity of O-H band of the microcapsules obtained
through the synthesis (S3) is identical to the one observed with the reference
microcapsules. The intensity of the O-H band of the microcapsules obtained through
Fig. 51 – SEM images of 10T:0M:10G (+EDA + cork) microcapsules. a) 500x magnification b) 1700x magnification

90
the synthesis (S1) is significantly inferior. Comparing these microcapsules FTIR with the
one obtained with cork, it is not possible to draw any conclusions regarding its
presence. Although the band located at 2920cm-1, due to the presence of C-H strength
and to suberin aliphatic chains is present in the microcapsules FTIR, it has the same
intensity for the microcapsules with and without cork. Also, the characteristic cork
band, located at 1736cm-1, due to the ester groups of suberin, is not visible.
As seen in Table 29and Table 30 there were no improvements in the curing time of the
foams with synthesis (S1) and (S3) microcapsules, as well as for the string, tack free
and cutting time tests. These may be due to a lack of capsules breaking during the
spray. Indeed, their size is possibly too small to enable them to burst.
Synthesis Curing Rate at 10%RH
24h 48h 67h 72h 120h
Reference of 10T:0M:10G(+EDA) microcapsules -4 -3 -2 - -
10T:0M:10G(+EDA) microcapsules -2 0 0 - -
Reference of synthesis (S1) -1 1 - 4 -
Synthesis (S1) -3 -1 - 2 -
Reference for the synthesis (S3) 0 2 - - 4
Synthesis (S3) -1 1 - - 4
Table 29- Curing time test results of 10T:0M:10G(+EDA), synthesis (S1) and Synthesis (S3) microcapsules, as well as the respecting references.
Table 30 - String, tack and cutting time results of 10T:0M:10G(+EDA) microcapsules, synthesis (S1) and (S2) microcapsules, as well as the respective references.
Synthesis String Time
Tack free Time
Cutting Time
Seconds Minutes Minutes
Reference for synthesis (S1) 45 19 97
Synthesis (S1) 42 23 90
Reference for synthesis (S3) 29 15 110
Synthesis (S3) 36 15 97

91
4.2.4.4. Production of a second shell of amino-functional silica
In this study, a second shell with an aminosilane, was produced for the 20T:0M:0G
microcapsules. The principal aim of this study was to produce a shell with amino
groups that could be posteriorly treated with Ongronat® 2500 in order to obtain a
polyurea shell. Also, it was hoped that, with the second shell, the silica based
microcapsules would be more resistant and it could lead to a decrease in the leaching
observed for the inorganic silica based microcapsules.
Experimental procedure:
Two different studies were made. In the first study, the pre-hydrolysis step was not
made, instead the water usually used for this step was applied in the emulsion system
formation. In the second, the microcapsules were synthetized with two surfactants. In
both cases, the aminosilane was not pre-hydrolyzed. In both studies, the aminosilane
was added to the reactional balloon at the end of the synthesis, when it was already
reacting at T3 for almost one hour. After the addition of the aminosilane, it was left to
react for some minutes before the synthesis was stopped.
Conclusions:
It was possible to synthetize 10T:0M:10G (+EDA+cork) microcapsules.
The microcapsules have a perfectly spherical shape and are not aggregated.
The amount of encapsulated glycerol seems to be identical to the one observed in
the reference microcapsules.
However, contrarily to what was expected, these microcapsules had more leaching
and, through the results obtained in the foam tests, it was possible to conclude that
they had no significate effect in the curing process of the foams.

92
Experimental results:
Synthesis conducted without the pre-hydrolysis step
Fig. 52 presents the SEM results for the 20T:0M:0G:10A microcapsules. It is possible to
observe that the microcapsules have a perfectly spherical shape and a smooth surface,
as it was observed in silica base ones. The microcapsules seem to be matrix, as
observable in Fig. 52 b), and not core shell or poly-nucleated.
Table 31 presents the principal results obtained through TGA analysis, the respective
TGA thermogram is presents in appendix D, Fig.D 7. As it can be seen, about 24,24% of
these microcapsules’ weight is due to encapsulated glycerol. When comparing this
result with the ones obtained for the silica based microcapsules with cork, it is possible
to conclude that the microcapsules with the amino-functional silica double shell have a
lesser percentage in weight of encapsulated glycerol, with a difference of 18,46% and
11,29%, depending on the synthesis.
Fig. 52 – SEM results of silica based microcapsules with a double amino-functional silica shell a) 90x magnification b)500x magnification.

93
From Table 32, it is possible to conclude that the microcapsules obtained in this study
positively contributed for the curing of the foams, with a result in the curing time test
not very different from the ones obtained with the 20T:0M:0G microcapsules.
Table 33 presents the curing time test results with the microcapsules obtained in this
study when sprayed with different nozzles. It is possible to observe that, with the use
of the nozzle12, the results for the curing time test are significantly better. This might
be an indication that not all of the microcapsules break during the spray process
without the use of a nozzle.
Table 34 presents the string and tack-free time results. As it can be seen, there were no
major improvements with the microcapsules obtained in this study. However, as it can
be seen from Table 35, significant improvements were achieved with the use of the
Onset Temperature,C Average Temperature,C % of mass lost until 300C % of water
128 206 24,25 0
Table 31 – TGA analysis of the silica based microcapsules with a double amino-functional silica shell, with acidified water in the emulsion.
Table 32 – Curing time test results for the microcapsules obtained through the synthesis (S1) and (S2), as well as the respective references.
Synthesis Curing Rate at 10%RH
0h 24h 48h 67h
Reference of Synthesis (S1) -5 -5 -4 -
Synthesis (S1) -5 -3 -2 -
Reference of 20T:0M:0G microcapsules - -4 -3 -2
20T:0M.0G microcapsules - -2 0 1
Table 33 – Curing time test results with synthesis (S2) microcapsules, when the foam is sprayed with nozzles
Synthesis Curing Rate at 10%RH
0h 24h 48h
Nozzle 11 - -3 -2
Nozzle 12 - -2 0
Nozzle 9 - -3 -3

94
nozzle 11 and 12. With the nozzle 11, a decrease in 50 minutes was observed for the
cutting time and, for the nozzle 12, a decrease of 40 minutes was registered. This
corresponds to a decrease of the time needed for the cutting time of 45,5% and
36,37% respectively. These results indicate that the microcapsules might not be
breaking during the spraying process.
Synthesis with two surfactant
Two microcapsules syntheses were conducted, using two surfactants, named synthesis
(S1) and (S2). Synthesis (S2) is a reproduction of synthesis (S1). This was aimed at
increasing the amount of encapsulated glycerol.
From the SEM results, presented in Fig. 53, it is possible to observe that the
microcapsules obtained in this study neither have a perfect spherical shape nor a
smooth surface. Also, these microcapsules appear to be poly-nucleated, instead of
matrix, as the previous ones, which is a desirable characteristic.
Table 34 – String, tack and cutting time results obtained with the synthesis (S1) and (S2) microcapsules
Synthesis String Time Tack free Time
Seconds Minutes
Reference 110 36
Synthesis (S1) 80 20
Synthesis (S2) 80 23
Table 35 – String, tack and cutting time results obtained with synthesis (S2), when the foam is sprayed with nozzle
Synthesis String Time Tack free Time Cutting Time
Seconds Minutes Minutes
Nozzle 11 73 23 60
Nozzle 12 31 24 70
Nozzle 9 50 45 84
Nozzle 6b 35 29 80

95
From the FTIR results, presented in appendix B, Fig.B 8, it is possible to observe that the
O-H band of the microcapsules obtained through both synthesis, (S1) and (S2), had a
lower intensity than the 20T:0M:0G microcapsules.
The primary and secondary amines stretch band is located in the same region of the O-
H stretch, but more shifted to shorter wavenumbers. However, for the microcapsules
obtained through the synthesis (S1), and (S2) it is visible a band at around 1580cm-1
and 1600cm-1, respectively, both not present in the FTIR spectra of silica based
microcapsules. Since the N-H bend band is located between 1550cm-1 and 1650cm-1,
the presence of the referred bands in these syntheses microcapsules FTIR might be
due to the presence of N-H groups, confirming the presence of the amino-functional
silica.
From the leaching test results, presented in Fig.C 7, it is possible to conclude that the
microcapsules obtained in this study show a significant improvement in the leaching,
when comparing with the results obtained with the silica based ones. After 168h, i.e. 7
days, the Ongronat® 2500 with the microcapsules obtained through the syntheses (S1)
and (S2) still had a low viscosity value of 915cP and 990cP, respectively. In comparison,
after only 168h, the Ongronat® 2500 with the silica based microcapsules had already a
viscosity value superior to 5000cP. However, the observed improvement might be due
to a less amount of encapsulated glycerol, as seen from the FTIR results.
Fig. 53 – SEM images with 90x magnification of the microcapsules obtained through the two syntheses

96
4.2.4.5. Post-treatment of amino-functional silica second shell microcapsules
The aim of this study was to produce microcapsules with a second shell of polyurea,
since it is an hydrophobic component and thus might lead to a decrease of the
observed leaching in silica based microcapsules.
The polyurea shell is a result of the reaction of isocyanate with amino terminated
compounds, as seen in Fig. 54. Thereby, in this study, 20T:0M:0G:0A microcapsules
were used. The referred microcapsules were left to react with Ongronat® 2500, an
oligomeric, Methylene diphenyl diisocyanate, MDI with its principal characteristics
presented in Table 36.
Reagents Brand Density (g/ml) Purity grade (%)
Ongronat®2500 BorsodChem 1.24 _
Table 36- Ongronat®2500 principal characteristics
Fig. 54 – Urea linkage formation
Conclusions:
It was possible to synthetize poly-nucleated silica based microcapsules with a
second amino-functional silica shell, using two surfactants.
These microcapsules show less leaching than the silica based ones; however they
also seem to have less glycerol encapsulated. Thereby, for a future application, it
would be interesting to try to increase the amount of glycerol encapsulated in these
microcapsules.

97
Experimental procedure:
This study was made with the 20T:0M:0G:10A microcapsules, synthetized with two
surfactants. The microcapsules were left to react in a diluted Ongronat®2500 solution,
in a reactional balloon with magnetic stirring, under heating at 65C. Three different
post-treatments were made with different reactional times: 15 minutes, 30 minutes
and 1 hour.
Experimental results:
From Fig. 55 it is possible to compare the amino-functional silica shell surface, in a)
with the surface composed by polyurea in b). As it can be seen, the surface of the
microcapsules with amino-functional silica shell seems to be smoother than the one
that suffered a post-treatment with Ongronat® 2500.
From the FTIR results, presented in appendix B, Fig.B 9, it is possible to observe that the
intensity of the O-H band is identical for the microcapsules with amino-functional silica
and with polyurea shell. In the FTIR spectra of the microcapsules that were subjected
to the post-treatment, three bands that are not visible in the 20T:0M:0G:10A
microcapsules FTIR are observable, located at around 1600cm-1, 1536cm-1 and
Fig. 55 – a) 20T:0M:0G:10A shell; 500x magnification. b) 20T.0M:0G:10A(+Ongronat®2500)
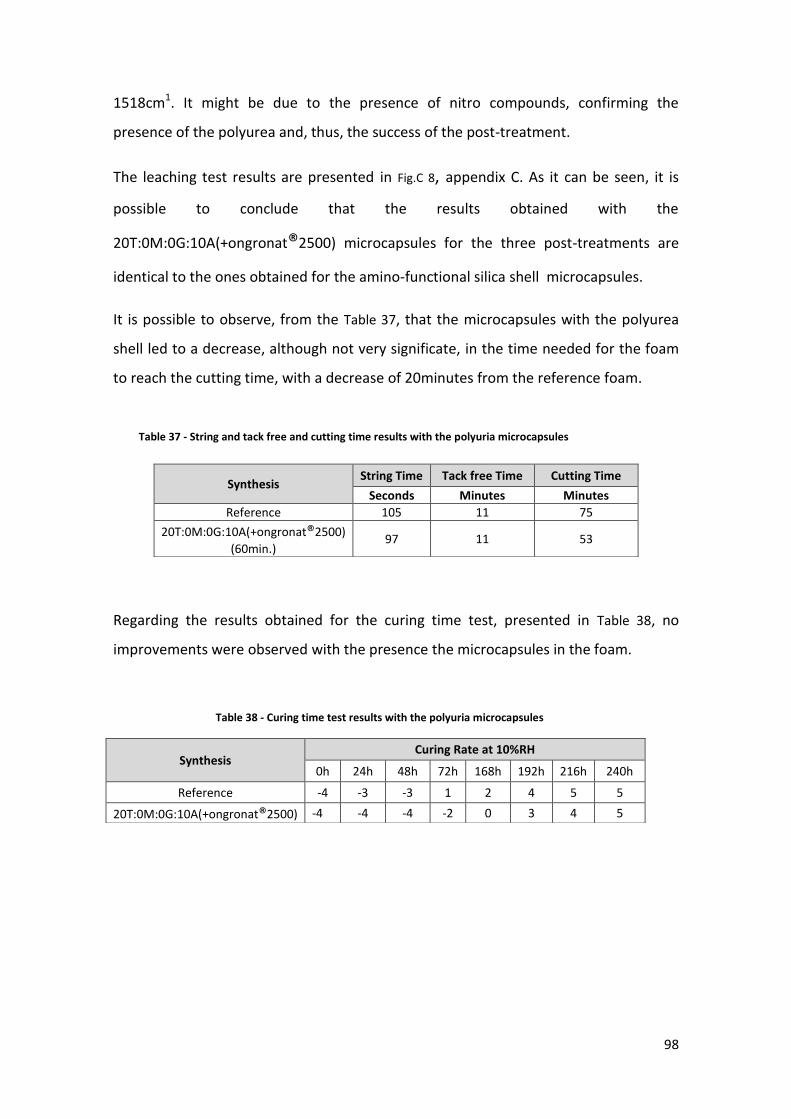
98
1518cm1. It might be due to the presence of nitro compounds, confirming the
presence of the polyurea and, thus, the success of the post-treatment.
The leaching test results are presented in Fig.C 8, appendix C. As it can be seen, it is
possible to conclude that the results obtained with the
20T:0M:0G:10A(+ongronat®2500) microcapsules for the three post-treatments are
identical to the ones obtained for the amino-functional silica shell microcapsules.
It is possible to observe, from the Table 37, that the microcapsules with the polyurea
shell led to a decrease, although not very significate, in the time needed for the foam
to reach the cutting time, with a decrease of 20minutes from the reference foam.
Regarding the results obtained for the curing time test, presented in Table 38, no
improvements were observed with the presence the microcapsules in the foam.
Table 37 - String and tack free and cutting time results with the polyuria microcapsules
Synthesis String Time Tack free Time Cutting Time
Seconds Minutes Minutes
Reference 105 11 75
20T:0M:0G:10A(+ongronat®2500)
(60min.) 97 11 53
Table 38 - Curing time test results with the polyuria microcapsules
Synthesis Curing Rate at 10%RH
0h 24h 48h 72h 168h 192h 216h 240h
Reference -4 -3 -3 1 2 4 5 5
20T:0M:0G:10A(+ongronat®2500) -4 -4 -4 -2 0 3 4 5

99
4.2.4.6. Encapsulation of different compounds - glycerol, diethylene glycol,
glycerol carbonate
In this study, two other compounds with OH groups were encapsulated: glycerol
carbonate, and diethylene glycol. The principal characteristics of the two compounds
are presented in Table 39, and the molecule representation in Fig. 56.
Reagents Brand Density (g/ml)
Purity grade (%)
Boiling Point
(C)
Glycerol VWR Chemicals 1.261 87 290
Glycerol Carbonate UBE chemical Europe, S.A. 1.4 _ 110 - 115
Diethylene Glycol Sigma Aldrich _ 99 244-245
Table 39 – Reagent characteristics
Fig. 56 – a) Glycerol molecule b) Glycerol Carbonate molecule c) Dyethilene Glycol molecule
Conclusions:
It was possible to synthetize silica based microcapsules with a polyurea second
shell.
There was a decrease in the leaching with these microcapsules in comparison with
the silica based ones.
The foam tests showed that these microcapsules do not significantly contribute for
the curing process of the foams. Possibly, more encapsulated glycerol was needed,
since the FTIR results showed that the O-H band of these microcapsules have a
lesser intensity than the one obtained for the silica based ones.

100
The glycerol carbonate is a glycerol derived compound that has gain much interest in
the past years, since it has a versatile reactivity, due to its hydroxyl and 2-oxo-1,3-
dioxolane group. Also, the glycerol carbonate production appears as a way to valorize
wasted glycerol, which is becoming widely available and suffered a significant
devaluation in the past years, mainly due to biodiesel production. [45] Glycerol
carbonate has been used as solvent, chemical intermediate, surfactant, among others
applications. [45]
Dyethilene glycol, DEG, is a widely used solvent, being also used as a chemical
intermediate, and surfactant, in the manufacture of plasticizers, polyurethanes and
polyester resins, among others applications. [46]
Experimental procedure:
Glycerol carbonate:
This study was performed with 10T:0M:10G microcapsules.
Since the glycerol carbonate has the boiling point at 110 - 115C [45], the reactional
temperature could not be elevated to T3, in order to avoid the evaporation of this
compound. Thus, microcapsules were synthetized with lower reactional temperatures,
consequently more reactional time was needed. In these syntheses, the amount, in
mass, of the encapsulated compound was maintained.
Diethylene glycol:
The encapsulation of diethylene glycol was made with the 10T:0M:10G microcapsules.
Two different studies were made, one with only diethylene glycol as the compound to
be encapsulated and another with 50% glycerol, in mass, and 50% diethylene glycol.
Also, some adjustments were made in the amount of reactional time needed for the
microcapsules synthesis to be completed.

101
Experimental results:
Glycerol carbonate:
Microcapsules with 10T:0M:10G(+glycerol carbonate) were synthetized, since it seems
that GPTMS do not need so much polycondensation time as the MTES. With this
synthesis, it was only necessary 1 hour at T3 to obtain mature microcapsules.
As it can be seen in Fig. 57 despite of being a little aggregated, these microcapsules are
the best obtained so far with 10T:0M:10G, with some spheres being distinguishable
from the agglomerates.
From the FTIR results, presented in appendix B, Fig.B 10, is possible to observe that the
O-H band is slightly more intense in the case of glycerol carbonate microcapsules than
it is for the 10T:0M:10G microcapsules. Since the glycerol molecule has more O-H
groups than the glycerol carbonate, the obtained results indicate that the amount of
encapsulated compound was significantly higher in the case of glycerol carbonate
synthesis. Also, a band is visible around 1772cm-1, that might be due to the C=O group,
confirming the encapsulation of the referred compound.
Regarding the leaching tests, the results, presented in Fig.C 9, appendix C, showed an
increase in the leaching for the microcapsules synthetized with glycerol carbonate.
Fig. 57 – SEM of 10T:0M:10G(+glycerol carbonate) microcapsules, with 90x magnification.
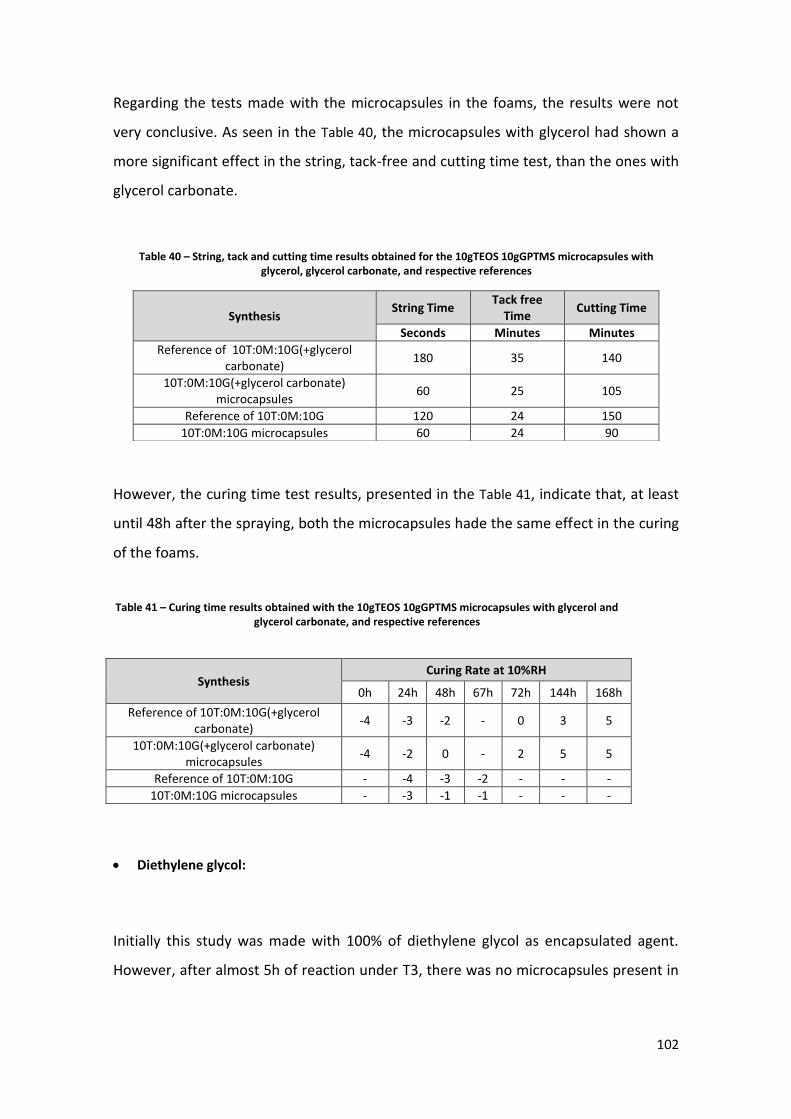
102
Regarding the tests made with the microcapsules in the foams, the results were not
very conclusive. As seen in the Table 40, the microcapsules with glycerol had shown a
more significant effect in the string, tack-free and cutting time test, than the ones with
glycerol carbonate.
However, the curing time test results, presented in the Table 41, indicate that, at least
until 48h after the spraying, both the microcapsules hade the same effect in the curing
of the foams.
Diethylene glycol:
Initially this study was made with 100% of diethylene glycol as encapsulated agent.
However, after almost 5h of reaction under T3, there was no microcapsules present in
Table 40 – String, tack and cutting time results obtained for the 10gTEOS 10gGPTMS microcapsules with glycerol, glycerol carbonate, and respective references
Synthesis String Time
Tack free Time
Cutting Time
Seconds Minutes Minutes
Reference of 10T:0M:10G(+glycerol carbonate)
180 35 140
10T:0M:10G(+glycerol carbonate) microcapsules
60 25 105
Reference of 10T:0M:10G 120 24 150
10T:0M:10G microcapsules 60 24 90
Table 41 – Curing time results obtained with the 10gTEOS 10gGPTMS microcapsules with glycerol and glycerol carbonate, and respective references
Synthesis Curing Rate at 10%RH
0h 24h 48h 67h 72h 144h 168h
Reference of 10T:0M:10G(+glycerol carbonate)
-4 -3 -2 - 0 3 5
10T:0M:10G(+glycerol carbonate) microcapsules
-4 -2 0 - 2 5 5
Reference of 10T:0M:10G - -4 -3 -2 - - -
10T:0M:10G microcapsules - -3 -1 -1 - - -
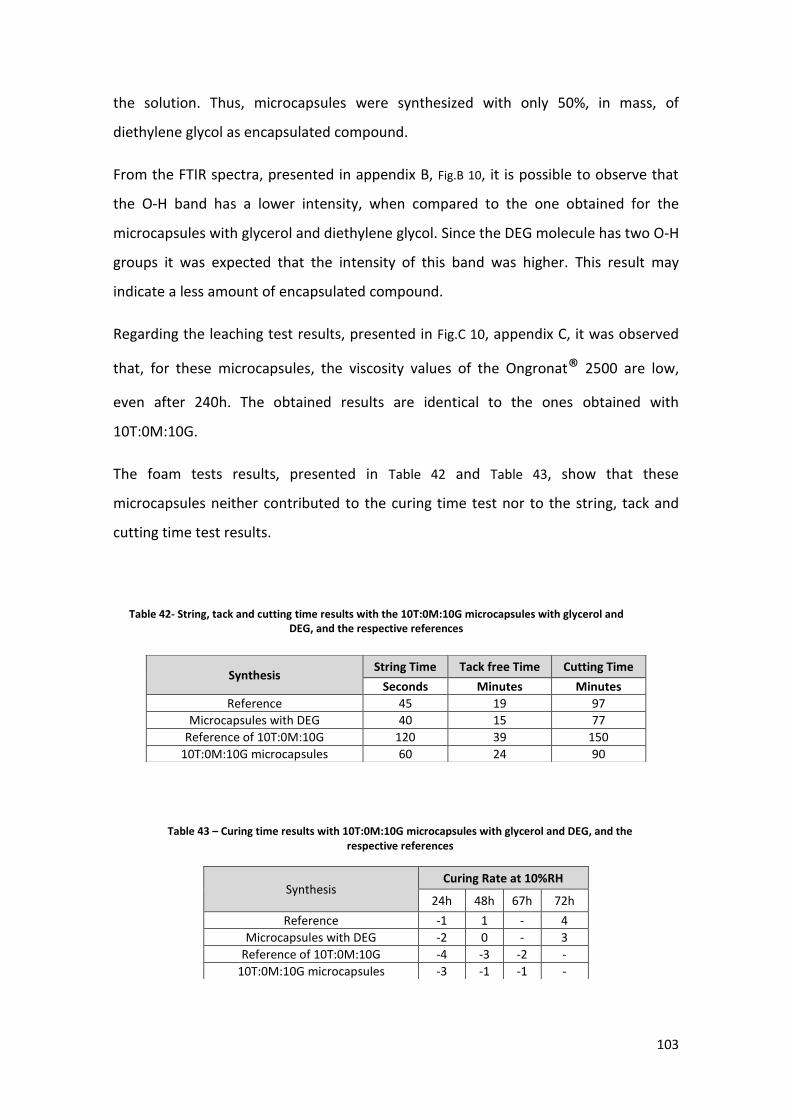
103
the solution. Thus, microcapsules were synthesized with only 50%, in mass, of
diethylene glycol as encapsulated compound.
From the FTIR spectra, presented in appendix B, Fig.B 10, it is possible to observe that
the O-H band has a lower intensity, when compared to the one obtained for the
microcapsules with glycerol and diethylene glycol. Since the DEG molecule has two O-H
groups it was expected that the intensity of this band was higher. This result may
indicate a less amount of encapsulated compound.
Regarding the leaching test results, presented in Fig.C 10, appendix C, it was observed
that, for these microcapsules, the viscosity values of the Ongronat® 2500 are low,
even after 240h. The obtained results are identical to the ones obtained with
10T:0M:10G.
The foam tests results, presented in Table 42 and Table 43, show that these
microcapsules neither contributed to the curing time test nor to the string, tack and
cutting time test results.
Table 42- String, tack and cutting time results with the 10T:0M:10G microcapsules with glycerol and DEG, and the respective references
Synthesis String Time Tack free Time Cutting Time
Seconds Minutes Minutes
Reference 45 19 97
Microcapsules with DEG 40 15 77
Reference of 10T:0M:10G 120 39 150
10T:0M:10G microcapsules 60 24 90
Table 43 – Curing time results with 10T:0M:10G microcapsules with glycerol and DEG, and the respective references
Synthesis Curing Rate at 10%RH
24h 48h 67h 72h
Reference -1 1 - 4
Microcapsules with DEG -2 0 - 3
Reference of 10T:0M:10G -4 -3 -2 -
10T:0M:10G microcapsules -3 -1 -1 -

104
4.2.5. “Pre-scale-up”
To finalize the Greenseal Research internship, a pre-scale-up study of a previously
selected synthesis was made. In this study, two major alterations were made: the
amount of the reactional reagents was doubled, and a heating mantle was used.
Thereby, besides the pre-scale-up, the reactional conditions were also adjusted due to
the use of the mantle.
For this study to succeed, some alterations were needed in the following reactional
parameters: agitation velocity of the emulsion formation; reactional times and amount
of aminosilane used in the synthesis.
The microcapsules chosen for this pre-scale-up study were 20T:0M:0G:10A. This choice
was made taking into account that more studies are needed in order to obtain hybrid
microcapsules, with desirable characteristics using MTES or GPTMS. Thus, silica based
microcapsules were chosen. However due to the high leaching observed in these
capsules, the study was made with the amino-functional silica second shell ones.
The “reference” in this study are 20T:0M:0G:10A, previous to the pre-scale-up.
Conclusions:
It was possible to successfully synthesize microcapsules with glycerol carbonate as
encapsulated compound as well as microcapsules with DEG and glycerol.
The microcapsules with glycerol carbonate seem to have more amount of
encapsulated compound than the ones with DEG and glycerol.
The microcapsules with only glycerol seem to be the ones that have a more
significant effect in the curing of the foams.

105
Agitation velocity of the emulsion formation:
With the increase of the amount of the reagents and, consequently, the volume of the
emulsion solution, the velocity applied with the Ultra-turrax was increased. In order to
obtain emulsions with approximately the same dimensions as the ones obtained
previously to the pre-scale-up, several velocities were experimented. Initially an initial
velocity was chosen, 9200rpm, however the emulsions obtained were of big
dimensions. Several attempts were made, until the optimal velocity for the emulsion
formation was determined, being 9800rpm. The emulsions obtained with the referred
velocity are presented in Fig. 58.
Aminosilane
Since the aminosilane is also a reactional catalyzer, it was important to study the
period of time needed for it to react. If it was left for a long period of time, matrix
microcapsules were obtained instead of poly-nucleated ones. Thereby, after the
addition of the silane to the reaction medium, a sample was continuously collected,
filtrated and observed under optical microscope, in order to understand the degree of
poly-condensation reaction. The reactional time that led to better results was 6
minutes.
Fig. 58- Emulsion obtained with 9800rpm with the ultra-turrax, under optical microscope
100m

106
Temperatures applied and reactional times
With the new heating mantle, the temperature increase was much faster with the than
it was with the oil bath. Thus, a gradual increase of the temperature was opted, with
more temperature steps, each one with short duration.
Fig. 59 presents the following of the pre-scale-up synthesis after optimization
After reacting at T2 After reacting 30 seconds at T3
After reacting 5 minutes at T3
After reacting 15 minutes at T3 After adding the aminosilane
Fig. 59 - Following of the pre-scale-up synthesis after the optimization
100m 100m 100m
100m 100m
100m 100m 100m

107
Experimental results:
In Fig. 60 it is possible to observe that the obtained microcapsules have an almost
perfect spherical shape and are loose, not aggregated, microcapsules. In Fig. 61 it is
possible to conclude that these microcapsules are poly-nucleated, as it was desired.
More than one reproduction of this synthesis was made and the microcapsules
obtained were always poly-nucleated. It was also possible to conclude that the
microcapsules’ size vary between 50m and almost 300m. In comparison, the
reference microcapsules had a smaller sizer distribution, between 50m and 200m,
however the microcapsules were more aggregated.
From the FTIR results, presented in appendix B, Fig.B 11, it was observed that the
microcapsules obtained through the pre-scale-up synthesis have a less intense O-H
band when comparing with the silica based microcapsules, with a decrease of around
5%. Also, comparing the TGA results obtained with these microcapsules, presented in
Table 44, with the respective thermogram presented in appendix D, Fig.D 8, and the
TGA results obtained with the reference ones, is possible to conclude that there was a
decrease of the percentage of the microcapsules’ weight corresponding to
encapsulated glycerol. In the pre-scale-up microcapsules, the glycerol is 21,52% of the
microcapsules weight, in the case of the reference capsules, is 24,25% of the total
weight.
Fig. 60 pre-scale-up microcapsules observed under optical microscope
Fig. 61– SEM of pre-scale-up microcapsules, with 400x magnification

108
Regarding the leaching test results, presented in Fig.C 11, appendix C, it can be seen
that there was observed almost no leaching with these capsules, as it was observed
with the reference ones. When comparing with the silica based microcapsules, a
significant decrease can be noticed with the ones obtained in the pre-scale-up
synthesis.
Regarding the synthesis yield, the pre-scale-up synthesis had an yield of 55,10%, which
is similar to the one obtained for the silica based microcapsules (57,7%). However, it
showed a decrease when comparing with results obtained for the reference, that had a
yield of 66,4%, a difference superior to 10%.
The foam tests results are presented in the Table 45 and Table 46. As it can be seen, the
microcapsules obtained in the pre-scale-up synthesis did not lead to a significant result
for both tests. However, when using a nozzle, it was possible to observe a decrease of
30 minutes in the cutting time results with these microcapsules, which represents an
improvement of 44% when comparing with the reference foam. This result may
indicate that the microcapsules are not breaking during the spray process, without the
use of the nozzle. The results obtained with the reference microcapsules showed that
the foam tests results were also not very significant without the use of a nozzle.
Onset Temperature,C Average Temperature,C % of mass lost until 300C % of water
147,44 218,3 21,52 0
Table 44 –TGA results obtained with the microcapsules synthetized through the pre-scale-up synthesis
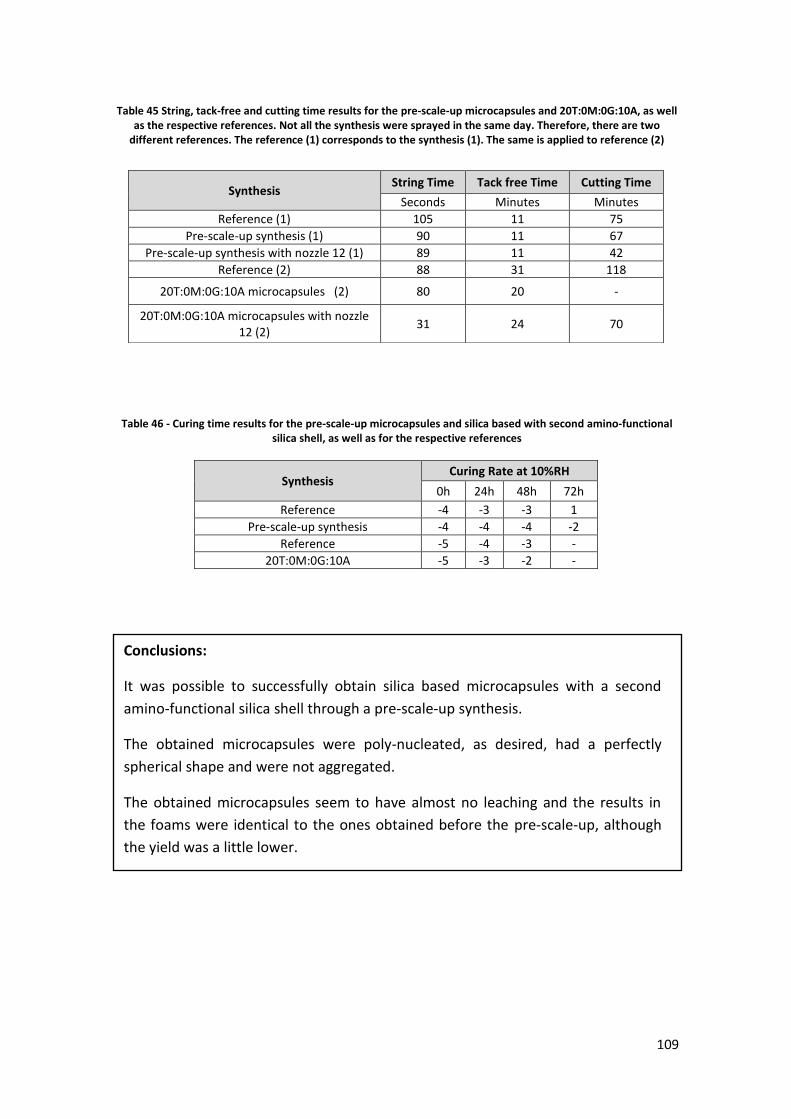
109
Synthesis String Time Tack free Time Cutting Time
Seconds Minutes Minutes
Reference (1) 105 11 75
Pre-scale-up synthesis (1) 90 11 67
Pre-scale-up synthesis with nozzle 12 (1) 89 11 42
Reference (2) 88 31 118
20T:0M:0G:10A microcapsules (2) 80 20 -
20T:0M:0G:10A microcapsules with nozzle 12 (2)
31 24 70
Table 45 String, tack-free and cutting time results for the pre-scale-up microcapsules and 20T:0M:0G:10A, as well as the respective references. Not all the synthesis were sprayed in the same day. Therefore, there are two
different references. The reference (1) corresponds to the synthesis (1). The same is applied to reference (2)
Table 46 - Curing time results for the pre-scale-up microcapsules and silica based with second amino-functional silica shell, as well as for the respective references
Synthesis Curing Rate at 10%RH
0h 24h 48h 72h
Reference -4 -3 -3 1
Pre-scale-up synthesis -4 -4 -4 -2
Reference -5 -4 -3 -
20T:0M:0G:10A -5 -3 -2 -
Conclusions:
It was possible to successfully obtain silica based microcapsules with a second
amino-functional silica shell through a pre-scale-up synthesis.
The obtained microcapsules were poly-nucleated, as desired, had a perfectly
spherical shape and were not aggregated.
The obtained microcapsules seem to have almost no leaching and the results in
the foams were identical to the ones obtained before the pre-scale-up, although
the yield was a little lower.
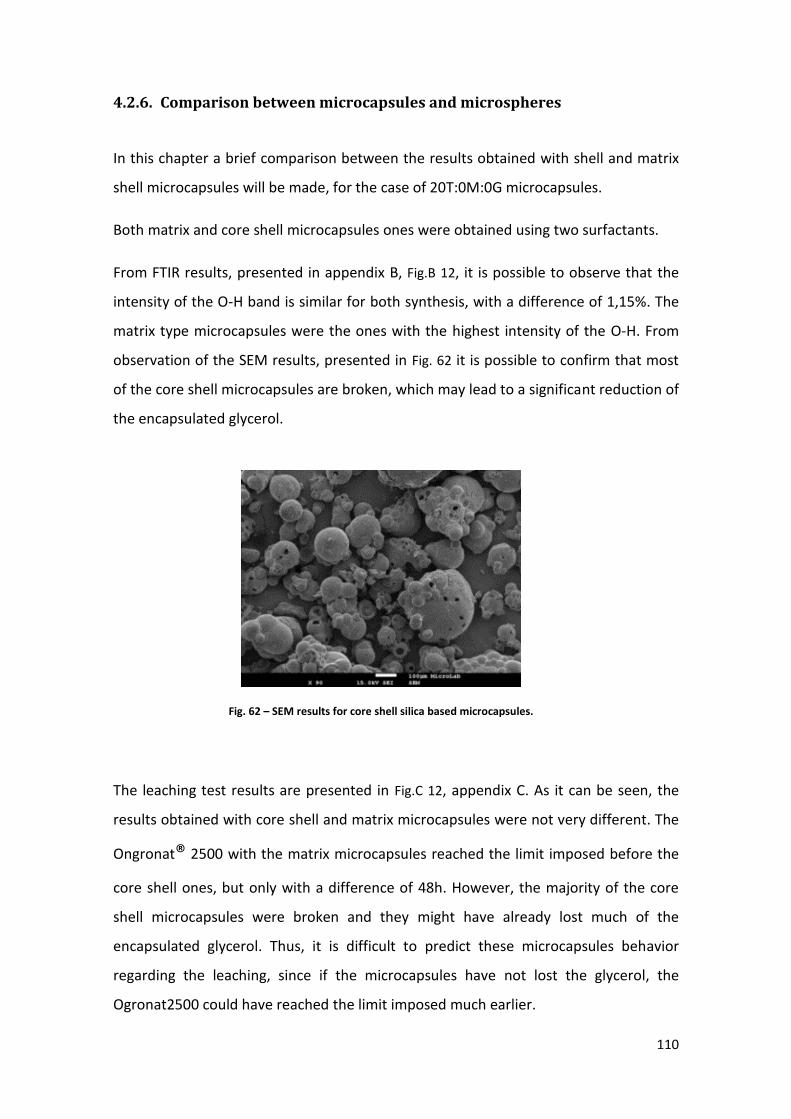
110
4.2.6. Comparison between microcapsules and microspheres
In this chapter a brief comparison between the results obtained with shell and matrix
shell microcapsules will be made, for the case of 20T:0M:0G microcapsules.
Both matrix and core shell microcapsules ones were obtained using two surfactants.
From FTIR results, presented in appendix B, Fig.B 12, it is possible to observe that the
intensity of the O-H band is similar for both synthesis, with a difference of 1,15%. The
matrix type microcapsules were the ones with the highest intensity of the O-H. From
observation of the SEM results, presented in Fig. 62 it is possible to confirm that most
of the core shell microcapsules are broken, which may lead to a significant reduction of
the encapsulated glycerol.
The leaching test results are presented in Fig.C 12, appendix C. As it can be seen, the
results obtained with core shell and matrix microcapsules were not very different. The
Ongronat® 2500 with the matrix microcapsules reached the limit imposed before the
core shell ones, but only with a difference of 48h. However, the majority of the core
shell microcapsules were broken and they might have already lost much of the
encapsulated glycerol. Thus, it is difficult to predict these microcapsules behavior
regarding the leaching, since if the microcapsules have not lost the glycerol, the
Ogronat2500 could have reached the limit imposed much earlier.
Fig. 62 – SEM results for core shell silica based microcapsules.

111
The results obtained in the foam tests, presented in Table 47 indicate that, although
the majority of the core shell microcapsules appear to be broken and some glycerol
might be lost, they are still the microcapsules that show a more significant result in the
curing of the foams. It might be possible because the matrix microcapsules might not
be breaking during the spraying process.
5. Comparison between TGA test results
In this chapter, a brief comparison between the results obtained through TGA analysis
will be analyzed, in order to compare the amount of glycerol and remaining water in
some of the synthetized microcapsules.
In Fig. 63, all the TGA thermograms that were presented in the previous chapters are
compiled. The response of the microcapsules with cork to the temperature increase
Table 47 - Curing time test results for matrix and core Shell silica based microcapsules
Synthesis Curing Rate at 10%RH
0h 24h 48h 72h
Reference matrix shell -4 -3 -3 1
Matrix shell microcapsules -4 -3 -3 1
Reference core shell -5 -4 -3 -
Core shell microcapsules -4 2 2 -
Conclusions:
The core shell microcapsules appear to have a more significant effect in the curing
of the foams, than the matrix ones. However, they might be too fragile, since the
majority of the core shell microcapsules appear to be broken, leading to a loss of
the encapsulating compound. Another disadvantage of fragile core shell
microcapsules is that they can break inside the OCF can while handled.
It would be interesting to try to synthetize core shell microcapsules with a more
resistant shell, with an increased thickness, or with a more compact shell.
The addition of other silanes could be studied, for example, the possibility of a
different post-treatment or the production of a second shell.

112
seem to be more significant and faster than the rest of the microcapsules analyzed.
When analyzing the results presented in the Table 48, it can be seen that, until the
300C is reached, these microcapsules were the ones that presented the most
significant percentage of mass loss. Possibly this results are due to the presence of
cork, which is an organic compound that might also be degraded at this temperature
range, among the glycerol.
All the microcapsules with amino groups, both with amino-functional silica and EDA,
seem to have a similar curve response to temperature increase. When comparing the
percentage of mass loss until the 300C, presented in Table 48, it is possible to observe
that for all these microcapsules the percentage goes around between 21 and 26%,
which is a relatively small range. It is also possible to observe that the microcapsules
obtained in the pre-scale-up synthesis are the ones with less amount of encapsulated
glycerol, being the silica/epoxy microcapsules the ones with the highest amount.
From Table 48, it is possible to observe that the microcapsules composed only with the
silanes are the ones that have lost a lower percentage of mass with the increase of
temperature until the 300C. Having into account that these microcapsules also seem
to have some encapsulated water, the percentage of glycerol in the capsules are about
17,73%, in the case of 10T:0M:10G microcapsules, and 15,87%, for the 5T:5M:10G
ones, which is far less than the percentage observed for the remaining capsules.
The apparent absence of water in the microcapsules with cork and superficial amino
groups in its composition might be due to the hydrophobicity of the cork presented in
the shell. For the microcapsules with superficial amino groups in its composition, this
absence might be due to the decrease of silica surface exposed to the air moisture,
which prevents an eventual superficial water deposition.
It is possible to conclude that the addition of EDA, aminosilane and cork seems to have
led to a diminution of water in the microcapsules and an increase of the encapsulated
compound, when comparing with the microcapsules composed only with three silanes.

113
0 100 200 300 400 500 600 700
20
30
40
50
60
70
80
90
100
We
igh
t(%
)
Temperature( OC)
10T:0M:10G
5T:5M:10G
10T:0M:10G (+EDA) (S1)
20T:0M:0G (+cork) (S3)
20T:0M:0G (+cork) (S4)
20T:0M:0G:10A
40T:0M:0G:20A
Fig. 63- TGA test results obtained for some of the microcapsules synthetized during this work
Table 48 –Results obtained through the analysis of the TGA graphics, for all the analysis made during this work
Microcapsules Onset
Temperature,C Average Temperature,C
% of mass lost until
300C % of water
10T:0M:10G 185,51 257 19,6 1,73
5T:5M:10G 159 259 17,26 1,39
10T:0M:10G
(+EDA) 137,29 215,64 26,51 0
S3 149 216 42,17 0
S4 162,94 235,2 35,543 0
20T:0M:0G:10A 128 206 24,25 0
40T:0M:0G:20A 147,44 218,3 21,52 0
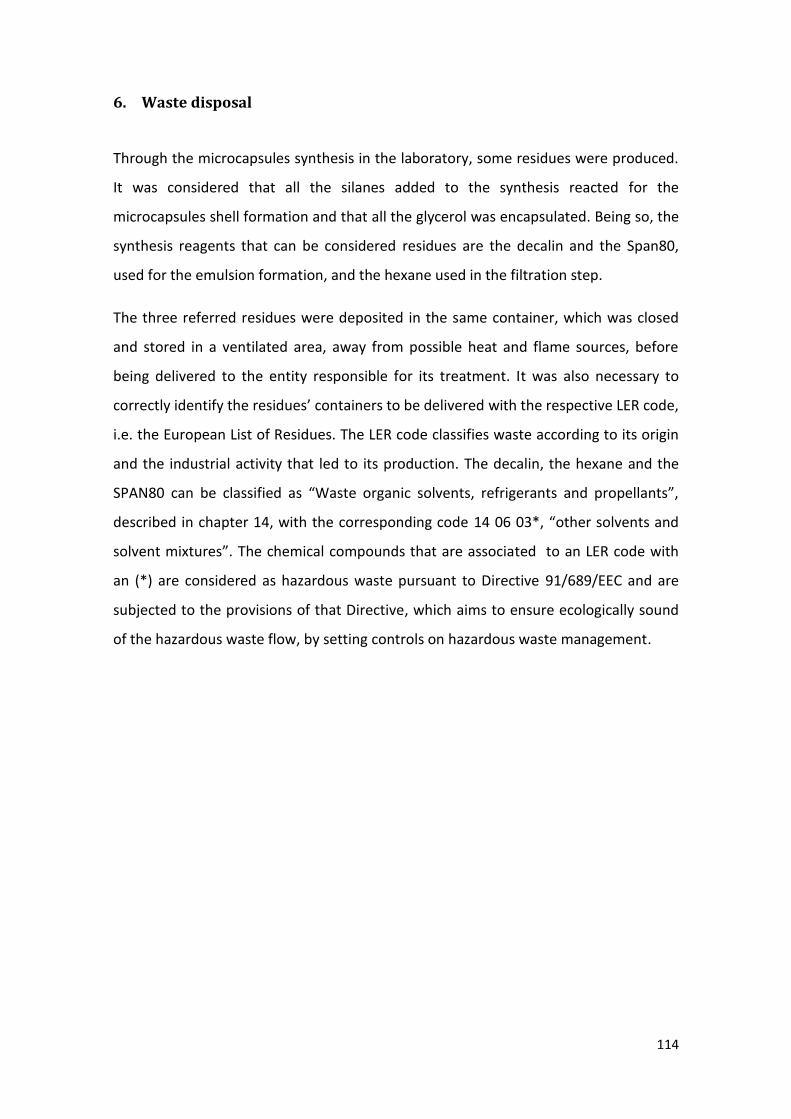
114
6. Waste disposal
Through the microcapsules synthesis in the laboratory, some residues were produced.
It was considered that all the silanes added to the synthesis reacted for the
microcapsules shell formation and that all the glycerol was encapsulated. Being so, the
synthesis reagents that can be considered residues are the decalin and the Span80,
used for the emulsion formation, and the hexane used in the filtration step.
The three referred residues were deposited in the same container, which was closed
and stored in a ventilated area, away from possible heat and flame sources, before
being delivered to the entity responsible for its treatment. It was also necessary to
correctly identify the residues’ containers to be delivered with the respective LER code,
i.e. the European List of Residues. The LER code classifies waste according to its origin
and the industrial activity that led to its production. The decalin, the hexane and the
SPAN80 can be classified as “Waste organic solvents, refrigerants and propellants”,
described in chapter 14, with the corresponding code 14 06 03*, “other solvents and
solvent mixtures”. The chemical compounds that are associated to an LER code with
an (*) are considered as hazardous waste pursuant to Directive 91/689/EEC and are
subjected to the provisions of that Directive, which aims to ensure ecologically sound
of the hazardous waste flow, by setting controls on hazardous waste management.

115
7. Main conclusions and suggestions of future work
The present work regards the development of microcapsules, containing glycerol,
diethylene glycol, or glycerol carbonate in their pores (or core), with the goal of being
curing agents for one-component PU foams.
Initially, in this work, the synthesis of inorganic silica based microcapsules was
successfully reproduced from previous recipes developed at Greenseal Research.
These capsules have a perfect spherical shape, and their presence in the foam seems
to contribute to the curing process. However, they also lead to a quick increase of the
viscosity of the polyurethane pre-polymer, due to glycerol leaching from the capsules
and also residual moisture on their surface, which makes them unacceptable to be
used as curing agents. Also, they have relatively big dimensions, which could lead to
nozzle obstruction after the first spraying.
Other solutions had to be developed to reach microcapsules of good quality and
morphology, which are non-leaching within the pre-polymer inside the pressurized can
and which release their content of glycerol upon spraying, leading to a faster curing of
the polyurethane foams, independently of the moisture in the air.
Regarding the organically modified (hybrid) microcapsules, the ones with MTES
seemed to have a higher performance, when comparing to the ones obtained with
GPTMS and the ones with the three silanes. The microcapsules synthesized with
10T:10M:0G were the ones that showed the best results, in terms of morphology and
curing speed, which is similar to that obtained for inorganic silica microcapsules, with
the advantage that they exhibit a non-leaching performance. The organic functionality
of these newly developed microcapsules was responsible for a higher hydrophobicity
and, therefore, for a beneficial lower leaching degree. However, the presence of these
additional alkoxides (silanes), especially GPTMS, appears to destabilize the emulsion,
or affecting the polycondensation reactions, which translates into non-spherical and
aggregated microcapsules for some cases and also a lower amount of glycerol
encapsulated.

116
Several reactional parameters were studied, in order to improve the microcapsules’
characteristics as well as to decrease its production price. It was possible to obtain
microcapsules in all the performed studies, and the majority of the alterations led to
improvements in its characteristics. The modifications that led to better results are
those related with surfactants, namely the use of two surfactants (one in the dispersed
phase and the other in the continuous phase), which promoted the formation of core-
shell microcapsules, and the increase of the surfactant amount used in the synthesis,
which contributed to the decrease of the microcapsules’ size and also the formation of
microcapsules with a more spherical shape. Regarding the decrease of the synthesis
cost, the most successful change was the usage of an acidic catalyst, which has led to
an instantaneous microcapsule formation, contributing to a decrease of the time
needed for the reaction to be completed. It would be interesting, as future work, to try
to combine the various changes evaluated in this work in the same synthesis, in order
to obtain microcapsules with several desired improvements.
Regarding the additional studies performed in this work, it should be referred the
addition of EDA to the synthesis with TEOS and GPTMS, which resulted in epoxy resin-
rich regions within the silica shell of perfect spherical shape microcapsules, the
addition of polydimethylsiloxanes (silicone) to the synthesis with TEOS, which resulted
in a silica-silicone shell composition, and the addition of cork powder to the TEOS
synthesis, which resulted in a shell of cork-silica composition. All these new
approaches led to microcapsules with less glycerol leaching than inorganic silica
microcapsules.
Additionally, it was found that the incorporation of aminosilane, at a later stage of the
synthesis of inorganic silica microcapsules, acts as a catalyst for polycondensation
reaction, leading to the formation of silica based microcapsules with an amino-
functional silica (outer) second shell. These capsules proved to be poly-nucleated, with
a perfect spherical shape, not aggregated and with almost no leaching, leading as well
to an improved curing speed of the polyurethane OCF.
These activities involved basically a comprehensive screening of new compositions for
the microcapsules´ shell. Therefore, reproducibility studies and pre-scale-up studies

117
are required to implement the incorporation of these microcapsules into commercial
polyurethane OCF cans.
In the final part of the internship, a pre-scale-up study was made for the silica based
microcapsules with an amino-functional silica outer shell. It was possible to establish
the successful production at the lab scale of the desired capsules, in batches of ca. 60 g
of microcapsules, with a reaction yield of 55,10%.
Besides the good quality of these capsules, it was found that an especially designed
nozzle, placed on the aerosol can, helps the burst of the microcapsules and therefore
the release of glycerol from the core of the microcapsules to the PU froth, during the
spraying process. In this case, a significant result in the curing speed of the PU OCFs is
achieved.
So, regarding novelty of this work, a variety of new microcapsules has been developed
in the framework of this internship, which, to the best of our knowledge, are not still in
the State of the Art, and can be applied in a near future in many varied applications.
They include combinations of three different silanes (methyl and epoxy functionality),
silica- and epoxy-rich hybrid shells, silica-silicone hybrid shells, cork-silica composite
shells, but the best result obtained, in terms of microcapsules spherical morphology,
absence of leaching and enhanced curing speed, was for microcapsules composed of
silica shell with a double shell of amino-functional silica. This synthesis was successfully
scaled-up.
This work has led to plenty of avenues to further explore. It would be interesting to
increase the size of the core in the silica-based microcapsules having a second shell of
amino-functional silica, in order to encapsulate a higher amount of glycerol, and
further improve the curing speed. The encapsulation of an amine based catalyst, in
addition to the glycerol, could be also a solution in order to obtain a more significant
effect of these microcapsules in the curing process. Also, obtaining microcapsules with
slightly bigger dimensions (ca. 300 µm) could be attempted to facilitate their breakage
during the spraying process.

118
8. Work accomplished
Besides developing the present thesis, the experimental work accomplished during the
internship in Greenseal Research enabled me the possibility to be author and co-
author of the following works:
Presentation poster: Ana C. Marques, Mónica Loureiro, Bruno Sargaço, Luis F. Santos,
Auguste Fernandes, Aster De Schrijver, João C. Bordado, “Hybrid microspheres and
microcapsules containing a sustainable curing agent for polyurethane one component
foams”, Fourth International Conference on Multifunctional, Hybrid and
Nanomaterials HYMA2015, Sitges, Spain, 9-13 March 2015.
Article: “Organically-modified silica based microcapsules for high performance curing
of polyurethane one component foams”, by Mónica Loureiro, Maria José Lourenço,
Luís F. Santos, Aster De Schrijver, João M. Bordado, Ana C. Marques (in preparation).

119
References:
[1] I. Consultants, “Global Overview of the Spray Polyurethane Foam (SPF) & One Component Foam (OCF) Markets,” Ealing, London, 2014.
[2] Robert O. Ebewele, Polymer Science and Technology. New York: CRC Press, 2000.
[3] Sonnenschein Mark F., Polyurethanes Science, Technology, and Trends. Hoboken, New Jersey: John Wiley & Sons, Inc., 2015.
[4] J. S. S. De Melo, M. J. Moreno, H. D. Burrows, and M. H. Gil, Química de Polímeros. Imprensa da Universidade de Coimbra, 2004.
[5] W. D. Vilar, Química e Tecnologia dos Poliuretanos. Rio de Janeiro: Vilar Consultoria, 2004.
[6] A. De Schrijver, The Foam Manual, Polyurethane Foams systems for professionals and DIY. Hergiswil, 2012.
[7] T. Thomson, Polyurethanes as Specialty Chemicals : Principles and Applications. Boca Raton, Florida: LLC, CRC Press, 2005.
[8] O. S. Allport Dennis, Gilbert David, MDI and TDI: Safety, Health and the Environment: A Source Book and Practical Guide. West Sussex, England: John Wiley & Sons, Inc, 2003.
[9] R. Ciriminna, A. Alterman, V. Loddo, A. De Schrijver, and M. Pagliaro, “Enhanced One-Component Spray Polyurethane Foams via Sol–Gel Microspheres Doped with Aqueous Glycerol,” ACS Sustain. Chem. Eng., vol. 2, no. 3, pp. 506–511, 2014.
[10] A. C. Marques, R. Ciriminna, M. Sciortino, A. C. Marques, A. De Schrijver, C. Bordado, and M. Pagliaro, “Solid Curing Agents for Polyurethane Foams : Proof of Concept of the Release Mechanism,” Macromol. Mater. Eng., vol. 300, no. 7, pp. 674 – 678, 2015.
[11] R. Ciriminna, A. C. Marques, J. C. Bordado, A. de Schrijver, and M. Pagliaro, “GreenCaps: towards solid curing agents for sustainable polyurethane foams,” Sustain. Chem. Process., vol. 2, no. 1, pp. 24 – 30, Nov. 2014.
[12] “Global Polyurethane (PU) Foams Market Report 2013-2018,” BUSINESS WIRE-Research and Markets, Dublin, 2012.
[13] J. Denny, “Utech-polyurethane,” Shifting production in CASE market highlighted at conference, 2014. [Online]. Available: http://utech-polyurethane.com/information/shifting-production-in-case-market-highlighted-at-conferencecase/. [Accessed: 07-Aug-2015].

120
[14] “Plastics – the Facts 2012: An analysis of European plastics production, demand and waste data for 2011,” PlasticsEurope - Association of Plastics Manufacturers, 2012.
[15] N. V. N. Jyothi, P. M. Prasanna, S. N. Sakarkar, K. S. Prabha, P. S. Ramaiah, and G. Y. Srawan, “Microencapsulation techniques, factors influencing encapsulation efficiency.,” J. Microencapsul., vol. 27, no. 3, pp. 187–197, 2010.
[16] C. J. Barbé, L. Kong, K. S. Finnie, S. Calleja, J. V. Hanna, E. Drabarek, D. T. Cassidy, and M. G. Blackford, “Sol–gel matrices for controlled release: from macro to nano using emulsion polymerisation,” J. Sol-Gel Sci. Technol., vol. 46, no. 3, pp. 393–409, Mar. 2008.
[17] S. H. G. Singh M. N., Hemant K. S. Y., Ram M., “Microencapsulation: A promising techniques for controlled drug delivery,” Res. Pharm. Sci., vol. 5, no. 2, pp. 65–77, 2010.
[18] I. Kaltzakorta and E. Erkizia, “Study on the effect of sol-gel parameters on the size and morphology of silica microcapsules containing different organic compounds,” Phys. Status Solidi, vol. 7, no. 11–12, pp. 2697–2700, Nov. 2010.
[19] B. Y. Ahn, S. Il Seok, and I. C. Baek, “Sol–gel microencapsulation of hydrophilic active compounds from the modified silicon alkoxides: The control of pore and particle size,” Mater. Sci. Eng. C, vol. 28, no. 7, pp. 1183–1188, Aug. 2008.
[20] Q. Chen, J. Larismaa, A. Keski-honkola, K. Vilonen, O. Söderberg, and S. Hannula, “Effect of Synthesis Time on Morphology of Hollow Porous Silica Microspheres,” Mater. Sci., vol. 18, no. 1, pp. 66–71, 2012.
[21] K. Bean, C. F. Black, N. Govan, P. Reynolds, and M. R. Sambrook, “Preparation of aqueous core / silica shell microcapsules,” J. Colloid Interface Sci., vol. 366, no. 1, pp. 16–22, 2012.
[22] R. Dubey, T. C. Shami, and K. U. Bhasker Rao, “Microencapsulation technology and applications,” Def. Sci. J., vol. 59, no. 1, pp. 82–95, 2009.
[23] S. K. Ghosh, Functional Coatings: By Polymer Microencapsulation. Wiley-VCH Verlag GmbH & Co. KGaA, Weinheim: Wiley-VCH, 2006.
[24] R. Ciriminna, M. Sciortino, G. Alonzo, A. De Schrijver, and M. Pagliaro, “From Molecules to Systems : Sol - Gel Microencapsulation in Silica-Based Materials,” Chem. Rev., vol. 111, no. 2, pp. 765–789, 2011.
[25] M. W. Keller and N. R. Sottos, “Mechanical properties of microcapsules used in a self-healing polymer,” Exp. Mech., vol. 46, no. 6, pp. 725–733, 2006.
[26] R. Ciriminna, M. Sciortino, A. de Schrijver, D. Desplantier-Giscard, F. Béland, and M. Pagliaro, “Leach-Proof Sol–Gel Microcapsules as Curing Agents for

121
One-Pot Thermosetting Resins,” ACS Sustain. Chem. Eng., vol. 1, no. 12, pp. 1572–1579, Dec. 2013.
[27] R. Ciriminna, A. Fidalgo, V. Pandarus, L. M. Ilharco, M. Pagliaro, and A. R. Pais, “The Sol − Gel Route to Advanced Silica-Based Materials and Recent Applications,” vol. 113, no. 8, pp. 6592 – 6620, 2012.
[28] H. Zhang, X. Wang, and D. Wu, “Silica encapsulation of n-octadecane via sol-gel process: a novel microencapsulated phase-change material with enhanced thermal conductivity and performance.,” J. Colloid Interface Sci., vol. 343, no. 1, pp. 246–55, Mar. 2010.
[29] R. Ciriminna and M. Pagliaro, “Sol-gel microencapsulation of odorants and flavors: opening the route to sustainable fragrances and aromas.,” Chem. Soc. Rev., vol. 42, no. 24, pp. 9243–50, Dec. 2013.
[30] C. J. Brinker and G. W. Scherer, Sol-Gel Science The Physics and Chemistry of Sol-Gel Processing. United States of America: Academic Press, Inc., 1990.
[31] M. J. Rosen, Surfactants and Interfacial Phenomena, Third Edit. John Wiley & Sons, Inc., Hoboken, New Jersey, 2004.
[32] V. Madaan, A. Chanana, M. K. Kataria, and A. Bilandi, “Emulsion Technology and Recent Trends in Emulsion Applications,” Int. Res. J. Pharm., vol. 5, no. 7, pp. 533–542, 2014.
[33] Tharwat Tadros, Emulsion Formation, Stability, and Rheology, First Edit. Wiley-VCH Verlag GmbH & Co. KGaA, 2013.
[34] L. L. Schramm, “Emulsions, Foams, and Suspensions: Fundamentals and Applications,” WILEY-VCH Verlag GmbH & Co. KGaA, Weinheim, 2005.
[35] S. Morsy, “Role of Surfactants in Nanotechnology and Their Applications,” Int. J. Curr. Microbiol. App. Sci, vol. 3, no. 5, pp. 237–260, 2014.
[36] R. Y. Cristina Sabliov, Hongda Chen, Nanotechnology and Functional Foods: Effective Delivery of Bioactive Ingredients. West Sussex, England: Wiley, John & Sons, Ltd, IFT Press, 2015.
[37] C.-B. Wu, G. Wu, X. Yang, Y.-J. Liu, C.-X. Gao, Q.-H. Ji, M. Wang, and H.-Z. Chen, “Preparation of Mannitol@Silica core–shell capsules via an interfacial polymerization process from water-in-oil emulsion,” Colloids Surfaces A Physicochem. Eng. Asp., vol. 457, no. 1, pp. 487–494, 2014.
[38] G. Lu, J. Sun, and Q. Zhou, “Synthesis and Characterization of Waterborne Epoxy Curing Agent Modified by Silane,” Chinese J. Chem. Eng., vol. 15, no. 6, pp. 899–905, 2007.

122
[39] M. A. Scognamillo Sergio, Alzari Valeria, Nuvoli Daniele, “Hybrid Organic / Inorganic Epoxy Resins Prepared by Frontal Polymerization,” Polym. Chem., vol. 28, no. 21, pp. 4721–4725, 2010.
[40] Momentive, “Momentive - Technical Data Sheet - Baysilone* OF-OH702-4%.” [Online]. Available: http://www.momentive.com/products/showtechnicaldatasheet.aspx?id=20149. [Accessed: 17-Sep-2015].
[41] AMORIM, “Why Cork- Key Characteristics.” [Online]. Available: http://www.amorim.com/en/why-cork/key-characteristics/. [Accessed: 21-Sep-2015].
[42] AMORIM, “A cortiça - Mitos e Curiosidades.” [Online]. Available: http://www.amorim.com/a-cortica/mitos-e-curiosidades/Montado-e-Producao-Mundial/108/. [Accessed: 21-Sep-2015].
[43] E. M. Fernandes, I. M. Aroso, J. F. Mano, J. a. Covas, and R. L. Reis, “Functionalized cork-polymer composites (CPC) by reactive extrusion using suberin and lignin from cork as coupling agents,” Compos. Part B Eng., vol. 67, pp. 371–380, 2014.
[44] E. A. A. Silva, F. R. Oliveira, S. N. Carmo, F. Steffens, and A. P. Souto, Characterization of natural cork agglomerate functionalised by plasma treatment. Department of Textile Engineering, University of Minho, Guimarães, Portugal: 1st International Conference on Natural Fibers.
[45] M. O. Sonnati, S. Amigoni, E. P. Taffin de Givenchy, T. Darmanin, O. Choulet, and F. Guittard, “Glycerol carbonate as a versatile building block for tomorrow: synthesis, reactivity, properties and applications,” Green Chem., vol. 15, no. 2, p. 283, 2013.
[46] “PubQhem,” Diethylene Glycol. [Online]. Available: http://pubchem.ncbi.nlm.nih.gov/compound/diethylene_glycol#section=Use-and-Manufacturing. [Accessed: 03-Oct-2015].
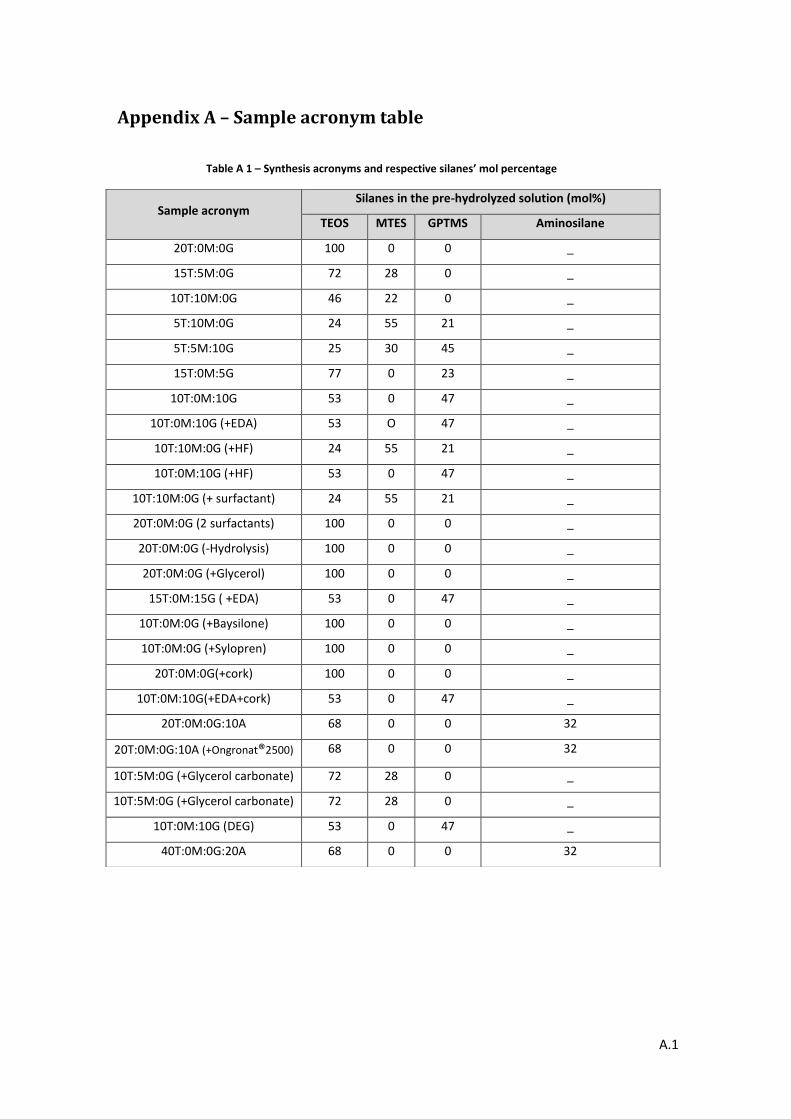
A.1
Appendix A – Sample acronym table
Table A 1 – Synthesis acronyms and respective silanes’ mol percentage
Sample acronym Silanes in the pre-hydrolyzed solution (mol%)
TEOS MTES GPTMS Aminosilane
20T:0M:0G 100 0 0 _
15T:5M:0G 72 28 0 _
10T:10M:0G 46 22 0 _
5T:10M:0G 24 55 21 _
5T:5M:10G 25 30 45 _
15T:0M:5G 77 0 23 _
10T:0M:10G 53 0 47 _
10T:0M:10G (+EDA) 53 O 47 _
10T:10M:0G (+HF) 24 55 21 _
10T:0M:10G (+HF) 53 0 47 _
10T:10M:0G (+ surfactant) 24 55 21 _
20T:0M:0G (2 surfactants) 100 0 0 _
20T:0M:0G (-Hydrolysis) 100 0 0 _
20T:0M:0G (+Glycerol) 100 0 0 _
15T:0M:15G ( +EDA) 53 0 47 _
10T:0M:0G (+Baysilone) 100 0 0 _
10T:0M:0G (+Sylopren) 100 0 0 _
20T:0M:0G(+cork) 100 0 0 _
10T:0M:10G(+EDA+cork) 53 0 47 _
20T:0M:0G:10A 68 0 0 32
20T:0M:0G:10A (+Ongronat®2500) 68 0 0 32
10T:5M:0G (+Glycerol carbonate) 72 28 0 _
10T:5M:0G (+Glycerol carbonate) 72 28 0 _
10T:0M:10G (DEG) 53 0 47 _
40T:0M:0G:20A 68 0 0 32

B.1
Appendix B – FTIR spectra
Fig.B 1 - FTIR of the microcapsules obtained with HF
Fig.B 2 - FTIR of the microcapsules obtained with two surfactants

B.2
3500 2800 2100 1400 700
20
40
60
80
100
Tra
nsm
itta
nce
(%
)
Wavelength (cm-1)
20T:0M:0G (+Glycerol)
Reference: 20T:0M:0G
Fig.B 3 - FTIR of the microcapsules synthetizes with more glycerol
Fig. B 1- FTIR of the microcapsules synthetized with more glycerol
4000 3500 3000 2500 2000 1500 1000 500
20
40
60
80
100
Tra
nsm
itta
nce
(%)
Wavelength(cm-1)
Reference
Synthesis (S2)
Fig.B 4 - FTIR of the silica/Epoxy microcapsules
Fig. B 2 - FTIR of the silica/Epoxy microcapsules

B.3
4500 4000 3500 3000 2500 2000 1500 1000 500
20
40
60
80
100
Tra
nsm
itta
nce
(%)
Wavelength(cm-1)
20T:0M:0G
Synthesis (S3)
Synthesis (S4)
Fig.B 5 - FTIR microcapsules synthetized with Silopren
Fig. B 3 - FTIR of the microcapsules synthetized with Silopren
4000 3000 2000 1000
20
40
60
80
100
120
Tra
nsm
itta
nce
(%)
Wavelength(cm-1)
20T:0M:0G
Synthesis (S1)
Synthesis (S2)
Cork
Fig.B 6 - FTIR of the silica based microcapsules with cork
Fig. B 4 - FTIR of the silica based microcapsules with cork

B.4
4000 3500 3000 2500 2000 1500 1000 500
10
20
30
40
50
60
70
80
90
100
110
Tra
nsm
itta
nce
(%)
Wavelength(cm-1)
Reference
Synthesis (S1)
Synthesis (S3)
Cork
Fig.B 7 - FTIR obtained for the silica/epoxy microcapsules with cork
Fig. B 5 - FTIR obtained for the silica/epoxy microcapsules with cork
Fig.B 8 - FTIR of silica based microcapsules with an amino-
functional silica double shell, synthetized with two surfactants
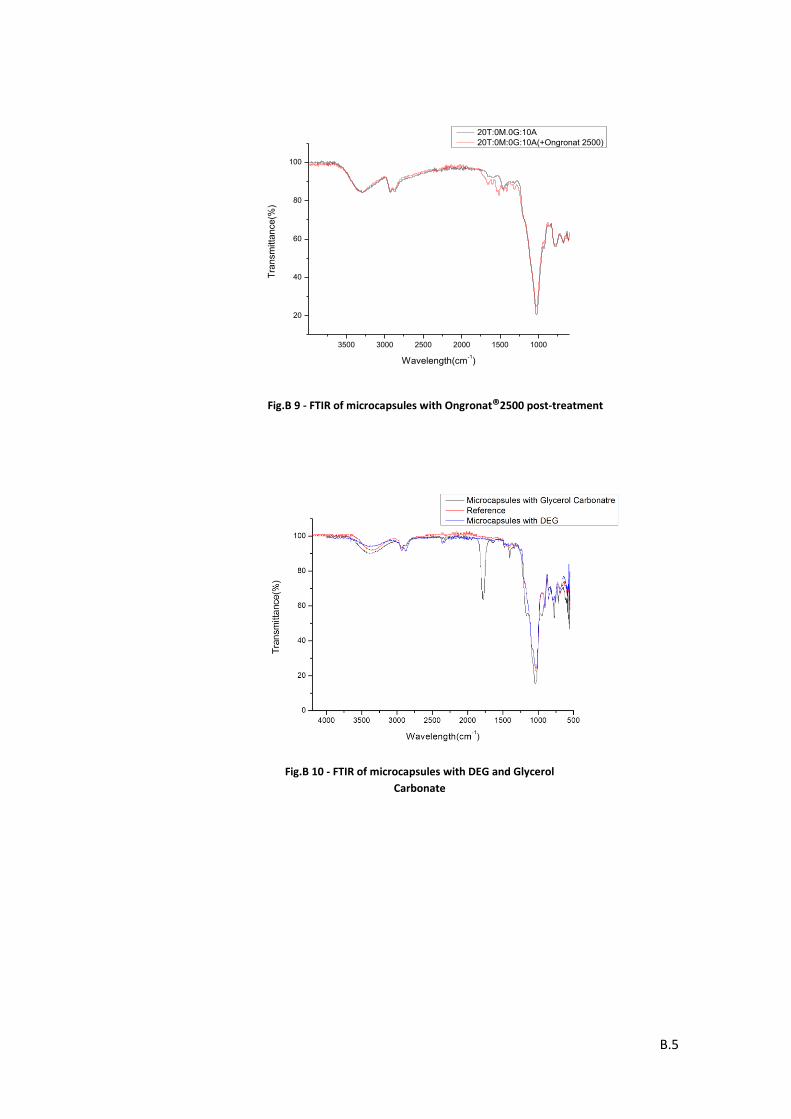
B.5
3500 3000 2500 2000 1500 1000
20
40
60
80
100
Tra
nsm
itta
nce
(%)
Wavelength(cm-1)
20T:0M.0G:10A
20T:0M:0G:10A(+Ongronat 2500)
Fig.B 9 - FTIR of microcapsules with Ongronat®2500 post-treatment
Fig.B 10 - FTIR of microcapsules with DEG and Glycerol
Carbonate
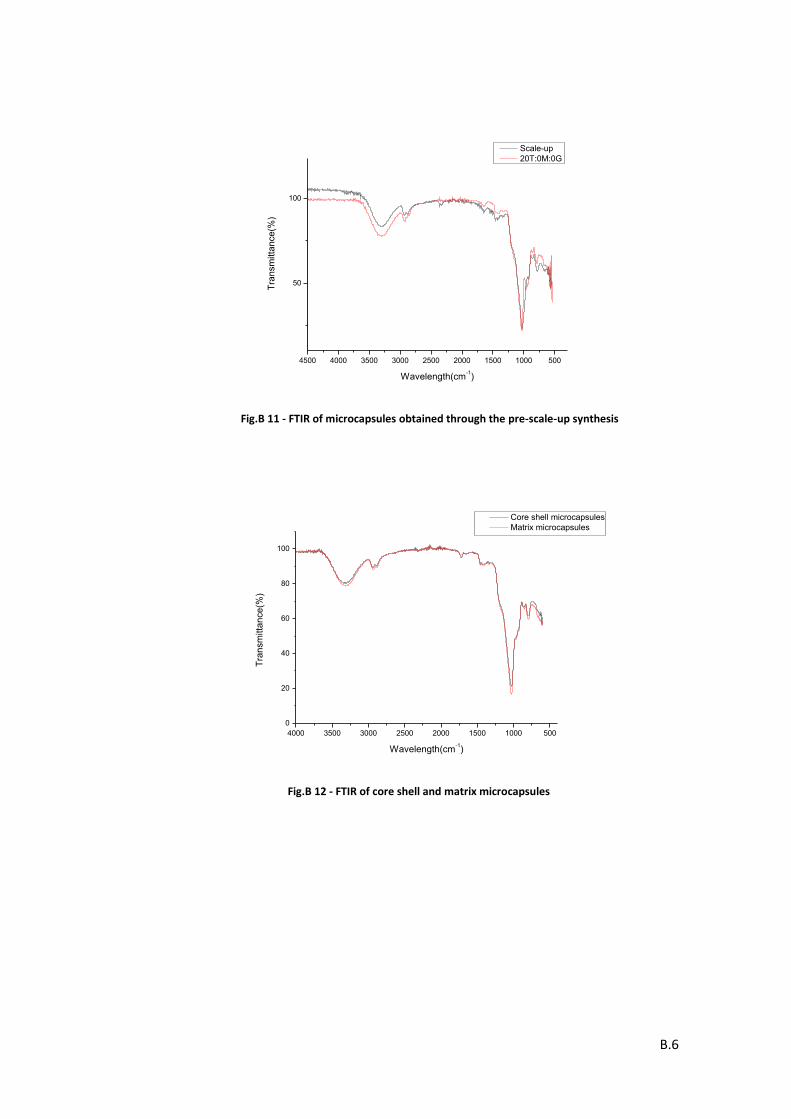
B.6
4500 4000 3500 3000 2500 2000 1500 1000 500
50
100
Tra
nsm
itta
nce
(%)
Wavelength(cm-1)
Scale-up
20T:0M:0G
Fig.B 11 - FTIR of microcapsules obtained through the pre-scale-up synthesis
Fig. B 6 - FTIR of microcapsules obtained through the Scale-Up synthesis
4000 3500 3000 2500 2000 1500 1000 500
0
20
40
60
80
100
Tra
nsm
itta
nce
(%)
Wavelength(cm-1)
Core shell microcapsules
Matrix microcapsules
Fig.B 12 - FTIR of core shell and matrix microcapsules
Fig. B 7 - FTIR of core shell and matrix silica based microcapsules

C.1
Appendix C – Viscosity Tests
Fig.C 1 - Viscosuty test results for microcapsules synthetized
without the pre-hydrolysis step
Fig.C 2 - Viscosity test results for microcapsules synthetized with
more amount of glycerol

C.2
0 50 100 150 200 250
600
800
1000
1200
1400
1600
Vis
co
sity(c
P)
Time(Hours)
Reference: 10T:0M:1OG(+EDA)
Synthesis (S1)
Synthesis (S2)
Fig.C 3 - Viscosity results for silica/epoxy microcapsules
-20 0 20 40 60 80 100 120 140 160 180 200 220 240 260 280 300 320 340
0
1000
2000
3000
4000
5000
6000
Vis
co
sity(c
P)
Time(Hours)
20T:0M:0G
Synthesis (S1)
Synthesis (S2)
Synthesis (S4)
Fig.C 5 - Viscosity test results for silica based microcapsules with cork
Fig. C 1 - Viscosity test results for silica based microcapsules with cork
-20 0 20 40 60 80 100 120 140 160 180 200 220 240 260 280
0
1000
2000
3000
4000
5000
6000
Tra
nsm
itta
nce
(%)
Time(Hours)
10T:0M:0G
Synthesis (S3)
Synthesis( S4)
Fig.C 4 - Viscosity test results for silica based microcapsules with Silopren

C.3
0 50 100 150 200 250 300 350
0
1000
2000
3000
4000
5000
Vis
co
sity(c
P)
Time(Hours)
10T:0M:10G(+EDA)
Synthesis (S1)
Synthesis (S3)
Fig.C 6 - Viscosity test results for silica/Epoxy microcapsules with cork
Fig. C 2 - Viscosity test results for silica/epoxy microcapsules with cork
-20 0 20 40 60 80 100 120 140 160 180 200 220 240 260 280 300 320 340
0
1000
2000
3000
4000
5000
6000
Vis
co
sity(c
P)
Time(Hours)
Reference: 20T:0M:0G:10A
Synthesis (S1)
Synthesis (S2)
Fig.C 7 - Viscosity test results for silica based microcapsules with an amino-functional silica double shell, synthetized with
two surfactants
Fig. C 3 - Viscosity test results for silica based microcapsules
with an aminosilane souble shell, synthetized with two
surfactants
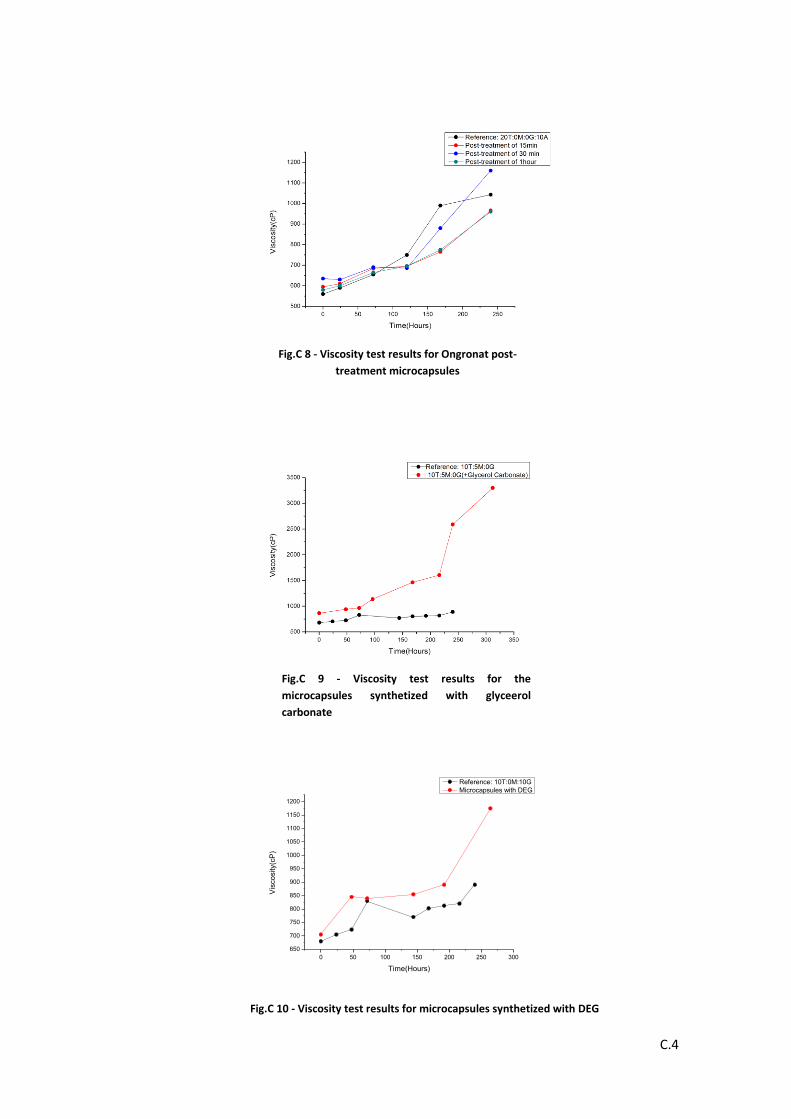
C.4
0 50 100 150 200 250 300
650
700
750
800
850
900
950
1000
1050
1100
1150
1200
Vis
co
sity(c
P)
Time(Hours)
Reference: 10T:0M:10G
Microcapsules with DEG
Fig.C 10 - Viscosity test results for microcapsules synthetized with DEG
Fig. C 4 - Viscosity test results for microcapsules with DEG
Fig.C 8 - Viscosity test results for Ongronat post-
treatment microcapsules
Fig.C 9 - Viscosity test results for the
microcapsules synthetized with glyceerol
carbonate

C.5
-20 0 20 40 60 80 100 120 140 160 180 200 220 240
0
1000
2000
3000
4000
5000
Vis
co
sity(c
P)
Time(Hours)
Core shell microcapsules
Matrix microcapsules
Fig.C 12- Viscosity test results for core shell and matrix silica based microcapsules, synthetized with two surfactants
Fig. C 5 - Viscosity test results for core shell and matrix silica based microcapsules, synthetized with two surfactants
Fig.C 11 - Viscosity test results for microcapsules
synthetized through the pre-scale-Up

D.1
Appendix D – TGA SThermograms
0 100 200 300 400 500 600 700 800
0
20
40
60
80
100
We
igh
t(%
)
Temperature(C)
H2O+glycerol
(2/3 H2O + 1/3 glycerol)
0 100 200 300 400 500 600 700 800
40
50
60
70
80
90
100
we
igh
t(%
)
Temperature(C)
10T:0M:10G
Fig.D 2 – TGA test result for microcapsules synthetized with 10T:0M:10G
Fig.D 1 – TGA test results for a solution of glycerol in water. The solution was made in the same water to glycerol weight proportions as the solution used for the emulsion formation
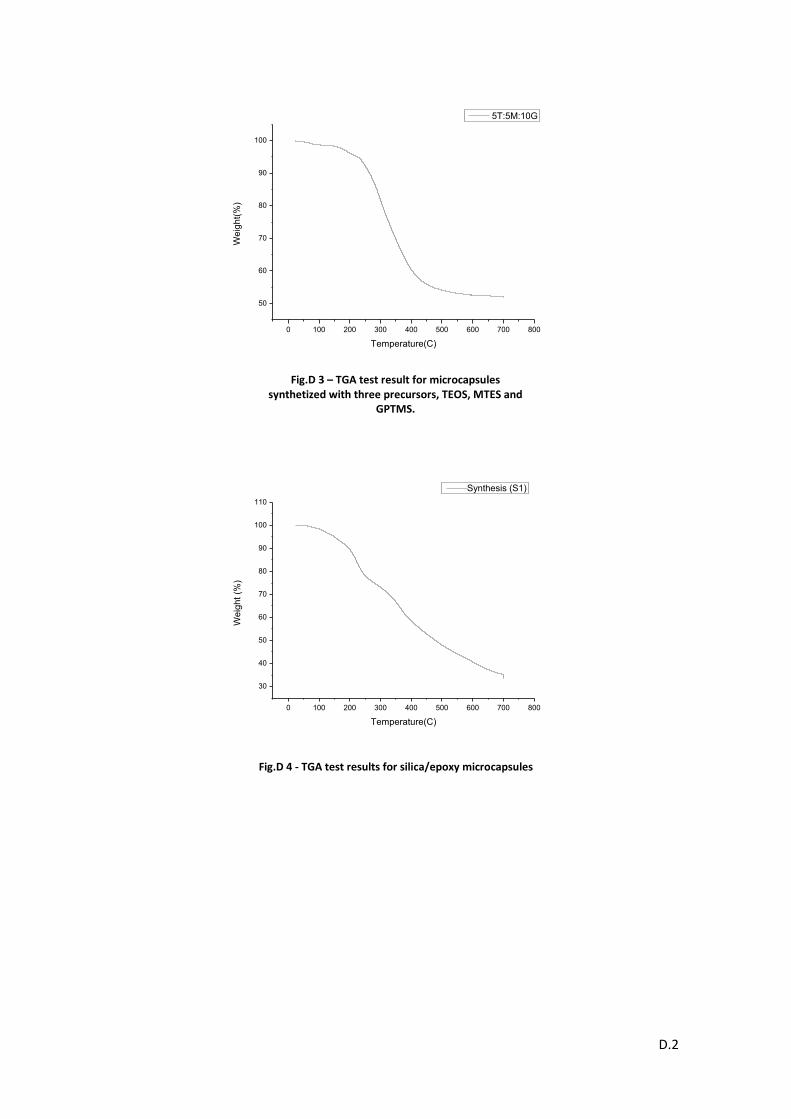
D.2
0 100 200 300 400 500 600 700 800
50
60
70
80
90
100
We
igh
t(%
)
Temperature(C)
5T:5M:10G
0 100 200 300 400 500 600 700 800
30
40
50
60
70
80
90
100
110
We
igh
t (%
)
Temperature(C)
Synthesis (S1)
Fig.D 4 - TGA test results for silica/epoxy microcapsules
Fig.D 3 – TGA test result for microcapsules synthetized with three precursors, TEOS, MTES and
GPTMS.
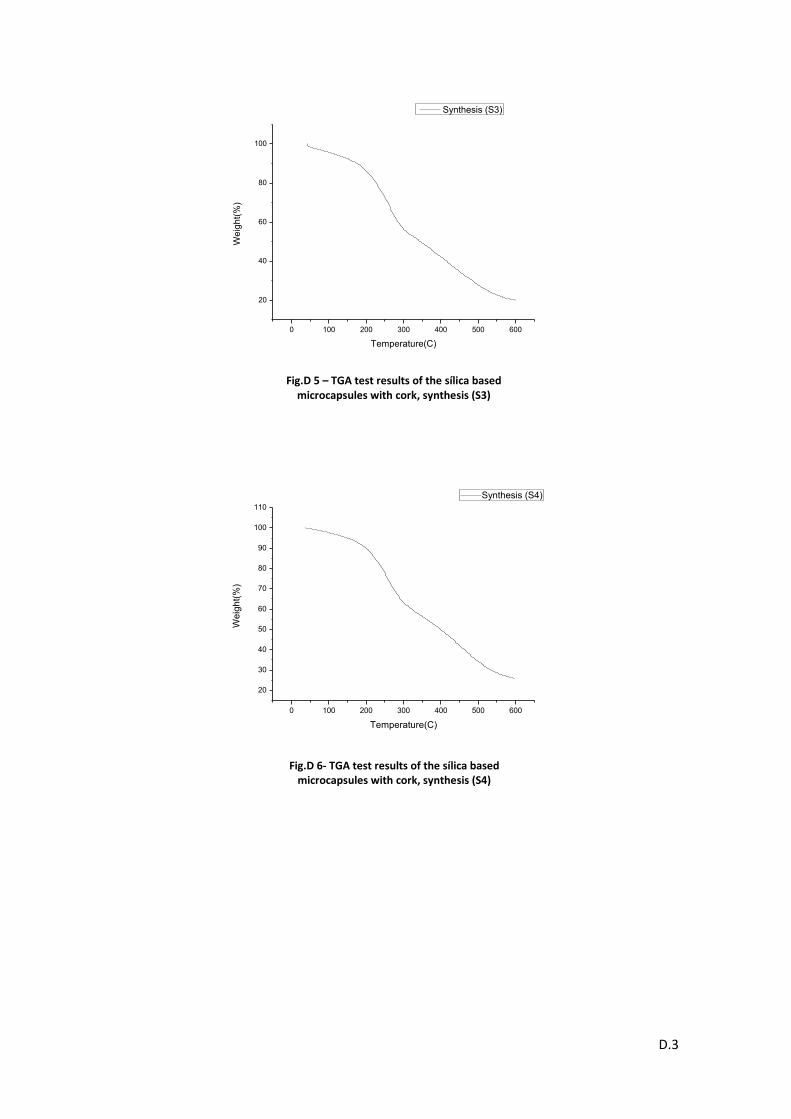
D.3
0 100 200 300 400 500 600
20
40
60
80
100
We
igh
t(%
)
Temperature(C)
Synthesis (S3)
0 100 200 300 400 500 600
20
30
40
50
60
70
80
90
100
110
We
igh
t(%
)
Temperature(C)
Synthesis (S4)
Fig.D 5 – TGA test results of the sílica based microcapsules with cork, synthesis (S3)
Fig.D 6- TGA test results of the sílica based microcapsules with cork, synthesis (S4)
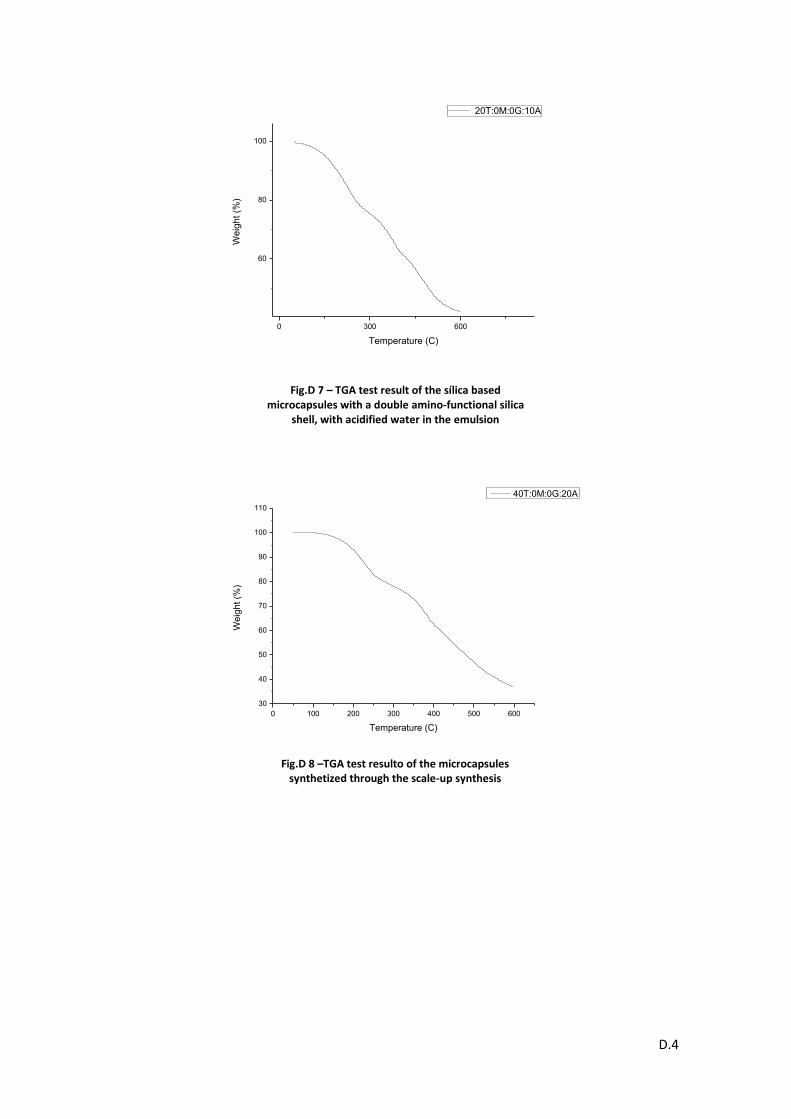
D.4
0 300 600
60
80
100
We
igh
t (%
)
Temperature (C)
20T:0M:0G:10A
0 100 200 300 400 500 600
30
40
50
60
70
80
90
100
110
We
igh
t (%
)
Temperature (C)
40T:0M:0G:20A
Fig.D 7 – TGA test result of the sílica based microcapsules with a double amino-functional silica
shell, with acidified water in the emulsion
Fig.D 8 –TGA test resulto of the microcapsules synthetized through the scale-up synthesis