test reportof ies lm-79-08 · page 3of14 ref. no.: lczp16100271 , v1.0 lctech (zhongshan)testing...
TRANSCRIPT

The duplication of this report or parts of it and its use for advertising purposes is only allowed withpermission of the testing laboratory. This report contains the result of the examination of the product
sample submitted by the applicant. A general statement concerning the quality of the products from theseries manufacture cannot be derived therefore. This report must not be used by the customer to claim
product certification, approval or endorsement by NVLAP, NIST, or any agency of the FederalGovernment.
IESNASUSTAININGMEMBER
Test report of
IES LM-79-08Approved Method: Electrical and Photometric Measurements of Solid-State
Lighting Products
Rendered to:
LIGHT EFFICIENT DESIGN, DIV OF TADD LLC.188 S. Northwest Highway Cary, IL 60013
For products:LED Lamp
Models No.:LED-8030M57-MHBC
Test Date: Oct. 28, 2016 to Oct. 29, 2016
Test Item: Total luminous flux, Luminous Efficacy, Electrical values, Luminous Intensity
Distribution, Chromaticity coordinates, CCT and CRI, Spectral Power Distribution.
Test Lab.: LCTECH (Zhongshan) Testing Service Co., Ltd2/F., Technology and Enterprise Development Center, Guangyuan Road, Xiaolan,
Zhongshan, Guangdong, China
Tel:+86-760-22833366 Fax:+86-760-22833399
E-mail:[email protected] http://www.lccert.com
Template No.: LC-RT-PL/LM79-08/01
Test Note: /
Complied by: Reviewed by:
Bowen Pang Richard Li
Project Engineer Technical Manager
Nov. 7, 2016 Nov. 7, 2016
Ref. No.: LCZP16100271
Version: 1.0
Date of issue: Nov. 7, 2016
Total pages: 14
Page 2 of 14 Ref. No.: LCZP16100271 , V1.0
LCTECH (Zhongshan) Testing Service Co., Ltd.
Table of Contents1. General ............................................................................................................................................ 3
1.1 Product Information.............................................................................................................. 3
1.2 Standards or methods.......................................................................................................... 4
1.3 Equipment list....................................................................................................................... 4
2. Test conducted and method .......................................................................................................... 5
2.1 Ambient Condition................................................................................................................ 5
2.2 Power Supply Characteristics .............................................................................................. 5
2.3 Seasoning and Stabilization ................................................................................................. 5
2.4 Electrical Instrumentation..................................................................................................... 5
2.5 Color Measurement Method................................................................................................. 5
2.6 Total Luminous Flux Measurement Method ......................................................................... 5
2.7 Luminous Intensity Distribution Measurement Method......................................................... 5
2.8 Spatial Non-uniformity of Chromaticity ................................................................................. 5
3. Test Result Summary ..................................................................................................................... 6
3.1 Electrical data....................................................................................................................... 6
3.2 Photometric data .................................................................................................................. 6
3.3 Color Rendering Details ....................................................................................................... 6
4. Test Data.......................................................................................................................................... 7
4.1 Spectral Distribution ............................................................................................................. 7
4.2 ANSI Chromaticity Quadrangles Diagram ............................................................................ 7
4.3 Goniometry Test Data .......................................................................................................... 8
4.4 Zonal Lumen Summary........................................................................................................ 8
4.5 Polar Curves ........................................................................................................................ 9
4.6 Lux distance Curve.............................................................................................................10
4.7 ISO candela diagram on circular web.................................................................................11
4.8 ISO illuminance diagram ....................................................................................................12
4.9 Candela Tabulation ............................................................................................................13
Appendix 1 Product Photo ...................................................................................................................14

Page 3 of 14 Ref. No.: LCZP16100271 , V1.0
LCTECH (Zhongshan) Testing Service Co., Ltd.
1. General1.1 Product Information
Brand Name -
Product Type LED Lamp
Model Number LED-8030M57-MHBC
Rated Inputs 277V, 60Hz
Rated Power 210 W
Rated Light output N/A
Declared CCT 5700K
Ballast M59
LED Package, Array or Module Model: SPMWHX1228FXXXXXXXX, manufactured by SAMSUNG
ELECTRONICS CO., LTD
Receipt Samples 1 unit
Date of Receipt Samples Oct. 26, 2016
Note -

Page 4 of 14 Ref. No.: LCZP16100271 , V1.0
LCTECH (Zhongshan) Testing Service Co., Ltd.
1.2 Standards or methodsThe following standards are partly or totally used or referenced for test:
No. Name
ANSI/NEMA/ ANSLG
C78.377-2011
Specifications for the Chromaticity of Solid State Lighting Products
ANSI C82.77-2002 Harmonic Emission Limits Related Power Quality Requirements for Lighting
Equipment
CIE Pub. No. 13.3-1995 Method of Measuring and Specifying Color Rendering of Light Sources
CIE Pub. No. 15:2004 Colorimetry
IES LM-79-08 Electrical and Photometric Measurements of Solid-State Lighting Products
1.3 Equipment list
Instrument ID Model name Cal. date Next cal. Date
AC Power supply LC-I-923 CHP-500 2016-02-04 2017-02-03
AC Power supply LC-I-987 APW-110N 2016-02-04 2017-02-03
Power analyzer LC-I-928 WT210 2016-01-24 2017-01-24
Power analyzer LC-I-954 WT210 2016-02-04 2017-02-03
Multimeter LC-I-972 Fluke 17B 2016-08-10 2017-08-09
Photometric colorimetric
electric system
(2 meter sphere)
LC-I-900 SPR3000 Before use Before use
Standard lamp LC-PL-I-002 24V100W 2016-10-08 2017-10-07
Luminous Flux Standard Lamp
LC-PL-I-001 110V/200W 2016-09-24 2017-09-23
Goniophotometer(with
mirror)LC-I-902 GMS2000 2016-05-07 2017-05-07
Wireless temperature
transmitterLC-I-978 DWRF-B 2016-02-03 2017-02-02
Wireless temperature
transmitterLC-I-979 DWRF-B 2016-02-03 2017-02-02

Page 5 of 14 Ref. No.: LCZP16100271 , V1.0
LCTECH (Zhongshan) Testing Service Co., Ltd.
2. Test conducted and methodThe lamp was operated at least 2 hours to reach stabilization and temperature equilibrium before test.
2.1 Ambient ConditionThe ambient temperature in which measurements are being taken was maintained at 25 C 1 C; the air
flow around the sample(s) being tested did not affect the performance.
2.2 Power Supply CharacteristicsThe AC power supply had a sinusoidal voltage wave shape at the prescribed frequency (50 Hz) such that
the RMS summation of the harmonic components does not exceed 3 percent of the fundamental during
operation of the test item.
The voltage of AC power supply (RMS voltage) applied to the device under test was regulated to
within 0.2 percent under load.
2.3 Seasoning and StabilizationNo seasoning was performed in accordance with IESNA LM-79-08. And before the measurement, the
sample was stabilized until the light output and power variations were less than 0.5% in 30 minutes
intervals (3 readings, 15 minutes apart).
2.4 Electrical InstrumentationThe calibration uncertainties of the instruments for AC voltage and current were less than 0.2 percent,
and the calibration uncertainty of the AC power meter was less than 0.5 percent(95 % confidence interval,
k=2).
2.5 Color Measurement MethodSpectral radiant flux was measured by a sphere (2 meter)-spectroradiometer system, and the color
characteristics (Color rendering index, correlated color temperature, chromaticity coordinate) were
calculated from these by software automatically.
2.6 Total Luminous Flux Measurement MethodTotal luminous flux was measured type C goniophotometer system.
Light intensity distribution was measured by a type C goniophotometer (with mirror) which can keep the
sample in burn position when the tests conduct, and the total luminous flux was calculated from the
intensity data by software automatically.
2.7 Luminous Intensity Distribution Measurement Method
Luminous intensity distribution was measured by a mirror-type goniophotometer (Type C) which can
keep the sample in burn position when the tests conduct, and the kinds of graph were generated by
software automatically.
2.8 Spatial Non-uniformity of ChromaticityThe customer did not require this measurement.

Page 6 of 14 Ref. No.: LCZP16100271 , V1.0
LCTECH (Zhongshan) Testing Service Co., Ltd.
3. Test Result Summary3.1 Electrical data
Criteria Item Result(Sphere) Result(Goniophotometer)
Input Voltage & Frequency 277.00V~60Hz 277.03V~60Hz
Input Current(A) 1.301 1.297
Total Power(W) 210.10 210.53
Power Factor 0.583 0.586
I-THD(%) 32.72 -
Off-state Power(W) - -
3.2 Photometric data
Criteria Item Result(Sphere) Result(Goniophotometer)
Total Lumens(lm) - 17226.44
Luminaire Efficacy(Lm/W) - 81.82
Correlated Color Temperature (CCT)(K) 5717 -
Color Rendering Index (CRI) 85.4 -
R9 26 -
Chromaticity Coordinate (x,y) x=0.3276 y=0.3399 -
Chromaticity Coordinate (u,v) u=0.2040 v=0.3175 -
Chromaticity Coordinate (u ,v ) u'=0.2040 v'=0.4763 -
Duv 0.00161 -
Central intensity(cd) - 3887.890
Beam angle - 112.6
Spacing Criteria(0-180 ) - 1.42
Spacing Criteria(90-270 ) - 1.40
Zone Lumens between 0-60 - 56.10%
Zone Lumens between60-90 - 21.30%
Zone Lumens between 90-120 - 13.50%
Zone Lumens between 120-180 - 9.10%
3.3 Color Rendering Details
R1 R2 R3 R4 R5 R6 R7 R8
85 88 90 87 85 84 89 75
R9 R10 R11 R12 R13 R14 R15 -
26 72 86 66 85 95 81 -
Note: N.A.

Page 7 of 14 Ref. No.: LCZP16100271 , V1.0
LCTECH (Zhongshan) Testing Service Co., Ltd.
4. Test Data4.1 Spectral Distribution
4.2 ANSI Chromaticity Quadrangles Diagram
0.28
0.30
0.32
0.34
0.36
0.38
0.40
0.42
0.44
0.46
0.28 0.30 0.32 0.34 0.36 0.38 0.40 0.42 0.44 0.46 0.48 0.50 0.52
Planckian locus
Center Point
Measured x,y
Graphicalrepresentation of the chromaticity specification of SSL products
CIE 1931 x, y diagram
y
x
2700K3000K
3500K
4000K
4500K
5000K
5700K
6500K

Page 8 of 14 Ref. No.: LCZP16100271 , V1.0
LCTECH (Zhongshan) Testing Service Co., Ltd.
4.3 Goniometry Test Data
CIE Type Semi-Direct Basic Luminous Shape Circular w/ Sides
Spacing Criteria (0-180 ) 1.42 Luminous Diameter 0.23 m
Spacing Criteria (90-270 ) 1.40 Luminous Height 0.07 m
Spacing Criteria (Diagonal) 1.48
Test Distance 29.65 m
4.4 Zonal Lumen Summary

Page 9 of 14 Ref. No.: LCZP16100271 , V1.0
LCTECH (Zhongshan) Testing Service Co., Ltd.
4.5 Polar Curves

Page 10 of 14 Ref. No.: LCZP16100271 , V1.0
LCTECH (Zhongshan) Testing Service Co., Ltd.
4.6 Lux distance Curve

Page 11 of 14 Ref. No.: LCZP16100271 , V1.0
LCTECH (Zhongshan) Testing Service Co., Ltd.
4.7 ISO candela diagram on circular web
Page 12 of 14 Ref. No.: LCZP16100271 , V1.0
LCTECH (Zhongshan) Testing Service Co., Ltd.
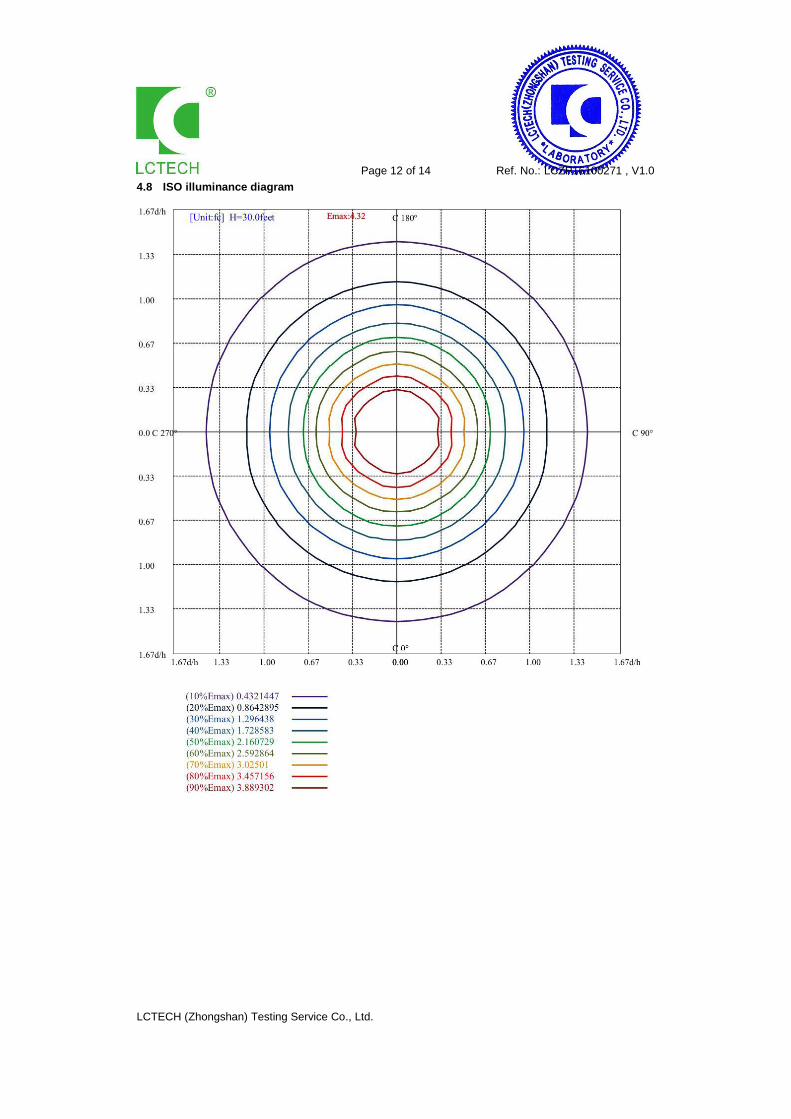
4.8 ISO illuminance diagram

Page 13 of 14 Ref. No.: LCZP16100271 , V1.0
LCTECH (Zhongshan) Testing Service Co., Ltd.
4.9 Candela Tabulation

Page 14 of 14 Ref. No.: LCZP16100271 , V1.0
LCTECH (Zhongshan) Testing Service Co., Ltd.
Appendix 1 Product Photo
Picture 1
Picture 2
****End of test report****