test results of tqs03: a larp shell-based nb sn quadrupole ... · test results of tqs03: a larp...
TRANSCRIPT
Test results of TQS03: a LARP shell-based Nb3Sn quadrupole
using 108/127 conductor
H Felice1, G Ambrosio
2, M Bajko
4, E Barzi
2, B Bordini
4, R Bossert
2, S Caspi
1, D
Dietderich1, P Ferracin
1, J Feuvrier
4, A Ghosh
3, A Godeke
1, J Lizarazo
1, L
Rossi4, G Sabbi
1, P Wanderer
3, X Wang
1, A V Zlobin
2
1LBNL, 1 Cyclotron road, Berkeley, CA 94720, USA
2FNAL, Batavia, P.O. Box 500, Batavia, IL 60510-5011, USA
3Brookhaven National Laboratory, P.O. Box 5000, Upton, NY 11973-5000, USA
4CERN, CH-1211, Geneva 23, Switzerland
This work was supported by the Director, Office of Science, High Energy Physics, U.S.
Department of Energy under contract No. DE-AC02-05CH11231
Email: [email protected]
Abstract. Future insertion quadrupoles with large apertures and high gradients will be required
for the Phase II luminosity upgrade (1035
cm-2
s-1
) of the Large Hadron Collider (LHC).
Although improved designs, based on NbTi, are being considered as an intermediate step for
the Phase I upgrade, the Nb3Sn conductor is presently the best option that meets the ultimate
performance goals for both operating field and temperature margin. As part of the development
of Nb3Sn magnet technology, the LHC Accelerator Research Program (LARP) developed and
tested several 1-meter long, 90-mm aperture Nb3Sn quadrupoles. The first two series of magnet
used OST MJR 54/61 (TQ01 series) and OST RRP 54/61 (TQ02 series) strands. The third
series (TQ03) used OST RRP 108/127 conductor. The larger number of sub-elements and the
consequent reduction of the effective filament size, together with an increased fraction of
copper and a lower Jc were expected to improve the conductor stability. The new coils were
tested in the TQS03 series using a shell structure assembled with keys and bladders. The
objective of the first test (TQS03a) was to evaluate the performances of the 108/127 conductor
and, in particular, its behaviour at 1.9 K, while the second test (TQS03b) investigated the
impact on high azimuthal pre-stress on the magnet performance. This paper reports on TQS03
fabrication, the strain gauge measurements performed during assembly, cool-down, excitation
and the quench behaviour of the two magnets.
1. Introduction
The Phase II upgrade of the Large Hadron Collider (LHC) luminosity baseline requires large aperture
and high gradient interaction region (IR) quadrupoles. Although improved designs based on NbTi are
being considered as an intermediate step for Phase I upgrade, the Nb3Sn conductor is presently the
best option that meets the ultimate performance goals for both operating field and temperature margin.
Three US laboratories (BNL, FNAL and LBNL) are collaborating within the LHC Accelerator
Research Program (LARP) to develop a full scale IR quadrupole made of Nb3Sn conductors. The
Technology Quadrupole (TQ), a 1-meter long 90 mm aperture quadrupole, was the first step toward
this goal. This series of magnets was developed in parallel between FNAL and LBNL, using the same
coils in two different mechanical structures. In this paper, we focus only on magnets which were
tested in the TQS shell-based structure (Technology Quadrupole Shell) relying on the “key and
bladder” technology [1]-[2]. This structure imparts a low preload to the coils at room temperature by
the use of interference keys inserted by water-pressurized bladders which are removed before cool-
down. The differential thermal contraction between the outside Aluminum (7075 T6) shell and the
Iron yoke (1018 steel) completes the full pre-loading of the coil during cool-down. This technique
prevents any pre-stress overshoot of the strain sensitive Nb3Sn conductor since the required
operational preload is attained after cool-down.
Since 2006, nine TQS magnets have been tested (TQS01a/b/c, TQS02a/b/c/d and TQS03a/b). In
all of them, the same mechanical structure was used with various degrees of preloads. Only the coils
exhibited differences in terms of conductor and pole piece material. The change of pole piece material
from Aluminum Bronze in TQS01 to Titanium Alloy (Ti6Al4V) in the TQS02 and TQS03 series was
done for mechanical reasons detailed in [3], [4] and [5]. In addition, the change from the OST
Modified Jelly Roll (MJR) strand (Jc of 1800 A/mm2 at 4.2 K and 12 T) to the OST RRP (Restacked
Rod Process) 54/61 strand [6] (Jc of 2800 A/mm2 at 12 T and 4.2 K) allowed an increase of the
calculated short-sample gradient at 4.2 K from 215 T/m to 243 T/m in the quadrupole aperture. The
detailed comparison between these two series can be found in [3].
The TQS02 series exhibited unstable behavior at 1.9 K with erratic and reduced quench current
with respect to the more stable 4.3 K plateaus. Studies conducted ([7]-[11]) to understand this issue
led to the development of a new conductor: the OST RRP 108/127 strand ([11]-[13]) with smaller
filaments, more copper and lower Jc. This new conductor has been used to fabricate four TQ coils (30,
31, 32 and 33) - first assembled in the TQS03a magnet. The objective of the first test (TQS03a) was to
evaluate the performance of the new OST 108/127 conductor at 4.3 K and at 1.9 K. In the second test
(TQS03b), the purpose was to retest and study the magnet performance with an adjusted increase in
azimuthal pre-load.
After describing the conductor and the magnet design in the first section, the second part of this
article reports on the mechanical behavior of the TQS03 magnets during assembly, cool-down and
excitation. In the last section, the quench performance of these magnets is analyzed and compared
with results from TQS02c; a magnet using 54/61 conductor.
2. Magnet design
2.1. Conductor parameters and magnetic design
This article is focused on the TQS03 series. Nevertheless, for comparison, we need to refer to the
TQS02 series and in particular to the TQS02c magnet. As mentioned in the introduction, the TQS02
series had a reduced performance at 1.9 K with quenches occurring at a lower short sample current
percentage than at 4.3 K [3].
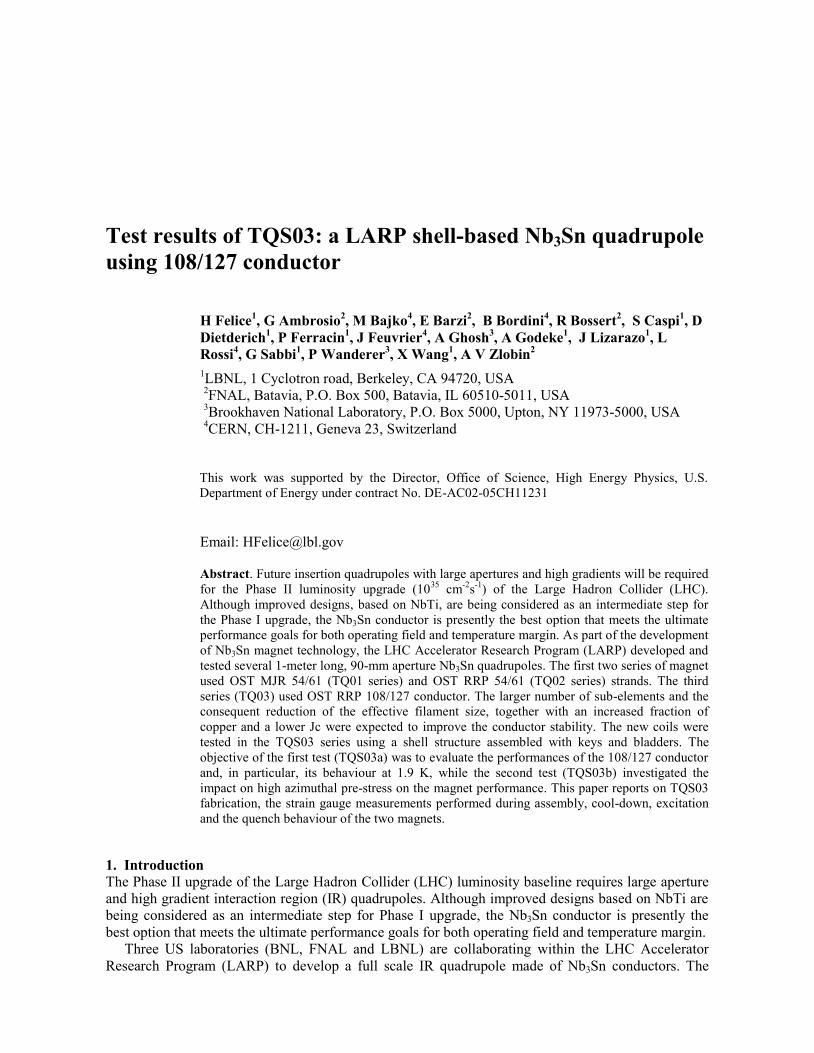
Figure 1. TQS02 and TQS03 strand cross-sections: 0.7 mm
OST RRP strand with 54/61 stack (a) and 0.7 mm OST RRP
strand with 108/127 stack (b)
(a) (b)
This behavior is attributed to instabilities in superconducting strands. Several theories are under
investigation. One of the theories includes “flux jump” instabilities in superconductor driven by the
critical current density and the superconductor filament (sub-element) size [7]-[8]. Another focuses on
the RRP conductor’s self-field instabilities due to a combination of parameters like Jc, strand
diameter, RRR and copper [9]-[10].
In regards to the performance differences between TQS02c and TQS03a, we will compare the
54/61 and the 108/127 conductors respectively, despite the fact that other parameters are different
between these two conductors. As detailed in table 1, regardless of the difference in the filament sizes,
these two strands have different amount of copper and different Ic. In this aspect, a direct comparison
is difficult but it will give us a flavor of the 108/127 performance.
Table 1. Conductor parameters.
Units OST 54/61 / OST 108/127
STRAND
Diameter mm 0.7
Effective Filament diameter m 70 / 50
Cu fraction % 47 / 54
RRR >200
Jc (12 T, 4.2 K)a
A/mm2 2925 / 2770
CABLE
N strands 27
Mid-thickness bare mm 1.26 +/- 0.02
Width bare mm 10.06 +/- 0.05
Keystone angle degree 1.05 +/- 0.1
Insulation thickness mm 0.125 a extracted strand - including self field correction 0.585 T/kA
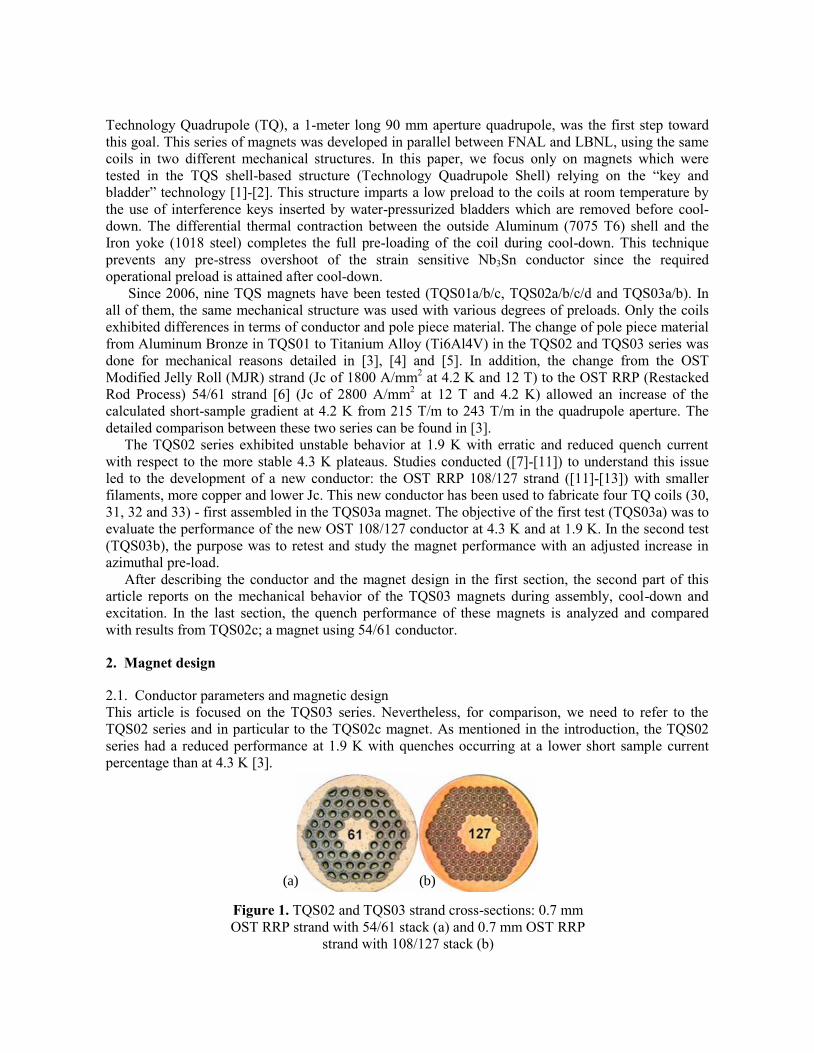
Figure 2. Load line and critical current measurements
4
6
8
10
12
14
16
18
20
22
24
26
28
30
32
10 11 12 13 14 15
Cab
le c
rit
ical cu
rren
t (k
A)
Flux density B (T)
XS - TQS02c - 4.2 K
TQS02c param- 4.2 K
TQS02c param - 1.9 K
XS - TQS03 - 4.2 K
TQS03 param - 4.2 K
TQS03 param - 1.9 K
TQS Loadline
Due to the differences listed in table 1, the short sample current of the TQS02c and TQS03a
magnets are different. The load line of the magnet is represented in figure 2 along with the short
sample current measurements performed at LBNL and BNL on strands extracted from a cable (“XS”).
The measurements are multiplied by the number of strands in the cable and self-field corrected with a
value of 0.585 T/kA. Their average is fitted with the scaling law described in [14], assuming zero
strain in the strand. The 1.9 K Ic(B) curves are computed using the same scaling law based solely on
4.2 K data and fit parameters. At 4.2 K and 1.9 K, the intersection of the load line of the magnet and
the fit gives the magnet’s short sample current. In the past, TQS short sample currents were computed
based on the fit of the lowest strand measurements - giving a slightly lower short sample current,
which explains discrepancies with previous papers, like [3].
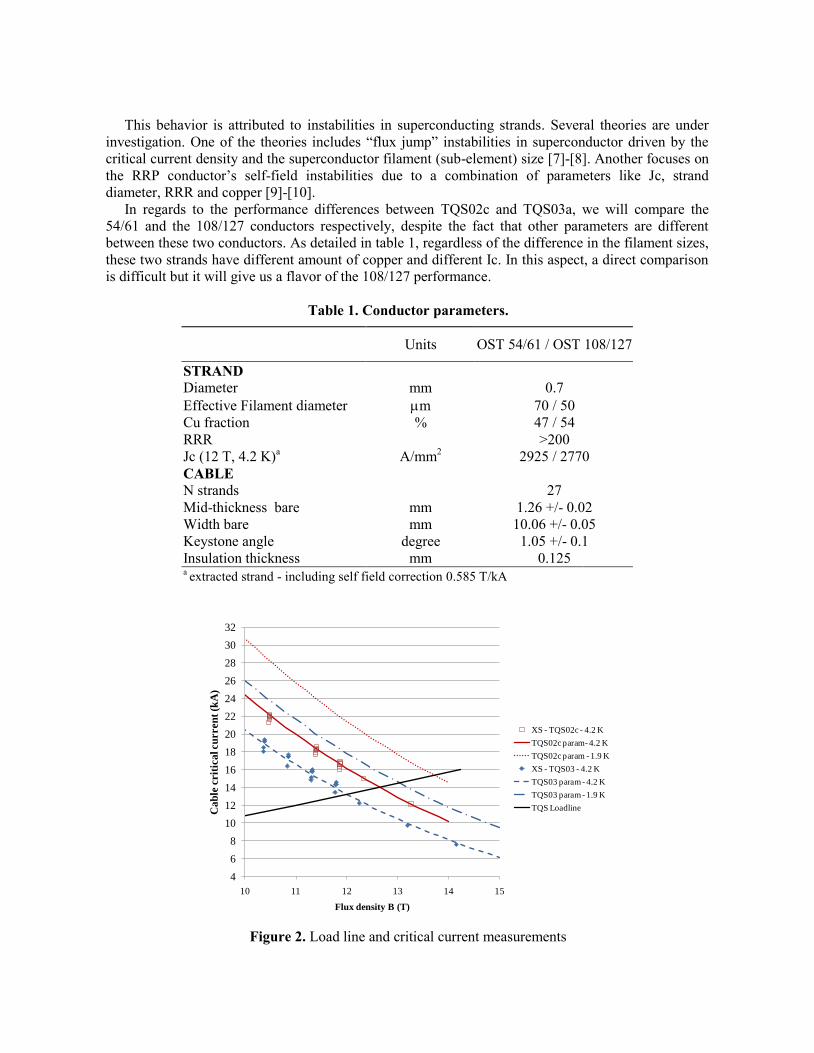
The magnetic cross-section of the magnet is identical in all the TQS series (figure 3). The coils are
made of two layers wound around a Titanium Alloy pole. The inner layer is made of a 6 turn pole
block and a 12 turn mid-plane block separated by an Aluminum Bronze wedge. The outer layer is
made of a single block of 16 turns. The aperture of the magnet is 90 mm. From a magnetic point of
view, TQS03a/b and TQS02c are identical. The magnet parameters of TQS02c and the TQS03 series
are listed in table 2.
Figure 3. TQS coil cross-section
Table 2. TQS02c and TQS03a/b parameters.
Units TQS02c TQS03a/b
Conductor type OST RRP 54/61 OST RRP 108/127
Short sample current Iss at 4.3 K / 1.9 K kA 13.9 / 15.4 13.2 / 14.5
Peak conductor field at 4.3 K / 1.9 K T 12.53 / 13.76 11.96 / 13.02
Short sample gradient at 4.3 K / 1.9 K
T/m 243 / 269 234 / 254
Stored energy at 4.3 / 1.9 K kJ/m 480 / 590 433 / 522
Inductance mH/m 5 5
Horizontal Lorentz force at Iss (4.3 K) per quadrant MN/m 2.1 1.9
Vertical Lorentz force at Iss (4.3 K) per quadrant MN/m -2.2 -2
12 turn mid-plane block
6 turn pole block
16 turn outer layer block
L1p
L2p
L1mp
L2mp
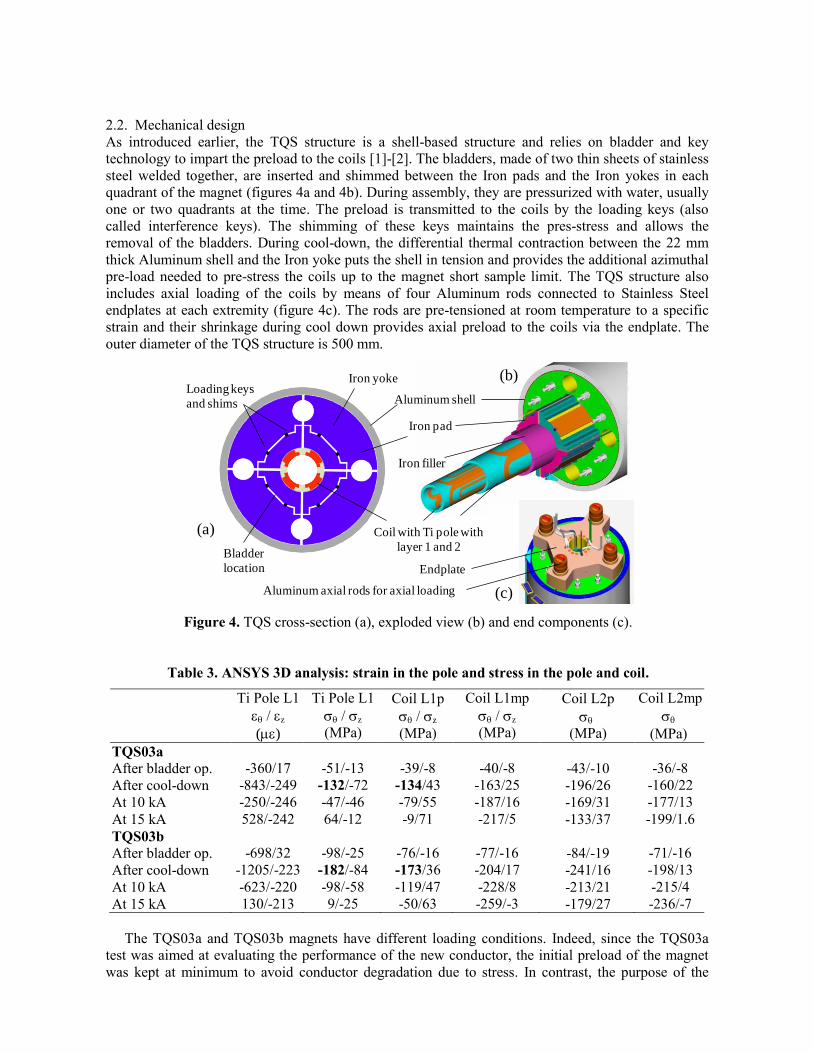
2.2. Mechanical design
As introduced earlier, the TQS structure is a shell-based structure and relies on bladder and key
technology to impart the preload to the coils [1]-[2]. The bladders, made of two thin sheets of stainless
steel welded together, are inserted and shimmed between the Iron pads and the Iron yokes in each
quadrant of the magnet (figures 4a and 4b). During assembly, they are pressurized with water, usually
one or two quadrants at the time. The preload is transmitted to the coils by the loading keys (also
called interference keys). The shimming of these keys maintains the pres-stress and allows the
removal of the bladders. During cool-down, the differential thermal contraction between the 22 mm
thick Aluminum shell and the Iron yoke puts the shell in tension and provides the additional azimuthal
pre-load needed to pre-stress the coils up to the magnet short sample limit. The TQS structure also
includes axial loading of the coils by means of four Aluminum rods connected to Stainless Steel
endplates at each extremity (figure 4c). The rods are pre-tensioned at room temperature to a specific
strain and their shrinkage during cool down provides axial preload to the coils via the endplate. The
outer diameter of the TQS structure is 500 mm.
Figure 4. TQS cross-section (a), exploded view (b) and end components (c).
Table 3. ANSYS 3D analysis: strain in the pole and stress in the pole and coil.
Ti Pole L1
z
()
Ti Pole L1
z
(MPa)
Coil L1p
z
(MPa)
Coil L1mp
z
(MPa)
Coil L2p
(MPa)
Coil L2mp
(MPa)
TQS03a
After bladder op. -360/17 -51/-13 -39/-8 -40/-8 -43/-10 -36/-8
After cool-down -843/-249 -132/-72 -134/43 -163/25 -196/26 -160/22
At 10 kA -250/-246 -47/-46 -79/55 -187/16 -169/31 -177/13
At 15 kA 528/-242 64/-12 -9/71 -217/5 -133/37 -199/1.6
TQS03b
After bladder op. -698/32 -98/-25 -76/-16 -77/-16 -84/-19 -71/-16
After cool-down -1205/-223 -182/-84 -173/36 -204/17 -241/16 -198/13
At 10 kA -623/-220 -98/-58 -119/47 -228/8 -213/21 -215/4
At 15 kA 130/-213 9/-25 -50/63 -259/-3 -179/27 -236/-7
The TQS03a and TQS03b magnets have different loading conditions. Indeed, since the TQS03a
test was aimed at evaluating the performance of the new conductor, the initial preload of the magnet
was kept at minimum to avoid conductor degradation due to stress. In contrast, the purpose of the
Aluminum shell
Iron yoke
Iron pad
Loading keys
and shims
Bladder
location
Coil with Ti pole with
layer 1 and 2
Iron filler
(a)
(b)
(c)
Endplate
Aluminum axial rods for axial loading
TQS03b test was to evaluate the impact of a higher pre-stress on the magnet performance and avoid
any separation between the coil and the pole. Therefore, the average stress level in TQS03b was 40
MPa higher than in TQS03a. For both magnets, all the assembly steps were guided by 3D ANSYS
analyses which included friction and contact elements between the different components of the
magnet.
In tables 3 and 4, the ANSYS-predicted mechanical stresses and strains of the coil, pole piece, shell
and rod are summarized. The two cases represent the reference values for TQS03a and TQS03b. The
model assumes that the coil and the pole pieces are glued. Sliding with a 0.2 friction coefficient was
considered everywhere else. L1, L2 correspond to the inner and the outer layer and L1p (L2p), L1mp
(L2mp) correspond to the inner layer pole turn (outer layer pole turn) and the inner layer mid-plane
turn (outer layer mid-plane turn). It is important to note that in the case of a coil with a Titanium Alloy
pole piece, the inner coil pole turn and the center of the inner layer pole have a similar azimuthal
stress. Therefore, the installation of strain gauges mounted on the Titanium Alloy pole piece is a
convenient way to evaluate the strain in the coil at each step.
Table 4. ANSYS 3D analysis: strain in the shell and rods.
Shell
z
()
Shell
z
(MPa)
Rods
z
(MPa)
Rods
z
(MPa)
TQS03a
After bladder op. 370/-17 29 / 9 73 5
After cool-down 1608/1119 177 / 148 1267 100
At 10 kA 1626/1127 179 / 150 1272 100
At 15 kA 1644/1137 181 / 151 1279 100
TQS03b
After bladder op. 719/-32 56/16 93 6
After cool-down 2065/1445 228/192 1307 103
At 10 kA 2080/1147 230/193 1312 103
At 15 kA
2096/1455 232/194 1318 104
3. Magnet mechanical behaviour
3.1. Assembly and cool-down
The TQS straucture provides a lot of flexibility and quick turnaround which allows assembling,
disassembling and re-assembling a magnet in a few days. TQS03a was assembled at LBNL and
shipped to CERN for testing. Following the TQS03a test there, a bladder operation was performed to
increase the azimuthal pre-stress (TQS03b). This procedure was carried out in a matter of hours at
CERN - allowing the magnet to be retested right away.
In TQS03a and TQS03b, each step of the assembly was monitored by strain gauges. The shell and
axial rods strain gauges were full Wheatstone-bridges which included temperature compensators. On
the inner radius of the inner layer pole, fully compensated full-bridge strain gauges were used as well
as quarter bridges compensated externally with quarter bridges gauges mounted on a stress-free
Titanium piece. While the four axial rods’ strains were measured only in the axial direction (the
azimuthal strain being only due to Poisson effect), the shell and the pole strains were measured in both
the azimuthal () and axial (z) directions. The azimuthal and axial stresses and z were then
computed from the azimuthal and axial strains and z by the equations (1) and (2) where EYoung is
the Young modulus of the material and is the Poisson coefficient.
(1)
𝜎𝜃 =𝐸𝑌𝑜𝑢𝑛𝑔
1 − 𝑣2(𝜀𝜃 + 𝑣𝜀𝑧)
(2)
In TQS03a and TQS03b, coils 30 and 31 had quarter bridges and coils 32 and 33 had full bridges.
During the TQS03a test, one of the goals was to compare the measurements of the two kinds of gauges
in the same magnet. Even though it is commonly known that full bridges provide better accuracy, our
application requires very compact devices, and the use of quarter bridges could be conveniently fitted
on the narrow coil pole piece. Nevertheless, during TQS03a test, the full bridges have shown a better
reliability than the quarter bridges, which were strongly affected by the remote temperature
compensator behavior. Therefore, only the full bridges data are reported here.
During the assembly of TQS03a and TQS03b, shell and rods strain targets were set by the 3D
ANSYS model. During the bladder operation, at room temperature, in the azimuthal direction, the
shell strain is used as a reference value to reach the final preload since it represents the total force
introduced in the system by the bladder operation. The measurements of the pole strain gauges after
the bladder operation and after cool-down are reported in table 5 for each magnet.
Table 5. Measured strain and stress at 300K and 4.3 K.
Shell
z
Shell
z
MPa
Rod
z
Rod
z
MPa
Coil pole
z
Coil pole
z
MPa
TQS03a
At 300 K 640/-50 49 / 12 117 8 -472 / 235 -57 / 13
At 4.3 K 1680 / 1173 178 / 145 1141 79 -807 / 118 -110 / -18
TQS03b
At 300 K 667 / -174 47 / 1.5 100 7 -950/413 -112/19
At 4.3 K 1768 / 1174 192 / 146 1174 85 -1177/140 -161/-26
The main offset between the 3D model and the actual measurements is the cool-down effect.
Indeed, when the model predicts a gain of 150 MPa in the shell, the averaged real gain during cool-
down is of the order of 130 MPa. During assembly, this requires a target room temperature strain
higher than the one predicted by the model. This behavior is also shown by the rods with a real gain of
80 MPa when the model predicts 100 MPa (tables 4 and 5). This difference has been noticed in
previous magnets and could be due to the non linearity of the mechanical properties of the coils, in
particular in the end region, and which are not included in the model.
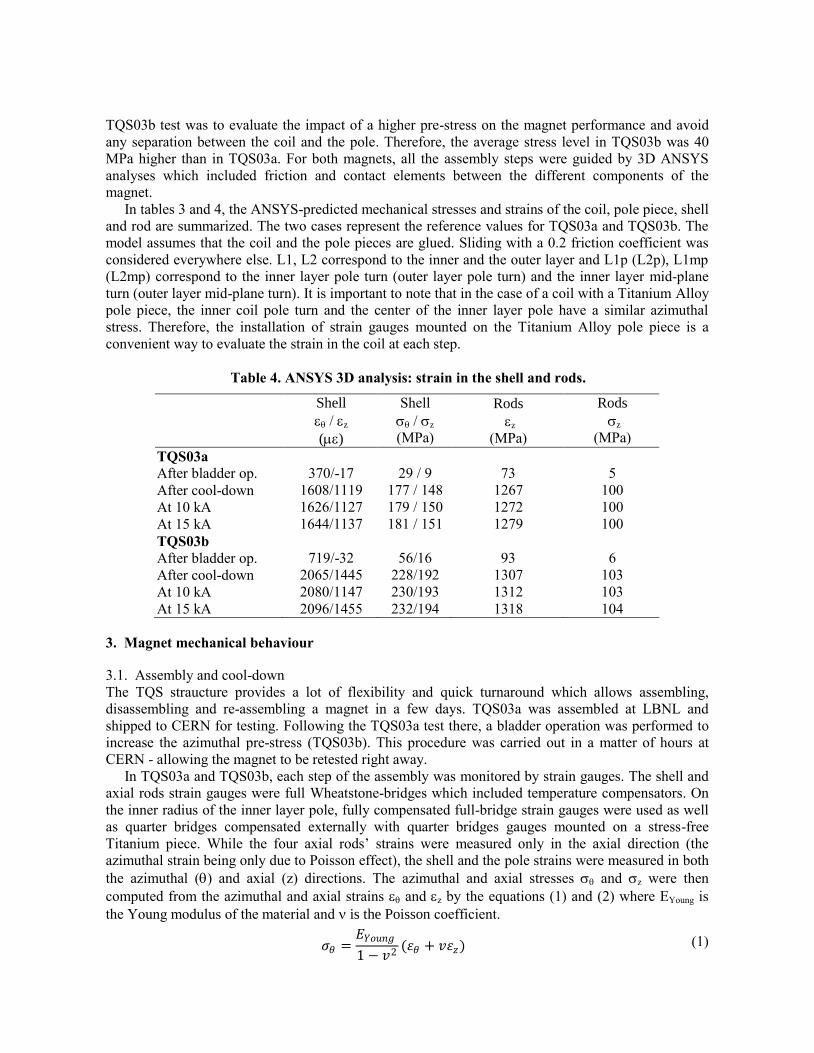
Figure 5. measurement in the pole during assembly (a) and after cool-down (b).
𝜎𝑧 =𝐸𝑌𝑜𝑢𝑛𝑔
1 − 𝑣2(𝜀𝑧 + 𝑣𝜀𝜃)
In figure 5, the stress measurements of TQS03a coils 32 and 33 are shown during bladder operation
and cool-down. Note that in TQS03b, the azimuthal full bridge strain gauge on coil 33 broke during
cool-down forcing us to rely on coil 32 data only.
It is important to remember that the stress takes into account the strain in two directions. Therefore,
reaching the stress target requires reaching the azimuthal and the axial strain targets. In TQS03a and
TQS03b cases, despite the fact that after cool-down the azimuthal strain of the pole is in total
agreement with the computed target (tables 3 and 5), we can see that the preload of the coil is
approximately 20 MPa below the target. This can be explained by the pole showing some tensile
strain axially (table 5) instead of the expected compression predicted by the model (table 3). Some
revision of the model may be required to come to a better agreement in the axial direction with the
measurements.
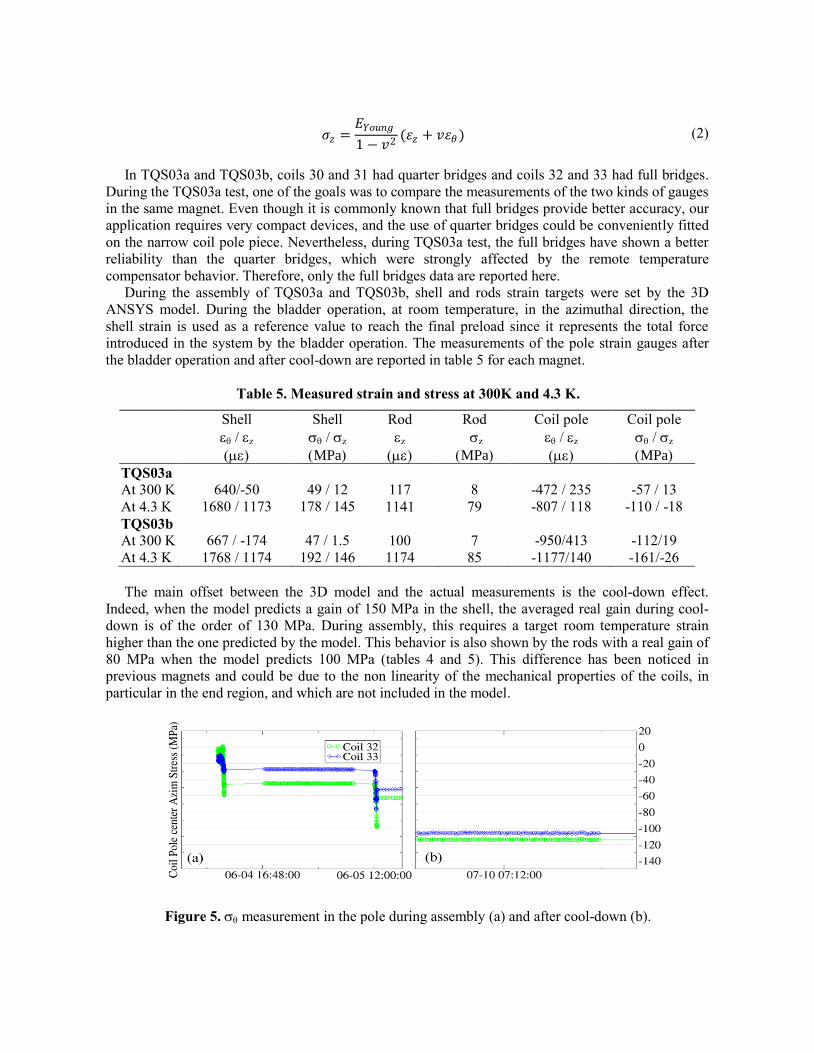
3.2. Excitation
With a sampling rate of one data point every 3 seconds, the strain in the coil poles was monitored
during the current ramps. Under the Lorentz forces, the preload is supposed to prevent separation
between the pole turn and the pole piece. According to the pole strain gauges measurements, the
preload of TQS03a was not sufficient. Figure 6 shows the variation of the coil 32 pole azimuthal stress
during excitation with respect to the square of the current (which is proportional to the Lorentz
forces in the magnet). Figure 7 is a close-up of the high force area.
Figure 6. Variation of in coil 32 pole during several ramps.
In both plots, 6 ramps from TQS03a test (ramps 13, 18, 19, 25 and 26 at 1.9 K and ramp 29 at 4.3
K) are represented as well as one 1.9 K ramp of TQS03b. During ramp #13, the Titanium Alloy pole
shows a linear response to the unloading force, indicating that it is in contact with the pole turn of the
coil. During ramps #18 and 19, the plot shows a change of slope for a current of the order of 12400 A.
This knee indicates a tendency of the pole turn to separate from the pole piece, tearing apart the epoxy
bonding the pole turn to the pole. At that point, the azimuthal stress in the pole has to be zero. During
the data analysis, an offset was introduced to the azimuthal strain keeping the axial strain z the
same. The result was an azimuthal stress equal to zero at the knee. All the coil strain gauges data
shown in this article have been adjusted to meet this criterion.
I2 (A2)
TQS03b
TQS03a

Figure 7. Variation of in coil 32 pole during several ramps in
the high force region.
Once the tearing occurred, the pole turn is unglued from the pole piece and can separate. During
the ramp, once the Lorentz forces overcame the preload, the azimuthal stress in the pole piece
remained zero and the signal given by the strain gauges remained unchanged. Ramp #29 was
performed after the 1.9 K training at 4.3K and confirmed the separation between the pole turn and the
pole piece observed at 1.9 K. For the TQS03a ramps, one can see that the slope of the unloading is
identical from one ramp to another but that the initial stress state of the pole can vary from one ramp
to the next. For example, the ramp #25 in figure 6 starts with a lower stress than the ramp #19, as well
as ramp #26 with respect to ramp #25. This phenomenon is called ratcheting [15] and comes from the
change of strain state experienced by the magnet after a quench. Note that few ratcheting events have
been noticed in TQS03a and TQS03b.
As described in subsection 3.1, the azimuthal preload was increased from TQS03a to TQS03b,
bringing the stress in the coil to 160 MPa. The impact of this increase of the preload on the pole stress
can be seen in figure 6, ramp #16. First, the initial stress state of the pole shows a higher compression.
Second, by its linearity, ramp #16 clearly shows that the preload prevents the pole turn from
separating from the pole (figure 7).
From a design view point, it is interesting to note that the tearing occurs within the first 10 MPa of
tension (ramps 18 and 19 in figure 7). In high field magnet design, we commonly consider that epoxy
can withstand 20 MPa in tension before breaking. The data shown indicates that 5 to 10 MPa seem to
be a more reasonable value to take into account in the design.
4. Quench performances
4.1. 4.3 K training
TQS03a and TQS03b magnet tests were performed at CERN. Their training curves are shown in
figures 8 and 9. All the quenches represented here were performed with a current ramp of 20 A/s.
After the first 3 quenches of TQS03a, the magnet had to be warmed up in order to repair a deficient
splice and was cool-down again. These two cool-downs are designated by -1 or -2 in the legend of
figures 8 and 9.
In TQS03a, the training at 4.3 K reached a plateau at 93 % of the short sample current (Iss) in 8
quenches (3 quenches performed during the first cool-down and 5 quenches in the second cool-down).
The TQS03b plateau at 4.3 K was reached in 2 quenches and is reduced by 2% with respect to
I2 (A2)

TQS03a plateau. It is difficult to say if the faster training is due to a “memory” of the magnet or if it
was improved by the increased pre-load. With both magnets, the gradients reached in the aperture,
during the 4.3 K plateaus, were between 215 T/m and 220 T/m, exceeding the 200 T/m target of the
LARP program by 7 to 10%.
To help the diagnostics and better understand the quench location in the magnet, each coil was
instrumented with 16 voltage taps. In TQS03a and TQS03b, all the quenches involved a large number
of quenching segments. A preliminary analysis showed that the TQS03a and TQS03b 4.3 K plateau
quenches had the same pattern. All of them originated simultaneously in two adjacent coils. In both
coils, the quenching areas were the inner layer mid-plane block (figure 3) and the outer layer was
simultaneously showing a rise of voltage interpreted as a release of heat. For each plateau quench the
outer layer recovered and did not quench.
Figure 8. Gradient reached during TQS03a and TQS03b training
4.2. 1.9 K training
At 1.9 K, TQS03a exhibited a consistent temperature dependence reaching almost the same fraction of
short sample than at 4.3 K (figure 9) and producing a maximum gradient of 238 T/m (figure 8). The
gain in current was approximately 1200 A from 4.3 K to 1.9 K. As detailed in section 3, the strain data
pointed out a clear lack of preload of the magnet which led to the interruption of the 1.9 K test in order
to avoid any degradation. Two final quenches were done upon warming back to 4.3 K and confirmed
the absence of degradation by returning to the initial 4.3 K plateau level.
TQS03b exhibited the same consistent behavior as TQS03a at 1.9 K reaching the same percentage
of short sample than at 4.3 K. Some intermediate temperature quenches were performed during the
training of TQS03b at 1.9 K as well as after the 1.9 K plateau was reached (figure 8), in order to
expedite the warm up to 4.3 K.
As mentioned earlier, the 4.3 K short sample of the magnet is computed based on 4.3 K short
sample measurements. At 1.9 K the short sample current of the magnet is computed using the scaling
law described in [14]. One can notice the very good agreement obtained by the scaling law in terms of
magnet short sample prediction.
190
195
200
205
210
215
220
225
230
235
240
1 3 5 7 9 11 13 15 17 19 21 23 25 27 29 31 33
Grad
ien
t (T
/m)
Quench Number
TQS03a-1 4.3 K
TQS03a-2 4.3 K
TQS03a-2 1.9 K
TQS03b 4.3 K
TQS03b 1.9 K
TQS03b int. T
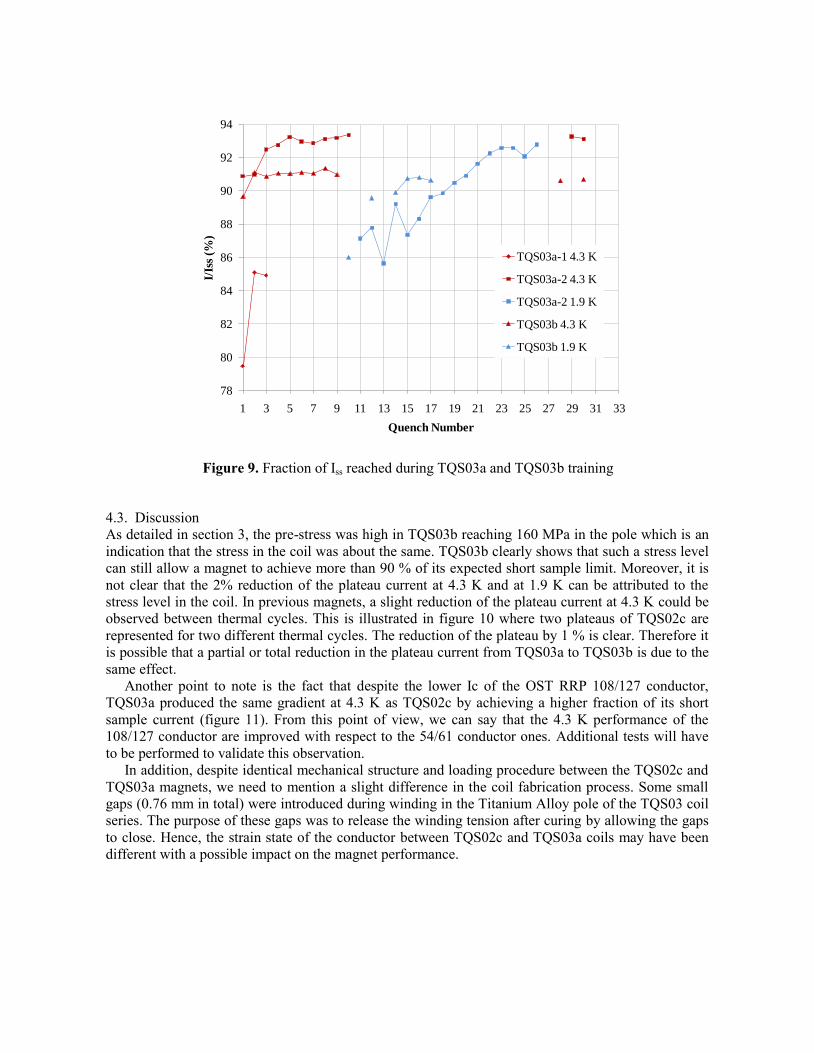
Figure 9. Fraction of Iss reached during TQS03a and TQS03b training
4.3. Discussion
As detailed in section 3, the pre-stress was high in TQS03b reaching 160 MPa in the pole which is an
indication that the stress in the coil was about the same. TQS03b clearly shows that such a stress level
can still allow a magnet to achieve more than 90 % of its expected short sample limit. Moreover, it is
not clear that the 2% reduction of the plateau current at 4.3 K and at 1.9 K can be attributed to the
stress level in the coil. In previous magnets, a slight reduction of the plateau current at 4.3 K could be
observed between thermal cycles. This is illustrated in figure 10 where two plateaus of TQS02c are
represented for two different thermal cycles. The reduction of the plateau by 1 % is clear. Therefore it
is possible that a partial or total reduction in the plateau current from TQS03a to TQS03b is due to the
same effect.
Another point to note is the fact that despite the lower Ic of the OST RRP 108/127 conductor,
TQS03a produced the same gradient at 4.3 K as TQS02c by achieving a higher fraction of its short
sample current (figure 11). From this point of view, we can say that the 4.3 K performance of the
108/127 conductor are improved with respect to the 54/61 conductor ones. Additional tests will have
to be performed to validate this observation.
In addition, despite identical mechanical structure and loading procedure between the TQS02c and
TQS03a magnets, we need to mention a slight difference in the coil fabrication process. Some small
gaps (0.76 mm in total) were introduced during winding in the Titanium Alloy pole of the TQS03 coil
series. The purpose of these gaps was to release the winding tension after curing by allowing the gaps
to close. Hence, the strain state of the conductor between TQS02c and TQS03a coils may have been
different with a possible impact on the magnet performance.
78
80
82
84
86
88
90
92
94
1 3 5 7 9 11 13 15 17 19 21 23 25 27 29 31 33
I/Is
s (%
)
Quench Number
TQS03a-1 4.3 K
TQS03a-2 4.3 K
TQS03a-2 1.9 K
TQS03b 4.3 K
TQS03b 1.9 K

Figure 10. TQS02c and TQS03a/b: Comparison in the plateau current reduction
Figure 11. TQS02c and TQS03a/b: Comparison of the gradient at 4.3 K
5. Conclusion
The main goal of TQS03a test was to determine the behavior of the OST 108/127 conductor. The
TQS03 series showed a much more stable behavior at 1.9 K than the previous TQS02 series made of
OST 54/61 conductor. We attribute the improved stability to a combination of smaller filaments,
increased amount of copper between sub-elements, high RRR and lower Jc. The training performance
of TQS03a validated this conductor first at 4.3 K where the magnet achieved 93 % of short sample,
the highest fraction of short sample ever reached in TQS. At 1.9 K, TQS03a confirmed the expected
stability of this conductor by exhibiting a consistent temperature dependence and reaching 93 % of its
1.9 K short sample limit.
84
86
88
90
92
94
1 2 3 4 5 6 7 8 9 10 11 12
I/Is
s (%
)
Quench Number
TQS02c-1 4.3 K
TQS02c-3 4.3 K
TQS03a-2 4.3 K
TQS03b 4.3 K
2 %
1 %
210
212
214
216
218
220
222
224
1 2 3 4 5 6 7 8 9 10 11 12
Grad
ien
t (T
/m)
Quench Number
TQS02c-1 4.3 K
TQS02c-3 4.3 K
TQS03a-2 4.3 K
TQS03b 4.3 K

The extensive strain data analysis performed on TQS03a showed the progressive unloading of the
pole piece with the Lorentz forces. Tearing of the epoxy bond between the pole piece and the pole turn
above a certain level of forces was gradual before a final break occurred. Based on this observation,
the azimuthal preload of the magnet was increased (TQS03b) bringing the measured stress in the coil
pole to 160 MPa. The increased in pre-stress maintained a linear behavior between the azimuthal stress
and the Lorentz forces (I2) all the way to the plateau. The TQS03b plateau at 4.3 K and 1.9 K was
reduced to 91 % of the short sample limit. For now, it is not clear if this reduction of 2 % is a stress
related reduction. In any case, this magnet shows that even with a level of stress above 150 MPa in the
coil, the magnet can perform above 90 % of its short sample limit. More tests will be needed to
determine at which level of stress the magnet starts to be degraded and degrade irreversibly.
It is also interesting to note that despite a lack of pre-stress, which allowed separation between the
pole turn and the pole, TQS03a was still training without experiencing any degradation. This suggests
a degree of safety margin in performance at reduced magnet pre-stress.
Acknowledgement
The authors would like to thank the LBNL technical staff and the CERN assembly and testing groups
who greatly contributed to the success of these tests. In particular, we wish to thank Juan Carlos Perez,
Julien Hurte, Patrick Viret, Christian Giloux, Roy Hannaford, Paul Bish, Daryl Horler, Brad Bingham
and Chip Kozy for their excellent work and dedication.
References
[1] Caspi S et al. 2001 The use of pressurized bladders for stress control of superconducting
magnets IEEE Trans. Appl. Supercond. vol. 11 no 1 2272
[2] Hafalia A R et al. 2002 Structure for an LHC 90 mm Nb3Sn quadrupole magnet IEEE Trans.
Appl. Supercond. vol. 15 no 2 1444
[3] Caspi S et al. 2009 Test results of LARP Nb3Sn quadrupole magnets using a shell-based support
structure (TQS) IEEE Trans. Appl. Supercond. vol. 19 no. 3 1221
[4] Caspi S et al. 2006 Design and Analysis of TQS01, a 90 mm Nb3Sn model quadrupole for the
LHC Luminosity upgrade based on a key and bladder assembly IEEE Trans. Appl.
Supercond. vol. 16 no 2 358
[5] Caspi S et al. 2007 Fabrication and test of TQS01 – a 90 mm Nb3Sn quadrupole magnet for
LARP IEEE Trans. Appl. Supercond. vol. 17 no 2 1122
[6] Parrell J A et al. 2003 High Field Nb3Sn Conductor Development at Oxford Superconducting
Technology IEEE Trans. Appl. Supercond. vol. 13 no. 2 3470
[7] Kashikhin V V, Zlobin A V, 2005 Magnetic Instabilities in Nb3Sn Strands and Cables IEEE
Transactions on Appl. Supercond. vol. 15 no. 2 1621
[8] Barzi E et al. 2007 Performance of Nb3Sn RRP strands and cables based on a 108/127 stack
design IEEE Trans. Appl. Supercond. vol. 17 no. 2 2718
[9] Bordini B et al. 2008 Self-field effects in magneto-thermal instabilities for Nb-Sn strands IEEE
Trans. Appl. Supercond. vol. 18 no. 2 1309
[10] Bordini B, Rossi L 2009 Self fied instability in high Jc Nb3Sn strands with high copper resisudal
resistivity IEEE Trans. Appl. Supercond. vol. 19 no. 3 2470
[11] Ghosh A et al. 2008 Transport and magnetization properties of rolled RRP Nb3Sn strands, IEEE
Trans. Appl. Supercond. vol. 18 no. 2 993
[12] Parrell J A, et al. 2009 Internal tin Nb3Sn conductors engineered for fusion and particle
accelerator applications IEEE Trans. Appl. Supercond. vol. 19 no. 3 2573
[13] Barzi E et al. 2009 Development and study of Nb3Sn strands and cables for high field
accelerator magnets accepted for publication in Adv. in Cryog. Engin.
[14] Godeke A et al. 2006 A general scaling relation for the critical current density in Nb3Sn,
Supercond. Sci. Technol. 19 R100-R116
[15] Ferracin P et al. 2007 Towards computing ratcheting and training in superconducting magnet
IEEE Trans. Appl. Supercond. vol. 17 no. 2 2373