testimony of steven nadel executive director...2014/07/24 · steven nadel, aceee, testimony for...
TRANSCRIPT
Testimony of Steven Nadel Executive Director American Council for an Energy-Efficient Economy (ACEEE) To the House Energy and Commerce Committee Subcommittee on Energy and Power Hearing on: Laboratories of Democracy: The Economic Impacts of State Energy Policies July 24, 2014

Steven Nadel, ACEEE, Testimony for July 24, 2014 Hearing
1
Summary
States are increasingly taking action to help consumers and businesses reduce their energy use and costs
and promote economic development through energy efficiency. In this testimony I will
discuss the favorable economics of energy efficiency investments;
provide some specific examples of how states are encouraging energy efficiency, particularly in
several of the states whose rankings are most improved in ACEEE’s annual State Energy
Efficiency Scorecard;
discuss the link between energy efficiency and economic development, with examples from
specific studies on California, the Northeast, and Ohio; and
summarize opportunities to use energy efficiency to create jobs and economic development in
each of the states.
I conclude that there are large opportunities for cost-effective energy efficiency investments,
investments that can aid economic development by
creating direct jobs from manufacturing and installing energy efficiency measures;
reducing energy bills for consumers and businesses as energy use declines;
suppressing prices in wholesale energy markets as the law of supply and demand affects these
markets; and
creating indirect and induced jobs as these direct impacts ripple through the economy,
particularly as consumers and businesses spend money they have saved on energy bills.
All states can benefit from these economic development impacts, with job gains of more than 600,000
possible nationally, not to mention nearly $50 billion in net economic benefits, both by 2030. More and
more states are recognizing these benefits, as illustrated by Mississippi, Oklahoma, and Arkansas. The
federal government can help and encourage states through such actions as best-practice guides and
technical assistance.
Steven Nadel, ACEEE, Testimony for July 24, 2014 Hearing
2
Introduction
My name is Steven Nadel, and I am the executive director of the American Council for an Energy-
Efficient Economy (ACEEE), a nonprofit organization that acts as a catalyst for energy efficiency
policies, programs, technologies, investments, and behavior. We were formed in 1980 by energy
researchers and now work with an array of researchers, businesses, and national, state, and local
policymakers. I have been personally involved in energy efficiency issues since the late 1970s, and have
testified multiple times before this subcommittee as well as before the full House Committee and before
the Senate Energy and Natural Resources Committee.
ACEEE has been working on state policy for more than a decade. We have assisted officials and
organizations with policy and program development and implementation in over half the states. We have
conducted extensive research on state energy efficiency efforts and published many reports on the
subject. I provide specific examples of our findings throughout this testimony.
ACEEE believes that energy efficiency should be a cornerstone of an “all-of-the-above” energy policy.
Energy efficiency is generally our least expensive energy resource, meaning that it often costs less to
save a unit of energy than it costs to produce that same unit of energy. As a result, large, cost-effective
savings are available in all 50 states. All states are promoting energy efficiency at least to some extent,
but some states more than others. These efforts are helping to create jobs and grow state economies.
Many states are increasing their energy efficiency efforts, but much more is both possible and
advantageous for them. I elaborate on these points in the balance of my testimony, addressing four
issues:
Energy efficiency economics
State energy efficiency efforts including specifics for a few states
The link between energy efficiency and economic development
Opportunities to use energy efficiency to create jobs and economic development in all states
Energy Efficiency Economics
Energy efficiency investments reduce the energy use of homes and businesses, reducing their monthly
energy bills. Energy efficiency investment costs are incurred up front, and monthly energy bill savings
provide a return on these investments. Figure 1 below illustrates the typical rate of return of energy
efficiency investments relative to some other common investments. As the figure shows, energy
efficiency typically provides around a 25 percent return on investment, substantially greater than most
conventional investments.

Steven Nadel, ACEEE, Testimony for July 24, 2014 Hearing
3
Efficiency Investment Risks and Returns
0%
10%
20%
30%
40%
0% 10% 20% 30% 40%
Risk Index (year-to-year volatility)
Av
erag
e A
nn
ual
Ret
urn
Energy Efficiency
U.S. T-Bills
Long-term Corp Bonds
Common Stocks
Small Company
Stocks
Figure 1. Risks and returns for different types of investments. Source: ACEEE estimates for energy efficiency; other estimates adapted from the Vanguard
Group.
Importantly, the returns associated with energy efficiency are typically only available from investments
with a much higher risk profile. As figure 1 shows, efficiency investments are less risky than long-term
corporate bonds, yet they yield returns significantly higher than the much riskier small-cap equities
market. On a risk-adjusted basis, energy efficiency is far and away one of the most attractive investment
classes out there.
Another way to look at energy efficiency economics is to compare the cost of energy efficiency per unit
of energy saved to the cost of supplying that same amount of energy. Figure 2 compares (a) the cost to
utilities per kWh of electricity from utility-operated energy efficiency programs to (b) the cost of
building and operating a new generating plant. As can be seen, energy efficiency is typically one-half to
one-third the cost of conventional power. This is not to say we do not need any new conventional power
plants, but rather that we can use energy efficiency to cost effectively reduce the number of conventional
power plants we need.

Steven Nadel, ACEEE, Testimony for July 24, 2014 Hearing
4
Figure 2. Cost per lifetime kWh of various electric resources. The high-end range of coal includes 90 percent carbon capture and
compression. PV stands for photovoltaics. IGCC stands for integrated gasification combined cycle, a technology that converts coal into a
synthesis gas and produces steam. Source: Energy efficiency portfolio data from Molina 2014; all other data from Lazard 2013.1
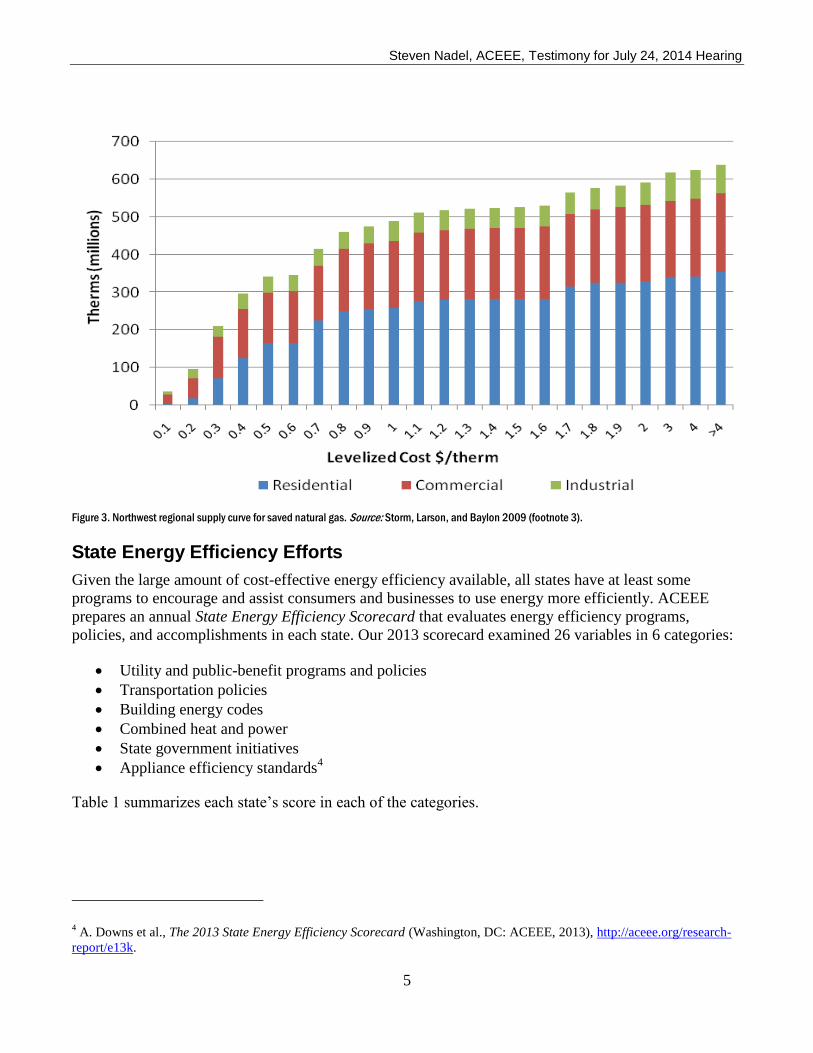
Energy efficiency also often costs less than new oil and natural gas supplies. For example, the Energy
Information Administration reports that in April 2014 (the latest available data), the national average
cost of natural gas was about $1.15 per therm for residential customers (retail cost), while the average
citygate price (wholesale) was about $0.54 per therm.2 An energy consulting firm, Ecotype, examined
the amount of cost-effective energy efficiency available in the Pacific Northwest as a function of price-
per-therm saved. The results of its analysis are shown in figure 3. Substantial efficiency savings are
available at $0.50 per therm (about $5.12 per thousand cubic feet—the current wholesale price of natural
gas) and even more at $1.00 per therm (about $10.25 per thousand cubic feet—the current retail
residential price of natural gas).3
1 Maggie Molina, The Best Value for America’s Energy Dollar: A National Review of the Cost of Utility Energy Efficiency
Programs (Washington, DC: ACEEE, 2014), http://aceee.org/research-report/u1402; Lazard, Levelized Cost of Energy Analysis Version 7.0. (New York: Lazard, 2013), http://gallery.mailchimp.com/ce17780900c3d223633ecfa59/files/Lazard_Levelized_Cost_of_Energy_v7.0.1.pdf. 2 EIA provides prices in $/1,000 cubic feet of natural gas: http://www.eia.gov/dnav/ng/ng_pri_sum_dcu_nus_m.htm. We
convert to therms at the rate of 10.25 therms per thousand cubic feet.
3 P. Storm, B. Larson, and D. Baylon, Ecotope Inc. The Power of Efficiency: Pacific Northwest Conservation Potential
Through 2020. (Seattle: Northwest Energy Coalition, 2009), http://nwenergy.adhostclient.com/wp-content/uploads/Power-of-
Efficiency-050109.pdf .
Steven Nadel, ACEEE, Testimony for July 24, 2014 Hearing
5
Figure 3. Northwest regional supply curve for saved natural gas. Source: Storm, Larson, and Baylon 2009 (footnote 3).
State Energy Efficiency Efforts
Given the large amount of cost-effective energy efficiency available, all states have at least some
programs to encourage and assist consumers and businesses to use energy more efficiently. ACEEE
prepares an annual State Energy Efficiency Scorecard that evaluates energy efficiency programs,
policies, and accomplishments in each state. Our 2013 scorecard examined 26 variables in 6 categories:
Utility and public-benefit programs and policies
Transportation policies
Building energy codes
Combined heat and power
State government initiatives
Appliance efficiency standards4
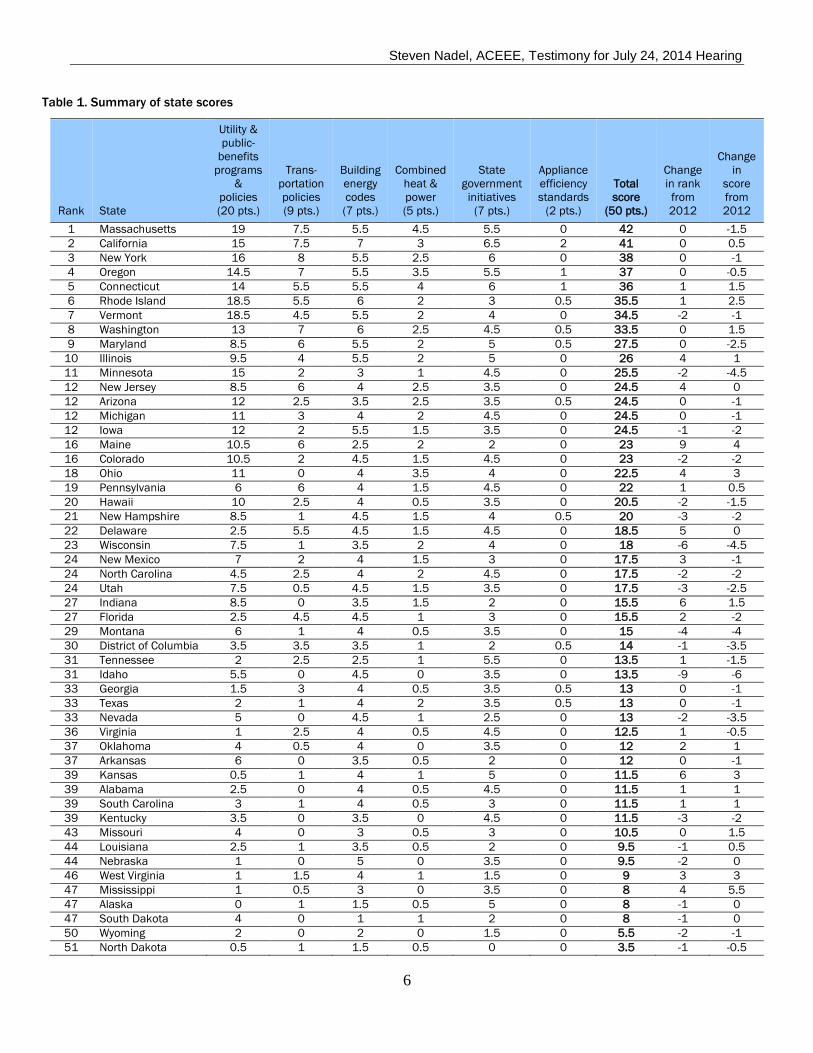
Table 1 summarizes each state’s score in each of the categories.
4 A. Downs et al., The 2013 State Energy Efficiency Scorecard (Washington, DC: ACEEE, 2013), http://aceee.org/research-
report/e13k.
Steven Nadel, ACEEE, Testimony for July 24, 2014 Hearing
6
Table 1. Summary of state scores
Rank State
Utility &
public-
benefits
programs
&
policies
(20 pts.)
Trans-
portation
policies
(9 pts.)
Building
energy
codes
(7 pts.)
Combined
heat &
power
(5 pts.)
State
government
initiatives
(7 pts.)
Appliance
efficiency
standards
(2 pts.)
Total
score
(50 pts.)
Change
in rank
from
2012
Change
in
score
from
2012
1 Massachusetts 19 7.5 5.5 4.5 5.5 0 42 0 -1.5
2 California 15 7.5 7 3 6.5 2 41 0 0.5
3 New York 16 8 5.5 2.5 6 0 38 0 -1
4 Oregon 14.5 7 5.5 3.5 5.5 1 37 0 -0.5
5 Connecticut 14 5.5 5.5 4 6 1 36 1 1.5
6 Rhode Island 18.5 5.5 6 2 3 0.5 35.5 1 2.5
7 Vermont 18.5 4.5 5.5 2 4 0 34.5 -2 -1
8 Washington 13 7 6 2.5 4.5 0.5 33.5 0 1.5
9 Maryland 8.5 6 5.5 2 5 0.5 27.5 0 -2.5
10 Illinois 9.5 4 5.5 2 5 0 26 4 1
11 Minnesota 15 2 3 1 4.5 0 25.5 -2 -4.5
12 New Jersey 8.5 6 4 2.5 3.5 0 24.5 4 0
12 Arizona 12 2.5 3.5 2.5 3.5 0.5 24.5 0 -1
12 Michigan 11 3 4 2 4.5 0 24.5 0 -1
12 Iowa 12 2 5.5 1.5 3.5 0 24.5 -1 -2
16 Maine 10.5 6 2.5 2 2 0 23 9 4
16 Colorado 10.5 2 4.5 1.5 4.5 0 23 -2 -2
18 Ohio 11 0 4 3.5 4 0 22.5 4 3
19 Pennsylvania 6 6 4 1.5 4.5 0 22 1 0.5
20 Hawaii 10 2.5 4 0.5 3.5 0 20.5 -2 -1.5
21 New Hampshire 8.5 1 4.5 1.5 4 0.5 20 -3 -2
22 Delaware 2.5 5.5 4.5 1.5 4.5 0 18.5 5 0
23 Wisconsin 7.5 1 3.5 2 4 0 18 -6 -4.5
24 New Mexico 7 2 4 1.5 3 0 17.5 3 -1
24 North Carolina 4.5 2.5 4 2 4.5 0 17.5 -2 -2
24 Utah 7.5 0.5 4.5 1.5 3.5 0 17.5 -3 -2.5
27 Indiana 8.5 0 3.5 1.5 2 0 15.5 6 1.5
27 Florida 2.5 4.5 4.5 1 3 0 15.5 2 -2
29 Montana 6 1 4 0.5 3.5 0 15 -4 -4
30 District of Columbia 3.5 3.5 3.5 1 2 0.5 14 -1 -3.5
31 Tennessee 2 2.5 2.5 1 5.5 0 13.5 1 -1.5
31 Idaho 5.5 0 4.5 0 3.5 0 13.5 -9 -6
33 Georgia 1.5 3 4 0.5 3.5 0.5 13 0 -1
33 Texas 2 1 4 2 3.5 0.5 13 0 -1
33 Nevada 5 0 4.5 1 2.5 0 13 -2 -3.5
36 Virginia 1 2.5 4 0.5 4.5 0 12.5 1 -0.5
37 Oklahoma 4 0.5 4 0 3.5 0 12 2 1
37 Arkansas 6 0 3.5 0.5 2 0 12 0 -1
39 Kansas 0.5 1 4 1 5 0 11.5 6 3
39 Alabama 2.5 0 4 0.5 4.5 0 11.5 1 1
39 South Carolina 3 1 4 0.5 3 0 11.5 1 1
39 Kentucky 3.5 0 3.5 0 4.5 0 11.5 -3 -2
43 Missouri 4 0 3 0.5 3 0 10.5 0 1.5
44 Louisiana 2.5 1 3.5 0.5 2 0 9.5 -1 0.5
44 Nebraska 1 0 5 0 3.5 0 9.5 -2 0
46 West Virginia 1 1.5 4 1 1.5 0 9 3 3
47 Mississippi 1 0.5 3 0 3.5 0 8 4 5.5
47 Alaska 0 1 1.5 0.5 5 0 8 -1 0
47 South Dakota 4 0 1 1 2 0 8 -1 0
50 Wyoming 2 0 2 0 1.5 0 5.5 -2 -1
51 North Dakota 0.5 1 1.5 0.5 0 0 3.5 -1 -0.5
Steven Nadel, ACEEE, Testimony for July 24, 2014 Hearing
7
Each year ACEEE recognizes the top performing states and also the most-improved states. The most-
improved states are particularly interesting as these are the ones that are making new commitments to
energy efficiency and that illustrate the growth of energy efficiency efforts at the state level. In the next
few paragraphs I summarize some of the efforts of these emerging states. I also include a few other
states represented by the leadership of this subcommittee.
Mississippi was the most improved state in our 2013 scorecard. After ranking dead last in 2012,
Governor Bryant made it his mission to move the state up in our rankings, using energy efficiency as a
strategy to spur economic development in the state. The Mississippi legislature passed laws setting a
mandatory energy code for commercial and state-owned buildings (the first code update since 1975).
Mississippi’s Public Service Commission unanimously voted to require large electric and gas utilities to
begin offering efficiency programs. Utilities filed plans earlier this year which were approved by the
commission, and the state continues to work on developing a comprehensive energy efficiency strategy
for utilities for 2017 and beyond. Mississippi also began to implement enhanced lead-by-example
programs for state agencies, including developing energy-savings targets for public buildings and
efficiency goals for state fleets.
Oklahoma is another state that has continued to make progress in our scorecard. Named the most
improved in 2012, it continued to work its way up the ranks in 2013. The state put in place natural gas
efficiency programs for the first time in 2011. The Oklahoma Corporation Commission has since
proposed specific savings targets for electric utilities. Led by Governor Fallin, the state government also
focused on energy efficiency in other sectors of the economy. In 2012, the state passed a bill calling for
a 20 percent reduction in the energy use of state buildings and educational institutions. It reinstated tax
credits for efficient construction and began implementing statewide building energy codes. Governor
Fallin has been quoted as saying, “As governor of Oklahoma, making government smaller, smarter, and
more efficient is among my top priorities. Energy inefficiency wastes natural resources and tax dollars
that could otherwise be used for essential services like education, transportation, and public safety.”
Arkansas is a state that has been a leader in the Southeast in recent years, and it has steadily moved up
the ranks of our scorecard. The state was one of the first in the Southeast to require utilities to implement
energy efficiency programs, beginning with “quickstart” programs in 2007. Starting in 2010, electric and
gas utilities were required to meet new, rising energy-savings targets. The state energy office has
commissioned a study to investigate savings potential beyond 2016, working under a DOE State Energy
Program 2013 Competitive Award. Arkansas has also invested its resources in strengthening
commercial building energy codes, and the state government leads by example, benchmarking energy
use in state buildings.
Illinois became one of the top ten states for energy efficiency in our 2013 scorecard. The state has an
energy efficiency resource standard that has pushed utilities to save more electricity each year. Illinois
has also found a unique way to involve state organizations in the implementation of energy efficiency
programs, partnering with utilities to deliver savings to low-income customers and government offices.
The Illinois Department of Commerce and Economic Opportunity, charged with delivering these
programs, was named an ENERGY STAR™ partner of the year in 2014. Illinois was also the first state
in the Midwest to adopt the 2012 International Energy Conservation Code (IECC), a national model
building code prepared by the International Code Council. The state also allocates a notable amount of
funding to transportation efficiency.
Steven Nadel, ACEEE, Testimony for July 24, 2014 Hearing
8
Another up-and-coming state that we are watching closely is Louisiana. 2013 was a big year for the
state, as regulators voted to require utilities to implement efficiency programs. Since then, all three of
the state’s electric investor-owned utilities have filed energy efficiency plans for the first time as
required by the new quickstart rules. Though the state has not adopted the most recent building codes, it
is working toward improving energy efficiency in new buildings, having completed a review of the 2009
IECC. We are expecting to see increasing levels of energy savings in Louisiana in the future.
Finally, I will highlight Kentucky. The state has been ranked in the upper 30s out of 51 states (including
DC) in our scorecard for the past several years. While it does have some programs to remove
disincentives for utility investments in energy efficiency—the state is supportive of lost revenue
recovery, for example—it has made little investment in wide-ranging energy efficiency programs to
date. Nonetheless, Kentucky shows some signs of progress. The state government leads by example,
setting energy requirements for public buildings, benchmarking energy use, and encouraging the use of
energy-savings performance contracts.
Additional details on these and other states are provided in our annual State Scorecard reports (see
footnote 4). We also have an online database with detailed information on policies in each of the states
(http://aceee.org/sector/state-policy).
Energy Efficiency and Economic Development
The energy efficiency efforts states make contribute to jobs and economic development in several ways.
When consumers and businesses spend money to purchase and install energy efficiency measures, they
create direct, indirect, and induced jobs. Direct jobs are the jobs involved in manufacturing and
installing the energy efficiency measures, such as producing and installing insulation. Indirect jobs are
generated in the supply chain and supporting industries that are directly impacted by an expenditure or
effort. For example, as insulation sales increase, jobs might increase at home improvement stores and
trucking firms. Induced jobs are produced as the direct and indirect workers spend their paychecks, for
example when they eat out or attend a baseball game.
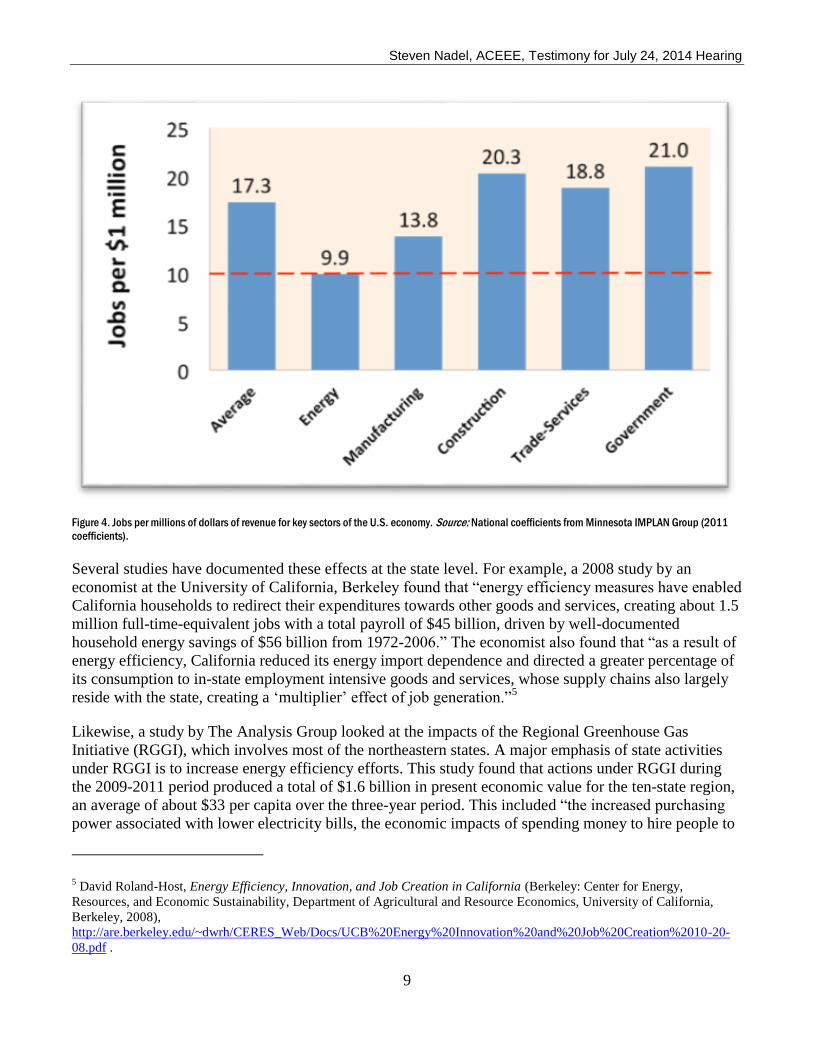
Although oil and gas development also spur direct, indirect, and induced jobs, energy efficiency
investments have two added benefits. First, as consumers and businesses reduce their energy use, they
have more income to spend on other goods and services, creating additional jobs. Second, energy
efficiency jobs tend to be in construction and services, two very labor-intensive sectors of the economy.
Spending a dollar in construction and services generally provides more jobs than spending a dollar in
other sectors. Figure 4 illustrates this disparity.
Steven Nadel, ACEEE, Testimony for July 24, 2014 Hearing
9
Figure 4. Jobs per millions of dollars of revenue for key sectors of the U.S. economy. Source: National coefficients from Minnesota IMPLAN Group (2011
coefficients).
Several studies have documented these effects at the state level. For example, a 2008 study by an
economist at the University of California, Berkeley found that “energy efficiency measures have enabled
California households to redirect their expenditures towards other goods and services, creating about 1.5
million full-time-equivalent jobs with a total payroll of $45 billion, driven by well-documented
household energy savings of $56 billion from 1972-2006.” The economist also found that “as a result of
energy efficiency, California reduced its energy import dependence and directed a greater percentage of
its consumption to in-state employment intensive goods and services, whose supply chains also largely
reside with the state, creating a ‘multiplier’ effect of job generation.”5
Likewise, a study by The Analysis Group looked at the impacts of the Regional Greenhouse Gas
Initiative (RGGI), which involves most of the northeastern states. A major emphasis of state activities
under RGGI is to increase energy efficiency efforts. This study found that actions under RGGI during
the 2009-2011 period produced a total of $1.6 billion in present economic value for the ten-state region,
an average of about $33 per capita over the three-year period. This included “the increased purchasing
power associated with lower electricity bills, the economic impacts of spending money to hire people to
5 David Roland-Host, Energy Efficiency, Innovation, and Job Creation in California (Berkeley: Center for Energy,
Resources, and Economic Sustainability, Department of Agricultural and Resource Economics, University of California,
Berkeley, 2008),
http://are.berkeley.edu/~dwrh/CERES_Web/Docs/UCB%20Energy%20Innovation%20and%20Job%20Creation%2010-20-
08.pdf .
Steven Nadel, ACEEE, Testimony for July 24, 2014 Hearing
10
perform energy audits or install solar panels, and the benefits to businesses of increased sales of energy
efficiency equipment.” These activities led to 16,000 additional jobs (job-years).
The study also found that the emissions allowances “tended to increase electricity prices by less than 1
percent in the near term, but over time—as the RGGI states invested a substantial amount of the
allowance proceeds on energy efficiency programs that led to lower electricity use—the program
resulted in lower electricity prices and lower consumer payments for electricity.” The analysis found
“reduced electricity expenditures equaling approximately $1.1 billion over the ten-year period, reflecting
an average savings of $25 for residential customers, $181 for commercial customers, and $2,493 for
industrial customers over the analysis period. Consumers of natural gas and heating oil saved another
$174 million, because some of the energy efficiency programs had the collateral effort of lowering use
of those other heating services.” A 2014 update by The Analysis Group found that energy efficiency
investments increased in 2012-2013 and estimated that this growth “will increase the overall economic
benefits of the RGGI program.”6
One final example is Ohio. A 2013 analysis published by the Ohio Manufacturers Association and
ACEEE found that implementing Ohio’s energy efficiency resource standard (a set of energy savings
targets enacted by the legislature) would save consumers nearly $5.6 billion through 2020, including
about $3.37 billion from reduced customer expenditures on electricity, $880 million from the impacts of
efficiency on wholesale energy prices, and $1.3 billion from wholesale capacity price mitigation
impacts.7 Ohio participates in the PJM wholesale energy market, and reduced energy use and peak
capacity needs reduce the price of energy and capacity as determined in this market.
Energy Efficiency Opportunities in Each of the 50 States
All 50 states can reap the economic-development and other benefits of energy efficiency achieved in
California and the Northeast. In April of 2014, ACEEE published a state-by-state analysis of the energy
efficiency savings that can be achieved in each state, the costs and benefits of such investments and
policies, and the impact of these efficiency investments on employment and gross state product.8 The
study looks at where each state is today and examines the impacts of
establishing energy efficiency savings targets for utilities;
adopting the latest national model building codes;
encouraging use of cost-effective combined heat and power systems to get increased efficiency
from generating power and heat together instead of separately; and
adopting efficiency standards on several products that are now covered by such standards in a
number of states.
6 P. Hibbard, A. Okie, and S. Tierney, EPA’s Clean Power Plan: States’ Tool for Decreasing Costs and Increasing Benefits
to Consumers (Los Angeles: The Analysis Group, 2014),
http://www.analysisgroup.com/uploadedFiles/Publishing/Articles/Analysis_Group_EPA_Clean_Power_Plan_Report.pdf.
7 M. Neubauer et al., Ohio’s Energy Efficiency Resource Standard: Impacts on the Ohio Wholesale Electricity Market and
Benefits to the State (Washington, DC: ACEEE, 2013), http://www.ohiomfg.com/legacy/communities/energy/OMA-
ACEEE_Study_Ohio_Energy_Efficiency_Standard.pdf.
8 Hayes et al., Change is in the Air: How States Can Harness Energy Efficiency to Strengthen the Economy and Reduce
Pollution (Washington, DC: ACEEE, 2014), http://www.aceee.org/sites/default/files/publications/researchreports/e1401.pdf.

Steven Nadel, ACEEE, Testimony for July 24, 2014 Hearing
11
Overall, we found that these state efforts could
reduce national electricity use by 25 percent in 2030 relative to business-as-usual projections;
provide discounted net benefits of about $48 billion by 2030;
increase GDP by about $17 billion in 2030; and
support more than 600,000 jobs nationally in 2030.9
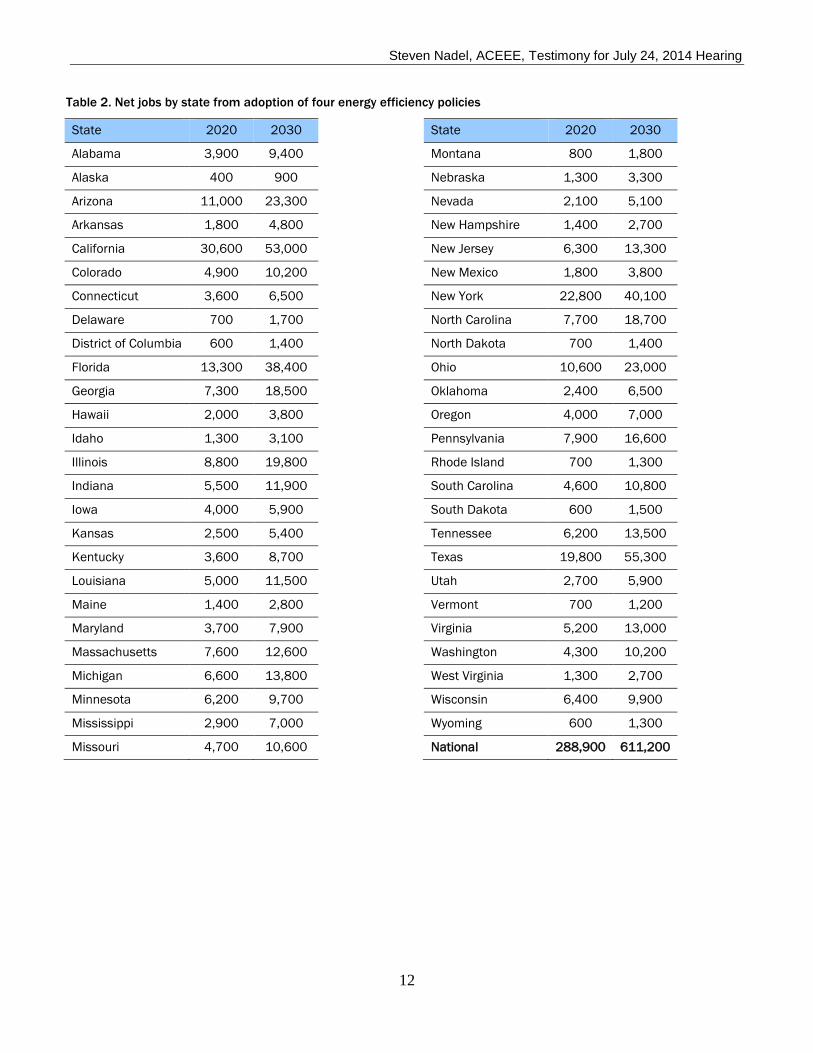
Table 2 on the next page summarizes the number of jobs created in each state by these energy efficiency
policies and investments.
Conclusion
States are stepping out and leading energy efficiency efforts in the United States as a way to save
energy, lower consumer bills, and promote economic development. Energy efficiency is a bipartisan
effort at the state level. There are major opportunities for cost-effective energy efficiency investments,
investments that can aid economic development by
creating direct jobs from manufacturing and installing energy efficiency measures;
reducing energy bills for consumers and businesses as energy use declines;
suppressing prices in wholesale energy markets as the law of supply and demand affect these
markets; and
creating indirect and induced jobs as these direct impacts ripple through the economy.
All states can benefit from these economic development impacts, with job gains of more than 600,000
possible nationally, not to mention nearly $50 billion in net economic benefits, both by 2030. More and
more states are recognizing these benefits, as illustrated by Mississippi, Oklahoma, and Arkansas. The
federal government can aid and encourage states through such actions as best-practice guides and
technical assistance.
This concludes my testimony. Thank you for the opportunity to present this information.
9 These are “net jobs,” meaning jobs spurred by the efficiency investments minus the small loss in jobs in energy industries
because energy demand would be a little lower.
Steven Nadel, ACEEE, Testimony for July 24, 2014 Hearing
12
Table 2. Net jobs by state from adoption of four energy efficiency policies
State 2020 2030
Alabama 3,900 9,400
Alaska 400 900
Arizona 11,000 23,300
Arkansas 1,800 4,800
California 30,600 53,000
Colorado 4,900 10,200
Connecticut 3,600 6,500
Delaware 700 1,700
District of Columbia 600 1,400
Florida 13,300 38,400
Georgia 7,300 18,500
Hawaii 2,000 3,800
Idaho 1,300 3,100
Illinois 8,800 19,800
Indiana 5,500 11,900
Iowa 4,000 5,900
Kansas 2,500 5,400
Kentucky 3,600 8,700
Louisiana 5,000 11,500
Maine 1,400 2,800
Maryland 3,700 7,900
Massachusetts 7,600 12,600
Michigan 6,600 13,800
Minnesota 6,200 9,700
Mississippi 2,900 7,000
Missouri 4,700 10,600
State 2020 2030
Montana 800 1,800
Nebraska 1,300 3,300
Nevada 2,100 5,100
New Hampshire 1,400 2,700
New Jersey 6,300 13,300
New Mexico 1,800 3,800
New York 22,800 40,100
North Carolina 7,700 18,700
North Dakota 700 1,400
Ohio 10,600 23,000
Oklahoma 2,400 6,500
Oregon 4,000 7,000
Pennsylvania 7,900 16,600
Rhode Island 700 1,300
South Carolina 4,600 10,800
South Dakota 600 1,500
Tennessee 6,200 13,500
Texas 19,800 55,300
Utah 2,700 5,900
Vermont 700 1,200
Virginia 5,200 13,000
Washington 4,300 10,200
West Virginia 1,300 2,700
Wisconsin 6,400 9,900
Wyoming 600 1,300
National 288,900 611,200