testing guidance for providers of enhanced … · 1 testing guidance for providers of enhanced...
TRANSCRIPT

1
TESTING GUIDANCE FOR PROVIDERS OF ENHANCED
FREQUENCY RESPONSE BALANCING SERVICE
Authors Published Version
Kevin Smethurst Sean Williams Vicci Walsh
29 March 2017 D3 - Final

2
Table of Contents
1 Introduction .................................................................................................................................... 3
1.1 Purpose ................................................................................................................................... 3
1.2 Overview- EFR (Enhanced Frequency Response).................................................................... 3
2 Enhanced Frequency Response Testing .......................................................................................... 6
2.1 Test 1- Step Tests .................................................................................................................... 6
2.2 Test 2- Frequency Sweep Tests ............................................................................................... 8
2.3 Test 3- Duration Tests ............................................................................................................. 9
2.4 Test 4- Connection to the Grid Test ...................................................................................... 10
Appendix A – Test Data and Test Signals .............................................................................................. 11
Appendix B – Format of Test Results .................................................................................................... 12

3
1 Introduction
1.1 Purpose
This document aims to provide guidance to Enhanced Frequency Response (EFR) service providers to
National Grid regarding the testing requirements for verification of this service. The tests outlined in
the document are to verify the requirements of the service description identified in contract
documents relating to the provision of an enhanced frequency response service. For any further
enquires or questions, contact your Account Manager or:
E-mail [email protected]
Telephone +44 (0) 1926 654611
1.2 Overview- EFR (Enhanced Frequency Response) EFR is the change in active power delivered as a proportional response to a change in system
frequency. EFR becomes active at a pre-defined frequency. It is available in two variants:
-Service 1 (wide-band)
-Service 2 (narrow-band)
Both services provide a change in active power in reaction to frequency deviations from 50.00Hz
greater than ±0.05Hz (service 1) or ±0.015Hz (service 2) respectively. EFR systems must be capable
of detecting a change in system frequency within 500ms, and able to provide the contracted change
in active power within 1 second. See Figure 1.1, Table 1.1 and Table 1.2
Service providers using an energy source of finite capacity such as a battery can use the envelope of
performance identified by regions A and B of Figure 1.2 to maintain an optimum storage level. If
doing so, limits on active power levels and rate of change of active power are stated in Tables 1.3
and 1.4.

4
Figure 1.1- Service Envelope
Reference Point Service 1 (Hz)
Service 2 (Hz)
A 49.5 49.5
B 49.75 49.75
C 49.95 49.985
D 50.05 50.015
E 50.25 50.25
F 50.5 50.5
Table 1.1- Envelope Frequencies
Reference Point Service 1 (%Capacity)
Service 2 (%Capacity)
t 100% 100%
u 44.44444% 48.45361%
v 9% 9%
w 0% 0%
x -9% -9%
y -44.44444% -48.45361%
z -100% -100%
Table 1.2- Envelope Outputs

5
Figure 1.2- Enhanced Frequency Envelope
Area Maximum Ramp Rate as a percentage of Operational Capacity (MW/s)
Minimum Ramp Rate as a percentage of Operational Capacity
(MW/s)
A 1% 0%
C 200% 0%
D 10% 0%
Table 1.3- Ramp rate limits in regions A, C and D
For Ramp Rate Zone B Maximum Ramp Rate as a percentage of Operational
Capacity (MW/s)
Minimum Ramp Rate as a percentage of Operational
Capacity (MW/s)
Service 1 (wide) (−
1
0.45𝑑𝑓
𝑑𝑡⁄ + 0.01) ∗ 100 (−
1
0.45𝑑𝑓
𝑑𝑡⁄ − 0.01) ∗ 100
Service 2 (narrow) (−
1
0.485𝑑𝑓
𝑑𝑡⁄ + 0.01) ∗ 100 (−
1
0.485𝑑𝑓
𝑑𝑡⁄ − 0.01) ∗ 100
Table 1.4- Ramp rate limits in region B

6
2 Enhanced Frequency Response Testing
The tests identified in this document are designed to demonstrate that the agreed service provision
can be delivered.
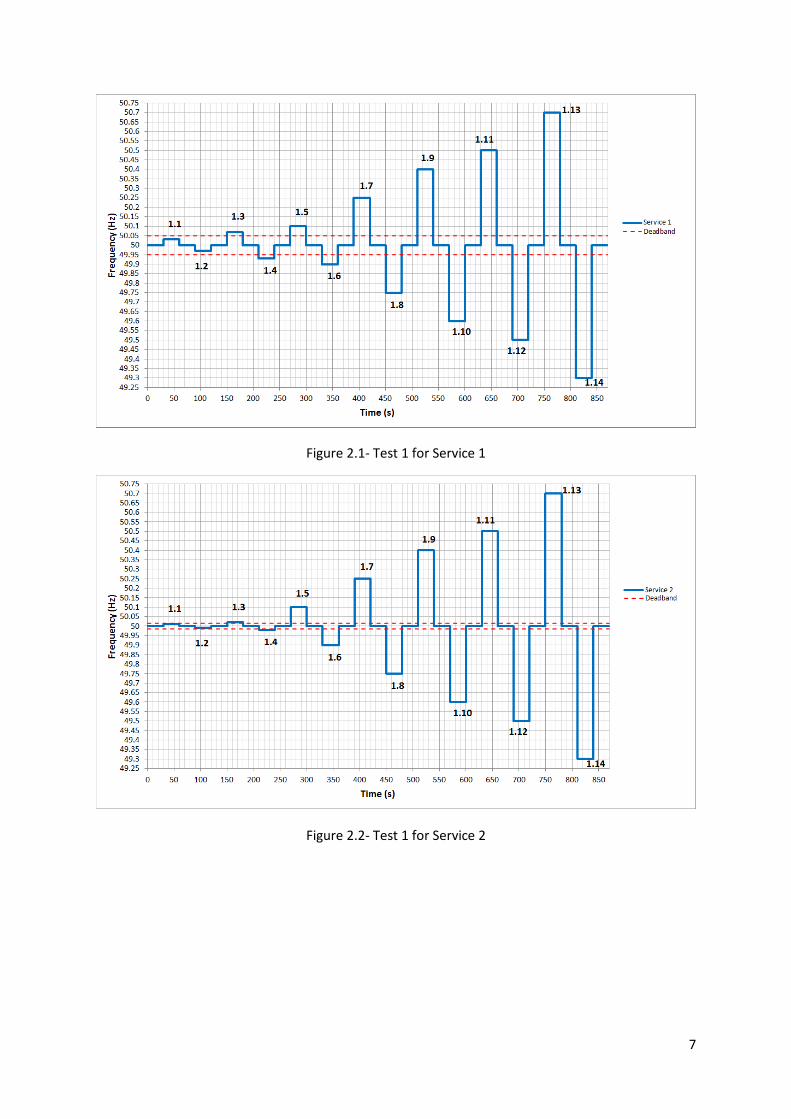
2.1 Test 1- Step Tests This test is designed to ensure the system responds when the frequency falls outside of the
deadband. The test will be used to:
Investigate the time taken for the system to provide a response
Ascertain the proportionality of the response in the collapsed regions (i.e. Reference
point A to B and E to F in Figure 1.1)
The step injections for service 1 and service 2 are shown in Figures 2.1 and 2.2 respectively. Each
step is sustained for 30 seconds to verify the stability of the response. The frequency will then be
returned to 50Hz for 30 seconds before the next injection is applied. The injections and expected
responses for each test are shown in Table 2.1.
Test Number
Frequency Step (Hz)
(Service 1)
Expected Response (Service 1)
Frequency step (Hz)
(Service 2)
Expected Response (Service 2)
1.1 50.03 -9% to +9% 50.01 -9% to +9% 1.2 49.97 -9% to +9% 49.99 -9% to +9% 1.3 50.07 -12.54% to +3.66% 50.02 -9.84% to +7.78% 1.4 49.93 -3.66% to +12.54% 49.98 -7.78% to +9.84% 1.5 50.1 -17.86% to -4.36% 50.1 -23.27% to -11.78% 1.6 49.9 +4.36% to +17.86% 49.9 +11.78% to +23.87% 1.7 50.25 -44.44% 50.25 -48.45% 1.8 49.75 44.44% 49.75 48.45% 1.9 50.4 -77.78% 50.4 -79.38%
1.10 49.6 +77.78% 49.6 79.38% 1.11 50.5 -100% 50.5 -100% 1.12 49.5 +100% 49.5 +100% 1.13 50.7 -100% 50.7 -100% 1.14 49.3 +100% 49.3 +100%
Table 2.1- Frequency Injection and Expected Response values
Pass criteria for test:
Provide an active power response within the contracted performance envelope within 1
second of a frequency step outside of the deadband.
Provide an output of no more than ±9% of operational capacity whilst in the deadband.
Sustain the response until the frequency is returned to 50Hz.
7
Figure 2.1- Test 1 for Service 1
Figure 2.2- Test 1 for Service 2

8
2.2 Test 2- Frequency Sweep Tests These tests will comprise of a frequency ramp from 49.4Hz to 50.6Hz and a ramp from 50.6Hz to
49.4Hz, in order to examine the systems entire performance envelope. Both of the ramps will be
injected over 30 seconds. The same injection will be used for both service 1 and service 2. The test
will verify:
Proportionality in the collapsed envelope regions (i.e. Reference point A to B and E to F in
Figure 1.1)
Performance within the contracted envelope
Key data points, i.e. 100% import/export at 50.5/49.5Hz and ±44.44% (Service 1)/±48.45%
(Service 2) at 50.25/49.75Hz
Pass criteria for test:
Provide an active power response within the contracted performance envelope, within 1
second of a frequency deviation outside of the deadband.
Provide an output of no more than ±9% of operational capacity whilst in the deadband.
The maximum ramp rate as a percentage of operational capacity must not exceed 1% inside
region A.
The max/min ramp rates as a percentage of operational capacity must not exceed the limits
defined in Table 1.4 inside region B.
Figure 2.3- Test 2.1
Figure 2.4- Test 2.2

9
2.3 Test 3- Duration Tests EFR requires the system to be able to respond at full output for 15 minutes should a major
frequency event occur. Operation will be tested at ±100% of capability to ensure the system is
compliant. This is carried out by a frequency step of ±0.6Hz onto the system for 15 minutes. The
frequency will then be stepped back to 50Hz. The sample rate for the Duration tests should be
reduced to 10 Hz.
Pass criteria for test:
Provide an active power response within the contracted performance envelope, within 1
second of a frequency step outside of the deadband.
Provide an output of no more than +/-9% of operational capacity whilst in the deadband
(region A).
Sustain response for 15 minutes.
The maximum ramp rate as a percentage of operational capacity must not exceed 1% inside
the deadband.
Figure 2.5- Test 4.1
Figure 2.6- Test 4.2

10
2.4 Test 4- Connection to the Grid Test This test investigates the system’s ability to respond to the system frequency. The active power
response of the system and the system frequency will be recorded for 6 hours. The sample rate
should be reduced to 10Hz for this test.
Pass criteria for test:
Provide an active power response within the contracted performance envelope, within 1
second of a frequency step outside of the deadband.
Provide an output of no more than +/-9% of operational capacity whilst in the deadband.
Observe ramp rate limits where applicable.
Figure 2.7- Test 4 (Note this is an example: the real test will follow actual Grid frequency)

11
Appendix A – Test Data and Test Signals
The test data shall be submitted in a format compatible with Microsoft Excel as shown in Appendix
B.
The limits of error and minimum sample rates for testing are shown below in Table A.1. All success
criteria are subject to the stated limit of error/accuracy threshold.
Limit of error/ Accuracy threshold Minimum Sample rate
Frequency (Hz) ±0.01 Hz 100Hz ** Apart from Test 4 which is 10Hz
Active Power (MW) ±1% contracted capacity 100Hz ** Apart from Test 4 which is 10Hz
Table A.1- Limits of error and minimum sample rates
Simulations / simulated tests are not permitted. Each test submitted must record real time data
from the plant and sites under test: The test data submitted must come from the specific site to be
contracted; substituted data will not be accepted.
Test Signals
In ALL cases, the data should record ALL required signals for at least 30 seconds BEFORE the
application of the frequency injection signal and for at least 30 seconds AFTER the completion of the
test.
For ALL services, the data for the following signals will need to be provided
a) Time b) Active Power c) System Frequency or Injected frequency as appropriate d) Any other relevant signals that may affect the success criteria. Examples of such signals
include State of Charge, Control signals and Relay Logics.

12
Appendix B – Format of Test Results
As identified in Appendix A, test data needs to be in a format compatible with Microsoft Excel. The
data should be clear and concise with no ambiguities for the recipient of the data.
Each test will need to be recorded on an individual worksheet and include:
Identification of the asset
The location
Provider’s company name
Date of the test
Associated test number
Service being provided (EFR service 1 or EFR service 2)
Example Test Results
Figure B.1- One Site Figure B.2- Multiple Sites