testing millimeter-wave mixers using converters of the … application note describes typical...
TRANSCRIPT

Subject to change - Michael Hiebel, 10.2008 – 1EZ57_0E
Products:
R&S®ZVA-Z75, R&S®ZVA-Z110, R&S®ZVA-Z325, R&S®ZVA24, R&S®ZVA40, R&S®ZVA50, R&S®ZVT20, R&S®SM100A, R&S®ZV-WR15, R&S®ZV-WR10, R&S®ZV-WR03, R&S®NRP, R&S®NRP-Z22
Testing Millimeter-Wave Mixers Using Converters of the R&S®ZVA Family
Application Note 1EZ57 The converters offered for the R&S®ZVA family extend the network analyzers' frequency range up to 325 GHz.
This Application Note describes typical measurements on millimeter-wave mixers and millimeter-wave frontends. It also discusses a signal identification method that enables spurious measurements to be performed in the
millimeter-wave range using an R&S®ZVA network analyzer in conjunction with a converter.

1EZ57_0E 2 Rohde & Schwarz
Motivation New fields of application such as vehicle distance radar or short-range communications (e.g. 10 Gb/s WLAN) are creating a steadily growing market for applications in the range 75 GHz to 110 GHz. Common to all these applications is the use of frequency-converting elements (mixers), which allow further processing to be done at a lower IF. This means an expansion of the classic tasks of millimeter-wave measurements, by including frequency-converting measure-ments. Based on several examples, this Application Note provides a detailed description of how these tasks can be solved in development and production.
Contents 1 Advantages of Converter-Based Measurements .............................................. 3 2 Mixer Types and Characteristics ....................................................................... 3 3 Selecting the Test Setup’s Components ........................................................... 4 4 Measurement Examples.................................................................................... 7
4.1 DUT and Converter with Identical IF and LO Frequencies.......................... 7 4.2 Testing a Receiver Containing a Fundamental Mixer ............................... 15 4.3 Compression Point Measurement on a Two-Port Mixer............................ 23 4.4 Spectral Measurements by Means of a Network Analyzer........................ 28
5 Appendix.......................................................................................................... 34 5.1 Source-to-Port Assignment on R&S®ZVA24 and R&S®ZVT20 ................. 34 5.2 Direct Generator/Receiver Access Option ................................................ 35
6 General Information......................................................................................... 36 6.1 Handling of Converters and Waveguides.................................................. 36 6.2 Miscellaneous............................................................................................ 36
7 Literatur ........................................................................................................... 37 8 Ordering information........................................................................................ 38
8.1 Equipment used in measurement example in Section 4.1 ........................ 38 8.2 Equipment used in measurement example in Section 4.2 ........................ 39 8.3 Equipment used in measurement example in Section 4.3 ........................ 39 8.4 Equipment used in measurement example in Section 4.4 ........................ 40

1EZ57_0E 3 Rohde & Schwarz
1 Advantages of Converter-Based Measurements The test setups described in this Application Note include converters of the Rohde & Schwarz R&S®ZVA family. These converters and the associated R&S®ZVA network analyzers offer the following advantages:
The converters feature an integrated attenuator (power adjusting screw) by which the output power of the waveguide test port can be controlled manually. The signal powers required in mixer measurements can thus be set as necessary.
Using a suitable waveguide power meter, you can perform power calibration of the analyzer's reference and measurement receivers. The power levels applied to the device under test (DUT) will then be correctly measured. This is necessary to determine the conversion loss of a mixer, for example.
The LO and RF frequency relationships on the converters have been selected to match those of typical harmonics mixers. The LO and the RF frequency can be accessed and modified on the R&S®ZVA network analyzer and (as far as technically feasible1)) adapted to the frequency relationship on the DUT. In certain cases, the same LO frequency can be selected for the DUT and the converter, thus eliminating the need for an external generator.
Depending on how many waveguide test ports are required, up to four converters (R&S®ZVA with external generator) or up to six converters (R&S®ZVT20 with external generator) can be included in a single test setup.
The R&S®ZVT20 six-port network analyzer includes three stimulus sources whose frequencies can be set independently of one another. This makes the R&S®ZVT20 ideal for measurements involving two different LO frequencies (e.g. one for the converters, the other one for the DUT). It eliminates the need for an external generator, which would be required for a similar measurement with an R&S®ZVA, and thus as a rule significantly boosts measurement speed.
The extensive trace mathematics offered by the network analyzers used in the following measurements enables, among other things, automatic signal identification. This method is well known from spectrum analysis [10] because spectrum analyzers have to rely on external mixers in the millimeter-wave range, too2). Since combining external mixers with preselection is usually too costly, automatic signal identification is therefore the preferred alternative. In this Application Note, this method is applied to network analysis (Chapter 4.4). This allows, to some extent, spectral measurements to be performed.
2 Mixer Types and Characteristics Various types of mixers are available for various types of millimeter-wave applications. The measurement examples discussed in this Application Note cope with this diversity. Furthermore, test setups designed for a specific type of mixer (DUT) can usually be adapted for use with other types of mixers.
1) Limitations may result, for example, from the converters' IF frequency range (10 MHz to 400 MHz). Moreover, satisfactory results
cannot be expected for every IF frequency in this range. For the higher-frequency converters such as the R&S®ZVA-Z325, LO frequency generation on the R&S®ZVA has been optimized for the preferred IF of 279 MHz. This optimization may become ineffective if a different IF is used.
2) Without external mixers, commercial spectrum analyzers are capable of unambiguous frequency reception in a range up to 67 GHz (R&S®FSU67) (as of August 2008).

1EZ57_0E 4 Rohde & Schwarz
Harmonics mixer versus fundamental mixer
The devices under test to be examined here are used to convert frequencies in the millimeter-wave range (fRF, up to several hundred GHz, transmitted in waveguides) to an intermediate frequency (fIF, typically several MHz up to several hundred MHz, transmitted in coaxial lines). The frequency relationships prevailing on mixers can be expressed by the formulas below. In this Application Note, n = 1 is assumed for the sake of simplicity.
|| LORFIF fmfnf ⋅−⋅= (1)
LORFIF fmfnf ⋅+⋅= (2)
Harmonics mixers are often the preferred choice in millimeter-wave applications. A characteristic feature of these mixers is the use of an LO factor of m > 1. Harmonics mixers, therefore, require a local oscillator frequency (fLO) lower than comparable fundamental mixers. The LO signal can thus in most cases be fed via a coaxial port. A lower LO frequency also means reduced effort in frequency generation. Fundamental mixers, by contrast, use an LO factor of m = 1. This means that millimeter-wave frequencies occur both on the RF port and the LO port. Fundamental mixers therefore usually include two waveguide ports of the same size, e.g. WR10.
RF
IF+LO
RF LO
IF
RF LO
IF
Harmonics mixer
Fundamental mixer
Two-port mixer
Fig. 2.1: Mechanical drawings of fundamental mixer, harmonics mixer and two-port mixer
Two-port mixer versus three-port mixer
If the LO port and the IF port can be designed in the same way (e.g. coaxial or microstrip line), they can be combined into a single port. The mixer then appears to have only two ports. Two-port mixers of this kind are preferably used in antenna test chambers or on antenna positioners as they reduce the wiring effort. Test setups designed for three-port mixers can also be used for two-port mixers if the LO and the IF signal on the combined LO-IF port of the DUT are separated from each other in a suitable manner. For more details, refer to the measurement example in Section 4.3.
Fundamental issues regarding, for example, the design, system configuration and circuit design of mixers would go beyond the scope of this Application Note and will therefore not be discussed here. More detailed information will be found in the technical literature, e.g. [1].
3 Selecting the Test Setup’s Components The figure below is a transparent CAD representation of an R&S®ZVA-Z110 converter. It has the following main function blocks:

1EZ57_0E 5 Rohde & Schwarz
1 Source multiplier, which produces the generator signal by way of frequency multiplication
2 Waveguide attenuator with power adjusting screw
3 Directional coupler to separate incident and reflected wave
Two harmonics mixers for converting the measurement and the reference channel to a fixed IF
Fig. 3.1 Transparent CAD representation and block diagram of an R&S®ZVA-Z110 converter with test port adapter removed
Each converter is assigned to a test port of the network analyzer. This test port supplies the RF_IN signal to the converter. The REF_IN and MEAS_IN direct receiver inputs1) of the test port accept the REF_OUT and MEAS_OUT IF signals from the converter. The converter thus replaces the internal test set of the network analyzer at this test port, and the converter's waveguide test port acts as the test port of the analyzer. Measured quantities are therefore referenced to the waveguide test port. In addition to the RF_IN signal, an LO_IN signal has to be supplied to each converter to drive its internal harmonics mixers (see Fig. 3.1 4). The LO_IN signal can be delivered by an R&S®ZVA (e.g. port 3 in Section 4.1) or by an external R&S®SMF100A generator (see Section 4.2).
Suitable network analyzers and generators
In the measurement examples presented in this Application Note, an R&S®ZVA or R&S®ZVT network analyzer with four or six test ports is used. The analyzer must
1) For more information about the direct receiver inputs, refer to Chapter 5, Fig. 5.3: Block diagram of a test port
WR 10

1EZ57_0E 6 Rohde & Schwarz
have an upper frequency limit of at least 20 GHz (e.g. R&S®ZVA24, R&S®ZVA40, R&S®ZVA50, etc., or R&S®ZVT20) so that it can be operated together with the converters. Another criterion to be taken into consideration is the expected IF from the DUT. For a DUT with an IF of 38 GHz, for example, an R&S®ZVA40 would be the appropriate choice. The network analyzer should further include the following options:
R&S®ZVA-B16/R&S®ZVT-B16 direct generator/receiver access
R&S®ZVA-K8 converter control software
Further options may be required to control an external generator or a power meter. In the measurements described in this Application Note, the R&S®SMF100A is exclusively recommended as an external generator.
Number of LO generators
In the measurement example described in Section 4.1, the DUT and the converter have identical IF and LO frequencies. A four-port network analyzer is sufficient in this case, because only two signals with independently selectable frequencies are required. In the other examples, the DUT and the converter(s) have different LO frequencies. Since one stimulus generator of the R&S®ZVA is required for supplying the RF signal, the other generator must either switch between the two LO frequencies1) (LO_DUT for the DUT and LO_IN for the converter) or an additional external generator or a six-port R&S®ZVT20 network analyzer has to be used.
Number of converters
In most cases, one converter is sufficient, as the DUT contains only one waveguide port (RF). The converter has to be selected so that its frequency range matches that of the DUT port. In the second measurement example (Section 4.2), a receiver module that contains a fundamental mixer with two waveguide ports is examined. A similar situation is obtained for a harmonics mixer, if the mixer's (DUT's) LO frequency is in a range in which waveguides are used, and the DUT consequently contains a waveguide port also for the LO signal. In the latter case, different types of converters will be used for the RF and the LO signal, for example the R&S®ZVA-Z325 for the RF and the R&S®ZVA-Z110 for the LO signal for a harmonics mixer that uses the third harmonic of the LO frequency (m = 3).
Feeding the DUT's IF signal to the network analyzer
The DUT's IF signal can be fed to the network analyzer in two ways:
By feeding the DUT's IF output to a test port on the R&S®ZVA/R&S®ZVT
By feeding the DUT's IF output to a direct receiver input on the R&S®ZVA/R&S®ZVT
The first alternative offers the advantage that reflection measurements can be performed also on the IF port of the DUT. The second alternative provides increased sensitivity, since the directional coupler is bypassed, thus avoiding its coupling loss (cf. Chapter 5, Fig. 5.3). To prevent overdriving of the receiver, the IF level should not exceed –15 dBm.
1) In this case e.g. port 3 supplies the LO_IN signal and port 4 supplies the LO_DUT signal. But as a rule measurement of the
DUT’s LO and RF matching is then not possible because for this measurements both LO signals with different frequencies must be active a the same time, which is not possible (see Chapter 5 Fig. 5.1)

1EZ57_0E 7 Rohde & Schwarz
4 Measurement Examples When configuring a millimeter-wave test setup, some basic rules have to be observed in order to prevent damage to the test setup and to provide optimum reproducibility. For more detailed information, refer to Section 6.1.
4.1 DUT and Converter with Identical IF and LO Frequencies Measurement task:
In this measurement, an R&S®ZVA-Z325 converter is used to test a harmonics mixer in the RF range 220 GHz to 260 GHz. To simplify the measurement, the DUT and the converter will have the same IF frequency (279 MHz) and the same LO factor (n = 16).
Test setup:
To make the subsequent operating steps easier to understand, the final test setup is presented in Figs 4.1 to 4.3. Test port 1 of the R&S®ZVA supplies the RF_IN signal to the converter and, via its direct receiver inputs, accepts the MEAS_OUT and REF_OUT signals from the converter. Test port 3 of the network analyzer supplies the LO_IN signal to the converter. Test port 4 of the R&S®ZVA delivers the LO_DUT local oscillator signal to the DUT. The direct receiver input (MEAS_IN) of test port 2 accepts the IF_DUT intermediate frequency generated by the DUT. Type R&S®ZV-Z193 cables are used for all LO_IN, LO_DUT and RF_IN connections.
Fig. 4.1: Block diagram of test setup
The PM4 submillimeter power meter from Erickson Instruments, LLC is used for power measurements in the millimeter-wave range.1) The analog 0 V to 10 V DC voltage output of the power meter is connected to the DC_MEAS −10 V…+10 V DC voltage input of the R&S®ZVA.
1) The PM4 predecessor models – PM2 and PM3 – can also be used, for example. For manufacturer's website, see Ordering
Information (Chapter 8).
118
R&S®ZVA-Z325
LO_IN
RF_IN
REF MEAS
DUT
LO_DUTIF_DUT
PM4
NRP-Z22
WR 03 WR 03
∫
∫
RF_DUT

1EZ57_0E 8 Rohde & Schwarz
Fig. 4.2: Test setup including a four-port R&S®ZVA24 vector network analyzer, an R&S®ZVA-Z325 converter, an R&S®NRP power meter with R&S®NRP-Z22 sensor,
and an Erickson PM4 submillimeter power meter
This is done using a BNC-to-4-mm-banana-jack adapter and an R&S®ZV-Z71 cable (cf. Fig. 4.3). The “−" plug of the R&S®ZV-Z71 is connected to the outer conductor (shield) and the "+" plug to the inner conductor of the BNC connector. The GND plug of the R&S®ZV-Z71 is not used.
Fig. 4.3: Cabling on the instruments' rear panels
Step 1: Correction value for wave b2 (from IF port of DUT)
The conversion loss of a mixer results from the RF power applied to its input (wave a1 in this case) and the power present at the mixer's IF output (wave b2 in this case). The setup is to be prepared for measuring these powers by means of steps 1 and 4.
GND
+ -

1EZ57_0E 9 Rohde & Schwarz
During this first step the converter mode is not active on the R&S®ZVA24. Select the CW mode with f = 279 MHz on the network analyzer and set the output power to −15 dBm1). Connect the diode sensor of a suitable power meter to test port 1 (e.g. R&S®NRP power meter base unit with R&S®NRP-Z22 sensor2)). Measure the power at test port 1 (−14.7 dBm in this case). Remove the power sensor and connect test port 1 to the MEAS_IN input of test port 2 by means of the cable that will later be used for feeding the IF signal from the DUT. Select b2 Source Port 1 as a measured quantity and display the result determined by the R&S®ZVA using a marker, for example (+10.9 dBm in this case). The correction value is obtained by forming the difference between the two measured values (here: −14.7 dBm – 10.9 dBm = −25.6 dB). This value will be required for the corrected display of the DUT IF power at a later stage.
Alternative approach:
The above method takes the signal from MEAS_IN direct receiver input of test port 2 rather than to use the test ports ruggedized input because the DUT has an IF power lower than −15 dBm. Using the MEAS_IN results in a lower noise figure of the overall system since the directional coupler is bypassed and thus its coupling loss is avoided (see Chapter 5, Fig. 5.3). By taking the signal from test port 2 instead, level accuracy of better than 1 dB can still be expected without determining a correction value for wave b2 [5].
Step 2: Configuring the converter
In the System Configuration dialog, select the converter type (ZVA-Z325) and the cabling scheme (internal RF, internal LO (RF intern, LO intern)). Activate the setting with Apply and terminate the dialog with Close.
Fig. 4.4: Configuring the R&S®ZVA-Z325 converter
1) For the higher-frequency R&S®ZVA models, we recommend that you set the output power to −5 dBm and use a 10 dB attenuator or,
if installed, the generator step attenuator set to 10 dB to perform the measurements in step 1. 2) Using the R&S®NRP-Z4 USB adapter, you can connect the power sensor directly to the R&S®ZVA without requiring a power meter
base unit.

1EZ57_0E 10 Rohde & Schwarz
Step 3: Adjusting the LO signal power as required for the DUT
The configuration made in step 2 is actually intended for two converters. If two converters were used, test port 4 of the R&S®ZVA would supply the LO signal to the second converter, whereas in this measurement configuration, which employs only one converter, test port 4 delivers the LO signal to the DUT. The DUT has been selected so that its frequency relationships match those of the two converters. Test port 4, therefore, is already correctly configured to deliver an LO signal with the appropriate frequency to the DUT. The DUT, however, requires a higher LO power than the converter. The preconfigured LO power, therefore has to be adjusted for test port 4. Under Mode | Port Config, the port configuration table can be accessed and edited (see Fig. 4.5). The table contains entries for the stimulus frequency, stimulus power and the measured receive frequency for all test ports. The screenshot below demonstrates how to adjust the stimulus power for test port 4 to +10 dBm.
Fig. 4.5: Adjusting the power for test port 4 (signal LO DUT)
Step 4: Calibrating the RF stimulus power in the range 220 GHz to 260 GHz
It is mandatory to calibrate the power display for wave a1 by means of a power meter. The Erickson PM4 submillimeter power meter is used here. Its sensor operates in a range from approx. 75 GHz to at least 2 THz [2]. It has a WR10 waveguide port and is connected to the converter's WR03 waveguide port using a suitable adapter. The sensor and the adapter are well matched in the frequency range of interest. No unwanted resonances will therefore occur in the WR10 waveguide section of the sensor, although it is operated at a higher mode frequency (220 GHz to 260 GHz). It is therefore sufficient in this case to consider

1EZ57_0E 11 Rohde & Schwarz
a nearly frequency-independent deviation of 1.2 dB (0.9 dB for the adapter and 0.3 dB for the sensor1)) in the calculation of results. To read in the voltage measured by the power meter at the DC_MEAS −10 V…+10 V DC input of the R&S®ZVA, select the setting Meas | More | More | DC Inputs | DC Meas −10 V…+10 V for trace 1 (Trc1). The voltage delivered by the PM4 is proportional to its power indication in mW. The upper limit of 10 V corresponds to the full scale power selected on the PM4. For the mixer measurement to be performed here, a nominal RF power of approx. −18 dBm is to be used (power adjusting screw on the converter set to >2 mm). Consequently, the lowest scale (0 to 0.2 mW) is selected on the PM4. The DC voltage output from the power meter is then converted to a dBm value that corresponds to the measured power. This is done by means of the trace mathematics. First, create another trace (Trc2) using Trace Select | Add Trace. Select a1 Src Port 1 as the measured quantity for this trace. The correction function (CAL FACTOR dB) available on the PM4 power meter has no effect on the analog DC voltage output; the correction factor of 1.2 dB therefore has to be included in the trace mathematics shown below. The trace mathematics will become active on pressing Math = User Def.
Fig. 4.6: Trace mathematics for the corrected display in dBm of the power measured by PM4
It is advisable to check a value pair (voltage measured by PM4 power meter and dBm value on Trc2 indicated on the R&S®ZVA) by way of calculation. For this purpose, select the CW mode on the R&S®ZVA (see Fig. 4.6), and set the correction factor of 1.2 dB on the PM4 power meter. From the 20 µW displayed on the power meter, calculate the result in dBm to be displayed on the R&S®ZVA by means of 10⋅log(20µW/1mW) which yields to an expected result of −17 dBm, see marker 1 on Trc2 (red) in Fig. 4.6.
1) Source: The correction value for the PM4 power meter is derived from the PM4 operating manual [2], Fig. 1.

1EZ57_0E 12 Rohde & Schwarz
To proceed with the measurements, a frequency sweep from 220 GHz to 260 GHz with 101 test points and an IF bandwidth of 100 Hz has to be selected on the R&S®ZVA network analyzer.
The PM4 relies on a thermal measurement principle and thus requires a certain measurement time. The R&S®ZVA sweep speed, therefore, has to be reduced accordingly. A point delay of 10 s has proven useful in practice. The PM4 power sensor offers a very wide bandwidth that covers not only the desired frequency band but also the IR spectrum that is radiated due to the self-heating of the converter, among other things. To eliminate this spectrum, switch off the RF signal for the converter on the R&S®ZVA by selecting Power BW AVG | RF Off.The power sensor remains connected during this operation. Then allow some time for thermal stabilization of the power sensor. Up to 15 minutes is recommended in the manufacturer's operating manual [2]. In addition, 60 minutes warmup time has to be observed for the converter [3]. When the warmup period has elapsed, set the power meter to zero using the ZERO button. Switch the RF signal for the converter on again on the R&S®ZVA. The power meter now indicates the RF power present at the converter's waveguide test port with the IR spectrum compensated. Wait until a complete sweep has been performed. Then store trace 2 (Trc2, which displays the RF power in dBm) to the R&S®ZVA memory as Mem3[Trc2] using Trc Funct | More Mem | Data to Mem… | Data & Trace Funct to Mem. Select Sweep | Sweep Time | Auto to reset the original sweep speed of the R&S®ZVA. Next, create a further trace (Trc4) on the R&S®ZVA and assign the wave quantity a1 to this trace. Save trace Trc4 as Mem5[Trc4] with Data to Mem.Then define the trace mathematics Trc4*Mem3[Trc2]/Mem5[Trc4] for Trc4 and activate it with Math = User Def. The wave quantity a1 will now be displayed as Trc4 with corrected power.
Step 5: Calculating the conversion loss from the result traces
The traces Trc1, Mem3[Trc2] and Mem5[Trc4] are now set to invisible as they are no longer needed. Connect the DUT. Create trace Trc5 with the measured quantity b2. The correction value determined in step 1 (−25.6 dB in this example) has to be taken into account by means of a suitable trace mathematics, in this case by the formula Trc5*10^(-25.6/20). Activate the trace mathematics with Math = User Def. The conversion loss is to be determined from the two traces Trc4 (RF power) and Trc5 (IF power). For this purpose, create another trace (Trc6) with the measured quantity b2 Src Port 1 assigned to it. The trace mathematics (see Fig. 4.7) applied in the preceding steps must again be used in calculating the conversion loss.
Fig. 4.7: Trace mathematics for calculating the conversion loss
IF level (corrected)
cf. step 5
RF level (corrected)
cf. step 4

1EZ57_0E 13 Rohde & Schwarz
Activate the trace mathematics for trace Trc6 with Math = User Def. This will produce the result shown in Fig. 4.9.
Step 6: System error correction at waveguide test port
In step 7, the matching at the RF port of the mixer is to be determined. As a precondition, one-port system error correction has to be performed first on the converter. This is done using the OSM technique. The R&S®ZV-WR03 waveguide calibration kit offers the following standards:
Fig. 4.8: Calibration standards of the R&S®ZV-WR03 waveguide calibration kit with sliding match
Mixers usually exhibit a relatively low return loss. It is therefore sufficient to use a fixed match for calibration; a sliding match is not required. In contrast to coaxial connector systems, an Open standard cannot be implemented in configurations based on waveguide technology because of the radiation losses occurring at an open ended waveguide. To obtain three one-port standards with different reflection coefficients nevertheless, an Offset Short is used. An Offset Short is made up of a Short and a small waveguide section referred to as a Shim. The Shim is dimensioned so that it causes a λ/4 transformation of the Short at the center frequency of the waveguide1). The WR03 waveguide band used here requires an offset of 0.371 mm. A Shim of this size would be too thin to withstand the mechanical stress in everyday use. Since a length difference of λ/4 between the Short and the Offset Short is sufficient, two Shims, Shim #1 with 1.000 mm and Shim #2 with 1.371 mm are used1). The combination of Shim #1 + Short is used instead of the Short standard and Shim #1 + Short is used as the Offset Short. Both Shims #1 and #2 provide the required mechanical stability.
Select Cal | Start Cal | One Port P1 | Full to start the calibration. The R&S®ZV-WR03 waveguide calibration kit available for the converter has been automatically selected before. Mount the Short (Shim #1, 1.000 mm + Short), Offset Short (Shim #2, 1.371 mm + Short) and Fixed Match standards on the converter one after the other and perform a calibration sweep for each of these standards.
1) The offset values stated in this paragraph are included in the model of the calibration standard e.g. used by the network analyzer.
Shim #1
Shim #2
Short
Sliding Match
Fixed Match

1EZ57_0E 14 Rohde & Schwarz
Step 7: Measuring the RF matching
When calibration is completed, reconnect the DUT. Create trace Trc7 with the measured quantity S11. The final result shown in Fig. 4.9 will be obtained.
Note:
If you have skipped steps 1 to 5 since you are only interested in the RF matching of the mixer, please note that the mixer has to be supplied with its specified LO signal during the measurement to make sure that the measurement is performed under realistic conditions. If the IF port of the mixer is not connected to the network analyzer, it should be terminated with 50 Ω.
Final result obtained for measurement example 4.1
Fig. 4.9: Conversion loss of DUT (Trc6) and return loss at RF port of DUT (Trc7) in the frequency range 220 GHz to 260 GHz
Overview of traces generated in Section 4.1 Trace (see
Fig. 4.9)
Description Status or color coding
Trc1 Display of voltage (measured by PM4) in 0 to 10 V on R&S®ZVA invisible
Trc2 Display of voltage (measured by PM4) in dBm on R&S®ZVA invisible
Mem3[Trc2] Reference measurement in dBm of wave a1 with PM4 invisible
Trc4 Wave a1 (RF_DUT) in dBm, level-corrected violet
Mem5[Trc4] Reference measurement of wave a1 with reference receiver invisible
Trc5 Wave b2 (IF_DUT) in dBm, measurement channel b2, level-corrected black
Trc6 Conversion loss in dB, calculated in accordance with Fig. 4.7 pink
Trc7 Return loss in dB at RF port of mixer brown

1EZ57_0E 15 Rohde & Schwarz
4.2 Testing a Receiver Containing a Fundamental Mixer Measurement task:
In this measurement example, the receiver module IAF RX94IQM of the Fraunhofer Institute for Applied Solid-State Physics (IAF), Germany, is to be tested. The receiver module includes a fundamental mixer and integrated RF and LO amplifiers, which produce a conversion gain [9]. The module is designed for operation in the frequency range 75 GHz to 100 GHz. Due to the fundamental mixing concept, the mixer's RF and LO are both implemented as WR10 waveguide ports.
Test setup:
To make the subsequent operating steps easier to understand, the test setup will be described first (Figs. 4.10 to 4.12). Two R&S®ZVA-Z110 converters are required to supply the RF_DUT and LO_DUT signals to the DUT. The two signals differ with respect to their frequencies. The RF_IN connectors on the converters, therefore, have to be assigned to different stimulus sources of the R&S®ZVA (cf. Chapter 5, Fig. 5.1). Test ports 1 and 4 of the R&S®ZVA24 are used for generating the RF_DUT and LO_DUT signals via the converters (see Fig. 4.10). The direct receiver inputs (REF_IN and MEAS_IN) of these ports accept the REF_OUT and MEAS_OUT signals from the converters. To generate these signals, the converters require an LO signal, which is delivered by an external R&S®SMF100A generator (LO_IN) and distributed to converters 1 and 2 by means of a power splitter.
Fig. 4.10: Block diagram of test setup
LO_IN
16
R&S®ZVA-Z110 RF_IN
REF MEAS
DUT
IF_DUT
LO_DUT
W8486A NRP-Z22
RF_DUT
R&S®ZVA-Z110
16
MEAS REF
RF_IN
LO_IN
LO_IN
IF DUT RF DUT LO DUT
LO_IN
WR 10 WR 10
WR 10
Power splitter
Type R&S®ZV-Z193 cables are used for all LO and RF_IN connections
NTG-20
5 V DCConverter 1 Converter 2
∫
∫

1EZ57_0E 16 Rohde & Schwarz
Fig. 4.11: Test setup including a four-port R&S®ZVA24 network analyzer, two R&S®ZVA-Z110 converters, an R&S®NRP power meter with R&S®NRP-Z22 sensor, an R&S®SMF100A signal generator,
an R&S®NTG-20 DC power supply, and an Agilent E4419B power meter with W8486A WR10 sensor and DUT: receiver module IAF RX94IQM (Fraunhofer Institute for Applied Solid-State Physics)
Fig. 4.12: Cabling on the instruments' rear panels
GPIB bus connected to
R&S®ZVA via ZVAB-B44
USB-to-IEC/IEEE adapter
10 MHz reference frequency
R&S®SMF100A REF_OUT
taken to
R&S®ZVA24 10 MHz_REF

1EZ57_0E 17 Rohde & Schwarz
To track the external generator’s frequency along with the network analyzer during a sweep, a remote-control connection between the generator and the analyzer is required (see Fig. 4.12). This is established by means of the R&S®ZVAB-B44 USB-to-IEC/IEEE adapter option and the R&S®SMF100A-B83 removable GPIB option1). For frequency synchronization, the REF OUT signal from the R&S®SMF100A is taken to the 10 MHz REF input on the R&S®ZVA24.
The Agilent E4419B2) power meter is also connected to the GPIB bus. Different GPIB addresses have to be selected for the power meter and the generator (13 and 28 in this case). The Agilent/HP W8486A waveguide power sensor used here does not contain an EEPROM for its calibration factors. The frequency-dependent calibration factors (see table printed on sensor and also included in calibration documents) have to be entered at least once on the E4419B power meter. For details refer to the User's Guide [6] and [7].
Set up the R&S®NTG-20 DC power supply to deliver 5 V DC. Current limiting should be set to approx. 200 mA.
Allow for the warmup times for all instruments and units included in the setup. The remaining cabling should not be performed until configuration of the test setup has been completed.
Step 1: Correction value for wave b2 (from IF port of DUT)
Other than in the measurement example discussed in 4.1, the IF signal is fed to the R&S®ZVA test port 2 (instead of its MEAS_IN input) because of the power to be expected (up to −12 dBm). To determine the correction value, follow the instructions given in step 1 of Section 4.1, except that a CW frequency of 400 MHz has to be set in this case. In the present measurement example, a level deviation of 0.7 dB is obtained for test port 2.
Step 2: Configuring the generator and the power meter
To be able to address the Agilent E4419B power meter via the R&S®ZVA, it has to be configured as follows under System | System Config | External Power Meters (see Fig. 4.13):
Deactivate Auto Config NRP-Zxx if activated.
Click Refresh Tables.
Select the Agilent E4419B power meter and add it to the list of configured power meters by clicking Add v.
Proceed accordingly to configure the R&S®SMF100A generator under System | System Config | External Generators. If the List Mode is to be used to perform sweeps (see 1)), it has to be activated in the Modify… dialog.
1) Instead of the USB/GPIB-to-IEC/IEEE connection, a LAN connection can be installed on the R&S®SMF100A generator.
Controlling an external generator takes more time than controlling an internal generator of the network analyzer. To accelerate generator tracking during frequency sweeps, the TRIGGER and BLANK handshake signals of the generator can be connected to the R&S®ZVA USER CONTROL port in addition to an existing remote-control connection. This makes it possible to use the List Mode to perform sweeps. In this mode, the network analyzer transfers all frequency points to the generator via the remote-control connection (GPIB or LAN) prior to the start of a sweep. During the frequency sweep (or repeated sweeps), the handshake signals are used exclusively to advance the sweep from one frequency point to the next.
2) Alternatively, the E4419A single-channel version of the power meter can be used. A power meter is also available from Anritsu (ML2438A), which can be adapted to the Agilent W8486A waveguide power sensor by means of the MA2497A accessory [8].

1EZ57_0E 18 Rohde & Schwarz
Fig. 4.13: Configuring the Agilent E4419 power meter
Step 3: Configuring the converters
To configure the converters, open the System Config | Frequency Converter dialog (see Section 4.1, Fig. 4.4). Other than in the measurement example discussed in Section 4.1, the ZVA-Z110 converter type and the RF intern, LO extern (internal RF, external LO) cabling scheme have to be selected.
The optimal LO input power (LO_IN signal) for an R&S®ZVA-Z110 converter is +7 dBm. Since test setups including only one converter – and therefore no power splitter – are also possible, the output power on the external generator is automatically set to +7 dBm in the configuration made at the beginning of step 3. In a two-converter configuration, however, the transmission loss of the LO distribution element (a power splitter with 6 dB transmission loss in this example) has to be considered. This means that in this measurement example the generator output power has to be increased to 7 dBm + 6 dB = 13 dBm. This is done under Mode | Port Config on the R&S®ZVA. This dialog corresponds to that shown in Fig. 4.5 in Section 4.1 except that, among other things, an additional line (Gen 1) is provided for the R&S®SMF100A. Increase the Gen 1 generator output power to 13 dBm. A measurement bandwidth of 100 Hz and a measurement delay (Meas Delay) of 10 ms are recommended for the measurements. Under Sweep | Sweep Type, deactivate the CW mode (which has been selected in step 1), and choose a 75 GHz to 100 GHz frequency sweep instead. Now, the required connections between the converters, the network analyzer and the generator can be made in accordance with Fig. 4.10.
Step 4: Adjusting the configuration as required for the DUT
To perform the measurements in this example, further modifications are required in the port configuration table under (Mode | Port Config).
In S-parameter measurements, one converter at a time is usually operated as an active test port. The measurements in this example, however, require that the LO_DUT and RF_DUT signals are present at the DUT simultaneously. This is achieved by selecting the Gen checkmark for port 1 and port 4 (for Gen 1, the Gen checkmark has been selected automatically during converter configuration of step 3).

1EZ57_0E 19 Rohde & Schwarz
The DUT is designed for an IF of 400 MHz. The LO frequency relationship is assumed to be f LO < f RF. With m = 1 the frequency of the LO_DUT signal can be derived from formula 1 (see Chapter 2) as f LO = f RF – 400 MHz. This means that the frequency of converter 1 (LO_DUT) has to be 400 MHz lower than that of converter 2 (RF_DUT). The converters multiply the RF_IN frequency delivered by the analyzer by a factor of six. The Source Frequency for port 1, therefore, has to be modified as shown in Fig. 4.14. Plus, the Receiver Frequency has to be set to 400 MHz so that port 2 of the analyzer can receive the IF DUT signal.
Fig. 4.14: Port configuration table on completion of step 4
Under Trace Funct | User Def Math, the correction value determined in step 1 (0.7 dB in this case) has to be entered in the trace mathematics for Trc1. The following formula will result: Trc1*10^(-0.7/20). The checkmark Result is Wave Quantity must be selected. The trace mathematics will become active on pressing Math = User Def.
Step 5: Adjusting the level of the LO_DUT signal as required
The DUT requires an LO power of approx. −4 dBm. Create a new trace (Trc2). Mount the W8486A power sensor on the waveguide test port of converter 1. Open the Power Sensor dialog with Meas | More | More | Power Sensor … and make the configurations shown in Fig. 4.15. The power adjusting screw (Fig. 2.16) on converter 1 should initially be set to approx. 2 mm.
Fig. 4.15: Power sensor dialog Fig. 4.16: Power adjusting screw

1EZ57_0E 20 Rohde & Schwarz
Close the power sensor dialog with OK. The power measured by the power meter will now be displayed as Trc2 versus frequency. The frequency sweep will start after a short waiting time. Sweep speed will be reduced due to the averaging performed by the power meter. The LO power can now be adjusted to approx. −4 dBm by means of the power adjusting screw. After adjusting, still wait until a complete sweep has been performed for Trc2. Then store Trc2 to the R&S®ZVA memory as Mem3[Trc2] using Data to Mem.
Step 6: Calibrating the reference channel power (RF_DUT) on converter 2
Next, trace Trc2 is to be configured to display the RF power delivered to the DUT. For this purpose, Trc2 has to be allocated to a separate channel (Ch2) because it will be assigned hardware settings different from those of Trc1. Assign Trc2 to channel Ch2 with Trace Select | Assign Channel | New. In the port configuration table (see Fig. 4.14), set the Receiver Frequency back to 279 MHz. This setting will have an effect only on channel Ch2; it will not influence trace Trc1. At the receive frequency of 279 MHz, the analyzer can measure the wave quantity a4, i.e. the incident wave at the RF port of the DUT. For this purpose, select a4 Src Port 1 under Meas | Wave Quantities | More Quantities. To measure the wave quantity correctly, the reference channel power (RF_DUT stimulus signal) on the RF port of converter 2 has to be calibrated as follows:
Mount the W8486A power sensor on the waveguide test port of converter 2. Open the Source Power Cal dialog (Fig. 4.17) with Cal | Start Power Cal | Source Power Cal. Select port 4 as the source, and open the Modify Settings dialog. Deactivate the Flatness Cal setting, because the R&S®ZVA is not capable of adjusting the R&S®ZVA-Z110 converter output power (the power adjusting screw can only be operated manually). Prior to starting power calibration, set the power adjusting screw on converter 2 to approx. 2 mm. During calibration, a power correction table is generated for the reference channel receiver and then automatically activated. The power correction table will become effective for wave a4 and is referenced to the waveguide port output of converter 2.
Fig. 4.17: Calibration of reference channel power for the DUT RF at the output of converter 2
1EZ57_0E 21 Rohde & Schwarz
Remove the power sensor and set the RF power to approx. −25 dBm as required for the DUT using the power adjusting screw. Only now may the DUT be mounted and connected to the power supply (5 V DC).
Step 7: Calculating the conversion gain
To display the conversion gain, create a new trace (Trc4). The conversion gain is calculated by means of the trace mathematics using the formula Trc1*10^(-0.7/20)/Trc2, where the value −0.7 is to be replaced by the correction value determined in step 1 in each case. The result is shown in the lower part of Fig. 4.19.
Step 8: Measuring the matching at the LO port of the DUT
Create trace Trc5 and assign a new channel (Ch3) to this trace. Trc5 is to represent the S-parameter S11 at the waveguide port of converter 1. As a prerequisite for this measurement, the LO_IN frequency for the harmonics mixers of converter 1 has to be set to match the LO_DUT stimulus frequency of converter 1 (f LO_DUT = f RF_DUT – 400 MHz). Assuming an IF frequency of 279 MHz for the MEAS and REF signals, the external generator (which supplies the LO_IN signal for down conversion of a1, b2) has to be set to a frequency of f RF – 400 MHz – 279 MHz = f RF – 679 MHz for the return loss measurement at LO_DUT. In the port configuration table, the Source Frequency entry for the generator (Gen 1) has to be changed accordingly. The Receiver Frequency should be set to 279 MHz. By selecting the wave quantity a1 as the measured quantity, it can easily be checked whether all settings have been made correctly:
• a1 indicates only noise → settings are incorrect
• a1 indicates a defined power → settings are correct
Select the S-parameter S11 as the measured quantity. Same as in Section 4.1, step 6, full one-port system error correction has to be performed for converter 1.
Step 9: Measuring the matching at the RF port of the DUT
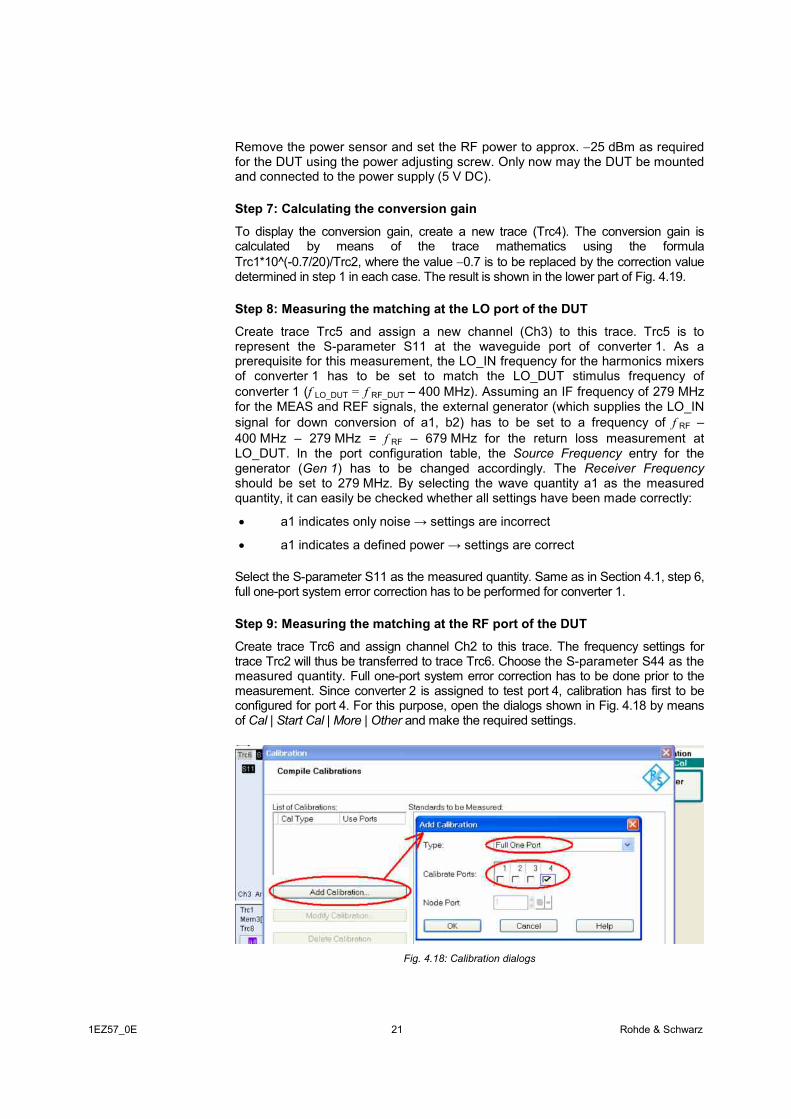
Create trace Trc6 and assign channel Ch2 to this trace. The frequency settings for trace Trc2 will thus be transferred to trace Trc6. Choose the S-parameter S44 as the measured quantity. Full one-port system error correction has to be done prior to the measurement. Since converter 2 is assigned to test port 4, calibration has first to be configured for port 4. For this purpose, open the dialogs shown in Fig. 4.18 by means of Cal | Start Cal | More | Other and make the required settings.
Fig. 4.18: Calibration dialogs

1EZ57_0E 22 Rohde & Schwarz
When calibration is completed, reconnect the DUT. The final results are shown in Fig. 4.19. Traces Trc5 and Trc6 are displayed in separate diagrams (selectable under Trace Select | Trace Manager). In this case, Smith diagrams have been used (selectable under Format).
Feed through RF to LO
The RF to LO feed trough can be measured in a similar way like the conversion loss. Due to the cutoff frequency of the WR10 waveguide the feed throughs from RF to IF and LO to IF are not relevant.
Final result obtained for measurement example 4.2
Fig. 4.19: LO and RF matching (Trc5 and Trc6) and conversion gain (Trc4) in the frequency range 75 GHz to 100 GHz
Overview of traces generated in Section 4.2 Trace (see
Fig. 4.19)
Description Frequency
Trc1 Wave b2 (IF_DUT) in dBm, displayed on R&S®ZVA,level-corrected
400 MHz
Trc2 Reference channel power (RF_DUT, wave a4) in dBm on converter 2, level-corrected
fb
Mem3[Trc2] Wave a1 (LO_DUT) in dBm measured with power meter and stored as memory trace
broadband
Trc4 Conversion gain in dB calculated from wave a4 (RF_DUT) and wave b2 (IF_DUT)
400 MHz vs fb
Trc5 Matching in dB at LO port, system-error-corrected fb – 400 MHz
Trc6 Matching in dB at RF port, system-error-corrected fb

1EZ57_0E 23 Rohde & Schwarz
4.3 Compression Point Measurement on a Two-Port Mixer Measurement task:
The following example describes, among other things, a compression point measurement on a two-port mixer at 110 GHz. The two-port mixer is integrated into the test setup using a diplexer. The same test setup could also be used for a three-port mixer; in this case the diplexer and the 3 dB attenuator have to be omitted. The DUT is a two-port mixer with a WR10 waveguide port (75 GHz to 110 GHz) for the RF input (RF_DUT) and an IF of 404.4 MHz. The mixer uses the 8th harmonic of the LO signal. The LO signal (LO_DUT) and the IF signal (IF_DUT) are conducted via a common PC3.5 connector.
Test setup:
Figs 4.20 to 4.22 show the final test setup. An R&S®ZVA-Z110 converter is connected to the RF port of the DUT. The converter delivers the RF signal to the DUT; the power of the RF_DUT signal is measured as wave a1. The second port of the DUT, i.e. the LO/IF port, is connected to a 3 dB attenuator, which provides broadband termination to the DUT. The subsequent diplexer couples out the IF signal, which is taken to the direct receiver input of test port 2 on the R&S®ZVA network analyzer. The LO input signal (LO_DUT), which is also applied to the diplexer, is delivered by the R&S®SMF100A signal generator1).
Fig. 4.20: Block diagram of test setup
1) The DUT requires an LO power of +13 dBm. The diplexer and the attenuator cause an insertion loss of approx. 4 dB. The
required LO_DUT signal power is therefore approx. +17 dBm. This means that the R&S®SMF-B31 high output power option is not needed for the R&S®SMF100A generator. The R&S®ZVA is not capable of delivering a power of +17 dBm. Plus, the two internal sources of the R&S®ZVA are needed to provide the LO_IN and RF_IN signals for the converter.
16
R&S®ZVA-Z110
LO_IN
RF_IN
REF MEAS
DUT
LO_DUT NRP-Z22
WR 10
W8486A
WR 10
-3 dB Diplexer
IF_DUT
RF_DUT
LO_DUT
∫
∫
1EZ57_0E 24 Rohde & Schwarz
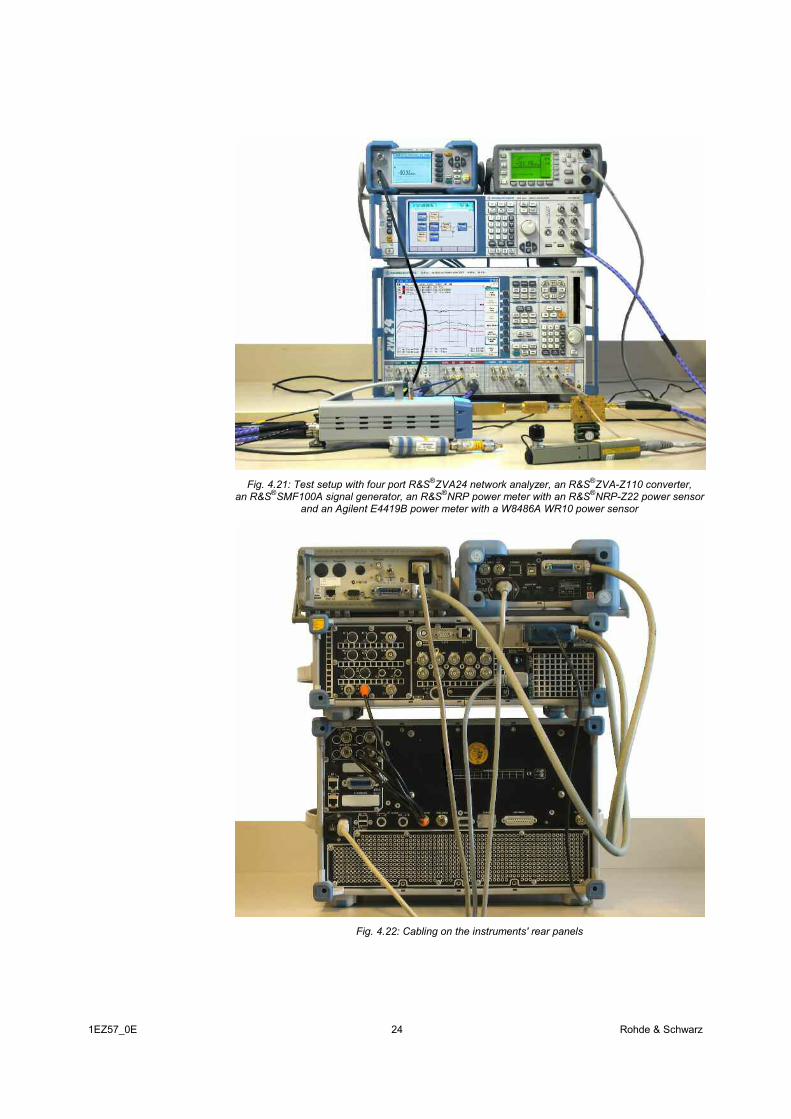
Fig. 4.21: Test setup with four port R&S®ZVA24 network analyzer, an R&S®ZVA-Z110 converter, an R&S®SMF100A signal generator, an R&S®NRP power meter with an R&S®NRP-Z22 power sensor
and an Agilent E4419B power meter with a W8486A WR10 power sensor
Fig. 4.22: Cabling on the instruments' rear panels

1EZ57_0E 25 Rohde & Schwarz
The rear-panel cabling provides the remote-control connection (GPIB bus) and frequency synchronization (10 MHz reference signal). For details, refer to Section 4.2, paragraph “Test setup”. The R&S®NRP power meter can be connected to the R&S®ZVA via the GPIB bus as shown in Fig. 4.22. Alternatively, the R&S®NRP-Z22 power sensor can be operated directly on the R&S®ZVA by connecting it via the R&S®NRP-Z4 USB adapter. In the latter case, the R&S®NRP power meter is not needed. The power sensor is required for calibrating the external generator power in step 3. Allow for the warmup times for all instruments and units included in the setup.
Step 1: Correction value for wave b2 (from IF/LO port of DUT)
The results obtained for the conversion loss are to be referenced to the IF/LO port of the DUT. The power of wave b2 is, therefore, measured at the output of the 3 dB attenuator (see symbol ∫ in Fig. 4.20). Replace the DUT by the R&S®NRP-Z22 power sensor. Perform the measurement in accordance with the instructions given in Section 4.1, step 1, except that a CW frequency of 404.4 MHz has to be set in this case. A correction value of −21.77 dB is obtained in this example.
Step 2: Configuring the converter
In the System Configuration dialog, select the converter type (ZVA-Z110) and the cabling scheme (RF intern, LO intern). Activate the setting with Apply and terminate the dialog with Close.
Fig. 4.23: Configuring the R&S®ZVA-Z110 converter
The network analyzer is now configured to operate in the converter mode, and the converter can be connected to test ports 1 and 3. Set the measurement bandwidth to 100 Hz.
Step 3: Calibrating the power of the external generator (LO_DUT signal)
The specified LO power of +13 dBm of the mixer is referenced to the mixer's IF/LO port. By setting a nominal power of +17 dBm on the generator, approx. +13 dBm would be obtained at the mixer's IF/LO port (cf. footnote on page 23). Instead of setting the generator to a nominal power of +17 dBm, it is preferred to calibrate the R&S®SMF100A power, since this will also compensate the frequency response of the

1EZ57_0E 26 Rohde & Schwarz
diplexer and the 3 dB attenuator. The R&S®NRP-Z22 power sensor should be connected to the output of the 3 dB attenuator (this has already been done in step 1).
Open the port configuration table with Mode | Port Config (cf. Fig. 4.14). The DUT uses the 8th harmonic of the LO and has an IF of 404.4 MHz (f LO < f RF). Therefore, enter 1/8 ⋅ fb − 1/8 ⋅ 404.4 MHz as the Source Frequency in the Gen 1 line. To make the entry, click the "…" button first. In the same line, enter +13 dBm for the level of the external generator Gen 1. Open the following dialog with Cal | Start Power Cal | Source Power Cal:
Fig. 4.24: Source Power Cal dialog with Modify Source Power Cal Settings sub dialog
In the dialog in Fig. 4.24, Gen 1 is selected as the source. The further settings are to be made in the Modify Source Power Cal Settings subdialog. For example, the number of calibration cycles is limited to 5 and an accuracy limit of ±0.2 dB is set. A special aspect in the power calibration performed here is that no reference receiver (wave a) is available. Therefore, disable the Reference Receiver Cal checkmark. Start the calibration with Take Cal Sweep. Fig. 4.24 also shows the Deviation 0.02 dB.
Step 4: Calibrating the reference channel power (RF_DUT, wave a1)
Select the measured quantity a1 for Trc1. The reference channel power at the waveguide port of the converter has to be calibrated so that the network analyzer will measure the wave quantity a1 (RF_DUT signal) with the correct level. Proceed as described in Section 4.2, step 6.
Step 5: Measuring the IF level
Create a new trace (Trc2) and assign a separate channel (Ch2) to this trace. For channel Ch2, open the port configuration table with Mode | Port Config. Enter 404.4 MHz as the Receiver Frequency. To make the entry, click the "…" button first. With Meas | Wave Quantities | b2 Src Port 1, the IF_DUT signal from the DUT can now be received. Under Trace Funct | User Def Math, enter the correction value determined in step 1 in the formula of the trace mathematics for Trc2. Assuming a value of −21.77 dBm as in the example of step 1, the following formula will result: Trc2*10^(−21.77/20). The checkmark Result is Wave Quantity in the User Def Math dialog must be selected. The trace mathematics will become active on pressing Math = User Def, i.e. the correct IF power will be displayed.
Step 6: Calculating the conversion loss

1EZ57_0E 27 Rohde & Schwarz
To display the conversion loss, create a new trace (Trc3). Channel Ch2 can be assigned to this trace, for example. Select the measured quantity b2 Src Port 1 for Trc3. Calculate the conversion loss of the DUT from traces Trc1 (RF_DUT) and Trc2 (IF_DUT). The trace mathematics defined in step 4 has to be taken into account. The formula under User Def Math will thus read as follows: (Trc2*10^(−21.77/20))/Trc1. The checkmark Result is Wave Quantity must be disabled. Fig. 2.25 shows a typical result of this measurement.
Fig. 4.25: Conversion loss of DUT versus frequency
Overview of traces generated in Section 4.3 Trace (see
Fig. 4.25)
Description Color coding, frequency
Trc1 Wave a1 (RF_DUT) in dBm, level-corrected, measured at waveguide test port of converter
blue, fb
Trc2 Wave b2 (IF_DUT) in dBm, level-corrected, referenced to IF/LO port of DUT
red, 404.4 MHz
Trc3 Conversion loss in dB calculated from measured traces Trc1 and Trc2
green
Step 7: Measuring the 1 dB compression point of the mixer
If the RF level is changed, the conversion loss should ideally remain the same. For the DUT examined here, however, a slight increase in conversion loss is observed close to 0 dBm. A CW sweep with f = 110 GHz is performed to measure the 1 dB compression point. By varying the power adjusting screw, the screw position can be determined at which the conversion loss increases by 1 dB. The 1 dB compression point referenced to the input (RF_DUT) can be read from Trc1 (wave a1) (e.g. −0.5 dBm). The 1 dB compression point referenced to the output (IF_DUT) can be read from Trc2 (wave b1) (e.g. −44.3 dBm).

1EZ57_0E 28 Rohde & Schwarz
4.4 Spectral Measurements by Means of a Network Analyzer Measurement task:
Spectral measurements (e.g. to determine the spectral purity of the output signal of a mixer) are normally handled by spectrum analyzers. The following measurement example demonstrates how spectral measurements can be performed by means of a network analyzer.
Continuous sweep
A main characteristic of spectrum analyzers is their quasi-continuous, or seamless, sweep. To get an idea of how this works, imagine a sweep with 101 points across a frequency range of 1 GHz to 11 GHz on a network analyzer. The network analyzer performs measurements at discrete frequency points, i.e. in this example at 1 GHz, 1.1 GHz, 1.2 GHz, 1.3 GHz, 1.4 GHz, 1.5 GHz … 10.9 GHz, 11 GHz. For each frequency point, the signal power received with a specific IF filter is displayed. If, for example, an IF bandwidth of 100 Hz is used, signals at an offset of 1 kHz from the test frequency will be suppressed almost completely. As a consequence, the network analyzer will not capture a signal with a fixed frequency of 1.11 GHz, which will thus be lost between the discrete measurements (see Fig. 4.26).
. . .1.1 f/GHz 1.2 1 1.3 11.9 12
a/dB
1.11 Fig. 4.26: Point-by-point sweep performed by network analyzer
The fact that gaps between the discrete measurement points are possible poses no problems in S-parameter measurements because the response frequency of a DUT is known in each case (linear circuit model: response frequency = stimulus frequency). Spectrum analyzers, on the other hand, are designed for examining sources with an unknown frequency spectrum. For this purpose, they perform a sweep without gaps. Therefore the power displayed as a measurement point involves the power spectral density towards its adjacency points. No frequencies will be missed in this way, even if large step sizes and narrow measurement bandwidths are selected. To make this possible, however, the spectrum analyzer requires a sweep time proportional to 1/BW2 (BW = bandwidth of IF filters). By contrast, the sweep time required by a network analyzer is approximately proportional to 1/BW. By allowing increased level uncertainty, a signal can be regarded as having been measured if it is received within the 3 dB bandwidth of the IF filter. If, in the above example, 10001 points and a bandwidth of 1 kHz are selected, the 3 dB cutoff points of the received bands will adjoin each other (see Fig. 4.27, markers 1, 2, 3, etc.).
. . .1.1 f/GHz 1.2 1 1.3 11.9 12
a/dB
1.11
1234…
Fig. 4.27: Overlapping receive bands to replace a quasi-continuous sweep
The network analyzers of the R&S®ZVA family are well suited for this type of sweep as they support sweeps with as many as 20001 points. If the requirement for overlapping receive bands is met, a relationship between the measurement

1EZ57_0E 29 Rohde & Schwarz
bandwidth and the sweep time similar to that of a quasi-continuous sweep will be obtained.
Spurious response and image-frequency response
Spectrum and network analyzers employ mixers as frequency-converting elements. Even with mixers used in spectrum analyzers, multiple receive frequencies will be obtained for a given combination of LO and IF frequency, see formulas (1) and (2) in Chapter 2. In addition to a defined, user-selected RF frequency, the instrument will also receive the image and spurious frequencies unless methods are taken to prevent this. To be able to unambiguously correlate a specific receive power to a specific, single frequency, various concepts have been developed and successfully implemented in spectrum analyzers (for details refer to [15], for example):
High first IF
Tracking filter/preselector connected ahead of the mixer
However, these measures cannot be transferred to the design of network analyzers, as the implementation of a high first IF involves a highly complex circuit design. For a 50 GHz network analyzer, for example, the local oscillator would have to cover a frequency range from approx. 50 GHz to 100 GHz to provide conversion to the first IF.
Limitations with regard to the frequency range of the first local oscillator also exist for spectrum analyzers. Tracking filters are therefore used for higher frequency ranges. Due to the required wide tuning range, YIG filters are preferably used. The disadvantage of these filters is their hysteresis behavior (for details about YIG filters refer to [16], for example). The transmission characteristic of a YIG filter is influenced by the preceding tuning process, which causes the filter to operate with a frequency drift versus time. YIG filters are therefore not suitable as preselectors for the various receive paths of a network analyzer, which require highly stable, synchronous tracking.
For spectrum analysis in the millimeter-wave range, external harmonics mixers are available1). The mixer's RF port is typically in the form of a waveguide. The spectrum analyzer supplies the LO signal to the external mixers and measures the IF signal. Preselection is usually not included in this configuration. This means that unambiguous frequency reception is not possible. To provide unambiguous reception nevertheless, a signal identification method is employed. Details and a mathematical proof of the method will be found in [10]. Below, a concise description of the method will be given, followed by a discussion of how the method can be implemented also on the R&S®ZVA using the trace mathematics. This will be explained first for single conversion and then for double conversion for a test setup including the R&S®ZVA network analyzer and a R&S®ZVA-Z110 converter.
1) e.g. the R&S®FS-Z60, R&S®FS-Z75 or R&S®FS-Z110 for the R&S®FSU67 with the R&S®FSU-B21 option

1EZ57_0E 30 Rohde & Schwarz
Principle of signal identification
Let us assume that the mixer of a single-converting receiver is operated with a local oscillator frequency in accordance with formula (3):
IFRFLO fff −= (3)
In this case, the LO frequency is lower than the RF receive frequency. It is further assumed that the bandpass filter in the RF signal processing has a center frequency of 17.5 MHz. A single-frequency 279 MHz test signal would be indicated as a receive frequency of 279 MHz by the receiver. During a frequency sweep, the 279 MHz test signal would therefore be received at an LO frequency of 261.5 MHz. In addition, the 279 MHz test signal would be received at an LO frequency of 296.5 MHz. In the latter case, the local oscillator frequency would be 17.5 MHz higher than the 279 MHz test signal. The receiver would indicate a receive frequency of 314 MHz which belongs to this LO frequency setting (see Fig. 4.28). The single-frequency 279 MHz test signal, however, does in fact not have any spectral components at this frequency.
f/MHz
a/dB
17.5 279 314
17.5 17.5 IF filter
Fig. 4.28: Wanted-frequency und image-frequency reception for f LO_ZVA < f RF
Alternatively, the LO frequency on the receiver can be set in accordance with formula (4):
IFRFLO fff += (4)
The 279 MHz test signal would then be received at an LO frequency of 296.5 MHz and indicated as 279 MHz on the receiver's frequency axis. In addition, the 279 MHz test signal would be received at an LO frequency of 261.5 MHz during the sweep. For this LO frequency, the receiver would indicate a receive frequency of 244 MHz (see Fig. 4.29).
fRF/MHz
a/dB
17.5 279 261.5244
17.5 17.5 IF filter
Fig. 4.29: Wanted-frequency und image-frequency reception for f LO_ZVA > f RF
It can be observed in both examples that the image frequency is offset from the test signal by 2*fIF. It can further be observed that the position of the image frequency is dependent on the definition of the LO frequency in accordance with formula (3) or (4). Looking at Figs 4.28 and 4.29, it can be seen that the 279 MHz test signal is displayed precisely at 279 MHz, whereas the image frequencies at 314 MHz and 244 MHz do not occur simultaneously in the same diagram. This leads to a method of suppressing image-frequency reception: by performing two sweeps using LO frequencies based on different formulas, and by subsequently determining the minimum of the two measurements for each frequency point. Application Note [10] discusses the image-frequency reception described above

1EZ57_0E 31 Rohde & Schwarz
plus the suppression of higher-order mixture products. The method is sometimes also referred as software preselector.
Use of signal identification method with single conversion
The procedure described in the two examples above is now to be applied to the R&S®ZVA24. The frequencies in the above have been selected to match the frequencies used on the R&S®ZVA in converter mode. The frequency conversion that takes place in the converters themselves is ignored in this first application example.
Configure the R&S®ZVA for converter operation as described in Section 4.3, step 2. It is sufficient to connect a single R&S®ZVA-Z110 converter to the network analyzer (test ports 1 und 3). The remaining components of the test setup as shown in Section 4.3 can be omitted.
An IF bandwidth of 1 kHz and 4001 frequency points are sufficient to produce overlapping receive bands as shown in Fig. 4.27 (to replace a quasi-continuous sweep).
Set a sweep with a center frequency of 75 GHz and a span of 400 MHz on the network analyzer. Open the port configuration table with Mode | Port Config and set the Source Frequency for port 1 to a fixed frequency of 75 GHz (see Fig. 4.30).
Fig. 4.30: Defining a fixed stimulus frequency of 75 GHz in the port configuration table
Select wave a1 of the converter (a1 Src Port 1) as the measured quantity. Select the LO frequency as shown in Figs 4.28 and 4.29 by means of LO<RF and LO>RF under Mode | More | Spurious Avoidance. Select LO>RF for trace 1 (corresponds to the Auto mode for a Receiver Frequency of 279 MHz on the R&S®ZVA).
Create a new trace (Trc2) with Trace Select | Add Trace + Diag Area. Assign a separate channel to this trace (with Assign Channel | New). Select a1 Src Port 1 as the measured quantity. Select LO<RF for trace 2.
By forming the minimum of the two traces Trc1 and Trc2, trace Trc3 is generated. Trc3 is also assigned a1 Src Port 1 as the measured quantity. Fig. 4.31 shows the trace mathematics required for implementing the signal identification. The trace mathematics becomes active on pressing Math = User Def.

1EZ57_0E 32 Rohde & Schwarz
Fig. 4.31: Results obtained with signal identification method for single conversion
Use of signal identification method with double conversion
In the previous example, the frequency conversion in the R&S®ZVA-Z110 converter itself was left out of the consideration. The converter includes a harmonics mixer each for converting the reference-channel and the measurement-channel (see Chapter 3, Fig. 3.1). The mixers convert the sweep range (75 GHz ±200 MHz in this case) to a fixed IF of 279 MHz. If the sweep range is now enlarged to 80 GHz ±700 MHz and the CW signal of test port 1 is set to 80 GHz, another image frequency is displayed (see double reception at markers M3 and M4 in Fig. 4.33, top left and right diagrams). The frequency of the LO_IN signal for the converter can be derived from the port configuration table:
Fig. 4.32: Port configuration table with default settings for the R&S®ZVA-Z110 converter (cabling scheme: internal RF, internal LO)
With the configuration shown in Fig. 4.32, the upper sideband of the converter is selected as the wanted sideband (default setting for converter mode). For fRF =80 GHz, the LO_IN frequency is obtained as follows: 80 GHz/8 – 279 MHz/8 =

1EZ57_0E 33 Rohde & Schwarz
9.965125 GHz. The 80 GHz signal can also be received at an LO_IN frequency of 80 GHz/8 + 279 MHz/8 = 10.034875 GHz. The network analyzer would indicate a receive frequency of 80.06975 GHz. Furthermore an image frequency of the 80.06975 GHz is generated by the network analyzers internal mixers, which re-sults in a second image-frequency reception displayed (cf. markers M3 and M4).
Next, the above considerations are to be applied to the lower sideband. For this purpose, the formula for calculating the LO_IN signal has to be edited in the port configuration table (Fig. 4.32). First, create trace Trc4 and another diagram area. Assign a new channel (Ch3) to this trace. Modify the port configuration table for Trc4 so that the network analyzer uses the lower sideband of the harmonics mixer as the wanted sideband. The formula for port 3 will then read as follows: 1/8 ⋅ fb + 1/8 ⋅ 279 MHz. This yields the trace shown in the lower right diagram of Fig. 4.33. As expected, double image-frequency reception will now occur below the 80 GHz signal.
As for single conversion above, the minimum of the traces Trc1, Trc2 and Trc4 has to be formed using the trace mathematics. Since the Min(x, y) function allows for two parameters only, two Min functions have to be nested as shown at the bottom of Fig. 4.33.
The result diagram (Trc3 in the lower left of Fig. 4.33) again shows a single spectral line at 80 GHz. This is the fixed stimulus frequency to which port 1 has been set before.
Fig. 4.33: Results obtained with signal identification method for double conversion

1EZ57_0E 34 Rohde & Schwarz
5 Appendix
5.1 Source-to-Port Assignment on R&S®ZVA24 and R&S®ZVT20 The four-port and six-port models of the R&S®ZVA24 and R&S®ZVT20 network analyzers, respectively, include two or three internal stimulus oscillators whose frequencies can be selected independently of one another. Two test ports are assigned to a stimulus oscillator in each case. The two figures below show the assignment of test ports to stimulus oscillators.
Fig. 5.1: Assignment of test ports to stimulus oscillators on the R&S®ZVA
Fig. 5.2: Assignment of test ports to stimulus oscillators on the R&S®ZVT20
Stimulus oscillator 1
Stimulus oscillator 2
Stimulus oscillator 1
Stimulus oscillator 2
Stimulus oscillator 3
1EZ57_0E 35 Rohde & Schwarz
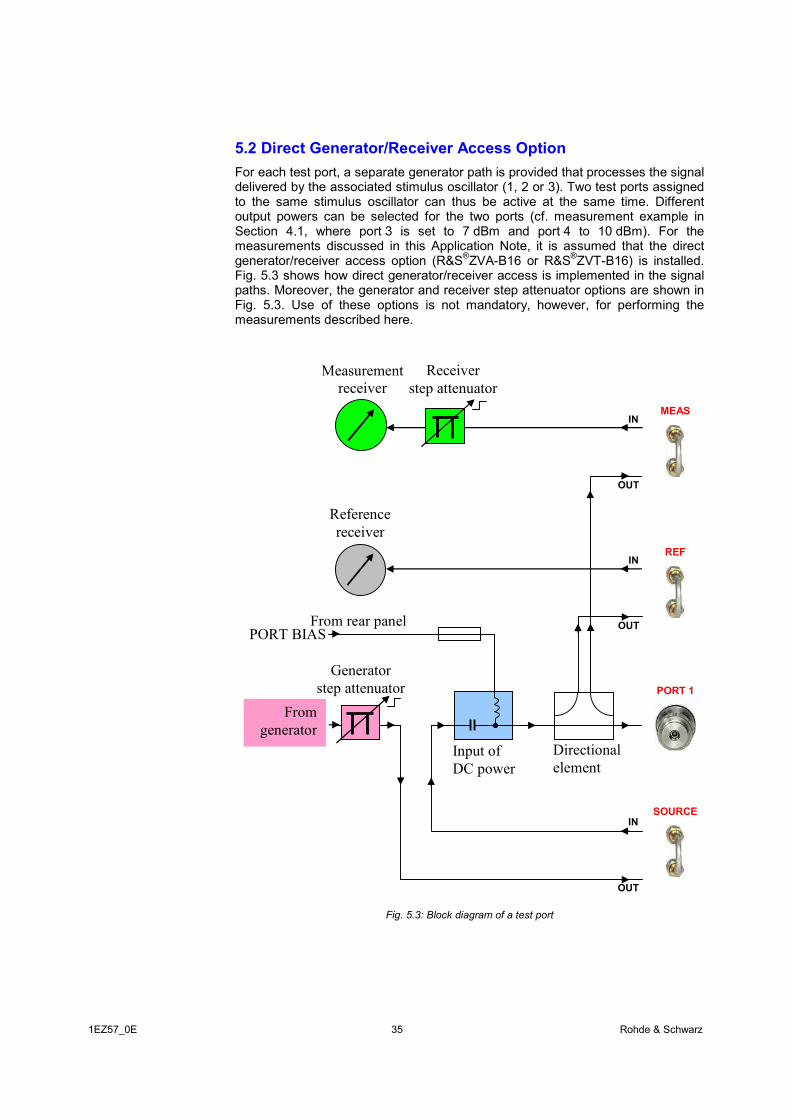
5.2 Direct Generator/Receiver Access Option For each test port, a separate generator path is provided that processes the signal delivered by the associated stimulus oscillator (1, 2 or 3). Two test ports assigned to the same stimulus oscillator can thus be active at the same time. Different output powers can be selected for the two ports (cf. measurement example in Section 4.1, where port 3 is set to 7 dBm and port 4 to 10 dBm). For the measurements discussed in this Application Note, it is assumed that the direct generator/receiver access option (R&S®ZVA-B16 or R&S®ZVT-B16) is installed. Fig. 5.3 shows how direct generator/receiver access is implemented in the signal paths. Moreover, the generator and receiver step attenuator options are shown in Fig. 5.3. Use of these options is not mandatory, however, for performing the measurements described here.
MEAS
REF
PORT 1
Measurement receiver
fänger
Reference receiver
From rear panel
OUT
IN
OUT
IN
OUT
IN
Receiver step attenuator
Generator step attenuator
From generator
Input of DC power
Directional element
PORT BIAS
SOURCE
Fig. 5.3: Block diagram of a test port

1EZ57_0E 36 Rohde & Schwarz
6 General Information
6.1 Handling of Converters and Waveguides The information given in the following is meant to help you reproduce the discussed measurement examples as accurately as possible and to avoid errors. It is not meant to replace the relevant instrument documentation.
Waveguide flanges are high-precision mechanical components that may be damaged by improper handling, for example by cocking of the flanges relative to one another. Make sure, therefore, to set up the test equipment on an even and stable surface. Flanges must be properly aligned relative to one another before they are mounted.
Avoid touching waveguide flanges with your fingers. Especially in the case of higher-frequency waveguides such as the WR03, unwanted particles or dirt particles may enter the, causing an alteration of the waveguides cross section. Moreover, to prevent the ingress of dirt and unwanted particles, waveguides should be covered by means of their protective caps during periods of non-use.
Shims may be cleaned using uncontaminated (oil-free) compressed air or nitrogen. Converters and Match standards, by contrast, should never be cleaned in this way because this may damage their sensitive inner structures. For the same reason, it is not permissible to insert any objects into the flanges.
Do not operate the converters above their maximum permissible input power; otherwise they may be damaged. Therefore, prior to making the RF and LO connections to the converters, make sure that their maximum specified input power is not exceeded. Prior to connecting the converters, you should always select the correct converter type and cabling scheme in the Frequency Converter configuration dialog (cf. Fig. 4.2) and activate the setting with Apply.
The converters operate on the principle of frequency multiplication. Along with the frequencies of the RF and the LO signal, any phase errors of these signals will be multiplied. Phase errors may result, for example, from the use of unsuitable cables for the RF and LO connections. By contrast, the IF signals, which have a frequency of approx. 300 MHz, can be considered uncritical in this respect.
Another avoidable cause of phase errors is the improper mounting of coaxial connectors. A suitable torque wrench should therefore be used for mounting the connectors.
Temperature fluctuations inevitably lead to phase drift due to the longitudinal expansion of the coaxial cables (RF, LO) and the waveguide components. High temperature stability is therefore a vital prerequisite for performing high-accuracy millimeter-wave measurements.
6.2 Miscellaneous This Application Note is made available subject to the conditions stated in the download area of the Rohde & Schwarz website (www.rohde-schwarz.com). Use of citations and parts of the Application Note is permitted subject to the right of revocation and on condition that the target document is submitted and the source is stated.

1EZ57_0E 37 Rohde & Schwarz
Our Application Notes are updated periodically. It is recommended that you visit the Rohde & Schwarz website at regular intervals to look for any updates of this Application Note.
Even though the contents of this Application Note were developed with utmost care, no liability shall be assumed for the correctness and completeness of the information contained therein. Furthermore, no liability shall be assumed under any circumstances for any direct or indirect damage that may result from the use of the information in this Application Note.
The circuits, equipment, and methods described in this Application Note may also be protected by patents, utility models, or design patterns even if not expressly indicated. Any commercial use without the approval of possible licensees represents an infringement of an industrial property right and may result in claims for damages.
The same applies to the product names, company names, and logos mentioned in this Application Note; thus, the absence of the ® or ™ symbol cannot be assumed to indicate that the specified names or logos are free from trademark protection.
If this Application Note directly or indirectly refers to laws, regulations, guidelines, and standards (DIN, VDE, IEEE, ISO, IEC, PTB, etc), or cites information from them no guarantees as to the correctness, completeness, or up-to-dateness of the information is guaranteed. The reader is advised to consult the applicable version of the corresponding documentation if necessary.
7 Literatur [1] Stephen A. Mass: „Microwave Mixers“, Artech House, Inc. Norwood MA,
USA, 2nd Edition, 1993
[2] Anonymous: "Erickson Instruments PM4 Millimeter-Submillimeter Power Meter Operating Manual", Erickson Instruments LLC, Amherst, MA, USA, Revised January 2008
[3] Anonymous: „R&S®ZVA-Z325 Converter WR03 Data Sheet“, Rohde & Schwarz GmbH & Co. KG, Version 02.00, May 2008
[4] Anonymous: "R&S®ZVA Z75, R&S®ZVA Z110, R&S®ZVA Z325 Quick Start Guide (Converters WR15, WR10, WR03)", Rohde & Schwarz GmbH & Co. KG, Version 03, May 2008
[5] Anonymous: „R&S®ZVA Vector Network Analyzer Data Sheet“, Rohde & Schwarz GmbH & Co. KG, Version 05.00, January 2008
[6] Anonymous: „Agilent Technologies E4419B Power Meter User's Guide", Agilent Technologies, 3rd Edition, June 2008
[7] Anonymous: „Agilent Technologies W8486A Power Sensor Operating Manual ", Agilent Technologies, July 2001
[8] Anonymous: “ML2430A Series Power Meter Operation Manual”, Anritsu Ltd, Rev. K, March 2000
[9] Axel Tessmann, et. al.: "A Compact W-Band Dual-Channel Receiver Module", Fraunhofer Institute for Applied Solid State Physics (IAF), Germany, Microwave Symposium Digest 2006, IEEE MTT-S International, San Francisco, CA, USA, 11 to 16 June 2006, pp. 85-88
[10] Christoph Rauscher: „Application Note: Frequency Range Extension of Spectrum Analyzers with Harmonic Mixers“, Rohde & Schwarz GmbH & Co. KG, 1998

1EZ57_0E 38 Rohde & Schwarz
[11] Kerr, A. R. and Wollack, E. and Horner, N.: „ALMA Memo No. 278: Waveguide Flanges for ALMA Instrumentation“, ALMA / National Radio Astronomy Observatory, November 1999
[12] Hiebel, Michael: „Fundamentals of Vector Network Analysis“, Rohde &Schwarz GmbH & Co. KG, 4. Aufl. 2008
[13] Hiebel, Michael: "Application Note: Millimeter-Wave Measurements Using Converters of the R&S®ZVA Family", Rohde & Schwarz GmbH & Co. KG, 2007
[14] Hiebel, Michael: "Application Note: Multiport Millimeter-Wave Measurements Using Converters of the R&S®ZVA Family", Rohde & Schwarz GmbH & Co. KG, 2007
[15] Rauscher, Christoph: “Fundamentals of Spectrum Analysis”, Rohde &Schwarz GmbH & Co. KG, 1. Aufl. 2001
[16] Helszajn, Joseph: “YIG Resonators and Filters”, John Wiley & Sons Ltd, 1st Edition 1985
8 Ordering information
8.1 Equipment used in measurement example in Section 4.1 Four-Port Vector Network Analyzer R&S®ZVA24 10 MHz to 24 GHz 1145.1110.26 Options and accessories: R&S®ZVA-B16 Direct Receiver/Generator Access 1164.0209.26 R&S®ZVA-K8 Converter Control Software 1307.7022.02 R&S®ZV-Z71 Cable for DC Input 1164.1005.02 R&S®ZV-Z193 Test Port Cable, 965 mm
(3 cables are required) 1306.4520.36
Converter WR03 R&S®ZVA-Z325 220 GHz to 325 GHz 1307.7200.02 Accessory: R&S®ZV-WR03 Waveguide Calibration Kit WR03
(without sliding match) 1307.7300.31
Power Meter R&S®NRP-Z22 Power Sensor, 10 MHz to 18 GHz 1137.7506.02 R&S®NRP Power Meter (base unit) 1143.8500.02 Alternatively to power meter base unit:R&S®NRP-Z4 USB Adapter (passive) 1146.8001.02
Millimeter-Submillimeter Power Meter PM4 (sensor included)
Erickson Instruments, LLC, MA, USA see www.ericksoninstruments.com for distributors
Other accessories Cable, SMA (m) to SMA (m) (for IF signal from DUT)
DC to 8 GHz, length 1 m -/-
Adapter, BNC (m) to 4 mm banana (f) (for adapting Erickson PM4 power meter to R&S®ZV-Z71 cable)
DC to 100 kHz Multi-Contact AG
Adapter, WR03 to WR10 220 GHz to 325 GHz Radiometer Physics GmbH, Germany
DUT: harmonics mixer using 18th harmonic
220 GHz to 260 GHz Radiometer Physics GmbH, Germany

1EZ57_0E 39 Rohde & Schwarz
8.2 Equipment used in measurement example in Section 4.2 Four-Port Vector Network Analyzer R&S®ZVA24 10 MHz to 24 GHz 1145.1110.26 Options and accessories: R&S®ZVA-B16 Direct Receiver/Generator Access 1164.0209.26 R&S®ZVA-K8 Converter Control Software 1307.7022.02 R&S®ZV-Z193 Test Port Cable, 965 mm
(5 cables are required) 1306.4520.36
Converter WR10 (two converters are required) R&S®ZVA-Z110 75 GHz to 110 GHz 1307.7000.02 Accessory: R&S®ZV-WR10 Waveguide Calibration Kit WR10
(without sliding match) 1307.7100.10
Power Meter R&S®NRP-Z22 Power Sensor,10 MHz to 18 GHz 1137.7506.02 R&S®NRP Power Meter (base unit) 1143.8500.02 Alternatively to power meter base unit: R&S®NRP-Z4 USB Adapter (passive) 1146.8001.02
DC Power Supply R&S®NTG-20 2 x 0 V to 20 V, 0 A to 1 A
1 x 0 V to 6 V, 0 A to 5 A 117.7133.02
Waveguide Power Meter Agilent E4419B Power Meter (base unit) Agilent Technologies, USA Agilent W8486A WR10 Power Sensor Agilent Technologies, USA Alternatively: Anritsu ML2438A Power Meter (base unit) Anritsu Company, CA, USA Anritsu MA2497A Adapter: Agilent W8486A power
sensor to Anritsu ML2438A power meter
Anritsu Company, CA, USA
Anritsu WA8486A WR10 Power Sensor Anritsu Company, CA, USA
Other accessories Cable, SMP (m) to 4 mm banana (m) (for power supply of DUT)
length 1 m
-/-
Cable, SMA (m) to SMA (m) (for IF signal from DUT)
DC to 8 GHz, length 1 m Huber+Suhner®
Cable, 2 x BNC (m) (for 10 MHz reference frequency)
length 0.5 m -/-
Weinschel Model 1579 Power Splitter DC to 26.5 GHz, 0.5 W
Aeroflex / Weinschel, Inc.
Adapter, SMA (f) to SMA (f) or adapter PC 3.5 (f) to PC 3.5 (f) (3 adapters are required for adapting the power splitter to the cables)
DC to 18 GHz -/-
IAF RX94IQM millimeter-wave frontend (DUT)
75 GHz to 100 GHz Fraunhofer Institute for Applied Solid-State Physics (IAF), Germany
8.3 Equipment used in measurement example in Section 4.3 Four-Port Vector Network Analyzer R&S®ZVA24 10 MHz to 24 GHz 1145.1110.26 Options and accessories: R&S®ZVA-B16 Direct Receiver/Generator Access 1164.0209.26 R&S®ZVA-K8 Converter Control Software 1307.7022.02 R&S®ZV-Z193 Test Port Cable, 965 mm
(4 cables are required) 1306.4520.36
Converter WR10 with electronic attenuator R&S®ZVA-Z110 75 GHz to 110 GHz 1307.7000.02 Accessory: R&S®ZV-WR10 Waveguide Calibration Kit WR10
(without sliding match) 1307.7100.10

1EZ57_0E 40 Rohde & Schwarz
Power Meter R&S®NRP-Z22 Power Sensor, 10 MHz to 18 GHz 1137.7506.02 R&S®NRP Power Meter (base unit) 1143.8500.02 Alternatively to power meter base unit: R&S®NRP-Z4 USB Adapter (passive) 1146.8001.02
Waveguide Power Meter Agilent E4419B Power Meter (base unit) Agilent Technologies, USA Agilent W8486A WR10 Power Sensor Agilent Technologies, USA Alternatively: Anritsu ML2438A Power Meter (base unit) Anritsu Company, CA, USA Anritsu MA2497A Adapter, Agilent W8486A power
sensor to Anritsu ML2438A power meter
Anritsu Company, CA, USA
Anritsu WA8486A WR10 Power Sensor Anritsu Company, CA, USA
Other accessories Diplexer, 3 x SMA (f) cutoff frequency 500 MHz -/- Adapter, SMA (f) to SMA (f) or adapter, PC 3.5 (f) to PC 3.5 (f) (2 adapters are required for adapting the diplexer to the LO and the LO/IF cable)
DC to 18 GHz Huber+Suhner®
Attenuator, 3 dB, SMA (f) to SMA (m)
DC to 18 GHz Aeroflex / Inmet
Cable, SMA (m) to SMA (m) (for IF_DUT output signal of diplexer)
DC to 8 GHz, length 1 m -/-
Cable, 2 x BNC (m) (for 10 MHz reference frequency)
length 0.5 m -/-
8.4 Equipment used in measurement example in Section 4.4 Four-Port Vector Network Analyzer R&S®ZVA24 10 MHz to 24 GHz 1145.1110.26 Options and accessories: R&S®ZVA-B16 Direct Receiver/Generator Access 1164.0209.26 R&S®ZVA-K8 Converter Control Software 1307.7022.02 R&S®ZV-Z193 Test Port Cable, 965 mm
(4 cables are required) 1306.4520.36
Converter WR10 (two converters are required) R&S®ZVA-Z110 75 GHz to 110 GHz 1307.7000.02
For more information about the Rohde & Schwarz product portfolio, visit our website at www.rohde-schwarz.com. In the Rohde & Schwarz download area, you will also find the current version of this Application Note.
ROHDE & SCHWARZ GmbH & Co. KG . Mühldorfstraße 15 . D-81671 München . P.O.B. 80 14 69 . D-81614 München
Phone +49 89 4129 - 0 . Fax +49 89 4129 - 13777 . Internet: http://www.rohde-schwarz.com
This application note and the supplied programs may only be used subject to the conditions of use set forth in the download area of the Rohde & Schwarz website.