testing of ge universal interconnection device - nrel of ge universal interconnection device z. ye,...
TRANSCRIPT

Testing of GE Universal Interconnection Device
August 2003 • NREL/TP-560-34676
Z. Ye, D. Finney, R. Zhou, M. Dame, and B. Premerlani General Electric B. Kroposki and S. Englebretson National Renewable Energy Laboratory
National Renewable Energy Laboratory 1617 Cole Boulevard Golden, Colorado 80401-3393 NREL is a U.S. Department of Energy Laboratory Operated by Midwest Research Institute • Battelle • Bechtel
Contract No. DE-AC36-99-GO10337

National Renewable Energy Laboratory 1617 Cole Boulevard Golden, Colorado 80401-3393 NREL is a U.S. Department of Energy Laboratory Operated by Midwest Research Institute • Battelle • Bechtel
Contract No. DE-AC36-99-GO10337
August 2003 • NREL/TP-560-34676
Testing of GE Universal Interconnection Device
Z. Ye, D. Finney, R. Zhou, M. Dame, and B. Premerlani General Electric B. Kroposki and S. Englebretson National Renewable Energy Laboratory Prepared under Task No. DP03.1001

NOTICE This report was prepared as an account of work sponsored by an agency of the United States government. Neither the United States government nor any agency thereof, nor any of their employees, makes any warranty, express or implied, or assumes any legal liability or responsibility for the accuracy, completeness, or usefulness of any information, apparatus, product, or process disclosed, or represents that its use would not infringe privately owned rights. Reference herein to any specific commercial product, process, or service by trade name, trademark, manufacturer, or otherwise does not necessarily constitute or imply its endorsement, recommendation, or favoring by the United States government or any agency thereof. The views and opinions of authors expressed herein do not necessarily state or reflect those of the United States government or any agency thereof.
Available electronically at http://www.osti.gov/bridge
Available for a processing fee to U.S. Department of Energy and its contractors, in paper, from:
U.S. Department of Energy Office of Scientific and Technical Information P.O. Box 62 Oak Ridge, TN 37831-0062 phone: 865.576.8401 fax: 865.576.5728 email: [email protected]
Available for sale to the public, in paper, from:
U.S. Department of Commerce National Technical Information Service 5285 Port Royal Road Springfield, VA 22161 phone: 800.553.6847 fax: 703.605.6900 email: [email protected] online ordering: http://www.ntis.gov/ordering.htm
Printed on paper containing at least 50% wastepaper, including 20% postconsumer waste

iii
List of Acronyms
DG distributed generation DER distributed energy resources DERTF Distributed Energy Resources Test Facility DR distributed resource(s) EPS electric power system GE General Electric Co. IED Intelligent Electronic Device IEEE Institute of Electrical and Electronics Engineers NDZ non-detection zone NREL National Renewable Energy Laboratory PJ phase jump ROCOF rate of change of frequency UI universal interconnection UR Universal Relay URPC Universal Relay PC

iv
Executive Summary
The General Electric Co. (GE) through subcontract NAD-1-30605-01 with the National Renewable Energy Laboratory (NREL) is developing a universal interconnection (UI) system to facilitate the safe and cost-effective integration and interoperation of distributed generation (DG) with the electric power system (EPS). To realize the potential benefits of increased efficiency and reliability, higher power quality, and decreased pollutants from distributed energy resources (DER), technical integration issues must be addressed to first ensure a safe and seamless interconnection between the distributed resource (DR) and the utility grid. Properly interconnected, the DR will neither negatively affect the grid nor pose a danger to personnel. Rather, it can provide beneficial ancillary services to the grid while supplying power for the DR owner. However, how to best accomplish this integration has not yet been resolved.
GE hopes to define, design, and demonstrate a DG-EPS interconnection interface that provides value to end users without compromising reliability or performance. The GE UI must be technology-neutral, modular, and scalable in both size and performance. Because it is adaptable and customizable, the interconnection device is “universal” as a platform upon which the functions required to maximize the economic and mechanical benefits of DG can be built, rather than as a single device that will allow all possible DG to be uniformly connected to any host EPS.
Under this subcontract, the first year (2001–2002) effort focused on modeling and study of interconnection issues. The study led to a conceptual interconnect design that took into account evolving market needs. One key criterion of the conceptual design was that it be technology-neutral to facilitate interconnection of various types of DG. These results are documented in the first annual report [1].
The second year (2002–2003) program has been aimed at development and testing of a UI hardware prototype. GE Global Research Center has been working with GE Multilin and GE Zenith Controls to identify interconnect product opportunities and introduce and expand a new product family for DG interconnection. The centerpiece of the design, the Intelligent Electronic Device (IED), is based on the existing GE Multilin Universal Relay (UR) product platform. The prototype UI panel was jointly defined by GE Research and GE Zenith Controls and packaged by GE Zenith.
There are two main developments for the UI box. One is the UI architecture, including breakers, power supply, sensors, fuses, and other hardware. The other development is the UI algorithms and functions. Most functions were previously available or easily programmable based on the existing UR platform. An exception was the anti-islanding function, which is the focus of this report.
This report on the last phase of the second year covers testing and evaluation of the UI box at GE and NREL.
The current version of the UI is a standalone unit. Because of this, the UI anti-islanding algorithms are based on local sensing only, referred to as passive schemes.

v
The objectives of the UI testing were to:
• Identify practical issues, such as noise and transient dynamics, and their effects on the protective algorithms
• Validate the computed and simulated non-detection zone (NDZ)
• Improve algorithms by parameter tuning and settings
• Develop new algorithms by combining schemes logically.
It was observed from testing that any single passive scheme that relies on monitoring local voltage, current, and frequency (or their derivatives) to detect loss of the utility has an NDZ. Different schemes have different zones. For a given scheme, inverter-interfaced DG has different NDZs from machine-interfaced DG.
The combined schemes (not including directional power protection) reduce the overall NDZ, but it is practically impossible to eliminate it by these methods. To guarantee a zero NDZ, directional power protection is necessary. The settings of the directional power protection should encompass the NDZ boundaries so that if the power flow changes, the directional power protection will trip before operation enters the passive scheme NDZ. The purpose of the NDZ study and testing is to provide smaller and more accurate boundaries that can be used for the settings of directional power protection. This way, the anti-islanding protection can be guaranteed while maximizing the availability of the DG.
During the UI study and development, two potential products were identified. One is the IED, which can be transitioned to a new relay product used for DG interconnection. The other is the overall UI panel, which can readily be used as DG interconnection equipment, particularly to retrofit existing on-site backup generation that lacks protective capabilities for parallel grid operation.
The testing results and observations can also be used to support the Institute of Electrical and Electronics Engineers Standard P1547.1 (the interconnection conformance testing draft standard) development of testing procedures and requirements.
This report summarizes preliminary testing and evaluation of the UI. The testing was conducted at the GE Research Lab and the NREL Distributed Energy Resources Test Facility. Testing at GE focused on inverter-based DG, and the testing at NREL examined machine-based DG.

vi
vii
Table of Contents List of Figures ...................................................................................................................................viii List of Tables........................................................................................................................................x 1. Introduction .............................................................................................................................1 1.1 Objective ...................................................................................................................... 1 1.2 Report Outline.............................................................................................................. 2 2. Testing Setup at the GE Lab..................................................................................................3 2.1 Overall System Diagram.............................................................................................. 3 2.2 DG Simulator ............................................................................................................... 3 2.3 RLC Load..................................................................................................................... 4 2.4 UI Box.......................................................................................................................... 5 2.5 Testing Instrumentations and Measurements............................................................. 11 3. Analytical and Simulated NDZ.............................................................................................12 3.1 Analytical NDZ.......................................................................................................... 12 3.2 Simulated NDZ .......................................................................................................... 15 4. UI Testing at GE Research Lab ...........................................................................................20 4.1 Testing for NDZ With All Elements Disabled........................................................... 20 4.2 Testing for NDZ With All Elements Enabled............................................................ 23 4.3 Testing Waveforms .................................................................................................... 25 5. UI Testing at NREL Lab ........................................................................................................31 5.1 NREL DERTF Background ....................................................................................... 31 5.2 Test Objectives........................................................................................................... 31 5.3 System Configuration and Electrical Equipment....................................................... 32 5.4 Requirements and Test Procedures ............................................................................ 34 5.5 Test Results ................................................................................................................ 35 5.6 Conclusions ................................................................................................................ 45 6. Summary................................................................................................................................46 6.1 Findings...................................................................................................................... 46 6.2 Comments on IEEE 1547 and P1547.1...................................................................... 47 6.3 Future Testing Needs ................................................................................................. 48 7. References.............................................................................................................................50 8. Appendix: Evaluation of Anti-Islanding Schemes Based on Non Detection
Zone Concept ........................................................................................................................51

viii
List of Figures
Figure 1. GE Research Lab UI testing setup diagram ........................................................... 3 Figure 2. DG simulator (AC/DC/AC converters) in GE lab ................................................. 4 Figure 3. RLC load in GE lab................................................................................................ 4 Figure 4. Universal interconnect design three-phase diagram .............................................. 5 Figure 5. Packaged GE UI panel ........................................................................................... 6 Figure 6. URPC interface ...................................................................................................... 7 Figure 7. URPC with oscillography ...................................................................................... 7 Figure 8. UI front panel ......................................................................................................... 8 Figure 9. A generic system for anti-islanding study............................................................ 13 Figure 10. Voltage and frequency change after grid disconnection ...................................... 13 Figure 11. NDZ of under/over voltage and under/over frequency with different quality factors....................................................................................................... 14 Figure 12. Comparison of simulated NDZ and analytical NDZ (Qf = 1.63) ........................ 16 Figure 13. Comparison of simulated NDZ and derived NDZ (Qf = 1.63) ............................ 17 Figure 14. NDZ comparison of PJ and under/over voltage/frequency.................................. 18 Figure 15. NDZ comparison of varying DG and RLC to generate power mismatch ........... 19 Figure 16. NDZ generated from testing data without 2-s response time requirement .......... 22 Figure 17. Simulated NDZ with RLC load with non-60 Hz resonant frequency.................. 23 Figure 18. NDZ with all elements enabled............................................................................ 25 Figure 19. Testing waveforms before islanding .................................................................... 26 Figure 20. Under voltage trip waveforms.............................................................................. 27 Figure 21. Over voltage trip waveforms................................................................................ 27 Figure 22. Under frequency trip waveforms ......................................................................... 28 Figure 23. Over frequency trip waveforms ........................................................................... 28 Figure 24. Waveforms with ROCOF (increasing) trip .......................................................... 29 Figure 25. Waveforms with ROCOF (decreasing) trip ......................................................... 29 Figure 26. NREL DERTF in Golden, Colorado.................................................................... 31 Figure 27. Diagram of the testing setup at NREL DERTF ................................................... 33 Figure 28. 200-kW grid simulator array................................................................................ 33 Figure 29. A 165-kW Titan load bank................................................................................... 34 Figure 30. Testing waveforms with 50-kW DG output, 100% DG/load power balance ...... 36 Figure 31. Testing waveforms with 50-kW DG output, 1.25-kW DG/load power mismatch .............................................................................................................. 37 Figure 32. Testing waveforms with 50-kW DG output, 0.125-kW DG/load power mismatch, and halved ROCOF setting................................................................. 38 Figure 33. Reactive power mismatch will not trip the UI ..................................................... 39 Figure 34. 10-kW resistive load step-up with base load of 50 kW, 90 kVAR L and C ........ 40 Figure 35. 50-kW resistive load step-up with base load of 50 kW and no reactive load ...... 40 Figure 36. Capacitor switching from 0 to 42.5 kVAR with 70-kW base load ...................... 41 Figure 37. The grid simulator momentarily zeros voltage on one phase .............................. 42 Figure 38. The grid simulator momentarily zeros voltage on all three phases...................... 42 Figure 39. The grid simulator momentarily drops voltage on two phases to 48% and increases the third voltage to 120% ..................................................................... 43

ix
Figure 40. After islanding, 1-kW load step causes UI to trip................................................ 44 Figure 41. After islanding, 500-W/s load ramping up to 3-kW total change did not trip the UI ............................................................................................................. 45 Figure 42. Elimination of NDZ by combining with directional power protection................ 47

x
List of Tables
Table 1. IEEE 1547 Requirements for Response to Abnormal Voltage and Frequency ....... 8 Table 2. UI Under Voltage Settings ....................................................................................... 9 Table 3. UI Over Voltage Settings ......................................................................................... 9 Table 4. UI Under Frequency Settings................................................................................. 10 Table 5. UI Over Frequency Settings................................................................................... 10 Table 6. UI ROCOF Settings ............................................................................................... 11 Table 7. Testing Results With All Elements Disabled......................................................... 21 Table 8. Testing Results With All Elements Enabled.......................................................... 24 Table 9. Results From Anti-Islanding NDZ Testing............................................................ 37

1
1 Introduction
1.1 Objective Testing is an issue of primary importance when dealing with equipment on utility systems. Substantial public safety and liability concerns are addressed through equipment testing, and this testing has a profound effect on engineers’ understanding and comfort levels. The interconnection interface, particularly, is a relatively new class of equipment used for new applications.
The objectives of the universal interconnection (UI) tests were to:
• Identify practical issues, such as noise and transient dynamics, and their effects on the algorithms. Without these inputs, the UI functions and algorithms cannot be verified. These factors sometimes play critical roles.
• Validate both the analytically derived and simulated non-detection zones (NDZs). Initially, NDZs for under/over voltage and under/over frequency were derived analytically. The analytical results provided insight into the dominant factors that affect NDZs. There are some assumptions in the analytical derivation—for example, the omission of quadratic terms. To verify the analytical results, a full model was built and run to simulate the NDZs. Once the NDZ models are validated, other cases and scenarios can be derived and simulated.
• Improve algorithms by parameter tuning and settings. Because of the practical conditions, UI functions and algorithms may vary in performance. Testing will help validate these functions. Tuning parameters while the UI is coupled with real operating conditions will further improve the algorithms and the real-world performance of the UI.
• Develop new algorithms by combining schemes logically. The results of the physical testing can provide additional insights not discovered through simulation. These insights can help researchers better understand system behavior and lead to new algorithms.
The testing at General Electric (GE) Research Laboratory used a three-phase rectifier-inverter system to simulate inverter-based distributed generation (DG). The testing at the National Renewable Energy Laboratory (NREL) used a commercially available diesel generator for DG.
It was observed from the testing that any single passive scheme has an NDZ. Different schemes have different zones. For a given scheme, inverter-interfaced DG would have a different NDZ from machine-interfaced DG.
The combined schemes (not including the directional power protection scheme) normally lead to a reduced overall NDZ, but it is extremely difficult to eliminate the NDZ. Theoretically, if the load resonant frequency is the same as the line frequency (60 Hz) and the DG/load power is 100% balanced, when the grid disconnects, the islanded DG and load system will have the same voltage and frequency as before islanding. As a result, any passive scheme that relies on detecting voltage and frequency (or their derivatives) can fail. These schemes include but are not limited to under/over voltage, under/over frequency, rate of change of frequency

2
(ROCOF), phase or vector jump, harmonic monitoring, and rate of change of power/voltage/power factor. Some of these schemes are found in publications only; others are available in current relay products.
Besides the NDZ, another issue of passive schemes is nuisance tripping. System disturbances may cause momentary voltage and frequency variations. If the variations are large enough, passive schemes may detect an islanding event, resulting in a nuisance trip. Therefore, when choosing the settings of the passive schemes, there is a trade-off between reliability and safety. Raising these settings leads to more reliable performance but a larger NDZ. Vice versa, tighter settings can reduce the NDZ but tend to increase the likelihood of nuisance tripping.
One way to guarantee a zero NDZ is to incorporate directional power protection. The directional power thresholds are set based on minimum and maximum local load as well as the NDZ boundaries so that the directional power protection will trip before the DG operates inside the NDZ. This principle will be illustrated later. A smaller NDZ leads to lower directional power settings and greater DG availability. Directional power protection can guarantee anti-islanding protection; however, the availability of the DG will be reduced.
During the UI project, two potential products were identified. One is the Intelligent Electronic Device (IED), which can transition to a new relay product for DG interconnection. The other is the overall UI panel, which can readily be used as DG interconnection equipment, particularly to retrofit existing on-site backup generation that lacks protection capabilities for parallel grid operation.
The testing results and observations can also be used to support Institute of Electrical and Electronics Engineers (IEEE) P1547.1 (interconnection conformance testing draft standard) development through better definition and rationale of testing procedures.
1.2 Report Outline Chapter 2 covers the test setup at GE Research Lab. The setup is consistent with P1547.1 testing requirements.
In Chapter 3, to better explain NDZs, some analytical and simulation results are presented. These results provide insight into the dominant factors influencing NDZs. They are also helpful guides for later testing.
Preliminary testing results carried out at the GE Lab are presented in Chapter 4.
After testing at GE, the UI box was shipped to NREL for testing at the NREL Distributed Energy Resources Test Facility (DERTF). The testing was carried out with a diesel generator. These test results are included in Chapter 5.
Chapter 6 presents preliminary findings and comments regarding P1547.1. Additional testing is also recommended.

3
2 Testing Setup at the GE Lab
2.1 Overall System Diagram The GE test facility was primarily set up for anti-islanding testing. Figure 1 shows the system one-line diagram, which is consistent with the anti-islanding testing circuit in P1547.1.
The grid is directly connected from the wall power inlet in the lab. For testing purposes, the load is considered to be the area electric power system (EPS) load. The grid disconnection can be initiated by opening either S3 or Sg. S3 is opened manually; opening Sg can be commanded by the UI either from the UI front panel or through the remote computer interface. For convenient testing purposes, Sg is used as the grid disconnect. The UI isolation occurs by opening Sd. In practical applications, Area EPS load will be connected between switches S3 and Sg, and either Sg or Sd can disconnect the DG from the utility. If Sg is opened and the UI keeps Sd closed, the standalone DG will be able to supply local (RLC) load as needed while being isolated from the grid.1
AC/DC/AC
Grid
S3
S1
(S2)
Sg Sd
QP ∆∆ , DGDG QP ,UI Box
RLCLoad
LoadLoad QP ,
DGSimulatorDG
DG
fV
Grid
Grid
fV
Figure 1. GE Research Lab UI testing setup diagram
2.2 DG Simulator The DG simulator comprises AC/DC/AC back-to-back converters, three-phase line inductors, and a Delta/Wye transformer. It converts grid AC to a controllable AC output, either as a voltage or a current source. As for the DG simulator, the converters are controlled as a current source with adjustable current reference (IRMS) and power factor (pf) to result in adjustable active power (PDG) and reactive power (QDG) output. The rated power of the DG simulator is 100 kW. Figure 2 shows the DG simulator cabinet.
1 The test in the GE lab uses Sg as grid open contact for the convenience of trip time recording. The logic code is modified later. The
shipped UI uses S3 as grid open contact to facilitate NREL testing.

4
This DG simulator system can represent a microturbine or any distributed generator with an inverter as an interconnection interface.
2.3 RLC Load Although the DG simulator has 100 kW capability, the available load in the lab is limited to only 15 kW and 25 kVAR. The inductor has values of 25 mH or 50 mH with rated current of 30 A. The resistive load bank is 5 kW, 10 kW, or 15 kW. The capacitance has 20-uF increments up to 300 uF with 30 A rated current. The RLC load is in a star connection. Figure 3 shows the RLC load in the lab.
To improve measurement accuracy, a 15-kW resistive load is used (R = 15.36 Ohm). Inductance (L) is chosen as 25 mH, and C is 280 uF. The resulting quality factor, Qf , is:
63.1=⋅= LCRQ f .
Although it is not 1.8—which is selected by IEEE P1547.1 and is considered the worst practical condition—it is close enough to demonstrate the concepts.
Another limitation of the load is that it is not convenient to make small variations. To generate an NDZ, power mismatch between load and DG should be created. In the testing, because of limited load variation, the DG simulator output was varied to obtain DG/load power mismatch. Analysis and simulations were conducted to verify their equivalency. Interestingly, it was found that the NDZ generated by varying RLC is different from the NDZ generated by varying DG output. Detailed results are presented in Chapter 3.
Figure 2. DG simulator (AC/DC/AC converters) in GE lab
Figure 3. RLC load in GE lab

5
2.4 UI Box
2.4.1 General Information Figure 4 shows the UI three-phase diagram.
Universal Interconnect (UI)
1ANREL 2002 UI Project
06/06/02 -- MED
Sheet #
Issued Date --- Initials:
Revision Date -- Initials:
01
04
07
10
13
16
19
22
25
28
31
34
37
40
43
46
Proprietary Information Do Not Copy
Firmware Revision:
01
04
07
10
13
16
19
22
25
28
31
34
37
40
43
A B C D E F G H I J K L M N O P Q R S T U
A B C D E F G H I J K L
GE Global ResearchNiskayuna, New York
DRAW ING TITLE:
DRAWING Number:
gCont. on Sheet : 1B
10/30/02 -- ZY
A B C N
g
INSIDE THE UI BOX
COMPUTERINTERFACE
PC HMI
E-STOP
BUTTONS
E-STOP SWITCHINTERFACE
CIRCUITBREAKER
150amp
CIRCUITBREAKER
150amp
CONTACTORCONTROL
CT RATED PRIMARY: 1 to 50000CT RATED SECONDARY: 1A or 5ANOMINAL FREQUENCY: 20 to 65HZ
VT RATED SEC: 50 to 240VVT RATIO: 0.1 to 24000.0NOMINAL FREQUENCY: 20 to 65HZCONVERSION RANGE: 1 to 275V
IA, IB & ICCURRENT CT
.
.
.
.
V1LN, V2LN & V3LNVOLTAGE VT
CT RATED PRIMARY: 1 to 50000CT RATED SECONDARY: 1A or 5ANOMINAL FREQUENCY: 20 to 65HZ
VT RATED SEC: 50 to 240VVT RATIO: 0.1 to 24000.0NOMINAL FREQUENCY: 20 to 65HZCONVERSION RANGE: 1 to 275V
.
.
.
.
IA, IB & ICCURRENT CT
A
C
N
B
A
C
N
B
V1LN, V2LN & V3LNVOLTAGE VT
INCURRENT CT
DG
CO
NN
EC
TIO
N
GR
IDC
ON
NEC
TIO
N
CONTROLRELAY
CONTROLRELAY
CONTROLRELAY
PO
WE
RS
UP
PLY
BatteryCharger
CT TESTSWITCHES
PT TESTSWITCHES
LOAD CONNECTION
PT TESTSWITCHES
CT TESTSWITCHES
CB CB
Contact Contact
PTCT PT CT
DG
INTE
RFA
CE
UI IED
UI PCD
Figure 4. Universal interconnect design three-phase diagram
The main components of the UI box are:
• UI IED, which is based on the G60 platform of the GE Universal Relay (UR) family. The UI IED can be operated through the front panel display or from a remote computer through a network connection.
• Two contactors, configured to facilitate a variety of applications, that are controlled by the UI IED. The local load is connected in between the two contactors. When both Sg and Sd in Figure 1 are closed, the DG is in grid-parallel operation, where power can be either imported from or exported to the grid. When Sg is open, the DG can either continue to supply the local load by keeping Sd closed (called standalone operation) or shut down and open Sd to keep the load isolated from the DG.
• Two circuit breakers for emergency protection.
• Potential transformers and current transducers for both grid side and DG side to meet flexible application needs. The potential transformer ratio is 4:1; the current transducer ratio is 5:1.
• Power supply designed for the UI IED, contact relays, and a battery charger.

6
Figure 5 shows the packaged UI panel.
Figure 5. Packaged GE UI panel
Besides the UI hardware, another key component of the UI is its human-machine interface, called Universal Relay PC (URPC) [2]. It can view actual values, record events for troubleshooting, display contact status, view/edit settings off-line with the setting file manager, create and edit custom scheme logic, and more, as shown in Figure 6. It can also monitor the waveforms and download oscillography in Comtrade format. A sample oscillography display is shown in Figure 7.

7
Figure 6. URPC interface
Figure 7. URPC with oscillography

8
2.4.2 UI Settings and Operations The UI settings and operations can be done either from the front panel or a remote PC. Figure 8 shows the UI front panel. The same panel display can also be viewed in the URPC.
Because the testing is focused on anti-islanding, many other elements not related to anti-islanding such as volt/hertz protection and accidental energization are disabled.
Table 1 lists 1547 under/over voltage and under/over frequency settings.
Figure 8. UI front panel
Table 1. IEEE 1547 Requirements for Response to Abnormal Voltage and Frequency
Voltage Range (% of Base Voltagea) Clearing Timeb (s)
V < 50% 0.16 50% ≤ V < 88% 2 110% < V < 120% 1 V ≥ 120% 0.16
Notes: (a) Base voltages are the nominal system voltages stated in ANSI C84.1 Table 1. (b) DR ≤ 30 kW, maximum clearing times; DR > 30 kW, default clearing times.
DR Size Frequency Range (Hz) Clearing Timea (s)
> 60.5 0.16 ≤ 30 kW < 59.3 0.16 > 60.5 0.16 < {59.8 to 57.0} (adjustable set point)
Adjustable 0.16 to 300 >30 kW
< 57.0 0.16 Notes: (a) DR ≤ 30 kW, maximum clearing times; DR > 30 kW, default clearing times.

9
Based on the 1547 requirements, UI settings can be programmed in URPC. Tables 2 to 5 list the UI under/over voltage and under/over frequency settings. Most settings are consistent with 1547 requirements, except for the over voltage element. There is only one over voltage element available in the current firmware version. This element is programmed for 110% over voltage protection. The 120% fast response protection is not tested (although it can be programmed using FlexLogic). The second over voltage protection element is planned to be included in the next firmware release.
Table 2. UI Under Voltage Settings
Table 3. UI Over Voltage Settings

10
Table 4. UI Under Frequency Settings
Table 5. UI Over Frequency Settings
Besides the baseline under/over voltage and under/over frequency protection, UI employs ROCOF as an additional means for anti-islanding protection. A disturbance-blocking function is used to avoid nuisance tripping because of system disturbances. The synchronous check function is also enabled when the DG is off or the DG and the grid have already synchronized; then the contacts can close in (command close). In any other cases, the contacts are blocked from closing.
The ROCOF has four elements (with three elements enabled in the testing) to have an inverse time characteristic to improve its selectivity and security. The settings are shown in Table 6.
Besides ROCOF, harmonics monitoring was also explored during the testing.

11
Table 6. UI ROCOF Settings
2.5 Testing Instrumentations and Measurements Two measurement devices are used in the testing. One is a Yokogawa PZ 4000 oscilloscope. The other is the URPC metering function. The oscilloscope records four waveforms: grid-side single-phase voltage and current and DG-side single-phase voltage and current. The UI can record oscillographic waveforms but updates slowly. The DG steady-state voltage magnitude, frequency, and grid-side power (power mismatch ∆P and ∆Q) are measured by the UI. These readings were verified by the oscilloscope measurement. The UI can also record events, which helps trace which element tripped.

12
3 Analytical and Simulated NDZ
To better explain the NDZ, this section presents some analytical and simulation results. These results provide some insights into dominant factors influencing the NDZ. They are also helpful to guide the testing.
3.1 Analytical NDZ Many anti-islanding schemes have been reported in the past. However, there is not a single one that is well accepted in terms of performance (effective and reliable), cost (minimal hardware or system infrastructure requirements), and neutrality with respect to DG technology (applicable to interconnections for different distributed generators). Passive anti-islanding schemes (defined as using local voltage and current sensing only) have cost and technology-neutral merits, but their effectiveness can be questioned. Active anti-islanding schemes (defined as using measures other than local voltage and current sensing, such as active signal injection and communication with DG and/or the grid) are generally considered more effective than passive ones. However, they are more costly or not technology-neutral if integrated with DG control. Some active schemes may not work properly for multiple distributed resources (DR). Furthermore, although not yet fully explored, it is suspected that some active schemes may have an adverse effect on grid dynamics.
There is a need to define a performance index to evaluate different anti-islanding schemes. Because the active schemes are realized differently from case to case, it is difficult to evaluate and compare their performances. Passive schemes, however, are normally technology-neutral and could be evaluated based on a common performance index that can be derived from system characteristics.
The objective of this section is to evaluate passive anti-islanding schemes. Two steps are taken for the evaluation:
1. Define a performance index for evaluation. The performance index is the NDZ, which is defined in DG/load power mismatch (∆P and ∆Q) space. That is, given small enough ∆P and ∆Q, the frequency and voltage deviation after islanding will not be large enough for anti-islanding devices to detect grid disconnection within a prescribed time period. NDZ can also be defined in RLC load space. However, it is not generic enough to cover active load such as a motor load.
2. Map the NDZs of different anti-islanding schemes into the power mismatch space to evaluate their performance; the smaller the NDZ, the more effective the scheme.
Initially, three passive schemes are identified and evaluated. They are:
1. Under/over voltage 2. Under/over frequency 3. Phase jump (PJ).
The methodology can be extended to other schemes, such as ROCOF.

13
Addition analysis is given in the IEEE paper in the appendix. Some of the results are presented below.
A generic system for anti-islanding study is shown in Figure 9. The circuit is the same as the anti-islanding testing diagram defined in UL 1741, IEEE 929, and IEEE 1547 [8, 7].
Grid DGR L C
S1 S2
QP ∆∆ , QP,
QQPP ∆+∆+ ,
fV ,
Figure 9. A generic system for anti-islanding study
In practical conditions, there is always some power mismatch between DG output and the load of the Area EPS because of dynamic load profiles. Here, the worst-case load is represented by RLC according to the testing conditions defined in UL 1741 and P1547.1. The mismatched load can be represented by ( CCLLRR ∆+∆+∆+ ,, ). Before the grid is disconnected, the power mismatch will be compensated by the grid by supplying or absorbing the difference when 0≠∆P , 0≠∆Q (equivalent to CLR ∆∆∆ ,, ), and the voltage V and frequency f are regulated by the grid. When the grid is disconnected, the voltage and frequency will be forced to new values, fandV ′′ , if the DG is controlled as a constant power source, shown in Figure 10.
Figure 10. Voltage and frequency change after grid disconnection
Grid DG
S1 S2
0, =∆∆ QP QP,fV ′′,
RR ∆+ CC ∆+LL ∆+
QP,

14
When the power mismatch ( QP ∆∆ , ) is large enough, fV ′′, may be out of nominal ranges and trigger under/over voltage/frequency protection to open the switch S2 to prevent island operation. The relationship between the power mismatch thresholds and voltage/frequency thresholds can be derived as:
1)(1)( 2
min
2
max−≤
∆≤− V
VPP
VV (1)
))(1())(1( 2
max
2
min ffQ
PQ
ffQ ff −⋅≤
∆≤−⋅ (2)
where Vmax, Vmin, fmax, and fmin are under/over voltage and under/over frequency thresholds, respectively. Typically, Vmax = 110% V, Vmin = 88% V, fmax = 60.5 Hz, fmin = 59.3 Hz.
Then, for Qf = 1.8, there are
%13.29%36.17 ≤∆
≤−PP
%96.2%27.4 ≤∆
≤−PQ .
Equations (1) and (2) indicate that if the power (active and reactive) mismatch is within the specified thresholds—which are a function of voltage and frequency thresholds as well as Qf—the resulting voltage and frequency will remain within the nominal ranges even after the grid is disconnected. As a result, an island may be formed and persist without being detected. Equations (1) and (2) form an area that is defined as the NDZ, as shown in Figure 11.
Non Detection Zone of UOVF
-10.00%
-8.00%
-6.00%
-4.00%
-2.00%
0.00%
2.00%
4.00%
6.00%
8.00%
10.00%
-40.00% -30.00% -20.00% -10.00% 0.00% 10.00% 20.00% 30.00% 40.00%
Active Power Mismatch (%)
Rea
ctiv
e Po
wer
Mis
mat
ch (%
)
UV-1.63OV-1.63UF-1.63OF-1.63UV-2.5OV-2.5UF-2.5OF-2.5
Figure 11. NDZ of under/over voltage and under/over frequency with different quality factors

15
A few salient points from the results are:
• Under/over voltage and under/over frequency have a large NDZ, e.g., 4.27% (Qf = 1.8) reactive power mismatch and even 29% active power mismatch, given their typical settings.
• Reactive power mismatch is more sensitive (4.27% with Qf = 1.8) than active power mismatch (29%).
• For a tightly controlled constant power DG (e.g., inverter-based DG), under/over voltage NDZ is dominated by active power mismatch, and under/over frequency is dominated by reactive power mismatch. This is different from synchronous machine-based DG for which high-bandwidth control of real and reactive power is impractical. The study of NDZ for synchronous machine-based DG is under way and will be reported separately.
• The smaller the Qf, the smaller the NDZ because the reactive power mismatch boundary shrinks when Qf is reduced. The marked NDZ in Figure 11 has Qf = 1.63. The unmarked NDZ has Qf = 2.5.
The NDZ is based on steady-state results, which implies two assumptions. One is that there is no dynamic voltage and/or frequency overshoot or undershoot that exceeds the thresholds for a period long enough to trigger the under/over voltage or frequency protection. In that case, the derived NDZ is more conservative, i.e., the actual NDZ could be smaller because of the transient. The other assumption is that the DG takes less than 2 s to reach steady state. The anti-islanding response time requirement from IEEE and other technical standards is 2 s. If the DG dynamic settling time is longer than 2 s, the actual NDZ may be larger than the derived NDZ.
3.2 Simulated NDZ Simulations of a DG/grid/RLC load system have validated the analytical results. The grid is represented by a voltage source behind an impedance. An inverter with constant power control is used as the DG model. Figure 12 shows the comparison of the analytical and simulated NDZs. There is some discrepancy caused by the omission of quadratic terms in the analysis, but the analytically determined NDZ is deemed sufficiently accurate for this study.

16
Analytical and Simulated NDZ
-10.00%
-8.00%
-6.00%
-4.00%
-2.00%
0.00%
2.00%
4.00%
6.00%
8.00%
10.00%
-40.00% -30.00% -20.00% -10.00% 0.00% 10.00% 20.00% 30.00% 40.00%
Active Power Mismatch (%)
Rea
ctiv
e Po
wer
Mis
mat
ch (%
)UV-simOV-simUF-simOF-simUV-anaOV-anaUF-anaOF-ana
Figure 12. Comparison of simulated NDZ and analytical NDZ (Qf = 1.63)
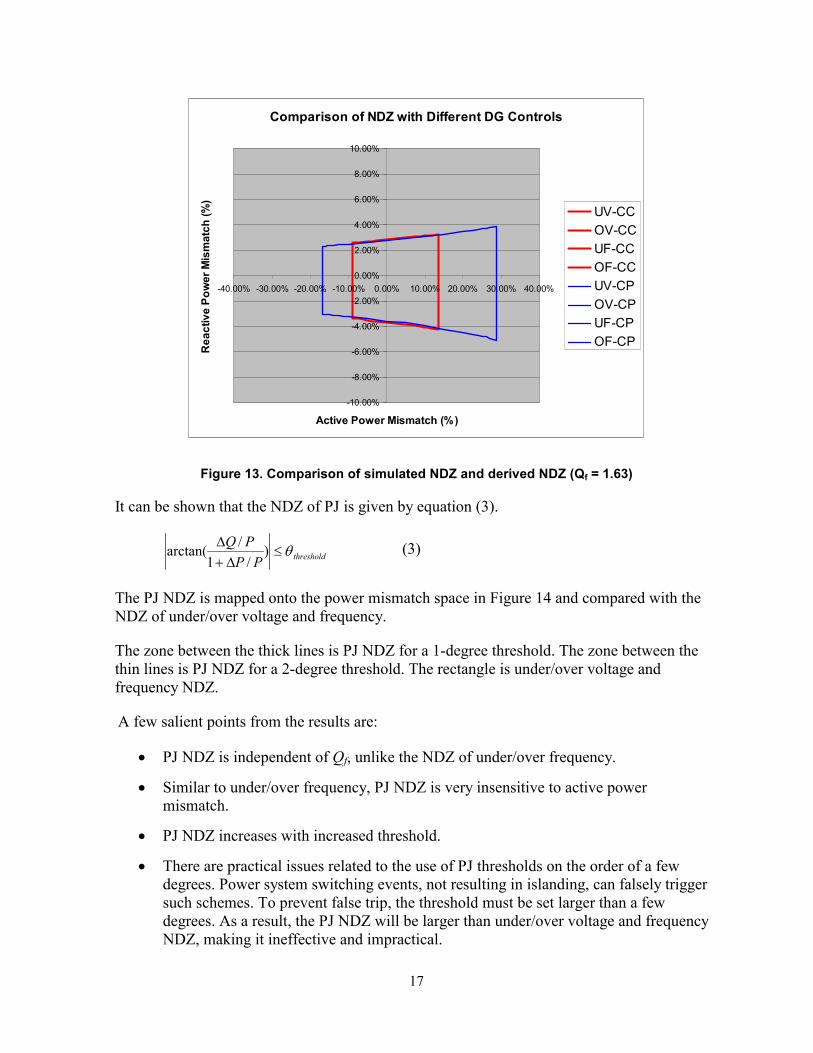
One interesting finding from the simulation is that different DG controls may lead to different NDZs. Initially, a constant power-controlled DG was used to simplify the analysis. Simulation with a constant current-controlled DG was carried out because the DG simulator is constant current-controlled. It was found that the NDZ of the constant current-controlled DG is smaller than the one for the constant power-controlled DG, as shown in Figure 13. The under/over frequency boundaries do not change, and the under/over voltage boundaries shrink significantly.
17
Comparison of NDZ with Different DG Controls
-10.00%
-8.00%
-6.00%
-4.00%
-2.00%
0.00%
2.00%
4.00%
6.00%
8.00%
10.00%
-40.00% -30.00% -20.00% -10.00% 0.00% 10.00% 20.00% 30.00% 40.00%
Active Power Mismatch (%)
Rea
ctiv
e Po
wer
Mis
mat
ch (%
)UV-CCOV-CCUF-CCOF-CCUV-CPOV-CPUF-CPOF-CP
Figure 13. Comparison of simulated NDZ and derived NDZ (Qf = 1.63)
It can be shown that the NDZ of PJ is given by equation (3).
thresholdPPPQ θ≤
∆+∆ )
/1/arctan( (3)
The PJ NDZ is mapped onto the power mismatch space in Figure 14 and compared with the NDZ of under/over voltage and frequency.
The zone between the thick lines is PJ NDZ for a 1-degree threshold. The zone between the thin lines is PJ NDZ for a 2-degree threshold. The rectangle is under/over voltage and frequency NDZ.
A few salient points from the results are:
• PJ NDZ is independent of Qf, unlike the NDZ of under/over frequency.
• Similar to under/over frequency, PJ NDZ is very insensitive to active power mismatch.
• PJ NDZ increases with increased threshold.
• There are practical issues related to the use of PJ thresholds on the order of a few degrees. Power system switching events, not resulting in islanding, can falsely trigger such schemes. To prevent false trip, the threshold must be set larger than a few degrees. As a result, the PJ NDZ will be larger than under/over voltage and frequency NDZ, making it ineffective and impractical.

18
Non Detection Zone of UOVF & PJ
-10.00%
-8.00%
-6.00%
-4.00%
-2.00%
0.00%
2.00%
4.00%
6.00%
8.00%
10.00%
-40% -30% -20% -10% 0% 10% 20% 30% 40%
Active Power Mismatch (%)
Rea
ctiv
e Po
wer
Mis
mat
ch (%
)PJ-1degPJ-1degPJ-2degPJ-2degUV-2.5OV-2.5UF-2.5OF-2.5
Figure 14. NDZ comparison of PJ and under/over voltage/frequency
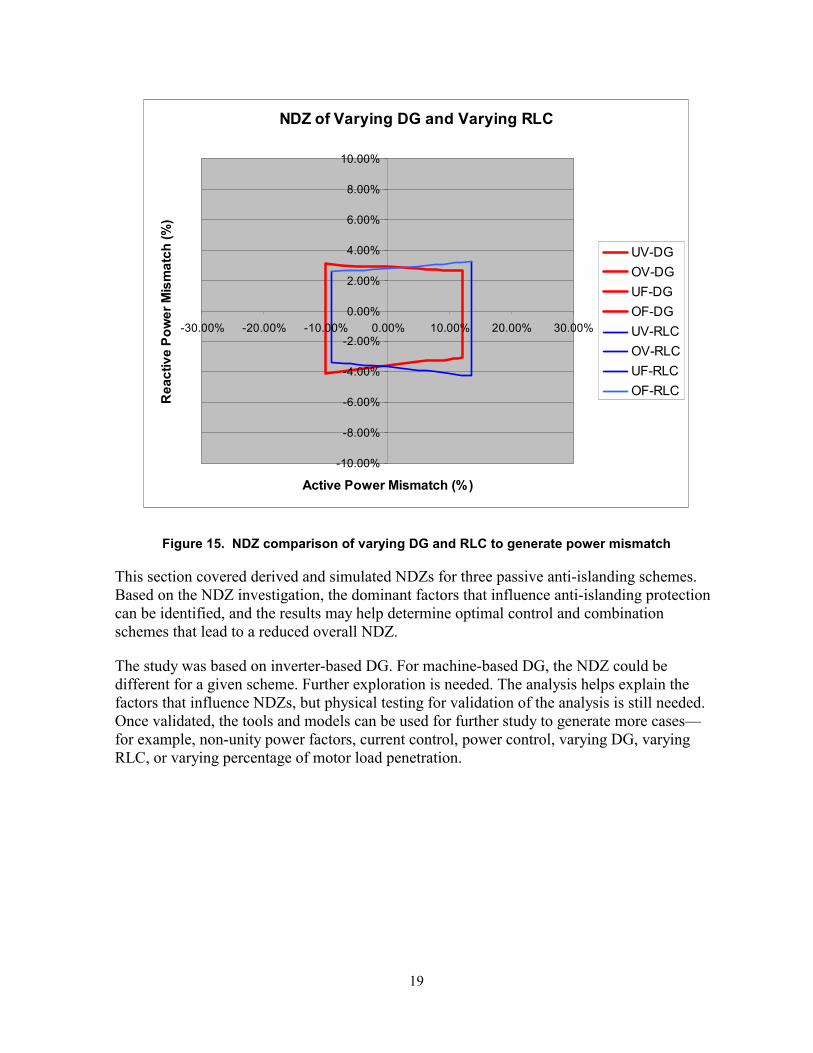
Because of the limitation of the experiment, the power variation is done by varying DG instead of varying RLC. The NDZs of these two approaches are analyzed, and Figure 15 shows the results. The blue box with wider right side is varying RLC; the red one with wider left side is varying DG. Both are constant current-controlled. Their shapes look like mirror images of each other.
19
NDZ of Varying DG and Varying RLC
-10.00%
-8.00%
-6.00%
-4.00%
-2.00%
0.00%
2.00%
4.00%
6.00%
8.00%
10.00%
-30.00% -20.00% -10.00% 0.00% 10.00% 20.00% 30.00%
Active Power Mismatch (%)
Rea
ctiv
e Po
wer
Mis
mat
ch (%
)
UV-DGOV-DGUF-DGOF-DGUV-RLCOV-RLCUF-RLCOF-RLC
Figure 15. NDZ comparison of varying DG and RLC to generate power mismatch
This section covered derived and simulated NDZs for three passive anti-islanding schemes. Based on the NDZ investigation, the dominant factors that influence anti-islanding protection can be identified, and the results may help determine optimal control and combination schemes that lead to a reduced overall NDZ.
The study was based on inverter-based DG. For machine-based DG, the NDZ could be different for a given scheme. Further exploration is needed. The analysis helps explain the factors that influence NDZs, but physical testing for validation of the analysis is still needed. Once validated, the tools and models can be used for further study to generate more cases—for example, non-unity power factors, current control, power control, varying DG, varying RLC, or varying percentage of motor load penetration.

20
4 UI Testing at GE Research Lab
The objective of the preliminary testing is to validate derived and simulated NDZ results and test the effectiveness of the anti-islanding function with combined schemes, including ROCOF.
The testing was carried out in two steps.
1. Generate under/over voltage and under/over frequency NDZs. In this test, all elements are disabled. Steady-state voltage and frequency are recorded after the grid is disconnected. This test, considering steady-state values without the 2-s response time requirement, is to validate the NDZs found by derivation and simulation.
2. Test with all elements enabled, including ROCOF, to generate NDZ boundaries with a 2-s response time requirement.
4.1 Testing for NDZ With All Elements Disabled To generate the NDZ, an appropriate test sample table is needed. The goal is to collect enough data to obtain a mathematical equation while ensuring the number of data is not prohibitive for conducting testing. Based on the number of inputs (∆P, ∆Q, and Qf) and the number of outputs (voltage, frequency), an appropriate test sample table can be generated based on rigorous statistical techniques. In the testing, central composite design, one common response surface, is used. It requires a minimum of eight runs to cover the variation in the full space. To improve accuracy and minimize noise effect, 15 runs were carried out.
Before the 15 test runs, the load base power is measured to convert the percentage of the power mismatch. The measurement is done by connecting the grid to the load without the DG simulator connected.
The testing procedure is:
1. Close in grid contact.
2. Close in load contact; wait for it to reach steady state.
3. Start DG simulator; wait until the DG simulator is fully charged and synchronized with the grid.
4. Set DG simulator current IRMS and power factor references, and wait to reach steady state; at this time, the load is supplied by both the grid and the DG.
5. Read and record the active power and reactive power at the grid side; these are the power mismatch (∆P, ∆Q) between DG and load.
6. Open grid contact to create an island.
7. Wait until new steady state; because all UI elements are disabled, no trigger will be initiated even if the voltage and frequency are out of nominal ranges.
8. Read and record the new steady-state voltage and frequency of the DG side.

21
9. Shut down DG simulator.
10. Repeat steps 1 to 9 with different current and power factor references in Step 4.
Table 7 shows the testing results.
Table 7. Testing Results With All Elements Disabled
Run DeltaP DeltaQ Vt (V) Freq (Hz)1 -6.56% -4.38% 304 60.152 1.25% -3.44% 283.5 59.143 -8.59% 26.25% 318.5 64.794 12.50% 23.13% 254.5 63.235 11.88% -2.19% 252.6 58.296 7.19% 23.59% 270.5 63.577 6.56% -3.13% 268.2 58.688 17.19% -1.69% 237.2 57.949 1.69% 24.38% 287 63.91
10 -3.13% -10.31% 293.3 58.7811 2.94% 10.31% 280.7 61.3212 2.19% -9.38% 279.5 58.1213 17.50% 21.88% 238.7 62.9114 -9.38% -11.88% 305.4 59.715 -9.38% -5.00% 310 60.59
The relationship between the input (∆P, ∆Q) and the output (voltage, frequency) can be obtained through data regression techniques. The equations are shown below:
Vt = 287.23 - 280.43 * ∆P + 21.45 * ∆Q - 74.87 * ∆P * ∆Q - 54.34 * ∆P * ∆P (4)
Freq = 59.95 - 12.02 * ∆P + 16.47 * ∆Q + 27.4 * ∆P * ∆Q + 13.63 * ∆P * ∆P (5)
Based on these equations, the NDZ boundaries (∆P, ∆Q) can be solved given the voltage and frequency thresholds. The NDZ is plotted in Figure 16.

22
Figure 16. NDZ generated from testing data without 2-s response time requirement
The NDZ from testing is much different from the derived and simulated results. This means that the practical conditions have a significant effect on the NDZ. The difference is due in part to differences between modeled and actual parameters. For example the RLC load resonant frequency is only approximately tuned to 60 Hz, and the DG control, coupled with load dynamics, cannot be an ideal current source. Other factors are still under investigation.
For generating NDZs of under/over voltage and frequency, it is initially assumed that the DG will reach steady state within 2 s. However, it was observed that the voltage can reach steady state within 2 s, but the frequency takes much longer (more than 10 s). Therefore, the predictions for frequency NDZ boundaries vary greatly from the testing results.
One simulation was carried out with a load that has non-60 Hz resonant frequency. It was found that the shape of the NDZ is similar to the experimental findings, but the boundaries are still not the same. This means that the load resonant frequency does dominate the shape of the NDZ. The simulated NDZ is shown in Figure 17.
NDZ from Testing Data
-15.00%
-10.00%
-5.00%
0.00%
5.00%
10.00%
-20.00% -15.00% -10.00% -5.00% 0.00% 5.00% 10.00% 15.00% 20.00%
Active Power Mismatch (%)
Rea
ctiv
e P
ower
Mis
mat
ch (%
)UVOVUFOF

23
Figure 17. Simulated NDZ with RLC load with non-60 Hz resonant frequency
4.2 Testing for NDZ With All Elements Enabled When all elements are enabled along with the 2-s requirement, the actual NDZ can be generated. Because of the 2-s requirement, the NDZ will be larger than the NDZ from derivation and simulation based on steady-state data.
The testing procedure is:
1. Close in grid contact.
2. Close in load contact; wait for it to reach steady state.
3. Start the DG simulator, and wait until the DG simulator is fully charged and synchronized with the grid.
4. Set DG simulator current IRMS and power factor references, and wait to reach steady state; at this time, the load is supplied by both grid and the DG.
5. Read and record the active power and reactive power at the grid side; these are the power mismatch (∆P, ∆Q) between DG and load.
6. Open grid contact to create an island.
7. If the UI trips and opens DG contact, read and record waveforms, record trip time between grid contact opening and DG contact opening by anti-islanding protection. Record trip event (trip on which element). If the UI does not trip after 10 s, shut down the DG simulator.
NDZ from Simulation
-15.00%
-10.00%
-5.00%
0.00%
5.00%
10.00%
-20.00% -15.00% -10.00% -5.00% 0.00% 5.00% 10.00% 15.00% 20.00%
Active Power Mismatch (%)
Rea
ctiv
e P
ower
Mis
mat
ch (%
)
UVOVUFOF

24
8. Repeat steps 1 to 7 with different current and power factor references in Step 4. The change of the references should be small enough to result in no more than a 1% change of the power mismatch between two consecutive testings.
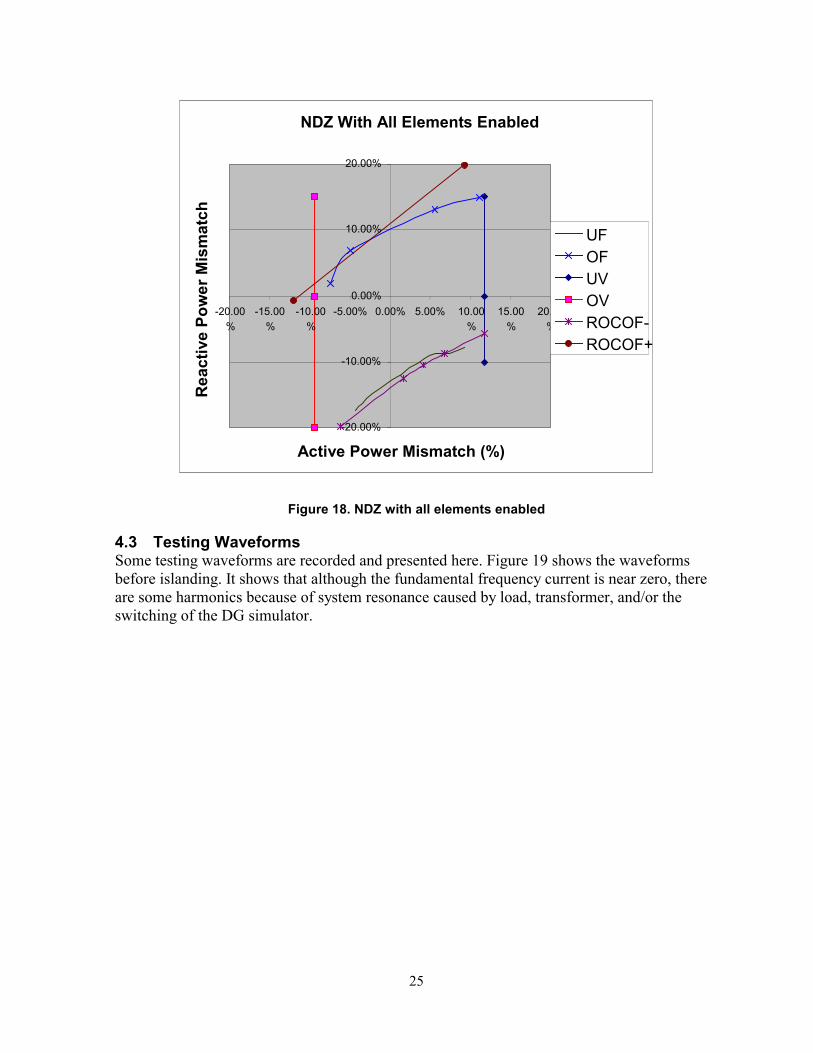
Table 8 shows the testing results. The cases with tripping timed much longer or shorter than 2 s are not included in the table. Therefore, the power mismatch (∆P, ∆Q) in the table is at or near the boundaries. The NDZs based on these boundaries are plotted in Figure 18. Two major observations can be made:
1. Because of the 2-s requirement, the NDZ is significantly larger than the NDZ from derivation and simulation based on steady-state data. The frequency trip boundaries are particularly larger because of the slow frequency settling time.
2. The ROCOF does not reduce the NDZ for the inverter DG with the given settings.
Table 8. Testing Results With All Elements Enabled
DeltaP DeltaQ Tripping Time Tripping Element 11.88 - 1.95 under - - 1.8 over 9.32 - 2.02 under 7.45 - 2.15 under 4.97 - 2.4 under
- - 2.23 under - - 2.2 under 5.59 13.04 1.78 over
11.18 14.91 1.9 over - 6.83 1.7 over - 1.86 2.3 over 11.80 - trip rocof6.83 - trip rocof4.04 - trip rocof1.55 - trip rocof
- - trip rocof
25
NDZ With All Elements Enabled
-20.00%
-10.00%
0.00%
10.00%
20.00%
-20.00 %
-15.00 %
-10.00 %
-5.00% 0.00% 5.00% 10.00%
15.00%
20.00%
Active Power Mismatch (%)
Rea
ctiv
e Po
wer
Mis
mat
ch
UF OF UV OV ROCOF- ROCOF+
Figure 18. NDZ with all elements enabled
4.3 Testing Waveforms Some testing waveforms are recorded and presented here. Figure 19 shows the waveforms before islanding. It shows that although the fundamental frequency current is near zero, there are some harmonics because of system resonance caused by load, transformer, and/or the switching of the DG simulator.

26
Figure 19. Testing waveforms before islanding (Trace 1: grid-side phase-A voltage; Trace 2: grid-side phase-A current; Trace 3: DG-side phase-A voltage; Trace 4: DG-side phase-A current)
Figure 20 shows the waveforms of an under voltage trip after islanding. After the DG contact opens, the DG loses the load, and the voltage goes very high, which triggers the DG simulator’s own over voltage protection.
Figure 21 shows the waveforms with over voltage trip after islanding.
Another observation from figures 20 and 21 is that, although the DG simulator is constant-current controlled, the current waveform after islanding is not exactly the same as before islanding. This will introduce some difference between the experiment and the derivation and simulation, which assumes constant-current DG even after islanding.

27
Figure 20. Under voltage trip waveforms
Figure 21. Over voltage trip waveforms
28
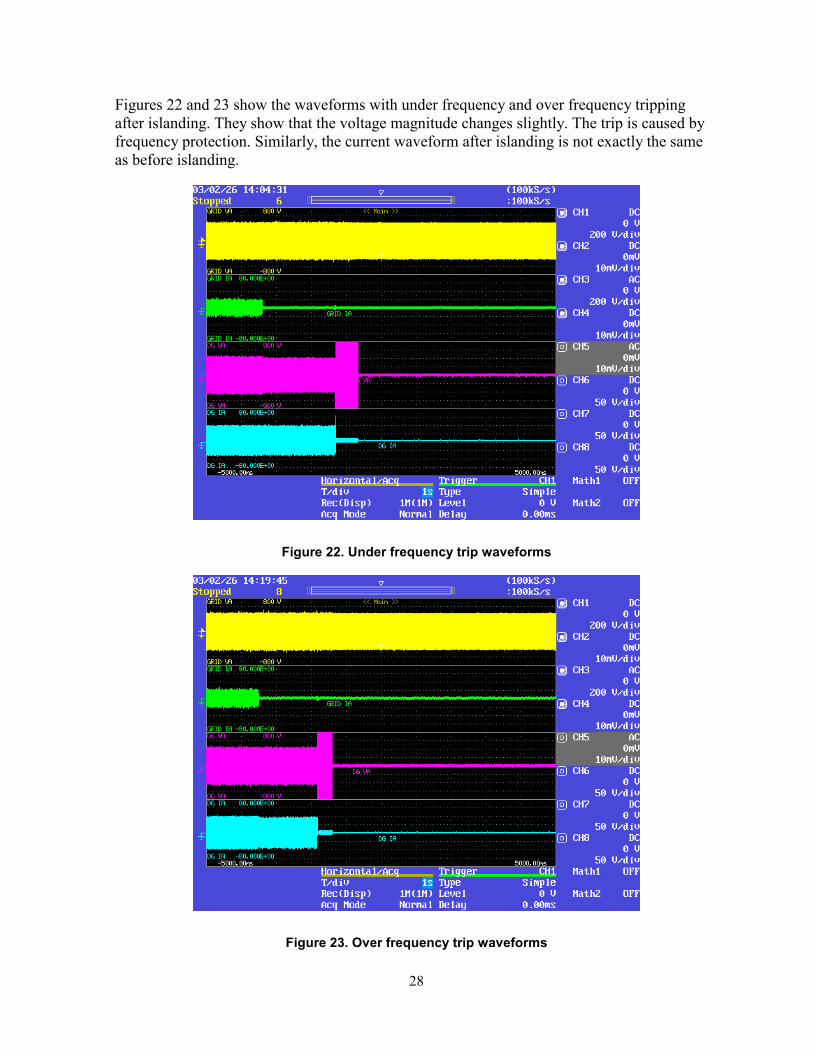
Figures 22 and 23 show the waveforms with under frequency and over frequency tripping after islanding. They show that the voltage magnitude changes slightly. The trip is caused by frequency protection. Similarly, the current waveform after islanding is not exactly the same as before islanding.
Figure 22. Under frequency trip waveforms
Figure 23. Over frequency trip waveforms

29
Figures 24 and 25 show the waveforms with ROCOF trip after islanding—one with frequency increasing, the other with frequency decreasing. The ROCOF trips faster than under/over voltage and frequency because the fastest rate of change normally occurs during the first few cycles after islanding.
Figure 24. Waveforms with ROCOF (increasing) trip
Figure 25. Waveforms with ROCOF (decreasing) trip

30
Besides under/over voltage, under/over frequency, and ROCOF, a harmonic monitoring scheme was also explored.
The idea of harmonic monitoring is to examine the change in the voltage harmonics or total harmonic distortion. The idea is based on an assumption that the grid is nearly an ideal source. Therefore, the voltage harmonics and total harmonic distortion will be very small. When islanding occurs, the voltage harmonics and total harmonic distortion of the DG/load system will become significantly larger than before islanding. This difference can be used for islanding detection. However, from the testing, it is found that the harmonics do not change significantly, possibly because the grid is not ideal and the local harmonics are dominated by the DG and RLC load before and after islanding.

31
5 UI Testing at NREL Lab
5.1 NREL DERTF Background The Distributed Power Systems Integration Team within the US Department of Energy’s National Renewable Energy Laboratory has been leading the effort to develop a standard set of interconnection requirements for DR. Using these technologies interconnected with the EPS at or near load centers can provide increased efficiency, availability, reliability, and power quality as well as a variety of potential economic and power system benefits.
To date, many obstacles have been encountered in the pursuit of these benefits. Confusion and division arise from differences in experience and expertise as well as from the wide variety of existing interconnection standards and requirements among utility, state, and regional organizations. The international IEEE has developed the 1547 Standard for Interconnecting Distributed Resources With Electric Power Systems and is furthering the work through a series of technical standards and guides accompanying the 1547 standard. These include P1547.1 Draft Conformance Test Procedures, P1547.2 Draft Application Guide, and P1547.3 Draft Guide for Monitoring, Information Exchange, and Control to address issues raised during the development of 1547. These consensus standards are created through collaboration and agreements among experts from all related fields, including utility representatives, manufacturers, and government research labs. Uniform, universal interconnection requirements should help all parties involved realize the benefits of DR while saving time, money, and unnecessary headache. Validation of the test procedures from P1547.1 is being conducted at the NREL DERTF located in Golden, Colorado. The DERTF is shown in Figure 26.
Figure 26. NREL DERTF in Golden, Colorado
5.2 Test Objectives The GE UI is a standalone unit that is able to interconnect different types of DER with the power grid. Testing of the UI with inverter-interfaced DG was conducted at the GE Research Lab. This section presents the preliminary procedures and results from testing the UI while interfacing with a diesel generator. The purpose of the testing is to examine, evaluate, and determine areas of possible improvement for both the UI and the contents of the IEEE Draft Standard P1547.1 Conformance Tests Procedures for Equipment Interconnecting Distributed Resources with Electric Power Systems.
The tests being validated include response to unintentional islanding and abnormal voltage and frequency conditions. The results from this and additional testing will be shared with the P1547.1 working group to help in the development of the final test procedures for compliance to IEEE 1547 and used by GE Global Research for improving the UI.

32
5.3 System Configuration and Electrical Equipment 5.3.1 Electrical System Configuration Figure 27 shows a schematic of the UI test setup at the NREL DERTF. The system includes a utility grid simulator, a load bank, a diesel generator and its controller (ENCORP), the UI, and a data acquisition system.
The oscillography function built into the GE UI device was used for data acquisition during testing. The UI can sample at rates up to 64 samples per power cycle. To capture each event, the system used a change-of-state trigger connected to an external breaker (EXT 1 in Figure 27) that was manually operated to disconnect the grid simulator from the UI during each islanding test. Tripping EXT 1 triggers the UI event and waveform recording. The UI data acquisition can record and save data internally in time intervals ranging from less than one cycle to up to 2 min depending on the sample rate and number of channels of data recorded.
5.3.2 Utility Grid Simulator The Pacific Power Source array of grid simulators, shown in Figure 28, can simulate a wide range of grid conditions. Four individual units (model number 3060-MS) were paralleled to provide a combined capacity of 250 kVA (200 kW) at 120/208 V. All four units are controlled via a master-slave arrangement that allows all units to operate simultaneously. Each unit is rated at 62.5 kVA and is capable of delivering power at frequencies from 50 Hz to 400 Hz. The output of the four-unit array is connected to a 120:277 step-up, Wye autotransformer. This allows the unit to provide a three-phase, 480-V output.

33
GE UniversalInterconnect
Utility GridSimulator
DG
LOAD BANK
UI Grid UI DG
EXT 2
EXT 1
ENCORPController toSynchronizeDG to Grid
EXT 3
TransferSwitch
Figure 27. Diagram of the testing setup at NREL DERTF
Figure 28. 200-kW grid simulator array

34
The PPS 3060-MS is a double conversion power source. Commercial input power is rectified and then converted to precision AC power through high-frequency, pulse-width modulation. This design allows fully programmable control of individual phase voltage, current, and frequency. Output regulation and total harmonic distortion are less than 1% for normal 60-Hz operations. The 3060-MS is capable of fast response times, responding to a 100% step load change in less than 300 µs.
5.3.3 Load Bank The load bank for these tests, shown in Figure 29, is a customized version of Simplex’s Titan 162. This unit was altered to provide 165 kW of real and 404 kVAR of inductive and capacitive loads. Step sizes as small as 125 W and 312.5 VAR can be achieved. A LabVIEW graphical user interface controls the unit through serial ports.
Figure 29. A 165-kW Titan load bank (on left)
5.3.4 125-kW Diesel Generator A Cummins/Onan 125-kW model DGEA diesel motor-generator was used as the DG for this set of tests. An Encorp Enpower-Generator Power Control gold box was used with the Entelligent Network Services Tool software to monitor and control the diesel generator and to synchronize the diesel to the simulated grid through an external breaker (EXT 2 in Figure 27). This additional control equipment will be unnecessary if later editions of the GE UI include generator exciter monitoring and control.
5.4 Requirements and Test Procedures A similar test procedure with varied grid and load parameters for investigating the UI islanding NDZ and response to abnormal grid conditions was conducted. Because of the load bank incremental change capability, the power mismatch variation was achieved by varying load instead of DG output. Initially, the 125-kW diesel generator was synchronized using the ENCORP controller and interconnected to the UI and grid simulator at a power output 10–20 kW below the total system load to ensure no current backfed into the grid simulators. Then, load was reduced to match or nearly match the generator power output to simulate the worst-case islanding scenario in which the DG is grid-tied but the load is supplied exclusively by the

35
DG. Next, the breaker EXT 1 was manually tripped to trigger the data acquisition and to disconnect the grid simulators, the “utility,” from the UI, the diesel, and the load. The manual trip disconnects both the grid simulator and associated autotransformer from the test circuit. The manual trip is monitored to trigger the data acquisition. At that point, the UI should detect the island and disconnect the diesel generator within 2 s.
Testing showed that the UI might not recognize the island condition and disconnect the DG depending on the level of balance between the load and the generator. The data collected with each test was used to refine the trip pickup limits and islanding algorithms of the UI prototype. Testing was also conducted to monitor how well the UI would respond to transient (but non-islanding) conditions. For these tests, the grid simulator remains connected to observe and record changes in load or grid characteristics.
5.5 Test Results These tests were preformed to observe how the UI responds to the IEEE P1547.1 testing requirements, to examine the behavior of the UI, and to record data to use for the development of both the hardware and software of the UI prototype. Many of the tests produced similar or repeated results; in those cases, only the clearest graphs are included in this report to illustrate each type of test.
5.5.1 Anti-Islanding Non-Detection Zone With Machine DG The objective of the first set of tests was to find the NDZ for the anti-islanding function. By incrementally increasing or decreasing the mismatch in power between the generator and the load, the boundary where the UI can detect an island condition can be found for any given power base load. The NDZ testing identifies the minimum power supplied by the utility that causes the UI to trip when the utility is removed. Within that power limit, the load matches the DG too closely, and the generator can run islanded indefinitely without the anti-islanding protection responding. This level gives an indication of how well the anti-islanding software operates and can be used as a performance index to compare anti-islanding techniques. The UI was tested at a variety of base loads but always with a consistent quality factor (Q), taken as the ratio of the reactive load to the real load, of 1.8.
Figure 30 shows a case with 100% power balance between the DG and the load (at 50 kW DG output). The DG is running on even after the grid is disconnected. This is the worst case (100% matching) for the DG to detect islanding.

36
Figure 30. Testing waveforms with 50-kW DG output, 100% DG/load power balance (Trace 1–3 from top: DG three-phase output voltage; Trace 4: grid disconnect signal;
Trace 5–7: ROCOF operates; Trace 8: UI disconnect signal)
When there is some power mismatch, the generator frequency will change in response to the power imbalance. Then the UI may be able to detect the islanding. Between each test, the power mismatch is increased at a small increment. The UI trips successfully when there is 1.25-kW mismatch with the DG operating at 50-kW output. Figure 31 shows the testing waveforms. In this case, the NDZ is 1.25 kW / 125 kW * 100% = 1%. The generator rated output is 125 kW.

37
Figure 31. Testing waveforms with 50-kW DG output, 1.25-kW DG/load power mismatch
The results from the tests at different power levels and their NDZs are shown in Table 9. It can be seen that the higher the DG output, the smaller the NDZ. The NDZ for the machine DG is on the order of a couple of percentages of the DG power rating.
Table 9. Results From Anti-Islanding NDZ Testing
DG Output (kW)
Active Load (kW)
Reactive Load (kVAR)
Power Mismatch (kW)
NDZ Size (% of PDG, nom)
20 23 36 3 2.4
35 37.5 62.5 2.5 2.0
50 51.25 90 1.25 1.0
80 81.5 144 1.5 1.2

38
One way to reduce the NDZ is to reduce the anti-islanding setting. A test with half of the previous ROCOF setting was conducted. At 50-kW DG output, the UI trips even with the smallest mismatch (±0.125 kW). The results are shown in Figure 32.
Figure 32. Testing waveforms with 50-kW DG output, 0.125-kW DG/load power mismatch, and halved ROCOF setting
However, as a passive anti-islanding detection scheme, even with the parameters tightened, the UI could not detect the island under exactly matched power conditions. Also, the increased sensitivity can come at the potential price of increased nuisance tripping from unavoidable grid disturbances. One future task is to investigate and determine the ideal settings for the ROCOF anti-islanding function.
After the active power mismatch testing, the UI was also tested with reactive power mismatch. It was found that the UI was never able to detect islanding with reactive power mismatch. The reason is the diesel generator can quickly respond to the reactive power change, thus maintaining its terminal voltage. Theoretically, if the generator is controlled as a constant P and Q source, the active power mismatch will drive the frequency change, as the results above show. The reactive power mismatch, however, should cause voltage change, thus tripping under/over voltage protection. However, it was not observed in the testing with this particular diesel generator, which apparently is not controlled as a constant reactive power source (or with a constant power factor). Figure 33 shows that the generator reactive output (DG Q) jumps up following the grid disconnection to compensate for the

39
reactive power mismatch. As a result, the output voltage still remains within the normal range. If this is the typical or desired behavior of diesel generators used as DG, then anti-islanding protection based on voltage detection for this type of machine DG appears unfeasible. Other schemes that detect reactive power mismatch need to be developed in the future, though active power mismatch will be more common in practice. This issue is under further investigation.
Figure 33. Reactive power mismatch will not trip the UI
5.5.2 Unusual Loads, Sudden Load Changes, and Grid Abnormalities Additional tests were performed to examine how the UI reacts to grid abnormalities and sudden load changes. The test results showed that neither load transients (picking up or dropping off capacitive, inductive, or resistive loads) nor grid abnormalities (momentarily zeroing the voltage on one, two, or all three phases) caused the UI to trip the DG. These grid and load irregularities only affect the current (and power) magnitude and create brief current spikes that recede before the UI can trip on any protection setting. These results demonstrate that the anti-islanding function of the UI is robust to system disturbances.
Figure 34 shows the case of a 10-kW resistive load step-up with base load of 50 kW, 90 kVAR L and C. Figure 35 shows the case of 50-kW resistive load step-up with base load of 50 kW, 0 kVAR L and C. Figure 36 shows the case of capacitor switching from 0 to 42.5 kVAR with 70-kW base load. None of these disturbances causes the UI to trip the DG.

40
Figure 34. 10-kW resistive load step-up with base load of 50 kW, 90 kVAR L and C
Figure 35. 50-kW resistive load step-up with base load of 50 kW and no reactive load

41
Figure 36. Capacitor switching from 0 to 42.5 kVAR with 70-kW base load
These tests were also performed to demonstrate the UI response to grid abnormalities.
Figure 37 shows the case in which the grid simulator momentarily zeros one voltage phase for 250 ms and then returns to normal. Figure 38 illustrates when the grid simulator momentarily zeros all three phases of voltage for 250 ms and then returns to normal. Figure 39 shows the case in which the grid simulator momentarily drops the voltage on two phases to 48% and increases the third phase to 120% for 250 ms and then resumes normal operation. Again, none of these disturbance cases caused the UI to trip the DG.

42
Figure 37. The grid simulator momentarily zeros voltage on one phase
Figure 38. The grid simulator momentarily zeros voltage on all three phases

43
Figure 39. The grid simulator momentarily drops voltage on two phases to 48% and increases the third voltage to 120%
5.5.3 Load Transient Effect on Islanded Operation Another interesting test examined the effects of switching in load while the DG was islanded and supplying a local load. That is, after the DG and load islanded (without being detected), it determined how much load step would cause the island to be detected. The test shows125-W and 500-W steps ramping up or down would not trip the UI, but removing 1 kW (1 kW / 125 kW = 0.8% transient power) or more would cause the UI to disconnect the DG, as shown in Figure 40. The base load for this test is 35 kW resistive, 62.5 kVAR L and C.
However, if the load slowly changes, the UI will not be able to trip, even when the total change is larger than 3 kW. Figure 41 shows how 500-W/s load ramping up to 38 kW after islanding did not trip the UI.

44
Figure 40. After islanding, 1-kW load step causes UI to trip
Figure 41. After islanding, 500-W/s load ramping up to 3-kW total change did not trip the UI

45
5.6 Conclusions Although additional testing remains to be conducted and some modifications will still be made, these results demonstrated that the GE UI prototype functions properly for a resilient interconnection between a DR and the utility grid. The UI has an NDZ for machine DG on the order of a couple of percentages for real power mismatch, but the diesel compensated for any unbalanced reactive loads, never tripping during these tests. For the grid disturbance cases, the UI was very robust and did not falsely trip for all the tested cases.
The data gathered during these tests will be used to further enhance the UI prototype. Specifically, an active anti-islanding function and the capability to actively control generators to synchronize and parallel a DG to the grid are under development. Additional testing of the IEEE P1547.1 under/over voltage and frequency requirements as well as more anti-islanding tests with the new active function may be completed in the near future.

46
6 Summary
6.1 Findings
1. Any single passive anti-islanding scheme has an NDZ on the order of 10% of power mismatch for inverter-interfaced DG.
2. ROCOF, PJ, and harmonic monitoring are of limited value beyond the traditional under/over voltage and frequency monitoring for island detection on inverter- interfaced DG.
3. On the contrary, ROCOF is very effective for machine-interfaced DG. The NDZ for real power mismatch is on the order of a couple of percentages.
4. Unlike the inverter-interfaced DG, the NDZ for machine-interfaced DG is affected by power level. The higher the power lever, the smaller the NDZ.
5. ROCOF anti-islanding detection for inverter-interfaced DG uses reactive power mismatch. However, it only depends on active power mismatch for machine- interfaced DG.
6. The anti-islanding protection for machine-interfaced DG is very insensitive to reactive power mismatch because of machine reactive power response characteristics.
7. To guarantee zero NDZ, some DG uses directional power protection combined with other passive schemes. The directional power thresholds are set based on minimum and maximum local load as well as the NDZ boundaries, so the directional power protection will trip the unit before the DG can operate inside the NDZ. Figure 42 illustrates how an NDZ can be eliminated in this manner. The directional power protection can be designed to cover the entire shaded region, including the NDZ. The area outside of the NDZ is covered by the passive schemes that have an NDZ. Therefore, the anti-islanding protection can be guaranteed. The directional power protection, however, usually limits the availability of the DG by restricting the range of grid conditions in which the DG can continue to operate. Besides the NDZ boundaries, the directional power protection needs to know the minimum and maximum local load. It is always desirable to have passive schemes with small NDZs so the directional power thresholds can be set small to maximize the availability of the DG.
8. The assumption that inverter DG systems have brief transient times (reach steady state within 2 s) is not always valid. The NDZ will be partly determined by the DG dynamic performance. Even if the DG has high bandwidth, the voltage and frequency response after islanding could still be slow, depending on load characteristics.

47
NDZ∆P/P(%)
∆Q/P(%)
Directional PowerProtection Zone
NDZ∆P/P(%)
∆Q/P(%)
Directional PowerProtection Zone
Figure 42. Elimination of NDZ by combining with directional power protection
9. System resonance will typically generate harmonic currents in the test circuit. Therefore, even if power (at fundamental frequency) is 100% balanced, the harmonic currents may make it impossible to zero out rms measurement of power or current flow from the grid side of the switch. This causes some discrepancy between simulation and analysis.
10. Unlike the real power grid, the simulated grid used for these tests cannot compensate for harmonics. A grid simulator that can compensate for harmonic current while regulating voltage and frequency may be necessary if the harmonics are too significant.
Comparing the UI performance of inverter-based DG and machine-based DG interfaced with the EPS, it was found that the UI ROCOF anti-islanding protection is not very effective for inverter-interfaced DG. The ROCOF did not help to reduce the NDZ for inverter-based DG. For use with machine-based DG, the UI ROCOF is fairly effective for active power mismatch, with an NDZ of only a couple of percentages of the DG power rating. This indicates that the UI is most suitable for machine DG. Still, new schemes need to be developed to detect reactive power mismatch. For inverter DG, because of its dynamic characteristics and control capability, it would be best to use active anti-islanding schemes rather than passive schemes.
6.2 Comments on IEEE 1547 and P1547.1
1. Both theoretical analysis and physical experimentation have demonstrated that any single passive scheme has an NDZ. P1547.1 requires interconnection devices to pass the worst-case anti-islanding testing. No single passive scheme (relay function) is able to pass the test. Basically, the testing requirements are defined for interconnect devices with active schemes.
2. For a device with passive schemes to be tested and certified as an interconnect device, separate testing definitions and requirements may be necessary. For example, instead of pass/no-pass testing, testing that specifies the NDZ for an interconnection device (or function) may be valuable. In practice, perfectly matched power conditions would be unlikely. Also, there may be a method to ensure a minimum power mismatch so that a sufficiently small NDZ would never prevent the DG from tripping on an island

48
condition. Nevertheless, testing the NDZ will help apply the device appropriately. Currently, interconnection products on the market with passive schemes do not specify limitations, and this could result in problems unless additional measures are implemented.
3. IEEE P1547.1 (testing standard) has a special section dedicated to reverse power testing. This testing can be extended to directional power testing (both reverse power and forward power). The directional power protection will be a critical element to eliminate NDZs if only passive schemes are used to achieve the low-cost and technology-neutral benefits.
4. IEEE 1547 (interconnection standard) suggests one way to protect against islanding is to make certain that the DG capacity is less than one-third of the minimum load of the Local EPS. If the grid were to supply at least two-thirds of the load power, according to NDZ definition, this would ensure at least a 200% power mismatch. Based on the studied and tested results in this report, even the traditional under/over voltage and frequency NDZ boundaries are far below 50% power mismatch. The requirement of the one-third rule (or 200% mismatch) seems to be too stringent for inverter-interfaced DG and may unnecessarily limit the possible applications of DG. For machine-interfaced DG, the one-third rule is even more stringent because of the fact that the NDZ for machined-based DG is much smaller. When incorporated with appropriate controls, such as ROCOF, the DG can consistently disconnect at less than a 5% active power mismatch.
5. This study only addresses the IEEE 1547 requirement for anti-islanding with the 2-s response time. It does not address the reclosing coordination requirement, which has variable timing requirements, many faster than 2 s. In these cases, special designs may be needed, either through additional devices for coordination or much quicker anti-islanding detection. If the latter, the directional power thresholds may be required to be much larger because the NDZ of the individual passive scheme will be much larger.
6.3 Future Testing Needs
1. To date, testing has been very preliminary, and most testing points were taken only twice. Multiple testing points will be necessary to find mean and deviation values to improve testing accuracy and authenticity.
2. The active and reactive power readings are from the URPC, which measures total power rather than 60-Hz fundamental power. Although it was verified by the Yokogawa oscilloscope that the difference is small, the accuracy can be readily improved if the true fundamental power is measured.
3. Sensitivity of the NDZ to load or DG power factor should be explored further to identify the worst-case conditions.
4. Sensitivity of the NDZ to anti-islanding settings should be explored further to guide the settings in practical applications.
5. Testing with more practical system disturbances should be carried out to optimize the settings.

49
6. The NDZ generated for the machine DG is only for the case with net power imported from the grid because the grid simulator cannot sink power. Testing with a grid or grid simulator that has power sink capability should be conducted.
Besides the testing, the reason there is discrepancy between the predicted/simulated NDZ and the tested NDZ should be studied. The NDZ study of machine-interfaced DG will also be valuable to help researchers better understand factors that dominate machine behaviors in response to islanding. In summary, the significance of NDZ study and testing is to provide accurate boundaries that can be used for the settings of directional power protection. This way, the anti-islanding protection can be guaranteed while the availability of the DG is maximized.
Finally, the study suggests that active anti-islanding schemes may be needed to have maximum DG availability because passive anti-islanding schemes will either result in limited availability from overly restrictive settings or risk non-detection of islanding under worst-case conditions.

50
7 References
[1] GE Corporate Research and Development. “Reliable, Low Cost Distributed Generator/Utility System Interconnect – 2001 Annual Report.” January 2002.
[2] G60 Generator Management Relay UR Series Instruction Manual. Available online at http://www.geindustrial.com/cwc/products?pnlid=6&famid=31&catid=168&id=g60&typeId=3.
[4] Z. Ye, P. Du, R. Walling, A. Kolwalkar, Y. Zhang. “Evaluation of Anti-Islanding Schemes Based on Non Detection Zone Concept.” Being published in IEEE Power Electronics Specialists Conference, Acapulco, Mexico, June 2003.
[5] IEEE 1547 Standard for Interconnecting Distributed Resources with Electric Power Systems, June 2003.
[6] IEEE P1547.1 Draft Standard Conformance Test Procedures for Equipment Interconnecting Distributed Resources With Electric Power Systems.
[7] IEEE 929 Recommend Practice for Utility Interface of Photovoltaic (PV) Systems.
[8] UL 1741 Inverters, Converters, and Controllers for Use in Independent Power Systems.

51
8 Appendix Ye, Z.; Du, P.; Walling, R.; Kolwalkar, A.; Zhang, Y. “Evaluation of Anti-Islanding Schemes Based on Non Detection Zone Concept.” Being published in IEEE Power Electronics Specialists Conference, Acapulco, Mexico, June 2003.

52
Evaluation of Anti-Islanding Schemes Based on Non Detection Zone Concept2
2 This work was supported by National Renewable Energy Laboratory (NREL) under award number NAD-1-30605-01.
Zhihong Ye, Amol Kolwalkar, Yu Zhang GE Global Research Center
One Research Circle Niskayuna, NY 12309, USA
Pengwei Du Electrical, Computer and Systems Engineering Dept.
Rensselaer Polytechnic Institute Troy, NY 12180, USA
Reigh Walling GE Power Systems Energy Consulting
One River Road Schenectady, NY 12345, USA
Abstract - This paper proposes a Non Detection Zone (NDZ)
as a performance index to evaluate different anti-islanding schemes. The NDZ for three basic passive anti-islanding schemes: under/over voltage, under/over frequency, and phase jump are derived analytically and validated by simulation. Based on the NDZ, not only can the dominant factors that influence anti-islanding protection be identified, it may also help find out optimal combined schemes that lead to a reduced NDZ. The methodology presented in the paper can be extended to evaluation of other anti-islanding schemes.
I. INTRODUCTION
There are many anti-islanding schemes reported in the past [1]-[6]. However, there is not a single one that is well accepted in terms of performance (effective and reliable), cost (minimal hardware or system infrastructure requirements), and neutrality with respect to DG technology (applicable to different distributed generation interconnection). Passive anti-islanding schemes (defined as using local voltage and current sensing only) have cost and technology neutral merits. But, their effectiveness is usually in question. Active anti-islanding schemes (defined as using other measures than local voltage and current sensing only, e.g. using active signal injection, communication with distributed generation (DG) and/or grid, etc.) are generally considered more effective than passive ones. However, they are more costly, and in most cases are not technology neutral. Some active schemes may not work properly for multiple DGs. Furthermore, although not yet fully explored, it is perceived that some active schemes may have potential adverse impact on grid dynamics.
There is a need to define a performance index to evaluate different anti-islanding schemes. Since the active schemes are realized differently from case to case, it is difficult to evaluate and compare their performance. Passive schemes, however, are normally technology neutral and could be evaluated based on a common performance index that can be derived based on the system characteristics.
The objective of this study is to evaluate different passive anti-islanding schemes. Two steps are taken for the evaluation: 1). Define a performance index for evaluation. The
performance index is referred as non detection zone (NDZ), which is defined in power mismatch (∆P and ∆Q) space, that is, given small enough ∆P and ∆Q, the frequency and voltage deviation after islanding will not be large enough for anti-islanding devices to detect grid disconnection within a prescribed time period. NDZ can also be defined in RLC load space [2]. However, it is not generic enough to cover active load, e.g. motor load.
2). Map NDZ of different anti-islanding schemes into the power mismatch space to evaluate their performance, i.e. the smaller the NDZ, the more effective the scheme is.
Initially, three passive schemes are identified and evaluated. They are: a. Under/over voltage; b. Under/over frequency; c. Phase jump.
II. ANTI-ISLANDING TESTING CONDITIONS
A generic system for anti-islanding study is shown in Fig. 1. The circuit is the same as the anti-islanding testing diagram defined in UL 1741 and IEEE 929, as well as upcoming IEEE P1547.
There is a specific definition for RLC load as a testing condition: 1). The resonant frequency of the RLC load is the same as
grid line frequency; 2). The quality factor Qf of the RLC load is set to be 2.5.
Physically, the quality factor is defined as that the reactive power stored in L or C is Qf times the active power consumed in R;

53
3). The power generated by DG should match the RLC load power, i.e. in Fig. 1, 0=∆=∆ QP .
Under this ideal condition, when the switch S1 opens, the DG and the RLC load will resonate at nominal voltage and frequency to form an island, unless there is some mechanism to drive voltage V or frequency f out of their nominal range.
Mathematically, the load definition can be represented as below. (To simplify the problem, the DG is considered as in unity power factor operation, i.e. Q=0. The analysis carried on thereafter, however, can be extended to any non-unity power factor case).
PVR /2= (1) )2/(2 PQfVL f ⋅⋅⋅= π (2)
)2/( 2VfPQC f ⋅⋅⋅= π (3)
LCf
π21
= (4)
where: R is the effective load resistance in Ohm. C is effective load capacitance in Farad. L is effective load inductance in Henry. P is the real power in W. Qf is quality factor. f is grid frequency in Hz.
Grid DG
S1 S2
QP ∆∆ , QP,
QQPP ∆+∆+ ,
fV ,
R L C
Fig. 1. A generic system for anti-islanding study.
III. NON-DETECTION ZONE OF UNDER/OVER VOLTAGE AND UNDER/OVER FREQUENCY
In practical conditions, there is always some power mismatch between the DG output and the load of the area electric power system (EPS). This mismatched load can be represented by ( CCLLRR ∆+∆+∆+ ,, ). Before the
grid is disconnected, the power mismatch will be compensated by the grid, i.e. 0≠∆P , 0≠∆Q . When grid is disconnected, the voltage and frequency will be
forced to new values, fV ′′, , if the DG is controlled as a constant power, shown in Fig. 2.
Grid DG
S1 S2
QP ∆∆ , QP,fV ′′,
RR ∆+ CC ∆+LL ∆+
QP,
Fig. 2. The DG and RLC circuit after the grid is disconnected.
When the power mismatch ( QP ∆∆ , ) is large enough, the fV ′′, may be out of nominal ranges and under/over
voltage/frequency protection will trip the switch S2 to
prevent continued island operation. The relationship between the power mismatch thresholds and voltage/frequency thresholds can be derived as below. The detailed derivation is in Appendix.
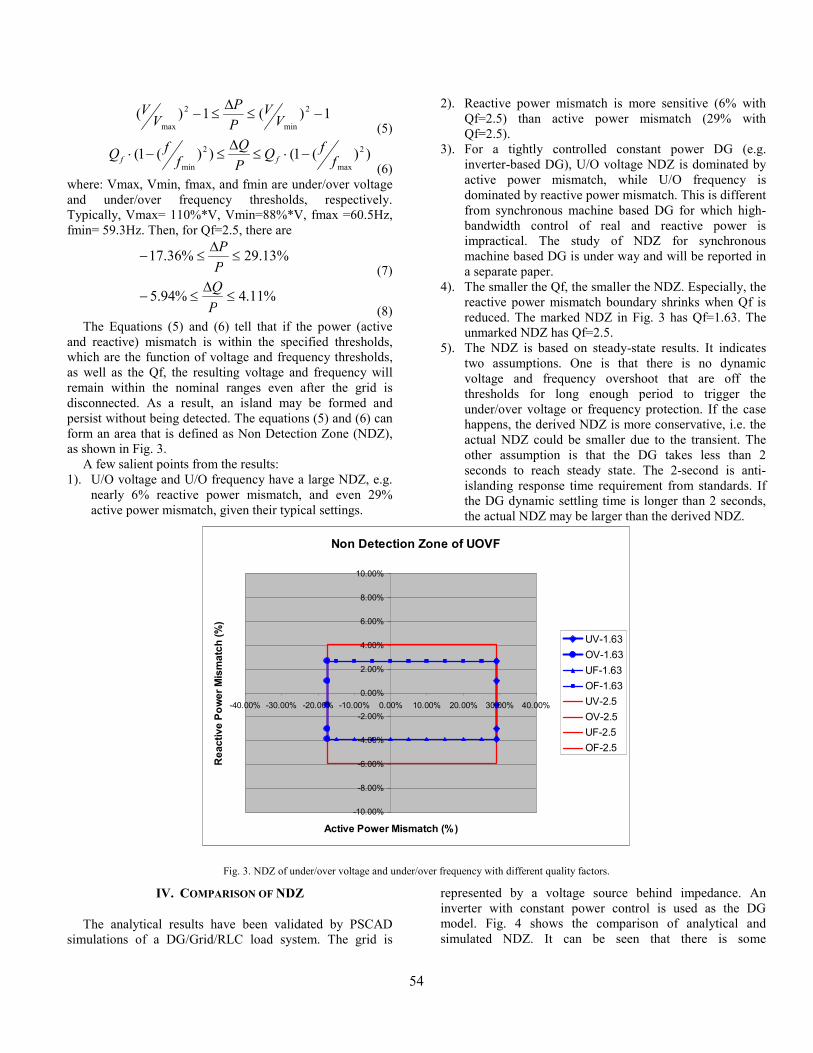
54
1)(1)( 2
min
2
max−≤
∆≤− V
VPP
VV
(5)
))(1())(1( 2
max
2
min ffQ
PQ
ffQ ff −⋅≤
∆≤−⋅
(6) where: Vmax, Vmin, fmax, and fmin are under/over voltage and under/over frequency thresholds, respectively. Typically, Vmax= 110%*V, Vmin=88%*V, fmax =60.5Hz, fmin= 59.3Hz. Then, for Qf=2.5, there are
%13.29%36.17 ≤∆
≤−PP
(7)
%11.4%94.5 ≤∆
≤−PQ
(8) The Equations (5) and (6) tell that if the power (active
and reactive) mismatch is within the specified thresholds, which are the function of voltage and frequency thresholds, as well as the Qf, the resulting voltage and frequency will remain within the nominal ranges even after the grid is disconnected. As a result, an island may be formed and persist without being detected. The equations (5) and (6) can form an area that is defined as Non Detection Zone (NDZ), as shown in Fig. 3.
A few salient points from the results: 1). U/O voltage and U/O frequency have a large NDZ, e.g.
nearly 6% reactive power mismatch, and even 29% active power mismatch, given their typical settings.
2). Reactive power mismatch is more sensitive (6% with Qf=2.5) than active power mismatch (29% with Qf=2.5).
3). For a tightly controlled constant power DG (e.g. inverter-based DG), U/O voltage NDZ is dominated by active power mismatch, while U/O frequency is dominated by reactive power mismatch. This is different from synchronous machine based DG for which high-bandwidth control of real and reactive power is impractical. The study of NDZ for synchronous machine based DG is under way and will be reported in a separate paper.
4). The smaller the Qf, the smaller the NDZ. Especially, the reactive power mismatch boundary shrinks when Qf is reduced. The marked NDZ in Fig. 3 has Qf=1.63. The unmarked NDZ has Qf=2.5.
5). The NDZ is based on steady-state results. It indicates two assumptions. One is that there is no dynamic voltage and frequency overshoot that are off the thresholds for long enough period to trigger the under/over voltage or frequency protection. If the case happens, the derived NDZ is more conservative, i.e. the actual NDZ could be smaller due to the transient. The other assumption is that the DG takes less than 2 seconds to reach steady state. The 2-second is anti-islanding response time requirement from standards. If the DG dynamic settling time is longer than 2 seconds, the actual NDZ may be larger than the derived NDZ.
Non Detection Zone of UOVF
-10.00%
-8.00%
-6.00%
-4.00%
-2.00%
0.00%
2.00%
4.00%
6.00%
8.00%
10.00%
-40.00% -30.00% -20.00% -10.00% 0.00% 10.00% 20.00% 30.00% 40.00%
Active Power Mismatch (%)
Rea
ctiv
e Po
wer
Mis
mat
ch (%
)
UV-1.63OV-1.63UF-1.63OF-1.63UV-2.5OV-2.5UF-2.5OF-2.5
Fig. 3. NDZ of under/over voltage and under/over frequency with different quality factors.
IV. COMPARISON OF NDZ
The analytical results have been validated by PSCAD simulations of a DG/Grid/RLC load system. The grid is
represented by a voltage source behind impedance. An inverter with constant power control is used as the DG model. Fig. 4 shows the comparison of analytical and simulated NDZ. It can be seen that there is some
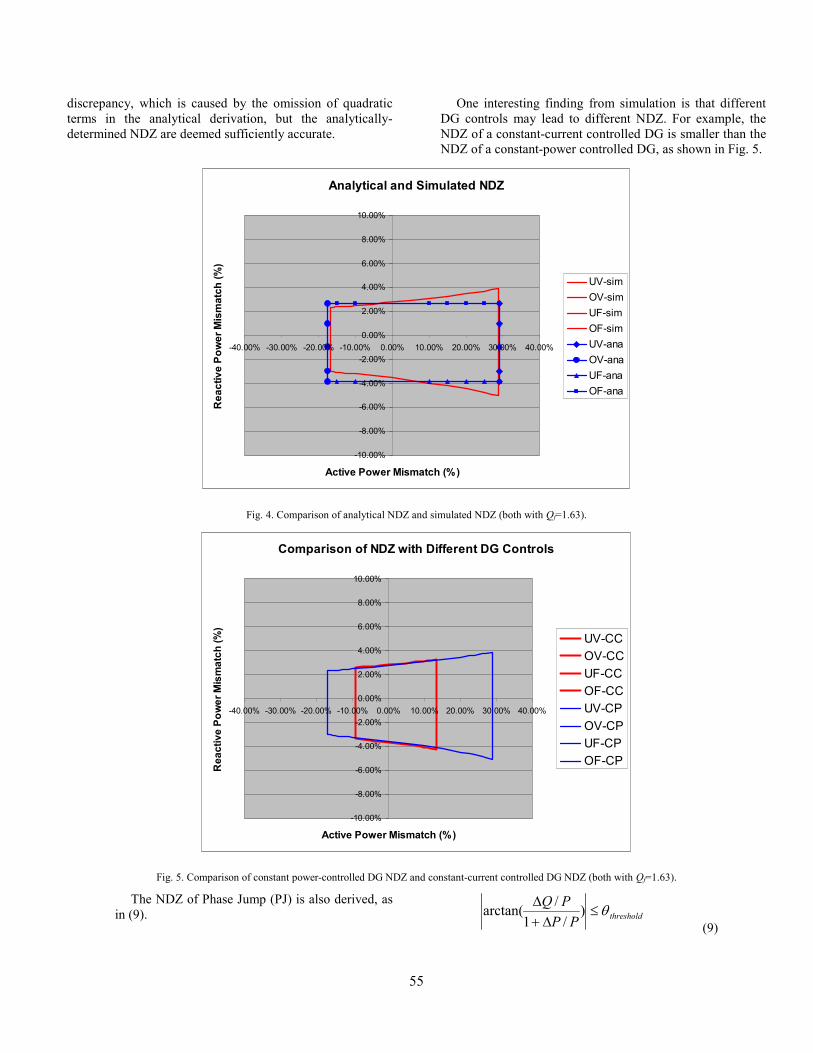
55
discrepancy, which is caused by the omission of quadratic terms in the analytical derivation, but the analytically-determined NDZ are deemed sufficiently accurate.
One interesting finding from simulation is that different DG controls may lead to different NDZ. For example, the NDZ of a constant-current controlled DG is smaller than the NDZ of a constant-power controlled DG, as shown in Fig. 5.
Analytical and Simulated NDZ
-10.00%
-8.00%
-6.00%
-4.00%
-2.00%
0.00%
2.00%
4.00%
6.00%
8.00%
10.00%
-40.00% -30.00% -20.00% -10.00% 0.00% 10.00% 20.00% 30.00% 40.00%
Active Power Mismatch (%)
Rea
ctiv
e Po
wer
Mis
mat
ch (%
)
UV-simOV-simUF-simOF-simUV-anaOV-anaUF-anaOF-ana
Fig. 4. Comparison of analytical NDZ and simulated NDZ (both with Qf=1.63).
Comparison of NDZ with Different DG Controls
-10.00%
-8.00%
-6.00%
-4.00%
-2.00%
0.00%
2.00%
4.00%
6.00%
8.00%
10.00%
-40.00% -30.00% -20.00% -10.00% 0.00% 10.00% 20.00% 30.00% 40.00%
Active Power Mismatch (%)
Rea
ctiv
e Po
wer
Mis
mat
ch (%
)
UV-CCOV-CCUF-CCOF-CCUV-CPOV-CPUF-CPOF-CP
Fig. 5. Comparison of constant power-controlled DG NDZ and constant-current controlled DG NDZ (both with Qf=1.63).
The NDZ of Phase Jump (PJ) is also derived, as in (9). thresholdPP
PQ θ≤∆+
∆ )/1
/arctan( (9)

56
It is mapped onto the power mismatch space, as in Fig. 6, compared with NDZ of under/over voltage and frequency.
The zone within the thick lines is PJ NDZ for 1-degree threshold. The zone within the thin lines is PJ NDZ for 2- degree threshold.
A few salient points from the results: 1). PJ NDZ is independent from Qf, unlike NDZ
of under/over frequency.
2). Similar to under/over frequency, PJ NDZ is very insensitive to active power mismatch.
3). PJ NDZ increases with increased threshold. 4). There are practical issues related to using
phase-jump thresholds on the order of a few degrees. Power system switching events, not resulting in islanding, can falsely trigger such schemes.
Non Detection Zone of UOVF & PJ
-10.00%
-8.00%
-6.00%
-4.00%
-2.00%
0.00%
2.00%
4.00%
6.00%
8.00%
10.00%
-40% -30% -20% -10% 0% 10% 20% 30% 40%
Active Power Mismatch (%)
Rea
ctiv
e Po
wer
Mis
mat
ch (%
)
PJ-1degPJ-1degPJ-2degPJ-2degUV-2.5OV-2.5UF-2.5OF-2.5
Fig. 6. Comparison of phase jump NDZ and under/over voltage/frequency NDZ.
The under/over voltage NDZ is validated by experiment. Fig. 7 shows the case with no tripping because the power mismatch is within the NDZ.
Fig. 8 shows the case with under voltage tripping, because of large active power mismatch (34%).
Fig. 7. Experimental result with no tripping case (within NDZ, ∆P=2%, ∆Q=0.5%). CH1: grid voltage; CH2: grid current; CH3: DG voltage, CH4: DG current.
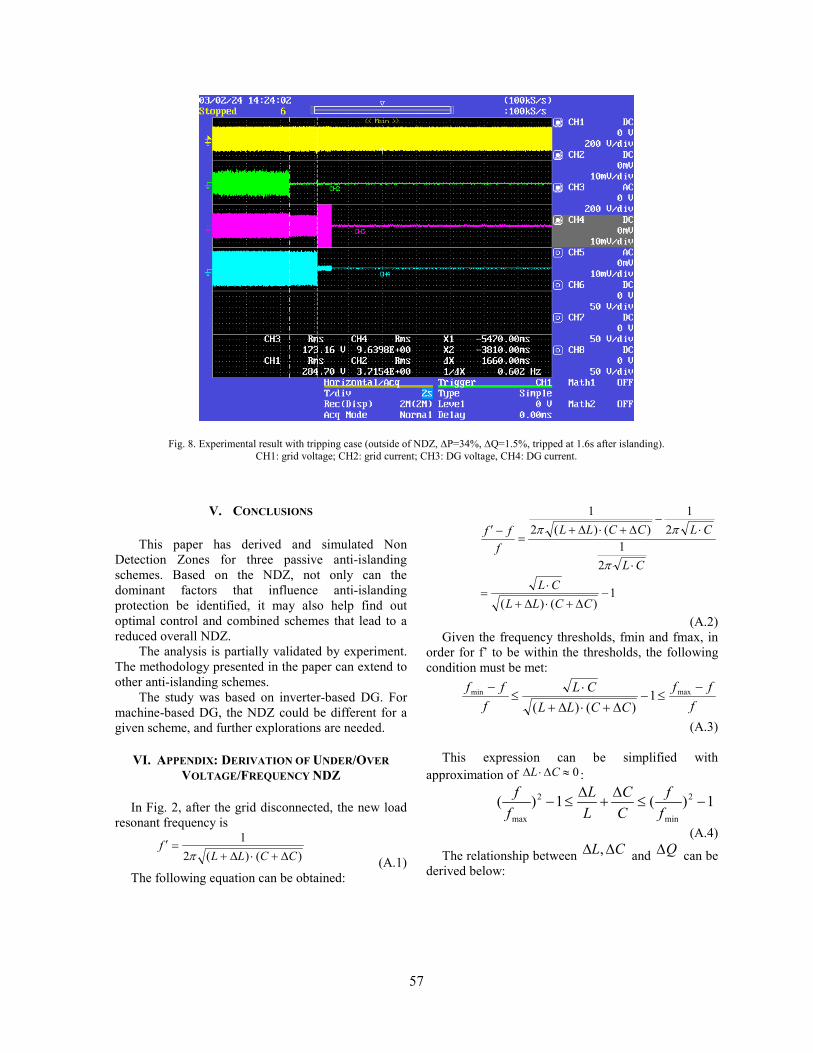
57
Fig. 8. Experimental result with tripping case (outside of NDZ, ∆P=34%, ∆Q=1.5%, tripped at 1.6s after islanding). CH1: grid voltage; CH2: grid current; CH3: DG voltage, CH4: DG current.
V. CONCLUSIONS
This paper has derived and simulated Non Detection Zones for three passive anti-islanding schemes. Based on the NDZ, not only can the dominant factors that influence anti-islanding protection be identified, it may also help find out optimal control and combined schemes that lead to a reduced overall NDZ.
The analysis is partially validated by experiment. The methodology presented in the paper can extend to other anti-islanding schemes.
The study was based on inverter-based DG. For machine-based DG, the NDZ could be different for a given scheme, and further explorations are needed.
VI. APPENDIX: DERIVATION OF UNDER/OVER
VOLTAGE/FREQUENCY NDZ
In Fig. 2, after the grid disconnected, the new load resonant frequency is
)()(21
CCLLf
∆+⋅∆+=′
π (A.1) The following equation can be obtained:
1)()(
21
21
)()(21
−∆+⋅∆+
⋅=
⋅
⋅−
∆+⋅∆+=
−′
CCLLCL
CL
CLCCLLf
ff
π
ππ
(A.2)
Given the frequency thresholds, fmin and fmax, in order for f’ to be within the thresholds, the following condition must be met:
fff
CCLLCL
fff −
≤−∆+⋅∆+
⋅≤
− maxmin 1)()(
(A.3) This expression can be simplified with
approximation of 0≈∆⋅∆ CL :
1)(1)( 2
min
2
max
−≤∆
+∆
≤−ff
CC
LL
ff
(A.4)
The relationship between CL ∆∆ , and Q∆ can be derived below:
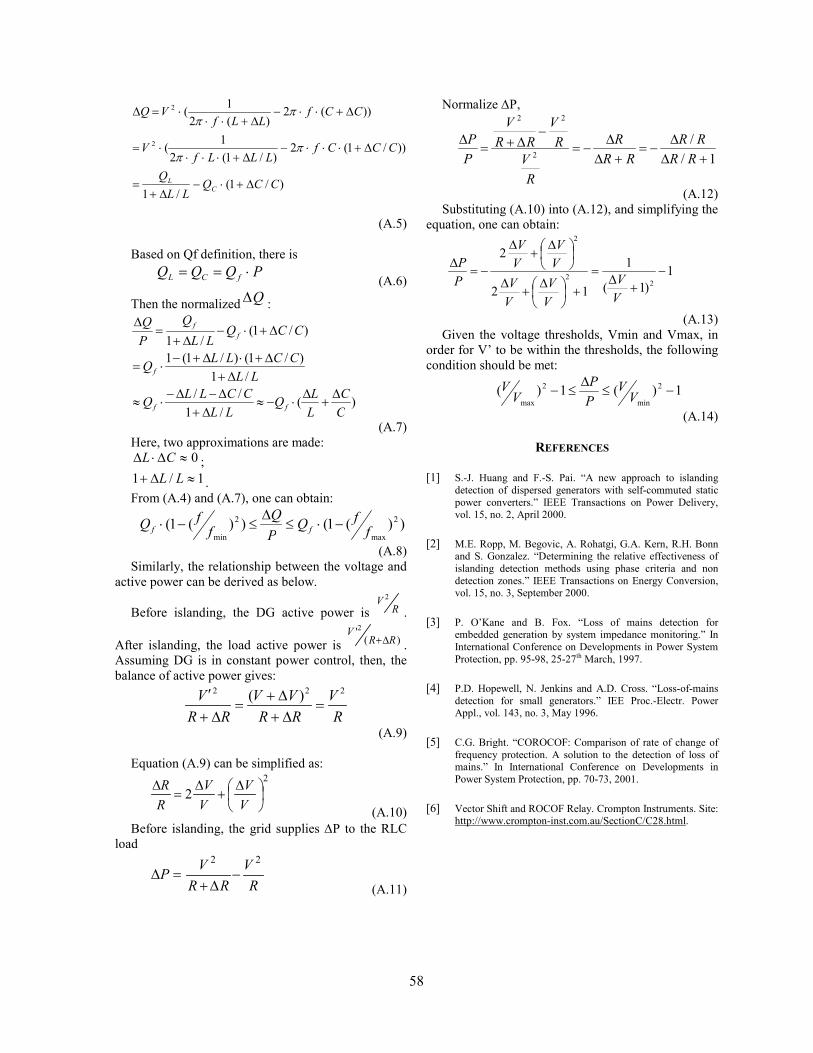
58
)/1(/1
))/1(2)/1(2
1(
))(2)(2
1(
2
2
CCQLL
Q
CCCfLLLf
V
CCfLLf
VQ
CL ∆+⋅−
∆+=
∆+⋅⋅⋅−∆+⋅⋅⋅
⋅=
∆+⋅⋅−∆+⋅⋅
⋅=∆
ππ
ππ
(A.5)
Based on Qf definition, there is
PQQQ fCL ⋅== (A.6)
Then the normalized Q∆ :
)(/1
///1
)/1()/1(1
)/1(/1
CC
LLQ
LLCCLLQ
LLCCLLQ
CCQLL
QPQ
ff
f
ff
∆+
∆⋅−≈
∆+∆−∆−
⋅≈
∆+∆+⋅∆+−
⋅=
∆+⋅−∆+
=∆
(A.7)
Here, two approximations are made: 0≈∆⋅∆ CL ; 1/1 ≈∆+ LL .
From (A.4) and (A.7), one can obtain:
))(1())(1( 2
max
2
min ffQ
PQ
ffQ ff −⋅≤
∆≤−⋅
(A.8) Similarly, the relationship between the voltage and
active power can be derived as below.
Before islanding, the DG active power is RV 2
.
After islanding, the load active power is )('2
RRV
∆+ . Assuming DG is in constant power control, then, the balance of active power gives:
RV
RRVV
RRV 222 )(
=∆+
∆+=
∆+′
(A.9)
Equation (A.9) can be simplified as:
2
2
∆
+∆
=∆
VV
VV
RR
(A.10) Before islanding, the grid supplies ∆P to the RLC
load
RV
RRVP
22−
∆+=∆
(A.11)
Normalize ∆P,
1//
2
22
+∆∆
−=+∆
∆−=
−∆+=
∆RR
RRRR
R
RV
RV
RRV
PP
(A.12) Substituting (A.10) into (A.12), and simplifying the
equation, one can obtain:
1)1(
1
12
2
22
2
−+
∆=
+
∆
+∆
∆
+∆
−=∆
VV
VV
VV
VV
VV
PP
(A.13)
Given the voltage thresholds, Vmin and Vmax, in order for V’ to be within the thresholds, the following condition should be met:
1)(1)( 2
min
2
max−≤
∆≤− V
VPP
VV
(A.14)
REFERENCES
[1] S.-J. Huang and F.-S. Pai. “A new approach to islanding detection of dispersed generators with self-commuted static power converters.” IEEE Transactions on Power Delivery, vol. 15, no. 2, April 2000.
[2] M.E. Ropp, M. Begovic, A. Rohatgi, G.A. Kern, R.H. Bonn and S. Gonzalez. “Determining the relative effectiveness of islanding detection methods using phase criteria and non detection zones.” IEEE Transactions on Energy Conversion, vol. 15, no. 3, September 2000.
[3] P. O’Kane and B. Fox. “Loss of mains detection for embedded generation by system impedance monitoring.” In International Conference on Developments in Power System Protection, pp. 95-98, 25-27th March, 1997.
[4] P.D. Hopewell, N. Jenkins and A.D. Cross. “Loss-of-mains detection for small generators.” IEE Proc.-Electr. Power Appl., vol. 143, no. 3, May 1996.
[5] C.G. Bright. “COROCOF: Comparison of rate of change of frequency protection. A solution to the detection of loss of mains.” In International Conference on Developments in Power System Protection, pp. 70-73, 2001.
[6] Vector Shift and ROCOF Relay. Crompton Instruments. Site: http://www.crompton-inst.com.au/SectionC/C28.html.

REPORT DOCUMENTATION PAGE
Form Approved OMB NO. 0704-0188
Public reporting burden for this collection of information is estimated to average 1 hour per response, including the time for reviewing instructions, searching existing data sources, gathering and maintaining the data needed, and completing and reviewing the collection of information. Send comments regarding this burden estimate or any other aspect of this collection of information, including suggestions for reducing this burden, to Washington Headquarters Services, Directorate for Information Operations and Reports, 1215 Jefferson Davis Highway, Suite 1204, Arlington, VA 22202-4302, and to the Office of Management and Budget, Paperwork Reduction Project (0704-0188), Washington, DC 20503. 1. AGENCY USE ONLY (Leave blank)
2. REPORT DATE
August 2003
3. REPORT TYPE AND DATES COVERED
Technical
4. TITLE AND SUBTITLE Testing of GE Universal Interconnection Device
6. AUTHOR(S) Z. Ye, D. Finney, R. Zhou, M. Dame, B. Premerlani, B. Kroposki, and S. Englebretson
5. FUNDING NUMBERS
DP03.1001
7. PERFORMING ORGANIZATION NAME(S) AND ADDRESS(ES)
National Renewable Energy Laboratory 1617 Cole Blvd.
Golden, CO 80401-3393
8. PERFORMING ORGANIZATION
REPORT NUMBER NREL/TP-560-34676
9. SPONSORING/MONITORING AGENCY NAME(S) AND ADDRESS(ES)
10. SPONSORING/MONITORING
AGENCY REPORT NUMBER
11. SUPPLEMENTARY NOTES
12a. DISTRIBUTION/AVAILABILITY STATEMENT
National Technical Information Service U.S. Department of Commerce 5285 Port Royal Road
Springfield, VA 22161
12b. DISTRIBUTION CODE
13. ABSTRACT (Maximum 200 words) This report summarizes preliminary testing and evaluation of a universal interconnection interface for distributed energy resources.
15. NUMBER OF PAGES
14. SUBJECT TERMS
universal interconnection; non-detection zone; NDZ; islanding; anti-islanding; interconnection; inverter; 1547; distributed energy; distributed resources; distributed power; DER; DR; DG; General Electric; GE; National Renewable Energy Laboratory; NREL
16. PRICE CODE
17. SECURITY CLASSIFICATION
OF REPORT Unclassified
18. SECURITY CLASSIFICATION
OF THIS PAGE Unclassified
19. SECURITY CLASSIFICATION
OF ABSTRACT Unclassified
20. LIMITATION OF ABSTRACT
UL
NSN 7540-01-280-5500 Standard Form 298 (Rev. 2-89) Prescribed by ANSI Std. Z39-18 298-102