testing of vibrational energy harvesting on …robertmaccurdy.com/docs/2013_shafer_testing of... ·...
TRANSCRIPT

Proceedings of the ASME 2013 Conference on Smart Materials, Adaptive Structures andIntelligent Systems
ASME SMASIS 2013September 16-18, 2013, Snowbird, Utah, USA
SMASIS2013-3063
TESTING OF VIBRATIONAL ENERGY HARVESTING ON FLYING BIRDS
Michael W. Shafer ∗
Sibley School of Mechanicaland Aerospace Engineering
Cornell UniversityIthaca, New York 14853
Email: [email protected]
Robert MacCurdySibley School of Mechanicaland Aerospace Engineering,
Cornell UniversityIthaca, New York 14853
Email: [email protected]
Ephrahim GarciaSibley School of Mechanicaland Aerospace Engineering
Cornell UniversityIthaca, New York 14853
Email: [email protected]
ABSTRACTDiscrete animal-mounted sensors and tags have a wide range
of potential applications for researching wild animals and theirenvironments. The devices could be used to monitor location,metabolic output, or used as environmental monitoring sentinels.These applications are made possible by recent decreases in thesize, mass, and power consumption of modern microelectronics.Despite these performance increases, for extended deploymentsthese systems need to generate power in-situ. In this work, weexplore a device that was recently deployed to test the concept ofpiezoelectric energy harvesting on flying birds. We explain thedevelopment of the device and introduce test results conductedon flying pigeons (Columba livia). The testing device consistedof a miniature data acquisition system, piezoelectric energy har-vester, and actuator system. The output of the energy harvesterwas monitored by a microcontroller and recorded throughout theflight. The energy harvester included a wireless receiver, bat-tery and linear servo. By remotely actuating the linear servo, wewere able to arrest the energy harvester for portions of the flight.In doing so, we will be able to compare flight accelerations of abird with a simple proof mass and with a dynamic mass withouthaving to stop the flight of the bird. The comparison of these twocases allows for the assessment of the feasibility of employingvibrational energy harvesting on a flying bird. We present theinitial results of this testing with regard to the harvested powerand the in-flight acceleration profiles.Keywords: energy harvesting, avian, bird, piezoelectric, testing
∗Address all correspondence to this author.
Introduction
The direct study of animals in their natural environmentthrough observation can be challenging or impossible for manyspecies. “Bio-logging” devices are systems mounted to an ani-mal used to record data about the host or its environment withoutthe need for direct observations by a human [1]. Owing theirnames to ”biology” and ”data-logging,” these devices can drasti-cally increase amount of data available to scientists interested inanimals and their habitats. Modern bio-logging devices are of-ten composed of a suite of sensors run by a microcontroller, andtypically powered by a battery. Fundamentally, the science thatcan be conducted directly depends on the power budget of thesystem, and thus is limited by battery technology. In this workwe consider how vibrational energy harvesting could be used tosupplement the power budget of bio-logging devices. Specifi-cally, we focus on a device developed to conduct tests of piezo-electric energy harvesters on flying rock pigeons (Columba livia)and show that a significant amount of power can be harvested inflight from these birds.
The concept of animal-based data collection can be tracedback to a depth recording device placed on a harpooned fin whale(Balaenoptera physalus) in the 1930’s [2] and Weddell seals(Leptonychotes weddellii) in the 1960’s [3]. In the time sincetheir initial deployment, bio-logging devices have seen drasticimprovements in capabilities, both in terms of the number of sen-sors and the resolution and frequency of measurements [4] [5].In large part, these increases in capabilities have been a result ofreductions in the power consumption of modern microelectronic
1 Copyright c© 2013 by ASME
components. Modern systems are capable of measuring anythingfrom position to acoustics, but are still fundamentally limited tothe amount of energy stored in their batteries [6] [7]. If powercould be generated throughout the life of the tag, smaller bat-teries could be used and more energy intensive sensors could bedeployed.
Vibrational energy harvesting on living animals has beendemonstrated previously on moths (Manduca sexta) and greenjune beetles (Cotinis nitida) [8] [9]. Additionally, we have previ-ously shown that there is a significant amount of power availablefor harvest from the flight of the majority of birds, even after ac-counting for the power required to carry the system [10]. In thiswork we review the testing conducted to measure the harvestedpower on a bird, and describe in detail the device developed tomeasure the harvester power and acceleration on the birds inflight. We also present some typical results from the more than120 trials to show that there is a significant amount of power thatcan be harvested.
1 Testing OverviewIn order to address the feasibility of harvesting vibrational
energy on flying birds, we had two primary objectives in test-ing: (1) Understand the effects of a dynamic mass on the flightof a bird. (2) Measure the power harvested by a piezoelec-tric device in flight. While it is known that birds can generallycarry up to 2-4% of their body mass without considerable effectson long-term survivability, these numbers are based on a staticmass [11] [12] [13] [14]. In order to determine if piezoelectricenergy harvesting is viable on a flying bird, we must determine ifa vibrating system would adversely affect a bird’s flight capabili-ties. To measure any effect, we developed a system that was ableto measure the accelerations of the bird in flight with a piezo-electric beam that could be remotely locked down or allowed tovibrate. This allowed for a series of tests with and without a avibrating element on the back of the bird.
The test was designed to measure any effect of the vibrat-ing system and consisted of flying a bird back and forth betweentwo perches in a room while measuring the acceleration and har-vested power. The test began by attaching a small energy har-vester and data acquisition system (DAQ) to the back of threerock pigeons (Columba livia). After turning on the on-bird DAQ,each pigeon was then placed in a room with only two perchesspaced 22 ft. apart, between which they had previously beentrained to fly. The energy harvester was then locked down, so asnot to vibrate and the bird was prompted to fly from one perch tothe other. The bird was then prompted to fly back to the originalperch. Remotely, the energy harvesting beam was then releasedand allowed to vibrate. The bird was prompted to fly back andforth between the perches again. This process of flying betweenperches and locking/releasing the harvester device was then re-peated multiple times.
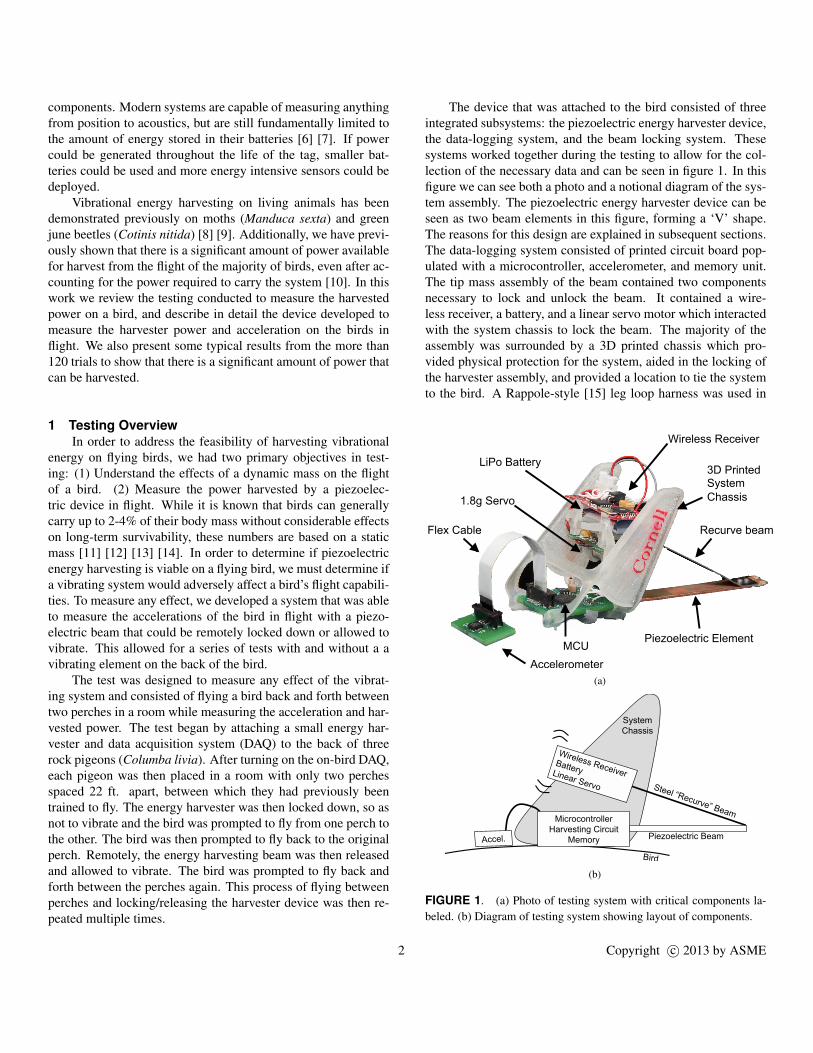
The device that was attached to the bird consisted of threeintegrated subsystems: the piezoelectric energy harvester device,the data-logging system, and the beam locking system. Thesesystems worked together during the testing to allow for the col-lection of the necessary data and can be seen in figure 1. In thisfigure we can see both a photo and a notional diagram of the sys-tem assembly. The piezoelectric energy harvester device can beseen as two beam elements in this figure, forming a ‘V’ shape.The reasons for this design are explained in subsequent sections.The data-logging system consisted of printed circuit board pop-ulated with a microcontroller, accelerometer, and memory unit.The tip mass assembly of the beam contained two componentsnecessary to lock and unlock the beam. It contained a wire-less receiver, a battery, and a linear servo motor which interactedwith the system chassis to lock the beam. The majority of theassembly was surrounded by a 3D printed chassis which pro-vided physical protection for the system, aided in the locking ofthe harvester assembly, and provided a location to tie the systemto the bird. A Rappole-style [15] leg loop harness was used in
Wireless Receiver
Piezoelectric Element
Recurve beam
1.8g Servo
LiPo Battery
MCU
Accelerometer
Flex Cable
3D Printed System
Chassis
(a)
Piezoelectric Beam
Steel “Recurve” Beam
Wireless Receiver
Battery Linear Servo
Bird
System
Chassis
Microcontroller
Harvesting Circuit
Memory Accel.
(b)
FIGURE 1. (a) Photo of testing system with critical components la-beled. (b) Diagram of testing system showing layout of components.
2 Copyright c© 2013 by ASME
this testing for the main assembly, while the accelerometer boardwas glued to feathers on the birds back which had been trimmed.Each of these subsystems required significant design and devel-opment detailed in the following sections.
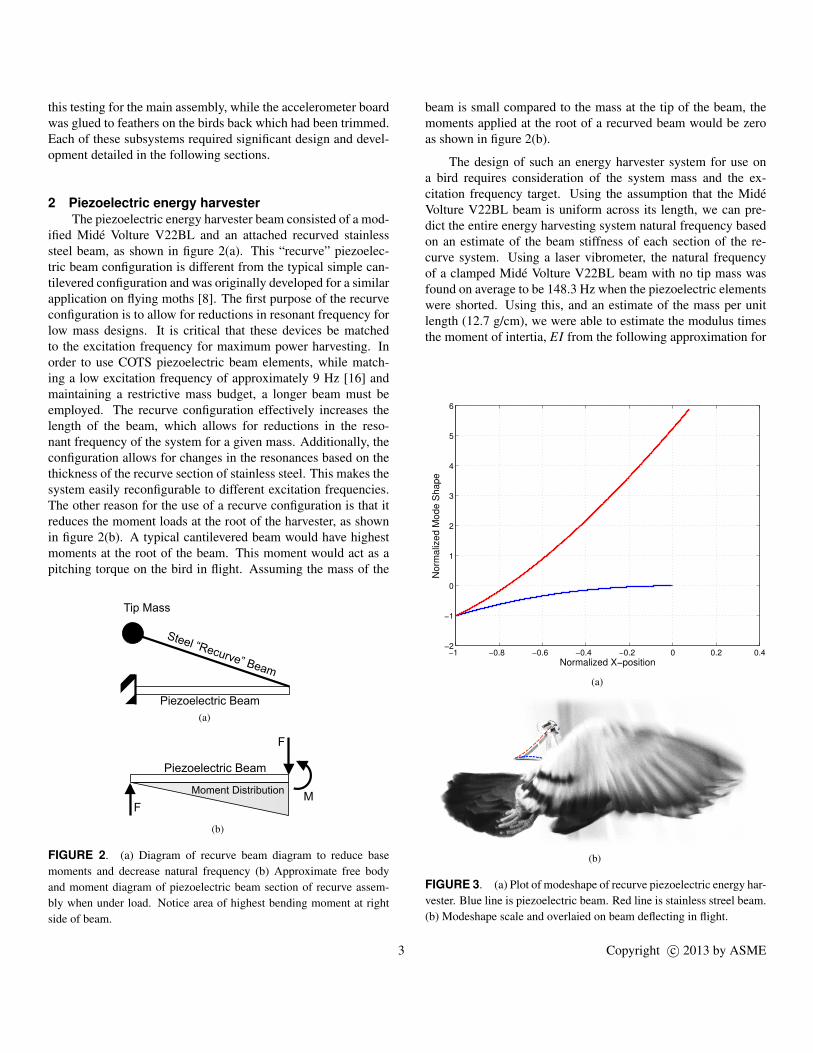
2 Piezoelectric energy harvesterThe piezoelectric energy harvester beam consisted of a mod-
ified Mide Volture V22BL and an attached recurved stainlesssteel beam, as shown in figure 2(a). This “recurve” piezoelec-tric beam configuration is different from the typical simple can-tilevered configuration and was originally developed for a similarapplication on flying moths [8]. The first purpose of the recurveconfiguration is to allow for reductions in resonant frequency forlow mass designs. It is critical that these devices be matchedto the excitation frequency for maximum power harvesting. Inorder to use COTS piezoelectric beam elements, while match-ing a low excitation frequency of approximately 9 Hz [16] andmaintaining a restrictive mass budget, a longer beam must beemployed. The recurve configuration effectively increases thelength of the beam, which allows for reductions in the reso-nant frequency of the system for a given mass. Additionally, theconfiguration allows for changes in the resonances based on thethickness of the recurve section of stainless steel. This makes thesystem easily reconfigurable to different excitation frequencies.The other reason for the use of a recurve configuration is that itreduces the moment loads at the root of the harvester, as shownin figure 2(b). A typical cantilevered beam would have highestmoments at the root of the beam. This moment would act as apitching torque on the bird in flight. Assuming the mass of the
Piezoelectric Beam
Steel “Recurve” Beam
Tip Mass
(a)
F
F
M
Piezoelectric Beam
Moment Distribution
(b)
FIGURE 2. (a) Diagram of recurve beam diagram to reduce basemoments and decrease natural frequency (b) Approximate free bodyand moment diagram of piezoelectric beam section of recurve assem-bly when under load. Notice area of highest bending moment at rightside of beam.
beam is small compared to the mass at the tip of the beam, themoments applied at the root of a recurved beam would be zeroas shown in figure 2(b).
The design of such an energy harvester system for use ona bird requires consideration of the system mass and the ex-citation frequency target. Using the assumption that the MideVolture V22BL beam is uniform across its length, we can pre-dict the entire energy harvesting system natural frequency basedon an estimate of the beam stiffness of each section of the re-curve system. Using a laser vibrometer, the natural frequencyof a clamped Mide Volture V22BL beam with no tip mass wasfound on average to be 148.3 Hz when the piezoelectric elementswere shorted. Using this, and an estimate of the mass per unitlength (12.7 g/cm), we were able to estimate the modulus timesthe moment of intertia, EI from the following approximation for
−1 −0.8 −0.6 −0.4 −0.2 0 0.2 0.4−2
−1
0
1
2
3
4
5
6
Normalized X−position
Norm
aliz
ed M
ode S
hape
(a)
(b)
FIGURE 3. (a) Plot of modeshape of recurve piezoelectric energy har-vester. Blue line is piezoelectric beam. Red line is stainless streel beam.(b) Modeshape scale and overlaied on beam deflecting in flight.
3 Copyright c© 2013 by ASME

fundamental frequency of a beam [17]:
f =1.8752
2πL2
(EI
m/L
)1/2
(1)
Solving this expression for EI gives 9.9 mN-m2. Knowl-edge of both this EI parameter and the mass per unit length ofthe piezoelectric beam allows us to determine the first naturalfrequency and mode shape of the resulting system. To designthis system we used an estimate of the sum of the masses ofthe components used as the tip mass (4.9 g). Additionally, theEI and mass per unit length parameters for the recurved steelbeam section could be calculated directly from the beam’s di-mension (57x6.2x0.254 mm). The resulting short circuit naturalfrequency for the entire recurve piezoelectric energy harvesterbeam would be 8.5 Hz, near the expected flapping frequency.The mode shape for such a system can be seen in figure 3(a),with the piezoelectric portion of the beam plotted in blue and thestainless steel portion plotted in red. This mode shape can beseen to be excited in figure 3(b), where the modes shape plot hasbeen scaled and overlaid on a photo of one of the birds in flight.
The charge developed by the piezoelectric energy harvestingbeam during the flight of the bird was dissipated over a matchload resistance. The optimal load resistance for an unrectifiedlow-coupling piezoelectric energy harvester at resonance can becalculated from the following expression [18]:
Ropt =1
C0ω(2)
Here C0 is the capacitance of the piezoelectric device and ω is theexcitation frequency. The capacitance of a Mide V22BL beamwith its two piezoelectric elements connected in parallel is 18nF [19] and we targeted a frequency of 8.5 Hz based on previ-ous measurements of similarly sized birds [16] and the calculatednatural frequency of the recurve beam assembly. The result op-timal load resistance would thus be 1.05 MΩ. The optimality ofthis load resistance was validated in benchtop testing of the sys-tem. The resistance used in the final circuit was close to idealand was 1.110 MΩ.
The voltage developed by these types of piezoelectric de-vices are routinely on the order 20-50V, and are thus too highfor direct measurements by the microcontroller used by the DAQsystem developed for this test. For this reason the circuit shownin figure 4 was used to measure the power dissipated by the loadresistance across the piezoelectric elements. The circuit con-sisted of a voltage divider to reduce the measured voltage to avalue within range of the analog-to-digital converter on the mi-crocontroller. Additionally, the measured voltage was biased byhalf of Vcc so to account for the AC nature of the piezoelectricsignal.
3 Miniature data acquisition systemThe device that monitored the power harvested by the piezo-
electric device and the acceleration of the bird was a miniaturedata acquisition system design specifically for these tests. Asseen in the system block diagram of figure 5, this subsystemwas centered around an MSP430F2274 microcontroller unit. Themicrocontroller was programmed to take three measurements at100 Hz and record the results to a XXXXMByte XXXX flashmemory unit. The three measurements that were recorded werethe voltage developed over the piezoelectric load resistance, thethree axes of acceleration from the Bosch BMA150 accelerome-ter, and the pulse width modulated (PWM) voltage signal sent tothe servo.
The PWM signal was sent from the wireless receiver tothe linear servo and controlled the locking and unlocking of the
Vcc
rload
10MΩ
10MΩ
10MΩ
10MΩ
Piezo-A
Piezo-B
MCU
ADC-1
MCU
ADC-2
Rload
FIGURE 4. Circuit used to read voltage from piezoelectric energyharvester. Voltage divider reduces voltage magnitude to level acceptableto microcontroller and 10MΩ resistors bias voltage.
MCU
Accelerometer
Wireless
Receiver
Servo
Flash
Memory
Piezoelectric
Harvester
Wireless
Transmitter
PWM
Signal
Serial
Voltage
I2C
Locking
Mechanism
Battery +4.1V
Load/Conditioning
Circuit
Tip Mass Assembly
Energy Harvester
DAQ system
Remote Component
FIGURE 5. Block diagram of mini-DAQ and piezoelectric harvester.Elements in grey were installed as the tip mass of the piezoelectric beam.
4 Copyright c© 2013 by ASME
piezoelectric device. By taking these three measurements, wewere able to understand the dynamics of the bird in flight, theharvested power, and have validation that the harvester was ei-ther locked or unlock for each trial. The PWM signal for theservo control had a typical duration of approximately 1.5 ms,which was below the resolution of the sample record of 100Hz.To account for this, the PWM signal was monitored by an ADCpin on the microcontroller, and a timer with edge detection resetwas employed to measure the duration of each pulse. For eachrecorded datapoint, the MCU logged the most recent pulse dura-tion measured by the timer.
The physical configuration of this system consisted of aprinted circuit board that hosted microcontroller and memorymodules. This board also served as the physical mount locationfor the piezoelectric beam. The accelerometer was mounted toa remote board as shown in figure 1 and connected to the mainboard with a flexible ribbon cable. This was done to minimizeany vibrations from the piezoelectric beam being measured bythe accelerometer. The power, ground, and PWM connectionsbetween the locking assembly on the tip of the beam and themain PCB were made by way of a braided bundle of flexible 36AWG silicone coated multi-strand wires.
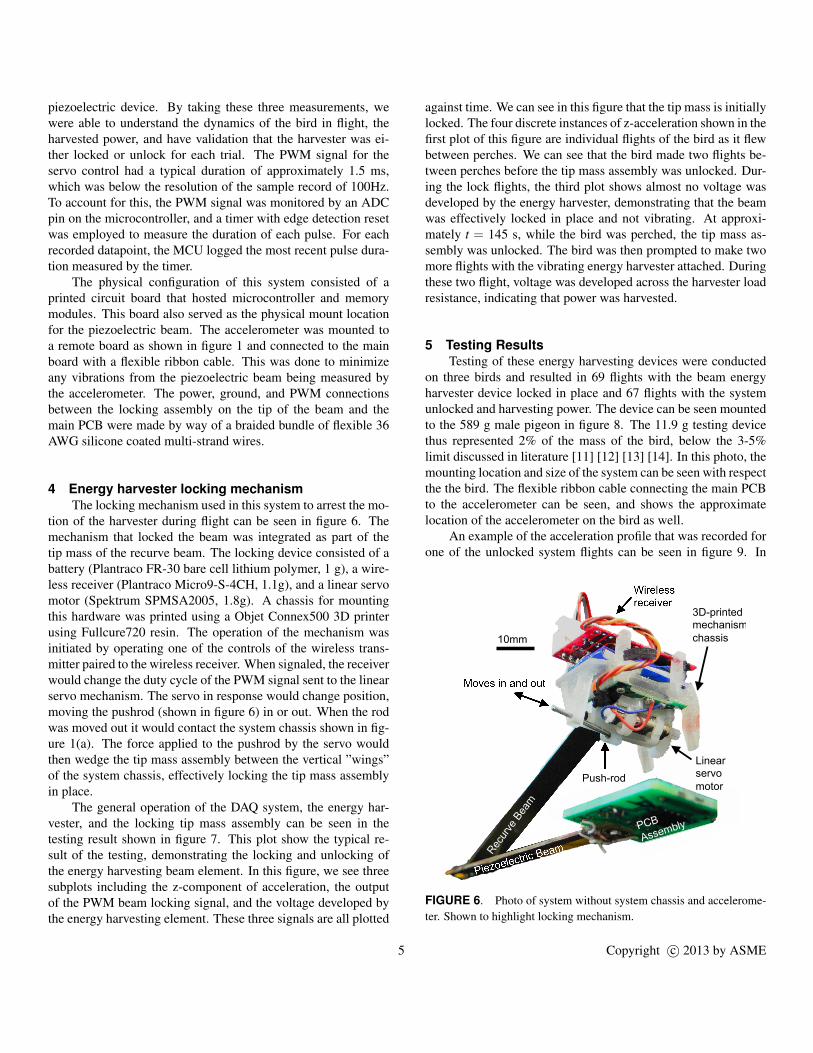
4 Energy harvester locking mechanismThe locking mechanism used in this system to arrest the mo-
tion of the harvester during flight can be seen in figure 6. Themechanism that locked the beam was integrated as part of thetip mass of the recurve beam. The locking device consisted of abattery (Plantraco FR-30 bare cell lithium polymer, 1 g), a wire-less receiver (Plantraco Micro9-S-4CH, 1.1g), and a linear servomotor (Spektrum SPMSA2005, 1.8g). A chassis for mountingthis hardware was printed using a Objet Connex500 3D printerusing Fullcure720 resin. The operation of the mechanism wasinitiated by operating one of the controls of the wireless trans-mitter paired to the wireless receiver. When signaled, the receiverwould change the duty cycle of the PWM signal sent to the linearservo mechanism. The servo in response would change position,moving the pushrod (shown in figure 6) in or out. When the rodwas moved out it would contact the system chassis shown in fig-ure 1(a). The force applied to the pushrod by the servo wouldthen wedge the tip mass assembly between the vertical ”wings”of the system chassis, effectively locking the tip mass assemblyin place.
The general operation of the DAQ system, the energy har-vester, and the locking tip mass assembly can be seen in thetesting result shown in figure 7. This plot show the typical re-sult of the testing, demonstrating the locking and unlocking ofthe energy harvesting beam element. In this figure, we see threesubplots including the z-component of acceleration, the outputof the PWM beam locking signal, and the voltage developed bythe energy harvesting element. These three signals are all plotted
against time. We can see in this figure that the tip mass is initiallylocked. The four discrete instances of z-acceleration shown in thefirst plot of this figure are individual flights of the bird as it flewbetween perches. We can see that the bird made two flights be-tween perches before the tip mass assembly was unlocked. Dur-ing the lock flights, the third plot shows almost no voltage wasdeveloped by the energy harvester, demonstrating that the beamwas effectively locked in place and not vibrating. At approxi-mately t = 145 s, while the bird was perched, the tip mass as-sembly was unlocked. The bird was then prompted to make twomore flights with the vibrating energy harvester attached. Duringthese two flight, voltage was developed across the harvester loadresistance, indicating that power was harvested.
5 Testing ResultsTesting of these energy harvesting devices were conducted
on three birds and resulted in 69 flights with the beam energyharvester device locked in place and 67 flights with the systemunlocked and harvesting power. The device can be seen mountedto the 589 g male pigeon in figure 8. The 11.9 g testing devicethus represented 2% of the mass of the bird, below the 3-5%limit discussed in literature [11] [12] [13] [14]. In this photo, themounting location and size of the system can be seen with respectthe the bird. The flexible ribbon cable connecting the main PCBto the accelerometer can be seen, and shows the approximatelocation of the accelerometer on the bird as well.
An example of the acceleration profile that was recorded forone of the unlocked system flights can be seen in figure 9. In
Wireless receiver
Piezoelectric Beam
Moves in and out
Rec
urve
Bea
m
Push-rod
Linear servo
motor
PCB
Assembly
3D-printed mechanism
chassis 10mm
FIGURE 6. Photo of system without system chassis and accelerome-ter. Shown to highlight locking mechanism.
5 Copyright c© 2013 by ASME

this figure, three graphs are shown, one for each component ofacceleration using a coordinate system fixed the the bird. Thex-direction was in the forward direction of flight, the y-directionwas toward the bird’s left wing, and the z-direction pointed upoff of the bird’s back. The data presented here as been high-pass filtered to remove the DC component of acceleration relatedto gravity. In this plot we see the highest accelerations at thebeginning and ends for the flight when the bird is taking off andlanding. The acceleration peaks in the z-direction were nearly4g’s and 3 g’s in the x-direction. This shows that while an energyharvesting beam could be mounted in the z-direction to harvestenergy from the x-component of acceleration, the z-direction hashigher acceleration magnitudes and would produce more power.Furthermore, this orientation would produce less drag on the birdthan a beam mounted in the z-direction. In this figure we see verylittle acceleration in the y-direction. This is to be expected as thebirds were flying in straight lines between perches. The meanfundamental frequency for this flight was 7.5 Hz, which whileless than the targeted 8.5 Hz for the energy harvesting systemwas close enough to induce a significant response in the energyharvesting system.
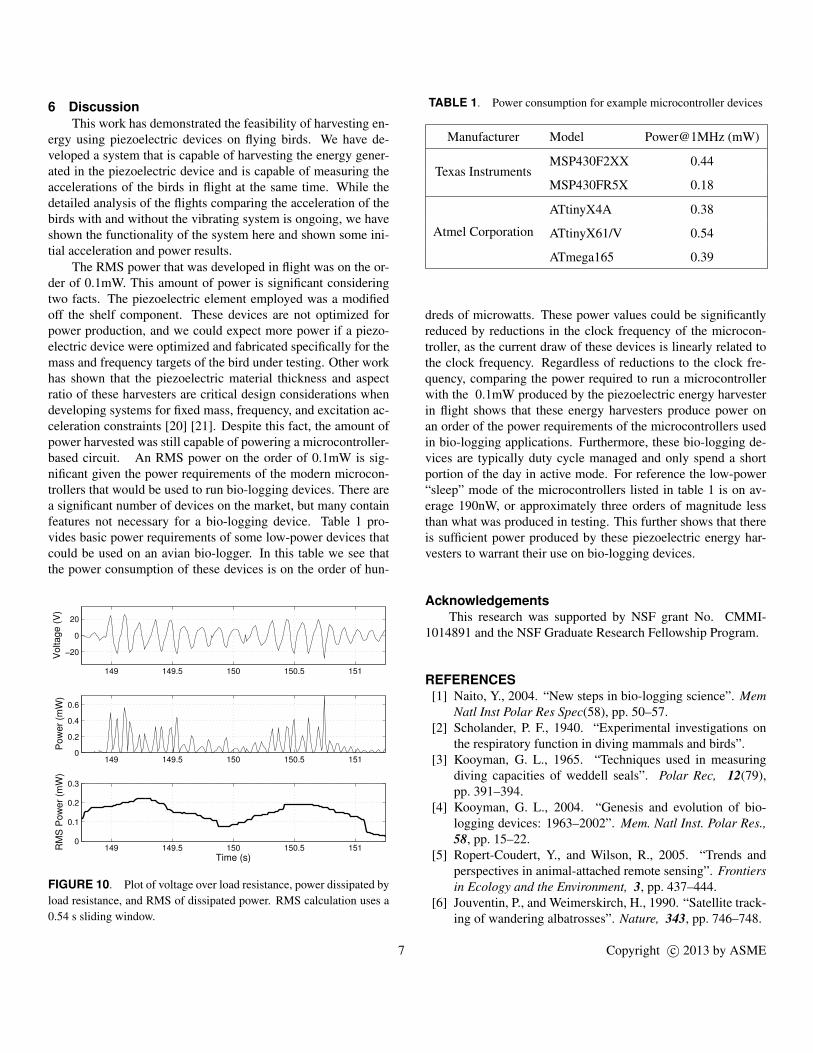
The voltage, instantaneous power, and sliding windowedRMS power developed by the piezoelectric energy harvester overthe flight shown in figure 9 can be seen in figure 10. In the firstgraph of this figure we see a voltage developed by the piezoelec-tric device matching the the z-component acceleration profile,with high initial and final amplitudes. The voltage amplitudevaried between approximately 9 and 25 V for this trial and wassimilar in other trials. The instantaneous power developed overthe 1.11 MΩ load resistance can be seen in the second graph of
125 130 135 140 145 150 155 160 165
−20
0
20
Vo
lta
ge
(V
)
Time (s)
125 130 135 140 145 150 155 160 165
Locked
Unlocked
125 130 135 140 145 150 155 160 165−4
−2
0
2
4
Z−
Acce
l. (
g)
Locking Signal
FIGURE 7. Acceleration, locking signal, and harvester voltage vs.time showing near zero harvester voltage when locked down despitemotion of bird.
figure 10. In this plot, we see instantaneous power peaks reach-ing as high as 0.72 mW during the landing and closer to 0.2 mWduring the central portion of the flight. In the third graph of thisfigure, we present a sliding window RMS result. The windowsize used was 0.54 s, representing approximately 5 flapping cy-cles of the bird. This result gives a better estimate of what theharvester would produce if the signal were rectified and used topower a circuit or charge a battery. We can see that in this graphthat the RMS power varies between 0.075 mW and 0.22 mW.
FIGURE 8. System mounted to back of pigeon
149 149.5 150 150.5 151
−4
−2
0
2
4
Z−
Accel. (
g)
Time (s)
149 149.5 150 150.5 151
−4
−2
0
2
4
Y−
Accel. (
g)
149 149.5 150 150.5 151
−4
−2
0
2
4
X−
Accel. (
g)
FIGURE 9. Plots of three acceleration components for typical flight.
6 Copyright c© 2013 by ASME
6 DiscussionThis work has demonstrated the feasibility of harvesting en-
ergy using piezoelectric devices on flying birds. We have de-veloped a system that is capable of harvesting the energy gener-ated in the piezoelectric device and is capable of measuring theaccelerations of the birds in flight at the same time. While thedetailed analysis of the flights comparing the acceleration of thebirds with and without the vibrating system is ongoing, we haveshown the functionality of the system here and shown some ini-tial acceleration and power results.
The RMS power that was developed in flight was on the or-der of 0.1mW. This amount of power is significant consideringtwo facts. The piezoelectric element employed was a modifiedoff the shelf component. These devices are not optimized forpower production, and we could expect more power if a piezo-electric device were optimized and fabricated specifically for themass and frequency targets of the bird under testing. Other workhas shown that the piezoelectric material thickness and aspectratio of these harvesters are critical design considerations whendeveloping systems for fixed mass, frequency, and excitation ac-celeration constraints [20] [21]. Despite this fact, the amount ofpower harvested was still capable of powering a microcontroller-based circuit. An RMS power on the order of 0.1mW is sig-nificant given the power requirements of the modern microcon-trollers that would be used to run bio-logging devices. There area significant number of devices on the market, but many containfeatures not necessary for a bio-logging device. Table 1 pro-vides basic power requirements of some low-power devices thatcould be used on an avian bio-logger. In this table we see thatthe power consumption of these devices is on the order of hun-
149 149.5 150 150.5 1510
0.1
0.2
0.3
RM
S P
ow
er
(mW
)
Time (s)
149 149.5 150 150.5 1510
0.2
0.4
0.6
Pow
er
(mW
)
149 149.5 150 150.5 151
−20
0
20
Voltage (
V)
FIGURE 10. Plot of voltage over load resistance, power dissipated byload resistance, and RMS of dissipated power. RMS calculation uses a0.54 s sliding window.
TABLE 1. Power consumption for example microcontroller devices
Manufacturer Model Power@1MHz (mW)
Texas InstrumentsMSP430F2XX 0.44
MSP430FR5X 0.18
Atmel Corporation
ATtinyX4A 0.38
ATtinyX61/V 0.54
ATmega165 0.39
dreds of microwatts. These power values could be significantlyreduced by reductions in the clock frequency of the microcon-troller, as the current draw of these devices is linearly related tothe clock frequency. Regardless of reductions to the clock fre-quency, comparing the power required to run a microcontrollerwith the 0.1mW produced by the piezoelectric energy harvesterin flight shows that these energy harvesters produce power onan order of the power requirements of the microcontrollers usedin bio-logging applications. Furthermore, these bio-logging de-vices are typically duty cycle managed and only spend a shortportion of the day in active mode. For reference the low-power“sleep” mode of the microcontrollers listed in table 1 is on av-erage 190nW, or approximately three orders of magnitude lessthan what was produced in testing. This further shows that thereis sufficient power produced by these piezoelectric energy har-vesters to warrant their use on bio-logging devices.
AcknowledgementsThis research was supported by NSF grant No. CMMI-
1014891 and the NSF Graduate Research Fellowship Program.
REFERENCES[1] Naito, Y., 2004. “New steps in bio-logging science”. Mem
Natl Inst Polar Res Spec(58), pp. 50–57.[2] Scholander, P. F., 1940. “Experimental investigations on
the respiratory function in diving mammals and birds”.[3] Kooyman, G. L., 1965. “Techniques used in measuring
diving capacities of weddell seals”. Polar Rec, 12(79),pp. 391–394.
[4] Kooyman, G. L., 2004. “Genesis and evolution of bio-logging devices: 1963–2002”. Mem. Natl Inst. Polar Res.,58, pp. 15–22.
[5] Ropert-Coudert, Y., and Wilson, R., 2005. “Trends andperspectives in animal-attached remote sensing”. Frontiersin Ecology and the Environment, 3, pp. 437–444.
[6] Jouventin, P., and Weimerskirch, H., 1990. “Satellite track-ing of wandering albatrosses”. Nature, 343, pp. 746–748.
7 Copyright c© 2013 by ASME

[7] Burgess, W., Tyack, P., Le Boeuf, B., and Costa, D., 1998.“A programmable acoustic recording tag and first resultsfrom free-ranging northern elephant seals”. Deep-Sea Re-search Part II, 45(7), pp. 1327–1351.
[8] Reissman, T., MacCurdy, R. B., and Garcia, E., 2011.“Electrical power generation from insect flight”. Proc.SPIE 7977, Active and Passive Smart Structures and Inte-grated Systems 2011, 7977, April, pp. 797702–797702–9.
[9] Aktakka, E. E., Kim, H., and Najafi, K., 2011. “Energyscavenging from insect flight”. J. Micromech. Microeng.,21(095016).
[10] Shafer, M. W., and Garcia, E., 2011. “Maximum and prac-tical sustainably harvestable vibrational power from aviansubjects”. ASME 2011 Conference on Smart Materials,Adaptive Structures and Intelligent Systems (SMASIS2011),2011(54723), pp. 353–359.
[11] Naef-Daenzer, B., Widmer, F., and Nuber, M., 2001. “Atest for effects of radio-tagging on survival and movementsof small birds”. Avian Science, 1(1), pp. 15–23.
[12] USGS, 2011. How to request auxiliary marking permis-sion. http://www.pwrc.usgs.gov/bbl/manual/aarequs.cfm.[Online; accessed February 28, 2012].
[13] Hill, D., and Robertson, P., 1987. “The role of radio-telemetry in the study of galliformes”. World Pheas. Assoc.J, 12, pp. 81–92.
[14] Hedin, R., and Caccamise, D., 1982. “A method for select-ing transmitter weights based on energetic cost of flight”.In Trans Northeast Fish Wildl Conf, Vol. 39, p. 115.
[15] Rappole, J. H., and Tipton, A. R., 1991. “New harnessdesign for attachment of radio transmitters to small passer-ines”. Journal of Field Ornithology, 62(3), pp. 335–337.
[16] Tobalske, B. W., Hedrick, T., and Biewener, A. A., 2003.“Wing kinematics of avian flight across speeds”. Journalof Avian Biology, 34, pp. 177–184.
[17] Blevins, R. D., 1979. Formulas for Natural Frequency andMode Shape. Krieger Publishing Company.
[18] Guyomar, D., Badel, A., Lefeuvre, E., and Richard, C.,2005. “Toward energy harvesting using active materials andconversion improvement by nonlinear processing”. IEEETransactions on Ultrasonics, Ferroelectrics, and FrequencyControl, 52(4), April, pp. 584–595.
[19] Mide, 2013. Volture piezoelectric energy harvestersdatasheet, January.
[20] Shafer, M. W., Bryant, M., and Garcia, E., 2012. “De-signing maximum power output into piezoelectric energyharvesters”. Smart Materials and Structures, 21(8).
[21] Shafer, M., and Garcia, E. “The power and efficiency limitsof piezoelectric energy harvesting”. Journal of Vibrationsand Acoustics, (in review).
8 Copyright c© 2013 by ASME