testing the dynamic model of educational effectiveness
TRANSCRIPT
1
TESTING THE DYNAMIC MODEL OF EDUCATIONAL EFFECTIVENESS: TEACHER EFFECTS ON COGNITIVE AND AFFECTIVE OUTCOMES
L. KYRIAKIDES1 & B.P.M. CREEMERS2 Department of Education, University of Cyprus1
Faculty of Psychology, Education and Sociology, University of Groningen2
ABSTRACT
This paper presents results of a study in which 50 schools, 108 classes and 2503 year 5 Cypriot pupils
participated. The study provides evidence about the validity of the dynamic model which is multilevel
in nature and is based on the assumption that the relation of some factors with achievement may be
curvilinear. Moreover, it examines whether each factor can be measured by taking into account five
dimensions: frequency, focus, stage, quality and differentiation. The paper refers to the methods used
to test the model at the classroom level by measuring teacher effectiveness in mathematics, language,
and religious education. The findings of the study are presented. Implications for the development of
the dynamic model are drawn.
INTRODUCTION
In the last 25 years Educational Effectiveness Research (EER) has improved considerably by the
criticism on research design, the sampling and statistical techniques. Methodological advances,
particularly the availability of particular software for the analysis of multilevel data, have enabled
more efficient estimates of teacher and school differences in student achievement to be obtained
(Goldstein, 2003). There is also substantial agreement as to appropriate methods of estimating school
differences/effects and the kinds of data required for valid comparisons to be made. As far as the
theoretical component of the field is concerned, progress was made by a more precise definition of the
concepts used and the relations between the concepts (e.g., Mortimore et al., 1988; Scheerens, 1992;
Levin & Lezotte, 1990). However, there is a shortage of rational models from which researchers can
build theory. The problem is aggravated by infrequent use of whatever models exist (Scheerens &
Bosker, 1997). As a consequence, most of the studies on educational effectiveness are concerned with
2
the establishment of statistical relationships between variables rather than with the generation and
testing of theories which could explain those relationships (Creemers, 2002).
Another significant weakness of studies on educational effectiveness arises from the fact that
almost all of them are exclusively focused on language or mathematics. Researchers have not been
able to monitor students’ progress in the full range of the school curriculum and did not examine
educational effectiveness in relation to the new goals of education such as the development of meta-
cognitive skills (Campbell et al., 2003). Thus, EER has been criticized by opponents for a narrow
scope, reducing school learning to discrete, assessable and comparable fragments of academic
knowledge (Slee & Weiner, 1998, p. 2). The arguments used by the critiques of EER can be countered
by referring to numerous studies that used multiple measures of schooling outcomes (e.g., Bosker,
1990; Knuver & Brandsma, 1993; Kyriakides, 2005; Opdenakker & Van Damme, 2000). It becomes
evident from these studies that it is possible to measure a broad range of outcomes in a valid and
reliable way using traditional methods of assessment.
It can be claimed that there is a need to develop a new theoretical framework of EER which
takes into account the new goals of education and emphasizes teaching for understanding and
development of metacognitive skills rather than teaching based on transmission of knowledge (Pines
& West, 1986; Prawat, 1989). In order to achieve this purpose, a dynamic model of EER is proposed
(Creemers & Kyriakides, in press). The main characteristics of the dynamic model are provided in the
second section of this paper. Although Creemers & Kyriakides (2005) acknowledge the importance of
establishing a comprehensive dynamic model which refers to effectiveness factors at all levels (i.e.,
classroom, school and system), studies on EER show that the classroom level is more significant than
the school and the system level (e.g., Kyriakides et al., 2000; Teddlie & Reynolds, 2000; Yair, 1997)
and defining factors at the classroom level is a prerequisite for defining the school and the system
level (Creemers, 1994). In this context, this paper presents the results of a study which attempts to test
the validity of the dynamic model of EER at the classroom level. Thus, the third section presents the
classroom level factors included in the dynamic model of EER. The methods used to test the validity
of the model and the main results of the study are illustrated in the fourth and the fifth section of the
paper. Finally, implications of the findings for the development of the dynamic model are drawn.
3
A PROPOSED DYNAMIC MODEL OF EER
The dynamic model of EER is mainly based on the following three assumptions. First, the fact that
most of the effectiveness studies are exclusively focused on language or mathematics rather than on
the whole school curriculum aims (cognitive, metacognitive and affective) reveals that the model of
EER should take into account the new goals of education and related to this their implications for
teaching and learning. This means that the outcome measures should be defined in a more broad way
rather than restricting to the achievement of basic skills. It also implies that new theories of teaching
and learning are used in order to specify variables associated with the quality of teaching. Second, an
important constraint of the existing approaches of modeling educational effectiveness is the fact that
the whole process does not contribute significantly to the improvement of educational effectiveness.
Thus, the dynamic model is established in a way that helps policy makers and practitioners to improve
educational practice by taking rational decisions concerning the optimal fit of the factors within the
model and the present situation in the schools or educational systems (Creemers & Kyriakides, in
press). Finally, the dynamic model should not only be parsimonious but also be able to describe the
complex nature of educational effectiveness. This implies that the model could be based on specific
theory but at the same time some of the factors included in the major constructs of the model are
interrelated within and/or between levels.
Based on the rationale of the dynamic model presented above, the essential characteristics of
the model are as follows. First, the model refers to multiple factors of effectiveness which operate at
different levels. Second, it is expected that some factors which operate at the same level are related to
each other. It is therefore important to specify groupings of factors. Third, although there are different
effectiveness factors and groupings of factors, it is assumed that each factor can be defined and
measured using similar dimensions. This is a way to consider each factor as a multidimensional
construct and at the same time to be in line with the parsimonious nature of the model. Finally, the
model is designed in a way that takes into account the possibility that the relationship between the
factors and the outcomes may not be linear. This refers to the possibility of searching for optimal
values of the various dimensions of the factors and optimal combinations between factors.
4
The comprehensive model of educational effectiveness (Creemers, 1994) is in line with at
least two of the starting points upon which the dynamic model is based. Creamers’ model is based on
the assumption that the influences on student achievement are multilevel and, thereby, it refers to
factors at different levels (i.e., student, classroom, school, system) which are related with student
achievement. Direct and indirect relations between the levels and the outcomes are also identified.
The proposed dynamic model also assumes that these relations may not be necessarily linear and that
factors which operate at the same level may also be related to each other. Finally, in principle each
factor which refers to the classroom, school and system can be measured by taking into account the
following five dimensions: frequency, focus, stage, quality and differentiation. The importance of
taking each dimension into account is discussed below.
First, the frequency dimension refers to the quantity that an activity associated with an
effectiveness factor is present in a system, school or classroom. This is probably the easiest way to
measure the effect of a factor on student achievement and almost all studies used this dimension to
define effectiveness factors. However, this dimension may not always be related in a linear way with
student outcomes. For example, it is assumed that after an optimal value of using a personal
monitoring system, this factor may not have an additional effect on outcomes but even may lead to
negative effect in teacher behavior and ultimately in student outcomes.
Second, the factors are measured by taking into account the focus of the activities which
reveals the function of the factor at classroom, school and system level. Two aspects of focus of each
factor are measured. The first one refers to the specificity of the activities which can range from
specific to general. For example, in the case of school policy on parental involvement, the policy
could either be more specific in terms of concrete activities that are expected to take place (e.g., it
refers to specific hours that parents can visit the school) or more general (e.g., it informs parents that
they are welcome to the school but without giving them specific information about what, how and
when). The second aspect of this dimension addresses the purpose for which an activity takes place.
An activity may be expected to achieve a single or multiple purposes. In the case of school policy on
parental involvement, the activities might be restricted to a single purpose (e.g., parents visit schools
to get information about student progress). On the other hand, the activities might be addressed more
5
than one purpose (e.g., parents visit the school to exchange information about children progress and to
assist teachers in and outside the classroom). It is expected that the measurement of the focus of an
activity either in terms of its specificity or in terms of the number of purposes that is expected to
achieve is related in a curvilinear way with student outcomes.
Third, the activities associated with a factor can be measured by taking into account the stage
at which they take place. It is expected that the factors need to take place over a long period of time to
ensure that they have a continuous direct or indirect effect on student learning. For example, school
policy on quantity of teaching which refers to policy on cancellation of lessons and absenteeism is
expected to be implemented throughout the year and not only through specific regulations announced
at a specific point of time (e.g., only at the beginning of the school year). It is also expected that the
continuity will be achieved when the school is flexible in redefining its own policy and adapting the
activities related to the factor by taking into account the results of its own self-evaluation mechanism.
Measuring the stage dimension gives information about the continuity of the existence of a factor but
the activities associated with the factor may not necessarily be the same.
Fourth, the dimension quality refers to the properties of the specific factor itself, as these are
discussed in the literature. For instance, school policy on assessment can be measured by looking at
the mechanisms which have been developed in order to establish instruments which meet
psychometric standards (e.g., valid, reliable, representative to the content taught). At the same time,
this policy should make clear and guarantee that teachers are expected to make use of the information
gathered from assessment in order to meet their student needs and this gives more emphasis to the
formative function of assessment (Black & Wiliam, 1998; Harlen & James, 1997; Kyriakides et al.,
2000).
Finally, the dimension differentiation refers to the extent to which activities associated with a
factor are implemented in the same way for all the subjects involved with it. Although this dimension
could be considered as part of the quality dimension, special emphasis to differentiation is given due
to the fact that EER has shown that adaptation to specific needs of each subject or group of subjects
increases the successful implementation of a factor and ultimately maximizes its effect on student
learning outcomes (Kyriakides & Creemers, 2006). The differentiation dimension does not
6
necessarily imply that the subjects are not expected to achieve the same purposes. On the contrary,
adopting the policy on the special needs of each group of schools/teachers/students may ensure that
all of them will become able to achieve the same purposes.
Above we have described in a more general way the five dimensions which are used to
measure each effectiveness factor of the dynamic model. The examples which were given referred to
factors at school and system levels. However, the results of the first phase of the longitudinal study,
presented here, are concerned with the validity of the dynamic model at the classroom level. For this
reason, the next section refers to the classroom level factors of the model.
EFFECTIVENESS FACTORS AT THE CLASSROOM LEVEL: THE MEASUREMENT OF
TEACHER’S INSTRUCTIONAL ROLE
Based on the main findings of TER (e.g., Brophy & Good, 1986; Campbell et al., 2004; Creemers,
1994; Kyriakides, Campbell, & Christofidou, 2002; Muijs & Reynolds, 2001; Rosenshine, 1983), the
dynamic model refers to eight effectiveness factors which describe teacher’s instructional role:
orientation, structuring, questioning, teaching modeling, applications, management of time, teacher
role in making classroom a learning environment, and assessment. These eight factors were found to
be consistently related with student outcomes. Two of them (i.e., orientation, teaching modeling) are
in line with the principles of teaching for understanding and are expected to promote the achievement
of the new goals of education such as the development of metacognitive skills.
A) Orientation
Orientation refers to teacher behavior in providing the objectives for which a specific task or lesson or
series of lessons take(s) place and/or challenging students to identify the reason for which an activity
takes place in the lesson. It is expected that the engagement of students with orientation tasks might
encourage them to actively participate in the classroom since the tasks that take place are meaningful
for them. As a consequence, the dimension frequency is measured by taking into account the number
of orientations tasks that take place in a typical lesson as well as how long each orientation task takes
place. These two indicators may help us identify the importance that the teacher attached to this
7
factor. As far as the focus dimension is concerned, it is possible that an orientation task may refer to a
part of a lesson or to the whole lesson or even to a series of lessons (e.g., a lesson unit). This
classification refers to the specificity of the orientation task. The second aspect of focus which refers
to the purpose of the activity can be measured by examining the extent to which an activity is
restricted to finding one single reason for doing a task or finding the multiple reasons for doing a task.
The measurement of this dimension reveals the extent to which teachers help their students
understand the importance of finding the meanings of each task they are expected to be involved. The
third dimension of measuring orientation refers to the stage at which an activity takes place. It is
expected that orientation tasks will take place in different parts of a lesson or series of lessons (e.g.,
introduction, core, ending of the lesson). Further, it is assumed that effective teachers are able to take
other perspectives into account during these orientation tasks. For example, students may come with
suggestions for the reasons of doing a specific task which an effective teacher should take into
account. Fourth, the measurement of quality refers to the properties of the orientation task and
especially whether it is clear for the students. It also refers to the impact that the task has on student
engagement in learning process. For example, teachers may present the reasons of doing a task simply
because they have to do it and is part of their teaching routine without having much effect on student
participation whereas others may encourage students to identify the purposes that can be achieved by
doing a task and therefore to increase their motivation towards a specific task/lesson/series of lessons.
Finally, differentiation is measured in a similar way for each of the eight factors. In the case of
orientation, teachers are expected to provide different types of orientation tasks to students according
to their learning needs.
B) Structuring
Rosenshine & Stevens (1986) point out that achievement is maximized when teachers not only
actively present materials but structure it by: a) beginning with overviews and/or review of objectives;
b) outlining the content to be covered and signaling transitions between lesson parts; c) calling
attention to main ideas; and d) reviewing main ideas at the end. Summary reviews are also important
since they integrate and reinforce the learning of major points (Brophy & Good, 1986). It can be
8
claimed that these structuring elements not only facilitate memorizing of the information but allow for
its apprehension as an integrated whole with recognition of the relationships between parts. Moreover,
achievement is higher when information is presented with a degree of redundancy, particularly in the
form of repeating and reviewing general views and key concepts. Therefore, structuring is measured
as follows.
First, the dimension frequency is measured in a similar way as in the case of orientation. The
two indicators that can be used are the number of tasks that take place in a typical lesson as well as
how long each task takes place (e.g., the percentage of teaching time spent on structuring). Second,
the focus dimension is measured by taking into account that a structuring task may either refer to a
part of a lesson or to the whole lesson or even to a series of lessons (e.g., a lesson unit). As far as the
second aspect of focus is concerned, a structuring task may refer to the achievement of a single
objective or to the relation of the elements of the lesson in relation to multiple objectives. It is
expected that the structuring tasks which have an impact on student behavior are those which refer to
the achievement of multiple objectives since the tasks which refer to a single objective may increase
the fragmentation of learning process. The third dimension of measuring structuring which refers to
the stage at which an activity takes place is also measured in the same way as orientation. Structuring
tasks may take place in different parts of a lesson or series of lessons (e.g., introduction, core, ending
of the lesson). Fourth, the dimension of quality is measured by examining whether structuring tasks
are not only clear for the students but also help them understand the structure of the lesson. For this
reason, we don’t measure clarity as a property of structuring nor as an independent factor of teacher
effectiveness but clarity is seen as a condition for helping students to understand the structure and the
content of a lesson/series of lessons. Quality is also measured by investigating the extent to which
teachers organize their lessons/series of lessons in a way to move from easier tasks to more
complicate. Finally, differentiation is measured by investigating the extent to which teachers provide
different types of structuring tasks to students according to their learning needs.
9
C) Questioning techniques
Muijs & Reynolds (2000) indicate that the focus of TER on teacher actively presenting materials
should not be seen as an indication that traditional lecturing and drill approach is an effective teaching
approach. Effective teachers ask a lot of questions and attempt to involve students in class discussion.
Although the data on cognitive level of question yield inconsistent results (Redfield & Rousseau,
1981), optimal question difficulty is expected to vary with context. There should also be a mix of
product and process questions but effective teachers ask more process questions (Everston et al, 1980;
Askew & William, 1995). Therefore, the frequency dimension has to be measured through different
aspects. The total number of questions and the ratio between process and product questions are two
major indicators of this dimension. Another dimension has to do with the length of pause following
questions which is expected to vary according to the difficulty level of questions. Brophy & Good
(1986) point out that a question calling for application of abstract principles should require a longer
pause than a factual question. Focus is measured by looking at the type of question and especially its
relation with the tasks that take place during a lesson (i.e., specificity) as well as with the objectives
that are expected to be achieved. As far as the measurement of stage is concerned, it is taken into
account that teachers may raise questions at different parts of the lesson and for different reasons.
Quality is measured by taking into account the clarity of a question and especially the extent
to which students understand what they are expected to find out. Another property that also can be
measured is the appropriateness of the difficulty level of the question since it is possible that students
may understand the question and still don’t answer because it is too difficult for them. Quality is,
finally, measured by investigating the way the teacher deals with student responses to his/her
questions. Correct responses should be acknowledged for other students’ learning, while responses
that are partly correct require affirmation of the correct part, and rephrasing of the question (Brophy
& Good, 1986; Rosenshine & Stevens, 1986). Following incorrect answers, teachers should begin by
indicating that the response is not correct but avoid personal criticism and show why the correct
answer is correct (Rosenshine, 1971). Finally, differentiation is measured by looking at the extent to
which teachers direct questions to specific student or take answers from specific students. It is also
10
assumed that the feedback that effective teachers give to student answers varies according to their
needs.
D) Teaching Modeling
Although there is a long tradition in research on teaching higher order thinking skills and especially
problem solving, these teaching and learning activities have taken more attention during the last
decade due to the emphasis given in policy on the achievement of new goals of education. Thus, TER
has shown that effective teachers are expected to help pupils to use strategies and/or develop their
own strategies which can help them solve different types of problems (Kyriakides et al., 2002). As a
result of this, it is more likely that students will develop skills that help them organize their own
learning (e.g., self-regulation, active learning). Thus, the frequency dimension of teaching modeling
can be measured by looking at the number of teaching modeling tasks that take place in a lesson and
the teaching time devoted to them. As far as the focus is concerned, teaching modeling tasks can be
examined in relation to the extent to which they refer to strategies which can be used to solve
problems under various conditions (e.g., problems of different subjects). Focus is also measured in
relation to the extent to which teachers provide opportunities to students to use/develop more than one
strategy to solve specific problems/types of problems. Third, the stage dimension is concerned with
the sequence under which a teaching modeling is used in the classroom. It is possible that initially
students are faced with a problem and then are expected to use/develop a particular strategy to solve
it. On the other hand, teachers may teach a strategy or different strategies to students and then
students are asked to use these strategies in order to solve a problem.
Fourth, the measure of the quality deals with the properties of teaching-modeling tasks and
especially with the role that the teacher is expected to play in order to help students use a strategy to
solve their problems. Teachers may either present a strategy with clarity or they may invite students to
explain how they solve a problem and use that information for promoting the idea of modeling. The
later may encourage students not only to use but also to develop their own strategies for solving
problems. Finally, differentiation can be seen in terms of adopting teaching modeling to specific
needs of group of students. These might result in more emphasis on applying a single strategy for a
11
group of students to solve problems or more emphasis on using multiple strategies or even develop
new strategies for other groups of students.
E) Application
Effective teachers also use seatwork or small group tasks since they provide needed practice and
application opportunities (Borich, 1992) and can be linked to the direct teaching model (Rosenshine,
1983) which emphasizes immediate exercise of topics taught during the lesson. The frequency is
measured by looking at the total time devoted to application tasks (i.e., percentage of teaching time).
Focus can be measured by looking at the specificity of the tasks that students are expected to perform.
We can, therefore, examine the extent to which the application tasks refer to some parts of the lesson
or to the whole lesson or even to a series of lessons. This way of measurement is also related to the
second aspect of focus since it enables us to examine the number of purposes that application tasks
cover. Stage is measured by looking at the phase of the lesson that each application task takes place.
As far as the measurement of the quality of application tasks is concerned, the appropriateness of each
task is measured by looking at the extent to which students are simply asked to repeat what they have
already covered with their teacher or the application task is more complex than the content covered in
the lesson or even it is used as a starting point for the next step of teaching and learning. Finally,
differentiation refers to the extent to which teachers give more opportunities for application to
students who need them. It also refers to teacher behavior in monitoring and supervising and giving
corrective feedback during application activities. Brophy & Good (1986) argue that once the students
are released to work independently effective teachers circulate to monitor progress and provide help
and feedback.
F) The classroom as a learning environment: The contribution of the teacher
Muijs & Reynolds (2000) point out that classroom climate is a factor that TER has found to be
significant. Moreover, Creemers & Kyriakides (2005) argue that EER has to take the first steps to
integrate elements of different research traditions used to examine classroom climate. The proposed
dynamic model concentrates on measuring teacher contribution in creating a learning environment in
12
his/her classroom and five elements of classroom as a learning environment are taken into account:
teacher-student interaction, student-student interaction, students’ treatment by the teacher,
competition between students, and classroom disorder. The first two elements are important
components of measuring classroom climate as classroom environment research has shown (Cazden,
1986; den Brok, Brekelmans, & Wubels, 2004; Fraser, 1991) but the dynamic model refers to the type
of interactions that exist in a classroom rather than on how students perceive teacher interpersonal
behavior. The other three elements refer to the attempt of teacher to create a businesslike and
supportive environment for learning (Walberg, 1986) and classroom effectiveness research has shown
their importance in promoting student learning (Brophy & Good, 1986; Hextall & Mahony, 1998;
Scheerens & Bosker, 1997). The ways used to measure these five elements are very similar and are
presented below.
Interactions are measured by taking into account the role of the teacher in establishing
interaction between students and between students and himself/herself. The dimension frequency
refers to the number and type of interactions which take place. Specifically, interactions are classified
into different types based on their focus (i.e., specificity and the purpose(s) it serves). For example,
interactions are classified according to the purpose(s) that are expected to serve (e.g., managerial
reasons, learning, social encounter). As far as the stage is concerned, interactions are seen in relation
to the phase of the lesson that they take place. Quality is only measured by looking at the immediate
impact that teacher initiatives have on establishing relevant interactions. We are mainly interested to
see the extent to which teacher is able to establish on task behavior through the interactions she/he
promotes since Creemers’ model emphasizes the importance of keeping students on task (Creemers,
1994). Finally, differentiation is measured by looking at the different teaching strategies the teacher is
able to use in order to keep different groups of students involved in the classroom interactions which
promote student learning.
As far as the other three elements of classroom as a learning environment are concerned, they
are measured by taking into account the teacher behavior in establishing rules, persuading students to
respect and use the rules, and maintaining them in order to create a learning environment in their
classroom. The first element refers to more general problems that can arise when students do not
13
believe that they are treated fairly and are respected as individual persons by their teacher whereas the
other two deal with specific situations in the classroom which might create difficulties in promoting
learning (i.e., competition between students, classroom disorder) Thus, frequency is measured by
looking at the number of problems that arise in the classroom (e.g., classroom disorder: fight between
two students) and the various ways that teachers use to deal with them. Focus is measured by looking
at the specificity of the problem that is observed (e.g., incidental or a continuous one that takes the
classroom back to problems that were not solved successfully) as well as to the reaction of the teacher
in terms of the purpose(s) that he/she attempts to achieve (e.g., solving only the specific problem or
creating an atmosphere that avoids the further existence of similar problems). Stage can be measured
by looking at the phase of the lesson at which the problem arises. Quality is seen in relation to the
impact that the teacher behavior has on solving the problems that arise as measured through students’
behavior. For example, a teacher may not use any strategy at all to deal with a classroom disorder
problem or uses a strategy but the problem is only temporarily solved or uses a strategy that has a
long-lasting effect. Finally, differentiation is measured by looking at the extent to which teachers use
different strategies to deal with problems which are caused by different groups of students. For
example, individual student(s) might cause a problem in order to get attention from classroom mates
and/or the teacher. It is probably a better strategy not to pay attention when the problem is small since
any reaction from the teacher may promote the continuation of causing problems.
G) Management of Time
Effective teachers are expected to organize and manage the classroom environment as an efficient
learning environment and thereby to maximize engagement rates (Creemers & Reezigt, 1996; Emmer
& Everston, 1981). In this study, management of time is considered as one of the most important
indicators of teacher ability to manage classroom in an effective way. Frequency is measured by
taking into account how much time is used for teaching per lesson and how much time is covered
within the time framework. Focus dimension is not measured separately since the main interest of this
factor is whether students are on task or off task. Stage is measured by taking into account time
attribution to different phases of the lesson. As far as the quality dimension, this is measured through
14
the data collected in relation to the factor concerning the role of teacher in creating a learning
environment in his/her classroom. Finally, differentiation is measured by looking at the allocation of
time for different groups of students.
H) Teacher Evaluation
Evaluation is seen as an integral part of teaching (Stenmark, 1992) and especially formative
evaluation is one of the most important factors associated with effectiveness at all levels and
especially at the classroom level (e.g., de Jong et al., 2004; Kyriakides, 2005; Shepard, 1989).
Information gathered from assessment can be used in order to enable teachers to identify their
students’ needs as well as to evaluate their own practice. In this study, frequency is measured in terms
of the number of evaluative tasks and the time that they take place. It is expected that there is a
curvilinear relation between the frequency of teacher evaluation and student outcomes since an
overemphasis to evaluation might reduce the actual time spent on teaching and learning whereas
teachers who don’t collect any information are not able to adopt their teaching to student needs. Focus
is measured by looking at the ability of teacher to use different ways of measuring student skills rather
than using only one technique (e.g., written tests). It is also important to examine whether the teacher
makes more than one uses out of the information that she/he collects (e.g., identify needs of students,
conducting self-evaluation, adopting his/her long-term planning, using evaluation tasks as a starting
point for teaching). Stage is measured in terms of the period at which the evaluation tasks take place
(e.g., at the beginning, during, and at the end of a lesson/unit of lessons) and the time lack between
collecting information, recording the results, reporting the results to students and parents and using
them. Quality is measured by looking at the properties of the evaluation instruments used by the
teacher such as the validity, the reliability, the practicality and the extent to which the instruments
cover the teaching content in a representative way. This dimension is also measured by investigating
the type of feedback that teacher gives to the students and the way students use the teacher feedback.
Specifically, effective teachers provide constructive feedback which has positive implications to
teaching and learning (Muijs & Reynolds, 2001). Finally, differentiation is examined in relation to the

15
extent to which teachers use different techniques for measuring student needs and/or different ways to
provide feedback to groups of students by taking into account their needs.
RESEARCH AIMS
The studies which have been used in order to test the validity of Creemers’ model (i.e., de Jong et al.,
2004; Kyriakides, 2005; Kyriakides et al., 2000; Kyriakides & Tsangaridou, 2004) reveal the
importance of using multiple measures of effectiveness factors and of conducting longitudinal studies
rather than case studies in order to be able to identify the relations which exist between the various
measures of each factor and student achievement gains. In this context, a longitudinal study is
currently undertaken in Cyprus in order to develop and test the dynamic model. The results of the first
phase of the study, which is concerned with the importance of classroom level factors included in the
dynamic model, are presented in this paper. As far as the measure of student outcomes is concerned,
the study does not only attempt to investigate educational effectiveness in mathematics and Greek
language but measures concerning with the main aims of religious education are also taken into
account. In this respect, next to student knowledge on mathematics, Greek language, and religious
education presented in the national curriculum of Cyprus student achievement in affective aims of
religious education is also measured. Thus, the extent to which the dynamic model can be considered
as a generic model is examined. Specifically, the first phase of the study attempts to identify:
a) the extent to which each of the eight factors which refer to teacher behavior in the classroom
are multi-dimensional constructs and can be defined by reference to the five dimensions of
the model, and
b) the type(s) of relations that each factor and its dimensions have with student learning
outcomes in mathematics, Greek language and religious education.
METHODS
A) Participants
Stratified sampling (Cohen, Manion, & Morrison, 2000) was used to select 52 Cypriot primary
schools but only 50 schools participated in the study. All the year 5 pupils (n=2503) from each class
16
(n=108) of the school sample were chosen. The chi-square test did not reveal any statistically
significant difference between the research sample and the population in terms of pupils’ sex.
Moreover, the t-test did not reveal any statistically significant difference between the research sample
and the population in terms of the size of class. It may be claimed that a nationally representative
sample of Cypriot year 5 pupils was drawn.
B) Dependent Variables: Student achievement in mathematics, Greek language and religious
education
As far as the dependent variables of this study are concerned, data on student achievement in
mathematics, Greek language and religious education were collected by using external forms of
assessment designed to assess knowledge and skills in mathematics, Greek language and religious
education which are identified in the Cyprus Curriculum (Ministry of Education, 1994). Student
achievement in relation to the affective aims included in the Cyprus curriculum for religious
education was also measured. Criterion-reference tests are more appropriate than norm-referenced
tests for relating achievement to what a pupil should know and for testing competence rather than
general ability. Thus, criterion-reference tests were constructed and pupils were asked to answer at
least two different tasks related to each objective in the teaching program of mathematics, Greek
language, and Religious Education for year 5 pupils. Scoring rubrics, used to differentiate among four
levels of task proficiency (0-3) on each task, were also constructed. Thus, ordinal data about the
extent to which each child had acquired each skill of mathematics, Greek language, and religious
education curriculum for year 5 were collected. The three written tests in mathematics, Greek
language and religious education were administered to all year 5 students of school sample at the
beginning and at the end of school year 2004-2005. The construction of the tests was subject to
controls for reliability and validity. Specifically, the Extended Logistic Model of Rasch (Andrich,
1988) was used to analyze the emerging data in each subject separately and four scales, which refer to
student knowledge in mathematics, Greek language and religious education and to student attitudes
towards religious education were created and analyzed for reliability, fit to the model, meaning and
validity. Analysis of the data revealed that each scale had relatively satisfactory psychometric
17
properties. Specifically, for each scale the indices of cases (i.e., students) and item separation were
higher than 0.80 indicating that the separability of each scale was satisfactory (Wright, 1985).
Moreover, the infit mean squares and the outfit mean squares of each scale were near one and the
values of the infit t-scores and the outfit t-scores were approximately zero. Furthermore, each analysis
revealed that all items had item infit with the range 0.83 to 1.20. It can therefore be claimed that each
analysis revealed that there was a good fit to the model (Keeves & Alagumalai, 1999). It is finally
important to note that although there is a statistically significant correlation between the student
estimates in the two Rasch scales of Religious Education, the value of the correlation coefficient (i.e.,
r=0.29, n=2503, p<.001) reveals that the two scales refer to two different constructs (Cronbach,
1990). Thus, for each student four different scores for his/her achievement at the beginning of school
year were generated, by calculating the relevant Rasch person estimate in each scale. The same
approach was used to estimate student achievement at the end of the school year in relation to these
four outcomes of schooling.
C) Explanatory variables at student level
Aptitude
Aptitude refers to the degree in which a student is able to perform the next learning task. For the
purpose of this study, it consists of prior knowledge of each subject (i.e. mathematics, Greek language
and religious education) and prior attitudes towards religious education emerged from student
responses to the external forms of assessment administered to students at the beginning of the school
year.
Student Background Factors
Information was collected on two student background factors: sex (0=boys, 1=girls), and socio-
economic status (SES). Five SES variables were available: father’s and mother’s education level (i.e.,
graduate of a primary school, graduate of secondary school or graduate of a college/university), the
social status of father’s job, the social status of mother’s job and the economical situation of the
family. Following the classification of occupations used by the Ministry of Finance, it was possible to
18
classify parents’ occupation into three groups which have relatively similar sizes: occupations held by
working class (34%), occupations held by middle class (36%) and occupations held by upper-middle
class (30%). Representative parental occupations for the working class are: farmer, truck driver,
machine operator in a factory; for the middle class are: police officer, teacher, bank officer; and for
the upper-middle class are: doctor, lawyer, business executive. Relevant information for each child
was taken from the school records. Then standardized values of the above five variables were
calculated, resulting in the SES indicator.
D) Explanatory variables at classroom level: Quality of teaching
While there has been substantive development of teacher effectiveness research with regards to
content, the issue of measurement has been neglected to a large degree. In the literature there is a
debate whether quality of teaching is best evaluated by independent observers or by students
(Aleamoni, 1981; Fraser, 1995). Both methods have their advantages and disadvantages (Ellet, 1997;
Rosenshine & Furst, 1973). Thus, the explanatory variables of the study, which refer to the eight
factors dealing with teacher behavior in the classroom, were measured by both independent observers
and students. Specifically, taking into account the way the five dimensions of each effectiveness
factors are defined, one high-inference and two low-inference observation instruments were
developed. One of the low-inference observation instruments is based on Flanders system of
interaction analysis (Flanders, 1970). However, we developed a classification system of teacher
behavior which is based on the way each factor of the proposed dynamic model is measured.
Moreover, the observer is expected to identify the students who are involved in classroom interaction.
As a consequence, the use of this instrument enables us to generate data about teacher-student and
student-student interaction. The second low-inference observation instrument refers to the following
five factors of the model: orientation, structuring, teaching modeling, questioning techniques, and
application. This instrument is designed in a way that enables us to collect more information in
relation to the quality dimension of these five factors. Thus, the two instruments helped us generate
data for all eight factors and their dimensions. The high-inference observation instrument covers the
five dimensions of all eight factors of the model and observers are expected to complete a Likert scale
19
(part A) to indicate how often each teacher behavior was observed (e.g., the teacher spent time to
explain the objectives of the lesson). Moreover, a second scale (part B) was used to allow us to search
for curvilinear relations between some factors and student outcomes, as these were expected to exist
according to the dynamic model. Specifically, some of the items of part A were also included in part
B. This time the observers were asked to judge the amount of the observed behavior by indicating
whether it was observed: “not at all”, “scarcely”, “satisfactory”, or “more than enough”. However, the
reliability of the scale of part B was not satisfactory and therefore only the data emerged from the
Likert scale was used. It is finally important to note that the use of different types of observation
instruments allows us to cover all the factors and dimensions mentioned in the dynamic model.
Observations were carried out by six members of the research team who attended a series of
seminars on how to use the three observation instruments. During the school year, the external
observers visited each class 9 times and observed three lessons per subject by using both types of low-
inference observation instruments. After each occasion, the observers completed the rating scale of
the high-inference observation instrument. For each scale of the three observation instruments, the
alpha reliability coefficient was higher than 0.83 and the inter-rater reliability coefficient ρ2 was
higher than 0.81.
The eight factors and their dimensions were also measured by administering a questionnaire
to students. Specifically, students were asked to indicate the extent to which their teacher behaves in a
certain way in their classroom (e.g., at the beginning of the lesson the teacher explains how the new
lesson is related to previous ones). A Likert scale was used to collect data. A Generalisability Study
on the use of students’ ratings revealed that the data collected from almost all the items could be used
for measuring the quality of teaching of each teacher in each subject separately. However, three items
of the questionnaire concerned with assessment in religious education and one item concerned with
the differentiation dimension of learning strategies in both Greek language and religious education
had to be removed. Thus, the score for each teacher in each of the questionnaire item found to be
generalizable was the mean score of the year 5 students of the class she/he taught.
RESULTS
20
The two parts of this section provide answers to the three research questions concerned with the main
characteristics of the dynamic model. The purpose of the first part is to provide empirical support to
the measurement framework of effectiveness factors proposed in the dynamic model. Specifically, for
each subject a specialized type of CFA model (i.e., the Correlated Trait Correlated Method model)
was used to examine the extent to which each of the eight factors at classroom level can be measured
by taking into account the data which emerged from different types of external observations and from
student questionnaires in relation to the five dimensions of the model (Kline, 1998). The second part
of this section illustrates the results of the four separate multilevel analyses which have been
conducted in order to examine the extent to which the variables in the dynamic model show the
expected effects upon each dependent variable (i.e., student achievement in mathematics, language,
cognitive achievement in religious education, affective achievement in religious education).
A) Testing the validity of the framework used to measure each effectiveness factor
Since its inception in 1959 (Campbell & Fiske, 1959), the multitrait multimethod (MTMM) matrix
has provided researchers with an invaluable tool for the assessment of construct validity. In essence,
this matrix involves factorially combining a set of traits with a set of measurement methods. This
factorial combination of traits and methods allows an examination of variance that is due to traits,
variance that is due to methods, and unique or error variance. Campbell and Fiske (1959) proposed a
set of rules of thumb to evaluate the degree of convergent and discriminant validity present in an
MTMM matrix. Although the criteria proposed by Campbell and Fiske contributed substantially to
the understanding and assessment of convergent and discriminant validity, they were widely criticized
for several reasons including ambiguity of what constitutes satisfactory results and the use of
correlations that are based on observed variables to draw conclusions about underlying trait and
method factors. In this context, a range of formal statistical techniques that could be used to estimate
MTMM models was proposed. Two general traditions have been developed. The first has often been
referred to as the analysis of variance approach (Kavanaugh, MacKinney, & Wolins, 1971; Kenny, &
Kashy, 1992, Schmitt & Stults, 1986). The second tradition is the factor analysis approach. Within the
factor analysis approach, initial efforts were focused on applying exploratory factor analysis to
21
MTMM data (Jackson, 1969). Over time, this strategy has been replaced by confirmatory factor
analysis (CFA) techniques. In recent years, CFA has become the method of choice in analyzing the
MTMM matrix. With CFA the researchers can define alternative models that posit a priori trait and
method effects and test the ability of such models to fit the data (Marsh & Byrne, 1993). Although a
number of CFA models can be used with MTMM data, in the typical CFA model of MTMM data
there are: a) T traits, M methods and T X M scales (i.e., distinct trait/method combinations); b) T + M
a priori factors, (i.e., one trait-factor for each of the multiple traits, and one method-factor for each of
the multiple methods used to collect data about each of the T traits); c) constraints on factor loadings
such that each scale has non-zero factor loadings on only one trait factor and one method factor; d)
freely estimated uniquenesses of each scale that are uncorrelated with the uniquenesses of other
scales; and e) constraints on the correlations among the T + M factors such that correlations among
trait factors and among method factors are freely estimated, but correlations between method and trait
factors are fixed to be zero. This model is known as the model with correlated trait factors and
correlated method factors (CTCM).
In this study, for each subject, separate CFA analyses for each effectiveness factor were
conducted in order to identify the extent to which each factor can be measured in relation to the five
dimensions proposed by the dynamic model. The results of the analysis concerned with the classroom
level factor which refers to the structuring skills of teachers are presented below. Figure 1 represents
the CFA model which was tested in order to provide empirical support to the measurement framework
of effectiveness factors proposed by the dynamic model. Specifically, each measured variable was
related to 1 of the 5 trait factors representing a specific dimension of measuring structuring skills of
teachers and one method factor representing one of the four methods used to collect data (i.e., student
questionnaire, high inference observation, low inference observation instrument 1, low inference
observation instrument 2). The uniqueness associated with each measured variable was posited to be
uncorrelated with each other.
______________________________
Insert Figure 1 About Here
_____________________________
22
The measured variables in our MTMM analyses which emerged from the two low-inference
observation instruments were based on scale scores whereas those which emerged from the student
questionnaire and the high inference observation instrument were factor scores. Specifically, for each
subject, eight exploratory factor analyses of the data emerged from the student questionnaire items
concerned with each effectiveness factor were conducted. In the case of structuring skills of teachers,
factor scores concerned with the five dimensions of this factor in each subject were produced (see
Creemers & Kyriakides, in press). Similarly, data emerged from the high inference observation
instrument were analyzed using the exploratory factor analysis and factor scores for each dimension
of the structuring factor were estimated. It is important to note that the results which emerged from
analyzing data collected in relation to each of the three different subjects were comparable (see
Creemers & Kyriakides, in press). However, limitations associated with the use of either factor scores
and/or scale scores instead of raw variables in our CFA analyses of the MTMM matrices have to be
acknowledged (Byrne & Goffin, 1993; Marsh & Byrne, 1993).
Analytical Procedure
The scalings for the measures were vastly different from one another and considered arbitrary.
Constraining method indicators to be equal, a standard procedure in MTMM models, presented
interpretive problems (Stacy et al., 1985). Therefore, the data were standardized across the entire
sample and covariance matrices used in the analyses. The CFA procedures were conducted using the
EQS program (Bentler, 1989) with maximum-likelihood (ML) estimation. Although ML assumes a
normal distribution in the data, it has been found to be robust even with nonnormally distributed data
(Huba & Harlow, 1986; Tanaka & Bentler, 1985). The multivariate kurtosis for these data was
relatively high. However, it has been demonstrated that variable distributions have a small effect on
both the chi-square statistic and the standard errors of the factor loadings in CFA models (Amemiya
& Anderson, 1985). Moreover, the ML estimation procedure was chosen because it does not require
an excessively large sample size. More than one fit index was used to evaluate the extent to which the
data fit the models tested. More specifically, the scaled chi-square, Bentler’s (1990) Comparative Fit

23
Index (CFI), the Root Mean Square Error of Approximation (RMSEA) (Brown & Mels, 1990) and the
chi-square to degrees of freedom ratio were examined. Furthermore, the factor parameter estimates
for the models with acceptable fit were examined to help interpret the models. Finally, procedures for
testing hierarchically nested models suggested by Marsh & Hocevar (1985), Stacy et al (1985), and
Widaman (1985) for comparing first- and second-order structures and MTMM models were taken
into account. Specifically, comparisons were made between the most restrictive to least restrictive
nested models. The null model (most restricted) in this case hypothesized no correlations among the
scores concerned with structuring skills of the teacher-sample in relation to each of the five
dimensions of measuring structuring skills. Less restrictive hypothesized models were then tested in a
hierarchical manner and compared to the null model as well as to each other. The goodness-of-fit for
each of the models was evaluated using the indices mentioned above. The chi-square difference test
was also used to evaluate the improvement of fit among hierarchically nested models.
Once the best fitting model was determined, including traits and methods, the method effects
on each measure was assessed. By squaring the loadings on each of the trait and method factors, the
amount of variance attributable to each method was calculated. Comparisons of these effects on each
of the measures were made. Often method effects are assumed to be unidimensional and therefore
uncorrelated. It was hypothesized that there would be no significant correlations among the method
factors (i.e., the methods would be unidimensional). This was tested by setting the correlations among
these factors to be free or fixed at zero and evaluating a difference of chi-square between the two
models as well as the parameter estimates.
Results concerned with the structuring skills in each subject
This section presents results concerned with the testing of various types of CFA models that can be
used to analyze MTMM data which refer to the structuring skills of teachers in teaching Greek
language, mathematics and religious education. Specifically, for each subject, the null model and the
five nested models are presented in Table 1. The null model (Model 1) represents the most restrictive
model, with 20 uncorrelated variables measuring the structuring skills of teachers in each subject.
Models 1 through 4 are first-order models and comparisons between the chi-squares of these models
24
helped us evaluate the construct validity of the framework used to measure structuring skills,
including determination of the convergent and discriminant validity and the number and type of
method factors present in the measures. Models 5 and 6 were higher-order models tested and
compared to account for the lower-order baseline model. Following selection of a best fitting or
baseline model, further examination of the validity and reliability of each of the measures, and the
method effects on each was made.
______________________________
Insert Table 1 About Here
_____________________________
The following observations arise from table 1. First, comparing the null model with model 2, we can
observe that although the overall fit of model 2 was not acceptable; it was a significant improvement
in chi-square compared to the null model. In addition, the standardized factor loadings were all
positive and moderately high (i.e., their standardized values ranged from 0.68 to 0.79 and twelve of
them were higher than 0.70). This result can be seen as an indication of convergent validity for the
traits. Moreover, the correlations among the five traits were positive but relatively low, an indication
of discriminant validity.
Second, model 2 can be compared with models 3 and 4 to determine the best structure for
explaining method variance present in these five traits. Model 3 represents the five correlated traits of
measuring the dimensions of the structuring factor and the addition of the four methods-instruments
used to collect data (see figure 1). On the other hand, model 4 hypothesized a structure of 5 correlated
traits of the structuring factor and 3 correlated method factors since the student questionnaire from
model 3 was retained whereas the factor scores of the high inference observation instrument and the
scale scores of the second low observation instrument which refer to the focus and quality of
structuring were considered to belong to the second method-factor and the other three scale scores of
this instrument (i.e., frequency, stage and differentiation) and the scale scores of the first observation
instrument were considered to belong to the third method factor. The chi-square difference between
models 2 and 3 showed a significant decrease in chi-square and a significant improvement over the
25
trait-only model. Clearly, method variance was present and the addition of method factors to the
model increased the amount of covariation explained. Moreover, model 4, which fit reasonably well,
was a significant improvement over model 2 and explained more method variance than model 3. This
implies that the three method factors are associated with the different advantages and limitations of
using three different methods to measure quality of teaching (i.e., student questionnaires, low-
inference observations and high-inference observations) rather than with the quality of the different
instruments used to measure structuring skills of teachers.
Third, models 5 and 6 were examined to determine if a second-order structure would explain
the lower-order trait factors more parsimoniously. Specifically, model 5 hypothesized that scores
concerned with the structuring skills of teachers in each subject could be explained by five first-order
factors (representing the five dimensions of measuring the factor) and one second-order factor (i.e.
structuring skills in general). On the other hand, model 6 was a model with two correlated second
order traits (see Figure 2). It is examined whether covariation between the frequency and stage
dimension of structuring skills can be explained by their regression on one second order factor
whereas covariation among the focus, quality and differentiation dimension can be explained by their
regression on the other second-order factors. We also tested three additional second order models with
varying factor structures but none of them was significantly better than either model 5 or model 6. In
comparing first and second order models, a second-order model rarely fits better than a lower-order
model. Because there are fewer parameters estimated in higher-order models compared to lower-order
models of the same measures, the degrees of freedom increase, as does the chi-square. In this study,
for each subject the fit indices of models 5 and 6 as well as a chi-square difference test between the
two models reveal that model 6 fits better than model 5 (p<.001). Moreover, in the case of
mathematics and Greek language, the fit values of model 5 did not meet the criteria for acceptable
level of fit. This finding provides support for arguing the importance of measuring separately each of
the five dimensions of effectiveness factors rather than treating them as unidimensional. However, the
fit of the data emerged from measuring the structuring skills of teachers of religious education to
model 6 can be treated as adequate and this model may be considered more parsimonious in
explaining the interrelations among the five factors rather than model 4.
26
______________________________
Insert Figure 2 About Here
_____________________________
Validity of the measures concerning structuring skills of teachers in each subject
The results of hierarchical model comparisons demonstrated convergent and discriminant validity for
the traits. Individual standardized loadings on trait and method factors also provided an indication of
the convergent validity of the observed variables. High loadings on trait factors (i.e., higher than .60)
and low loadings on method factors (i.e., lower than .40) demonstrated good convergent validity. The
standardized loadings on traits can be considered validity coefficients for each measure. The two
exceptions were student questionnaire factor scores on differentiation in religious education (.552)
and factor score of high inference observation instrument on quality in Greek language (.514).
Moreover, there did not appear to be any strong general method effects but method effects were
dearly highest for high inference observation.
Trait and Method Effects
The variances for traits, methods, and error for each of the observed measures were calculated by
squaring the loading of each respective factor in model 4. Moreover, the reliability for each measure
was calculated by adding the trait and method variance. In each subject it was found that the trait
variance for at least 16 of the 20 measures was moderate to high (i.e., higher than .60), with method
variance substantially lower than trait and random error variance. Exceptions to these findings were
not specific to one method but most of them were concerned with the use of high inference
observation.
A brief summary of results concerned with the CFA models of the classroom-level factors of the
dynamic model in each subject
The last section is an attempt to present the main results which emerged from analyzing the MTMM
data concerned with each of the other seven classroom level factors of the dynamic model in relation

27
to each subject. Results from hierarchical confirmatory factor analyses indicated that both the
convergent and discriminant validity of the measures associated with the five dimensions for each
classroom level factors were high and method effects were low. Specifically, for each subject, the first
order factor model which was found to be the most appropriate for describing each classroom level
factor is shown in table 2. Moreover, table 2 illustrates the second order factors which were found to
fit reasonably well with MTMM data in relation to some classroom level factors. The following
observations arise from this table.
______________________________
Insert Table 2 About Here
_____________________________
First, the two models found to fit reasonably well with data concerning the orientation skills of
teachers have the same structure as those emerged from analyzing the MTMM data on the structuring
skills of teachers. Moreover, the models found to fit reasonably well with the questioning skills of
teachers are similar with those of the structuring skills of teachers but six instead of five correlated
first order factors were found to exist. This is due to the fact that each method generated there scores
in relation to the quality of questioning skills which refer to the clarity of the questions, the difficulty
level of the questions and the feedback that teachers provide to student answers. The SEM analyses
revealed that the measures of the quality of feedback that teachers give to students belong to a
separate factor rather than the factor scores concerned with the other two elements of the quality
dimension of questioning skills. Second, there is no second-order factor model which was found to fit
reasonably well with the MTMM data which refer to four classroom level factors of the dynamic
model (i.e., application, teaching modeling, management of time, teacher evaluation). More
specifically, all these four models seem to provide support to the use of five dimensions for measuring
effectiveness factors and for taking into account the methods used to collect data about teacher
behavior in the classroom. It is reminded that according to the dynamic model the focus dimension of
the management of time is not measured separately and thereby four factors were expected to emerge
from the SEM analysis. However, in the case of teaching modeling four rather than five factors were
identified and this is due to the fact that the variables associated with quality and differentiation were
28
found to belong to the same factor. Third, the 30 scores which emerged from the two methods (i.e.,
student questionnaire and high inference observation) used to measure each of the five dimensions of
the five elements of the factor concerned with the role of teacher in creating a learning environment in
his/her classroom (i.e., teacher-student interaction, student-student interaction, students’ treatment by
the teacher, competition between students, and classroom disorder) were found to be explained by 10
first order factor traits and two second order factors. Specifically, the factor scores which refer to the
same dimension of three elements of the classroom environment (i.e., teacher-student interaction,
students’ treatment by the teacher and classroom disorder) were found to belong to the same first
order factor whereas those which emerged from the other two elements (i.e., student-student
interaction and cooperation) were found to belong to the other five factors. Then, the five first order
factors which refer to the five dimensions of the three elements of the classroom learning environment
concerned with teacher-student relations were found to belong to the same second order general factor
whereas the other five were found to belong to another second order general factor which can be
called student relations. These two general factors were also found to be correlated. It is finally
important to note that the 50 factor scores were also found to belong to two method factors
representing the two methods used to collect data (i.e., student questionnaire and high inference
observation instrument). It can be claimed that the findings emerged from the SEM analysis of
classroom learning environment in each subject provides support to the way this factor are measured
by the dynamic model. However, the classroom learning environment can be described in a more
parsimonious way and instead of breaking the factor into five elements, we can refer only to two
elements which are concerned with the relations of teacher with his/her students and the contribution
of teacher in creating relations among students in relation to learning.
Summary of the SEM results
It can be claimed that the results of this study provided support for the construct validity of the five
measurement dimensions of most effectiveness factors at the classroom level. The few exceptions
which were identified reveal the difficulty of defining the quality dimension since in the case of
questioning aspects of quality were found to belong to two separate factors whereas in the case of
29
teaching modeling the differentiation and the quality dimensions were found to belong to the same
factor. Moreover, the results of this study seem to reveal that the classroom as a learning environment
cannot be treated as a single factor but as two interrelated factors in the learning environment
concerning relations among students and relations between teacher and his/her students. Second, the
comparison of CFA models used to test each factor confirmed convergent and discriminant validity
for the five dimensions. Convergent validity for most measures was demonstrated by the relatively
high (i.e., higher than .60) standardized trait loadings, in comparison to the relatively lower (i.e.,
lower than .40) standardized method loadings. These findings support the use of multi-method
techniques for increasing measurement validity, construct validity, and thus, stronger support for the
validity of subsequent results. Third, the three-method factor model was determined to be the best
fitting rather than the four-method for most factors and this implies that the method factors were
concerned with the advantage of the three methods typically used to collect data about teacher
behavior rather than with the four instruments used to collect data. This argument is supported by the
fact that the measures of quality and focus of an activity emerged from using the second low-
inference observation instrument were found to belong to the same factor as the data emerged from
the high-inference observation instrument. This result can be attributed to the fact that these two
measures are not so easily interpretable as the measures of frequency, stage and differentiation taken
by this instrument. Thus, the other three dimensions of the second low inference observation
instrument were found to belong to the same factor with the measures of the first low inference
observation instrument which can all be collected in a relatively straight forward way. Moreover, all
the method factors were unidimensional factors as determined by their zero correlations with each
other. Furthermore, examination of the proportion of variance accounted for by trait, method, and
error (squared loadings) proved useful in assessing their specific influence on each measure. It was
clear that the proportion of trait variance was generally high and method variance quite low. This
implies that method effects did not strongly influence the measures. Finally, there did not appear to be
any consistent method bias across traits or within traits for student questionnaires, high-inference and
low-inference observations, providing additional support for the convergent validity of the measures.
The absence of problems due to method bias in the present study indicates that the use of both types
30
of observations and student questionnaires strengthens the reliability and validity of the constructs of
classroom level effectiveness factors and lends further support for the validity of the dynamic model.
B) The effect of classroom-level factors on achievement in four outcomes of schooling
Having established the construct validity of the framework used to measure the dimensions of the
eight effectiveness factors of the dynamic model, it was decided to examine the extent to which the
first order factors which were established through SEM analyses show the expected effects upon each
of the four dependent variables and thereby the analyses were performed separately for each variable.
Specifically, the dynamic model of EER was tested using “MLwiN” (Goldstein et al., 1998) because
the observations are interdependent and because of multi-stage sampling since students are nested
within classes and classes within schools. The dependency has an important consequence. If students’
achievement within a class or a school has a small range, institutional factors at class or school level
may have contributed to it (Snijders & Bosker, 1999). Thus, the first step in the analysis was to
determine the variance at individual, class and school level without explanatory variables (empty
model). In subsequent steps explanatory variables at different levels were added. Explanatory
variables, except grouping variables, were centered as Z-scores with a mean of 0 and a standard
deviation of 1. This is a way of centering around the grand mean (Bryk & Raudenbush, 1992) and
yields effects that are comparable. Thus, each effect expresses how much the dependent variable
increases (or decreases in case of a negative sign) by each additional deviation on the independent
variable (Snijders & Bosker, 1999). Grouping variables were entered as dummies with one of the
groups as baseline (e.g., boys=0). The models presented in Tables 3 and 4 were estimated without the
variables that did not have a statistically significant effect.
______________________________
Insert Tables 3 and 4 About Here
_____________________________
A comparison of the empty models of the four outcome measures reveals that the effect of the school
and classroom was more pronounced on achievement in mathematics and Greek language rather than
in Religious Education. Moreover, the teacher (classroom) effect was found to be higher on
31
achievement of cognitive rather than affective aims of religious education. This finding is not in line
with results of a study conducted in Cyprus which revealed that the effect of the school was more
pronounced on achievement in affective outcome measures rather than in cognitive measures but it is
in line with studies investigating the effect of school on both cognitive and affective outcomes
conducted in other countries (e.g., Konu, Lintonen, & Autio, 2002; Opdenakker & Van Damme,
2000). It is finally important to note that in each analysis the variance at each level reaches statistical
significance (p<.05) and this implies that MLwiN can be used to identify the explanatory variables
which are associated with achievement in each outcome of schooling (Goldstein, 2003).
In model 1 the context variables at student, classroom and school levels were added to the
empty model. The following observations arise from the figures of the four columns illustrating the
results of model 1 for each analysis. First, model 1 explains approximately 50% of the total variance
of student achievement in each outcome and most of the explained variance is at the student level.
However, more than 30% of the total variance remained unexplained at the student level. Second, the
likelihood statistic (X2) shows a significant change between the empty model and model 1 (p<.001)
which justifies the selection of model 1. Second, the effects of all contextual factors at student level
(i.e., SES, prior knowledge, sex) are significant but the SES was not found to be associated with
achievement of affective aims in religious education. Moreover, gender was not found to be
consistently associated with student achievement in each outcome. Girls were found to have better
results in relation to each outcome but mathematics. The results concerning gender differences in
Greek language and mathematics are in line with findings of effectiveness studies conducted in
Cyprus (Kyriakides et al., 2000; Kyriakides, 2005; Kyriakides & Creemers, 2006). Third, prior
knowledge (i.e., aptitude) has the strongest effect in predicting student achievement at the end of the
school year. Moreover, aptitude is the only contextual variable which had a consistent effect on
student achievement when was aggregated either at the classroom or the school level. Finally, the
standard errors show that the effect sizes of the context variables are significant and stable.
At the next step of the analysis, for each dependent variable, five different versions of model
2 were established. In each version of model 2, the factor scores of SEM models which refer to the
same dimension of measuring the classroom level effectiveness factors of the dynamic model were
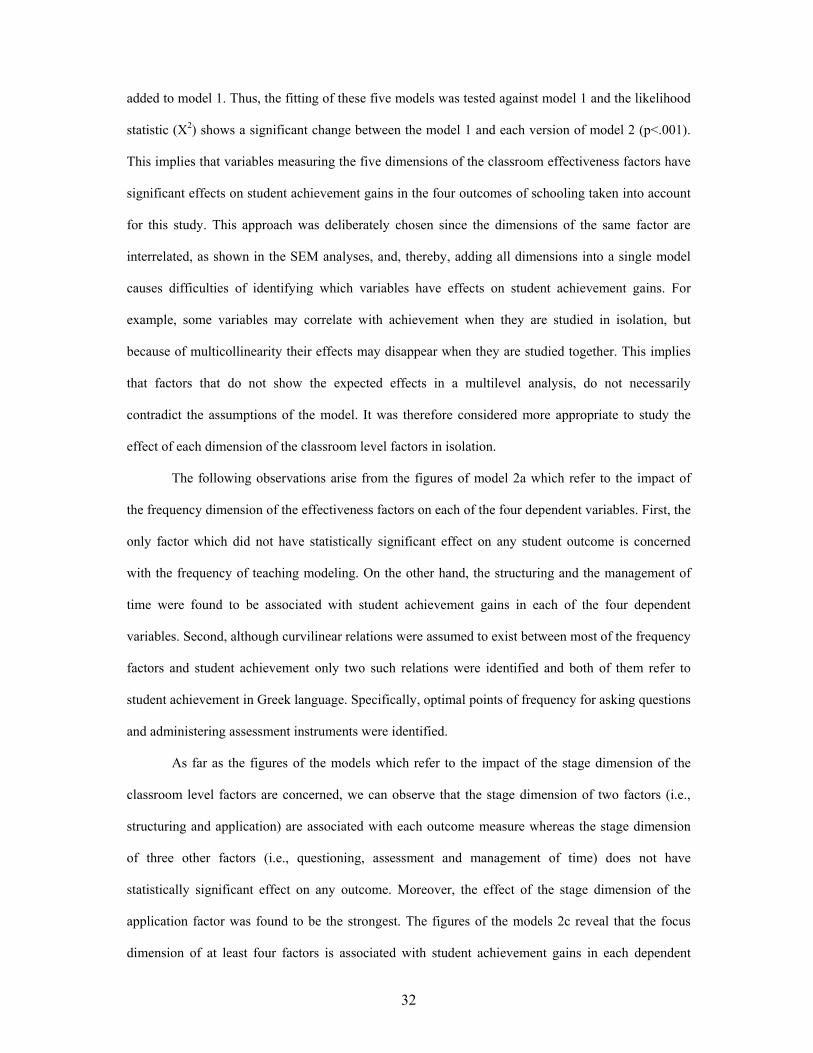
32
added to model 1. Thus, the fitting of these five models was tested against model 1 and the likelihood
statistic (X2) shows a significant change between the model 1 and each version of model 2 (p<.001).
This implies that variables measuring the five dimensions of the classroom effectiveness factors have
significant effects on student achievement gains in the four outcomes of schooling taken into account
for this study. This approach was deliberately chosen since the dimensions of the same factor are
interrelated, as shown in the SEM analyses, and, thereby, adding all dimensions into a single model
causes difficulties of identifying which variables have effects on student achievement gains. For
example, some variables may correlate with achievement when they are studied in isolation, but
because of multicollinearity their effects may disappear when they are studied together. This implies
that factors that do not show the expected effects in a multilevel analysis, do not necessarily
contradict the assumptions of the model. It was therefore considered more appropriate to study the
effect of each dimension of the classroom level factors in isolation.
The following observations arise from the figures of model 2a which refer to the impact of
the frequency dimension of the effectiveness factors on each of the four dependent variables. First, the
only factor which did not have statistically significant effect on any student outcome is concerned
with the frequency of teaching modeling. On the other hand, the structuring and the management of
time were found to be associated with student achievement gains in each of the four dependent
variables. Second, although curvilinear relations were assumed to exist between most of the frequency
factors and student achievement only two such relations were identified and both of them refer to
student achievement in Greek language. Specifically, optimal points of frequency for asking questions
and administering assessment instruments were identified.
As far as the figures of the models which refer to the impact of the stage dimension of the
classroom level factors are concerned, we can observe that the stage dimension of two factors (i.e.,
structuring and application) are associated with each outcome measure whereas the stage dimension
of three other factors (i.e., questioning, assessment and management of time) does not have
statistically significant effect on any outcome. Moreover, the effect of the stage dimension of the
application factor was found to be the strongest. The figures of the models 2c reveal that the focus
dimension of at least four factors is associated with student achievement gains in each dependent
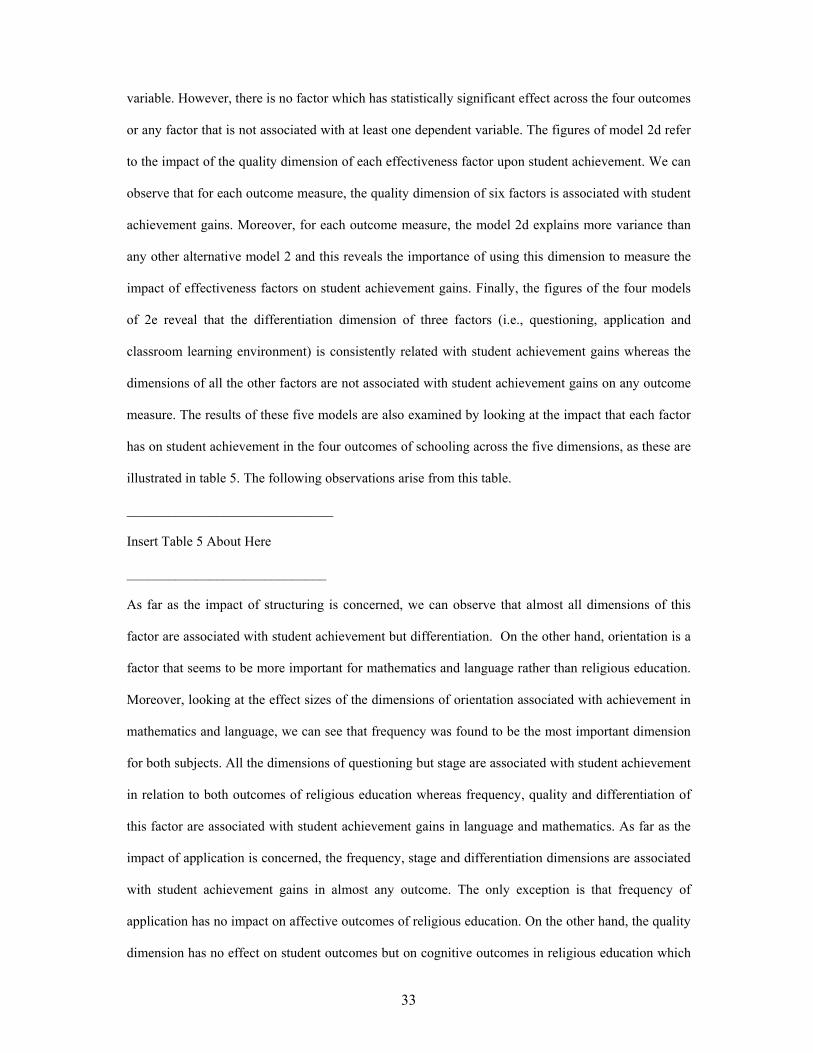
33
variable. However, there is no factor which has statistically significant effect across the four outcomes
or any factor that is not associated with at least one dependent variable. The figures of model 2d refer
to the impact of the quality dimension of each effectiveness factor upon student achievement. We can
observe that for each outcome measure, the quality dimension of six factors is associated with student
achievement gains. Moreover, for each outcome measure, the model 2d explains more variance than
any other alternative model 2 and this reveals the importance of using this dimension to measure the
impact of effectiveness factors on student achievement gains. Finally, the figures of the four models
of 2e reveal that the differentiation dimension of three factors (i.e., questioning, application and
classroom learning environment) is consistently related with student achievement gains whereas the
dimensions of all the other factors are not associated with student achievement gains on any outcome
measure. The results of these five models are also examined by looking at the impact that each factor
has on student achievement in the four outcomes of schooling across the five dimensions, as these are
illustrated in table 5. The following observations arise from this table.
______________________________
Insert Table 5 About Here
_____________________________
As far as the impact of structuring is concerned, we can observe that almost all dimensions of this
factor are associated with student achievement but differentiation. On the other hand, orientation is a
factor that seems to be more important for mathematics and language rather than religious education.
Moreover, looking at the effect sizes of the dimensions of orientation associated with achievement in
mathematics and language, we can see that frequency was found to be the most important dimension
for both subjects. All the dimensions of questioning but stage are associated with student achievement
in relation to both outcomes of religious education whereas frequency, quality and differentiation of
this factor are associated with student achievement gains in language and mathematics. As far as the
impact of application is concerned, the frequency, stage and differentiation dimensions are associated
with student achievement gains in almost any outcome. The only exception is that frequency of
application has no impact on affective outcomes of religious education. On the other hand, the quality
dimension has no effect on student outcomes but on cognitive outcomes in religious education which
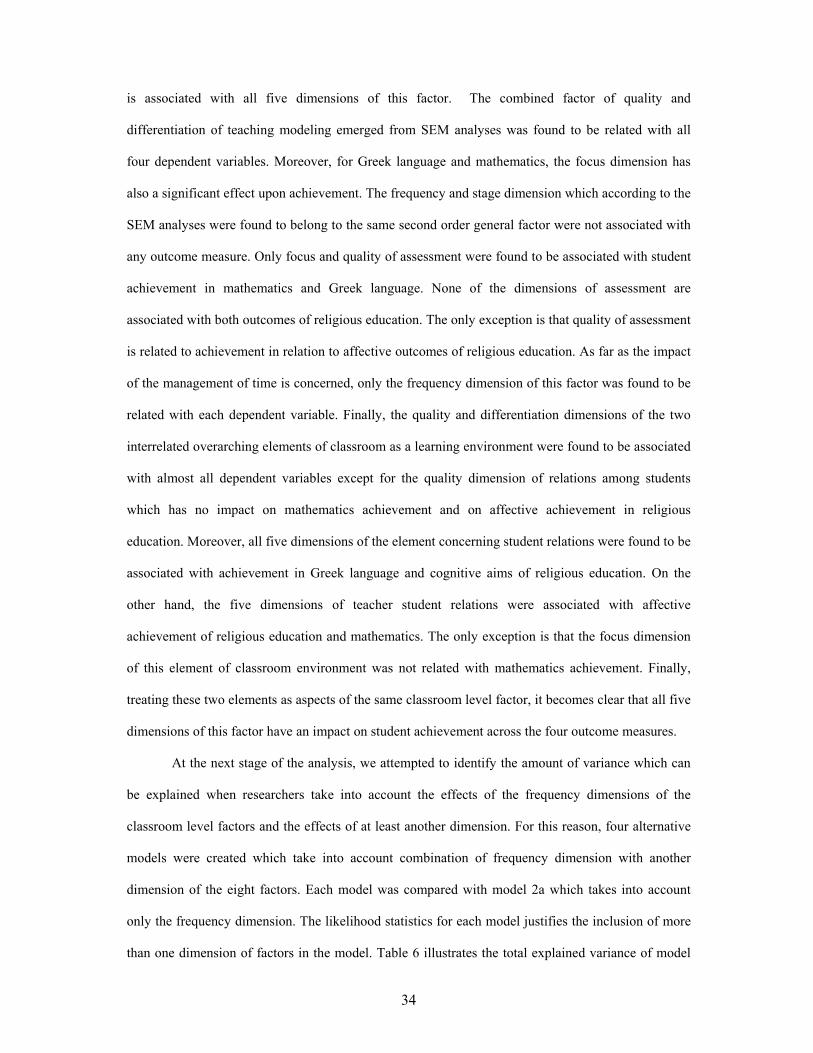
34
is associated with all five dimensions of this factor. The combined factor of quality and
differentiation of teaching modeling emerged from SEM analyses was found to be related with all
four dependent variables. Moreover, for Greek language and mathematics, the focus dimension has
also a significant effect upon achievement. The frequency and stage dimension which according to the
SEM analyses were found to belong to the same second order general factor were not associated with
any outcome measure. Only focus and quality of assessment were found to be associated with student
achievement in mathematics and Greek language. None of the dimensions of assessment are
associated with both outcomes of religious education. The only exception is that quality of assessment
is related to achievement in relation to affective outcomes of religious education. As far as the impact
of the management of time is concerned, only the frequency dimension of this factor was found to be
related with each dependent variable. Finally, the quality and differentiation dimensions of the two
interrelated overarching elements of classroom as a learning environment were found to be associated
with almost all dependent variables except for the quality dimension of relations among students
which has no impact on mathematics achievement and on affective achievement in religious
education. Moreover, all five dimensions of the element concerning student relations were found to be
associated with achievement in Greek language and cognitive aims of religious education. On the
other hand, the five dimensions of teacher student relations were associated with affective
achievement of religious education and mathematics. The only exception is that the focus dimension
of this element of classroom environment was not related with mathematics achievement. Finally,
treating these two elements as aspects of the same classroom level factor, it becomes clear that all five
dimensions of this factor have an impact on student achievement across the four outcome measures.
At the next stage of the analysis, we attempted to identify the amount of variance which can
be explained when researchers take into account the effects of the frequency dimensions of the
classroom level factors and the effects of at least another dimension. For this reason, four alternative
models were created which take into account combination of frequency dimension with another
dimension of the eight factors. Each model was compared with model 2a which takes into account
only the frequency dimension. The likelihood statistics for each model justifies the inclusion of more
than one dimension of factors in the model. Table 6 illustrates the total explained variance of model
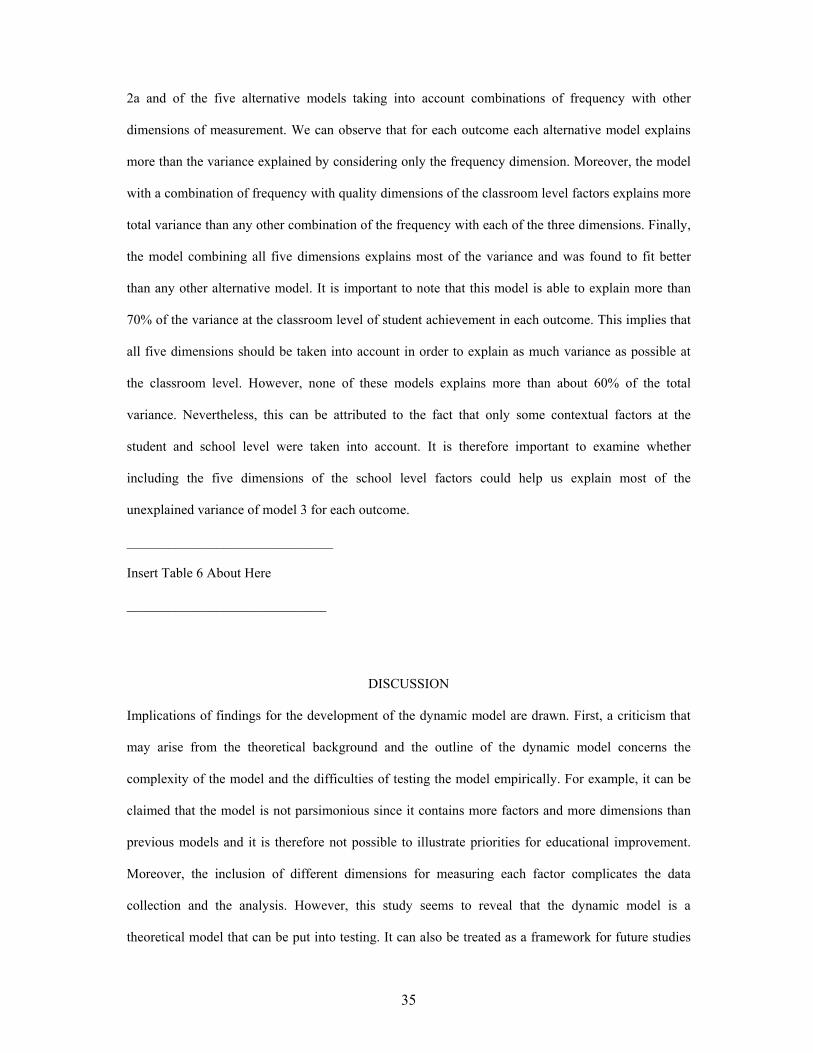
35
2a and of the five alternative models taking into account combinations of frequency with other
dimensions of measurement. We can observe that for each outcome each alternative model explains
more than the variance explained by considering only the frequency dimension. Moreover, the model
with a combination of frequency with quality dimensions of the classroom level factors explains more
total variance than any other combination of the frequency with each of the three dimensions. Finally,
the model combining all five dimensions explains most of the variance and was found to fit better
than any other alternative model. It is important to note that this model is able to explain more than
70% of the variance at the classroom level of student achievement in each outcome. This implies that
all five dimensions should be taken into account in order to explain as much variance as possible at
the classroom level. However, none of these models explains more than about 60% of the total
variance. Nevertheless, this can be attributed to the fact that only some contextual factors at the
student and school level were taken into account. It is therefore important to examine whether
including the five dimensions of the school level factors could help us explain most of the
unexplained variance of model 3 for each outcome.
______________________________
Insert Table 6 About Here
_____________________________
DISCUSSION
Implications of findings for the development of the dynamic model are drawn. First, a criticism that
may arise from the theoretical background and the outline of the dynamic model concerns the
complexity of the model and the difficulties of testing the model empirically. For example, it can be
claimed that the model is not parsimonious since it contains more factors and more dimensions than
previous models and it is therefore not possible to illustrate priorities for educational improvement.
Moreover, the inclusion of different dimensions for measuring each factor complicates the data
collection and the analysis. However, this study seems to reveal that the dynamic model is a
theoretical model that can be put into testing. It can also be treated as a framework for future studies
36
investigating the validity of the theoretical background of the dynamic model and the essential
characteristics of the factors included in the model, such as the existence of curvilinear relations and
the measurement dimensions of the functioning. Specifically, the results of the study provide support
for the construct validity of the five measurement dimensions of most effectiveness factors at the
classroom level. It has been shown that the classroom level effectiveness factors cannot be considered
as unidimensional constructs since the one second order model was not considered psychometrically
appropriate for measuring any of the eight effectiveness factors. This might reveal a weakness of
previous effectiveness studies focused on classroom level which usually treated frequency as the only
measurement dimension of effectiveness factors.
Moreover, the comparison of CFA models used to test each factor confirmed convergent and
discriminant validity for the five dimensions. These findings also support the use of multi-method
techniques for increasing measurement and construct validity. Specifically, the three-method factor
model considered as the most appropriate was concerned with the advantage of the three methods
typically used to collect data about teacher behavior. This study seems to reveal that it is inefficient to
concentrate on the debate on advantage and limitations of external observations against student
ratings of teacher behavior. It might be more beneficial to make use of multiple methods and
instruments and use SEM approaches to test the convergent and discriminant validity of data collected
on teacher behavior. Moreover, both low and high inference observation instruments are needed in
order to collect valid data about the five dimensions of the model especially since two dimensions are
focused on quantitative aspects of teacher behavior whereas the other three examine issues concerned
with the quality of teacher behavior. In summing up, the SEM results reveal that it is
psychometrically appropriate to measure each effectiveness factor at classroom level by taking into
account the five proposed dimensions and necessary to make use of all three methods of measuring
teacher behavior. Studies investigating further the validity of the model at the classroom level,
especially since this study took place in a single country and its generalizability has to be proven,
could consider the possibility of using this methodological approach to collect data on the five
dimensions of the eight classroom level factors and testing the construct validity of the dynamic
model.
37
Second, this study reveals the added value of using five dimensions to measure the classroom
level factors for explaining variation of student achievement gains in different outcomes. Specifically,
it has been shown that the five alternative models used to examine the impact of each of the five
measurement dimensions fit better to the data than model 1 which was concerned with the impact of
contextual factors on student achievement. This implies that all five dimensions can be used to
identify factors associated with student achievement gains in both cognitive and affective aspects of
education. Moreover, taking into account combination of frequency dimension with other dimensions
of classroom level factors increases the explained variance on student achievement gains.
Furthermore, there are factors which were found to have no statistically significant effect on student
achievement by measuring the impact of their frequency dimension but had significant impact on
student achievement when other dimensions are taken into account (see table 5). This implies that
previous studies might draw negative conclusions about the impact of a factor and fail to explain as
much variance as possible at the classroom level. For example, in this study the frequency dimension
of teaching modeling was not associated with student achievement on any outcome but the quality
dimension of this factor had an impact on achievement. This finding reveals that emphasis should be
given to other dimensions of effectiveness factors and not only to frequency that has been used
predominantly in all studies in the past. When this finding is supported and expanded by other studies
it can give directions to link effectiveness research with educational practice and especially
improvement efforts by indicating other ways of improving education than just by increasing the
presence of effective factors in the classroom. Moreover, such results might help us develop the
model and make it less complicate by focusing on the dimensions of factors that matter most. This
holds for the case of management of time which is measured in a valid way in relation to the
dimensions of the model but only frequency dimension was found to be associated with student
achievement. This finding implies that in the case of management of time only frequency dimension
might be sufficient to explain variation on student achievement gains.
Third, looking at the impact that each of the proposed factors has on student achievement we
can claim that generally the importance of the eight classroom level factors is confirmed. These
factors were found to be associated with student achievement on different outcomes of schooling
38
which refer to both the core subjects of the curriculum and the subsidiary subjects and to both
cognitive and affective aims. It can, therefore, be claimed that these eight factors can be considered to
belong to a generic model of EER. Moreover, comparing the impact of each factor on the four
outcomes of schooling, the eight factors can be classified into three groups. First, the great majority of
the measurement dimensions of structuring, application, questioning and classroom as a learning
environment were found to be consistently associated with student achievement on each of the four
outcomes of schooling. This implies that in general strong evidence supporting the validity of the
dynamic model for these four factors is provided by this study. Second, there were two factors which
were associated with student achievement when only some measurement dimensions were taken into
account. As it has been mentioned above, teaching modeling was found to be associated with student
achievement on each outcome when aspects of its quality were taken into account. Similarly, only the
frequency dimension of the management of time factor had an impact on student outcomes. This
finding reveals possibilities of creating a more parsimonious model. Finally, the impact of the last two
factors (i.e., assessment and orientation) on student outcomes, at least as measured in this study,
seems to be subject-specific. Specifically, most dimensions of both factors are related with
achievement in the two core subjects but not related at all with achievement in both types of aims of
religious education. The above classification of factors reveals that in general the model can become
more parsimonious by indicating factors which should be measured across the five dimensions and
factors that is not necessary to be measured across all dimensions. Moreover, the existence of subject
specific factors in this study might imply that aspects of the dynamic model have to be specified in
relation to the criteria used to measure effectiveness. On the other hand, the lack of impact of these
two factors on student achievement in religious education might be considered as a context specific
result especially since variance in relation to these two factors was much smaller than in the case of
the two core subjects.
Fourth, the study provided some support to the existence of curvilinear relations but in both
cases such relations were found to exist in relation to the teaching of Greek language. However, it can
be claimed that the difficulty of demonstrating curvilinear relations may be due to the difficulties of
establishing enough variation at the functioning of the factors especially since this study was
39
conducted in a single country. To demonstrate further our argument, we can refer to the fact that the
variance of frequency of questioning in Greek language was much higher than in the case of
mathematics and thereby a curvilinear relation only with teaching Greek language was identified.
There are two alternative approaches to search for curvilinear relations. First, experimental studies
can be conducted for creating enough variance at the functioning of each factor and then searching for
optimal values of the frequency and focus dimensions of the factors. However, attention should be
given on the ecological validity of experimental studies as well as on the ethical issues associated
with the experimentation (Miller, 1984; Robson, 1993). On the other hand, comparative studies can
be conducted for testing the validity of the model. International longitudinal studies can tap the full
range of variation in school and classroom quality, and therefore in potential school and classroom
effects. It is also likely that the existing estimates of the size of educational influences (i.e., schools
and classrooms/teachers together) upon student outcomes are potentially merely artefacts of the
studies’ lack of school and classroom variation. Thus, international studies could help us identify
curvilinear relations since in national studies the lack of a significant effect might be due to the
difficulties that we have to identify variation in either the student outcomes and more likely in the
explanatory variables. In addition, international studies on EER could show that the model travels
across countries and can be considered as a generic model. It is for this reasons that studies such as
the world class school and the ISTOF project could help us establish the international dimension of
EER and develop the theoretical framework of the field.
References
Aleamoni, L.M. (1981). Student rating of instruction. In J. Millman (Ed) Handbook of teacher evaluation, 110-145. London: Sage.
Amemiya, Y., & Anderson, T. W. (1985). Asymptotic chi-square tests for a large class of factor analysis models (Technical Report No. 12). Stanford, CA: Stanford University.
Andrich, D. (1988). A general form of Rasch’s Extended Logistic Model for partial credit scoring. Applied Measurement in Education, 1 (4), 363-378.
Askew, M. & William, D. (1995). Recent Research in Mathematics Education 5-16. London: Office for Standards in Education, 53.
Bentler, P. M. (1989). EQS: Structural equations program manual. Los Angeles: BMDP Statistical Software.
40
Bentler, P. M. (1990). Comparative fit indexes in structural models. Psychological Bulletin, 107, 238-246.
Black, P. & Wiliam, D. (1998). Inside the Black Box: Raising standards through classroom assessment. London: King’s College London School of Education.
Borich, G. D. (1992) (2nd Ed). Effective teaching methods. New York: Macmillan Publishing Company.
Bosker, R.J. (1990). Theory development in school effectiveness research: In search for stability of effects. In P. van de Eedem, J. Hox, & J. Hauer (Eds.) Theory and model in multilevel research: convergence or divergence? (pp. 77-98). Amsterdam: SISWO.
Brophy, J. & Good, T. L. (1986). Teacher Behaviour and Student Achievement. In M. C. Wittrock (Ed.) Handbook of Research on Teaching (pp. 328-375). New York: MacMillan.
Brown, M. W., & Mels, G. (1990). RAMONA PC: User Manual. Pretoria: University of South Africa.
Bryk, A.S. & Raudenbush, S.W. (1992). Hierarchical Linear Models. Newbury Park: CL: SAGE.
Byrne, B.M. & Goffin, R.D. (1993). Modeling MTMM Data for Additive and Multiplicative Covariance Structures: An Audit of Construct Validity Concordance. Multivariate Behavioral Research, 28(1), 67-96.
Campbell, D. T., & Fiske, D. W. (1959). Convergent and discriminant validation by the multitrait-multimethod matrix. Psychological Bulletin, 56, 81-105.
Campbell, R.J., Kyriakides, L., Muijs, R.D., & Robinson, W. (2003). Differential teacher effectiveness: towards a model for research and teacher appraisal. Oxford Review of Education, 29 (3), 347-362.
Campbell, R.J., Kyriakides, L., Muijs, R.D., & Robinson, W. (2004). Assessing Teacher Effectiveness: A Differentiated Model. London: Routledge Falmer.
Cazden, C. B. (1986). Classroom Discourse. In M. C. Wittrock (Ed.) Handbook of Research on Teaching (pp. 432-463). New York: MacMillan.
Cohen, D.; Manion, L. & Morrison, K. (2000) (5th Ed). Research methods in education. London: Routledge/Falmer.
Creemers, B.P.M. (1994). The effective classroom. London: Cassell.
Creemers, B.P.M. (2002). From School Effectiveness and School Improvement to Effective School Improvement: Background, Theoretical Analysis, and Outline of the Empirical Study. Educational Research and Evaluation, 8 (4), 343-362.
Creemers, B.P.M. & Kyriakides, L. (in press). Enhancing quality in education: A dynamic model of Education Effectiveness for Research and Practice. London: RoultledgeFalmer.
Creemers, B.P.M. & Kyriakides, L. (2005). Establishing links between Educational Effectiveness Research and improvement practices through the development of a dynamic model of educational effectiveness. Paper presented at the 86th Annual Meeting of the American Educational Research Association. Montreal, Canada.
Creemers, B.P.M. & Reezigt, G.J. (1996). School level conditions affecting the effectiveness of instruction. School Effectiveness and School Improvement, 7, 3, 197–228.
Cronbach, L.J. (3rd Ed) (1990). Essentials of Psychological Testing. New York: Harper & Row.
de Jong, R., Westerhof, K. J., & Kruiter, J.H. (2004). Empirical evidence of a comprehensive model of school effectiveness: a multilevel study in Mathematics in the first year of junior general education in the Netherlands. School effectiveness and school improvement, 15 (1), 3-31.
den Brok, P., Brekelmans, M. & Wubbels, T. (2004). Interpersonal teacher behaviour and student outcomes. School Effectiveness and School Improvement, 15, (3-4), 407–442.
41
Ellet, C.D. (1997). Classroom-Based Assessments of Teaching and Learning. In J. H. Stronge (Ed) Evaluating Teaching: A guide to current thinking and best practice, 107-128. Thousand Oaks, California: SAGE.
Emmer, E.T. & Everston, C. M. (1981) Synthesis of research on classroom management. Educational Leadership, 38 (4), 342-347.
Everston, C. M., Anderson, C., Anderson, L., & Brophy, J. (1980). Relationships between classroom behaviour and student outcomes in junior high math and English classes. American Educational Research Journal, 17, 43-60.
Flanders, N. (1970). Analyzing teacher behavior. Reading, MA: Addison-Wesley.
Fraser, B.J. (1995). Student’s perceptions of classrooms. In L.W. Anderson (Ed) International encyclopaedia of teaching and teacher education, 416-419. Oxford: Elsevier.
Fraser, B.J. (1991). Two decades of classroom environment research. In B.J. Fraser and H.J. Walberg (Eds.). Educational Environments: Evaluation, Antecedents and Consequences, (pp. 3-29). Oxford: Pergamon.
Goldstein, H. (2003) (3rd Edition). Multilevel statistical models. London: Edward Arnold. (ok)
Goldstein, H.; Rasbash, J.; Plewis, I.; Draper, D.; Browne, W.; Yang, M.; Woodhouse, G.; & Healy, M. (1998). A user’s guide to MLwiN. London: Institute of Education.
Harlen, W. & James, M. (1997) Assessment and Learning: Differences and relationships between formative and summative assessment. Assessment in Education, 4 (3), 365-379.
Hextall, I. & Mahony, P. (1998). Effective Teachers Effective Schools. London: Biddles Ltd
Huba, G. J., & Harlow, L. L. (1986). Robust estimation for causal models: A comparison of methods in some developmental data sets. In P. B. Baltes; D. L Featherman; & R. M. Lerner (Eds.), Life-span development and behavior (Vol. 7) (pp. 69-111). Hillsdale, NJ: Lawrence Erlbanm.
Jackson, D. N. (1969). Multimethod factor analysis in the evaluation of convergent and discriminant validity. Psychological Bulletin, 72, 30-49.
Kavanaugh, M. J., MacKinney, A. C, & Wolins, L. (1971). Issues in managerial performance: Multitrait- multimethod analyses of ratings. Psychological Bulletin, 75, 34-49.
Kenny, D. A. & Kashy, D. A. (1992). Analysis of the Multitrait-Multimethod Matrix by Confirmatory Factor Analysis. Psychological Bulletin 112, 1, 165–172.
Keeves, J.P. & Alagumalai, S. (1999). New Approaches to Measurement. In G.N. Masters & J.P. Keeves (Eds.), Advances in Measurement in Educational Research and Assessment (pp. 23-42). Oxford: Pergamon.
Kline, R.H. (1998). Principles and Practice of Structural Equation Modeling. London: Gilford Press.
Knuver, A.W.M. & Brandsma, H.P. (1993). Cognitive and affective outcomes in school effectiveness research. School effectiveness and school improvement, 13, 187-200.
Konu, A.; Lintonen, T.P, & Autio, V.J. (2002). Evaluation of well-being in schools: A multilevel analysis of general subjective well-being. School Effectiveness and School Improvement, 13 (2), 187-200.
Kyriakides, L. (2005). Extending the Comprehensive Model of Educational Effectiveness by an Empirical Investigation. School Effectiveness and School Improvement, 16.
Kyriakides, L., Campbell, R.J., & Christofidou, E. (2002). Generating criteria for measuring teacher effectiveness through a self-evaluation approach: A complementary way of measuring teacher effectiveness. School Effectiveness and School Improvement, 13 (3), 291-325.
42
Kyriakides, L., Campbell, R.J., & Gagatsis, A. (2000). The significance of the classroom effect in primary schools: An application of Creemers comprehensive model of educational effectiveness. School Effectiveness and School Improvement, 11 (4), 501-529.
Kyriakides, L. & Creemers, B.P.M. (2006). Using the dynamic model of educational effectiveness to introduce a policy promoting the provision of equal opportunities to students of different social groups. In McInerney, D. M., Van Etten, S. & Dowson, M. (Eds.) Research on Sociocultural Influences on Motivation and learning, Vol. 6: Effective schooling. Information Age Publishing, Greenwich CT.
Kyriakides, L. & Tsangaridou, N. (2004). School Effectiveness and Teacher Effectiveness in Physical Education. Paper presented at the 85th Annual Meeting of the American Educational Research Association. Chicago, USA.
Levine, D.U., & Lezotte, L.W. (1990). Unusually effective schools: A review and analysis of research and practice. Madison: National Centre for Effective School Research and Development.
Marsh, H.W. & Byrne, B.M. (1993). Confirmatory Factor Analysis of Multitrait-Multimethod Self-Concept Data: Between-group and Within-group Invariance Constraints. Multivariate Behavioral Research, 28(3), 313-349.
Marsh, H. W., & Hocevar, D. (1985). Application of confirmatory factor analysis to the study of self-concept: First- and higher-order factor models and their invariance across groups. Psychological Bulletin, 97, 562-582.
Ministry of Education (1994). The New Curriculum. Nicosia, Ministry of Education.
Mortimore, P., Sammons, P., Stoll, L., Lewis, D., & Ecob, R. (1988) School Matters. Wells: Open Books.
Muijs, D. & Reynolds, D. (2000). School Effectiveness and Teacher Effectiveness in Mathematics: Some preliminary Findings from the Evaluation of the Mathematics Enhancement Programme (Primary). School Effectiveness and School Improvement, 11 (3), 273-303.
Muijs, D., & Reynolds, D. (2001). Effective Teaching: evidence and practice. London: Sage.
Opdenakker, M.C. & Van Damme, J. (2000). Effects of Schools, Teaching Staff and Classes on Achievement and well-being in secondary education: Similarities and Differences Between school Outcomes. School effectiveness and School Improvement, 11 (2). 65-196.
Pines, A.L. & West, L.H.T. (1986). Conceptual understanding and Science learning: An interpretation of research within a source-of-knowledge framework. Science Education, 70 (5), 583-604.
Prawat, R.S. (1989). Teaching for understanding: 3 key attributes. Teaching and Teacher Education, 5 (4), 315-328.
Redfield, D. & Rousseau, E. (1981). A meta-analysis of experimental research on teacher questioning behaviour. Review of Educational Research, 51, 237-245.
Rosenshine, B. (1971). Teaching behaviors and student achievement. London: National Foundation for Educational Research.
Rosenshine, B. (1983). Teaching functions in instructional programs. Elementary School Journal, 89, 421-439.
Rosenshine, B. & Furst, N. (1973). The use of direct observation to study teaching. In R.M.W. Travers (Ed) Second Handbook of Research on Teaching. Chicago: Rand McNally.
Rosenshine, B. & Stevens, R. (1986). Teaching Functions. In M. C. Wittrock (Ed.) Handbook of Research on Teaching (pp. 376-391). New York: MacMillan.
Scheerens, J. (1992). Effective Schooling: Research, Theory and Practice. London: Cassell.
Scheerens, J. & Bosker, R (1997). The Foundations of Educational Effectiveness. Oxford: Pergamon
43
Schmitt, N., & Stults, D. M. (1986). Methodology review: Analysis of multitrait-multimethod matrices. Applied Psychological Measurement, 10, 1-22.
Shepard, L. A. (1989). Why we need better assessment. Educational Leadership, 46 (2), 4-8.
Slee, R. & Weiner, G. with Tomlinson, S. (Eds.) (1998). School Effectiveness for Whom? Challenges to the school effectiveness and school improvement movements. London: Falmer Press.
Snijders, T. & Bosker, R. (1999). Multilevel Analysis: An Introduction to Basic and Advanced Multilevel Modeling. London: Sage.
Stacy, A. W, Widaman, K. F, Hays, R., & DiMatteo, M. R. (1985). Validity of self-reports of alcohol and other drug use: A multitrait-multimethod assessment. Journal of Personality and Social Psychology, 49, 219-232.
Stenmark, J.K. (1992). Mathematics Assessment: Myths, Models, Good Questions and Practical Suggestions. Reston, Virginia, NCTM
Tanaka, J. S., & Bentler, P. M. (1985). Quasi-likelihood estimation in asymptotically efficient covariance structure models. American Statistical Association: 1984 Proceedings of the Social Statistics Section (pp. 658-662).
Teddlie, C. & Reynolds, D. (2000). The International Handbook of School Effectiveness Research. London: Falmer Press.
Walberg, H. J. (1986). Syntheses of Research on Teaching. In M. C. Wittrock (Ed.) Handbook of Research on Teaching (pp. 214-229). New York: MacMillan.
Widaman, K. F. (1985). Hierarchically nested covariance structure models for multitrait-multimethod data. Applied Psychological Measurement, 9, 1-26.
Wright, B. D. (1985). Additivity in psychological measurement. In E. E. Roskam (Ed), Measurement and personality assessment, (pp. 101-112). Amsterdam: Elsevier Science Publishers BV.
Yair, G. (1997). When classrooms matter: Implications of between-classroom variability for educational policy in Israel. Assessment in Education, 4 (2), 225-248.
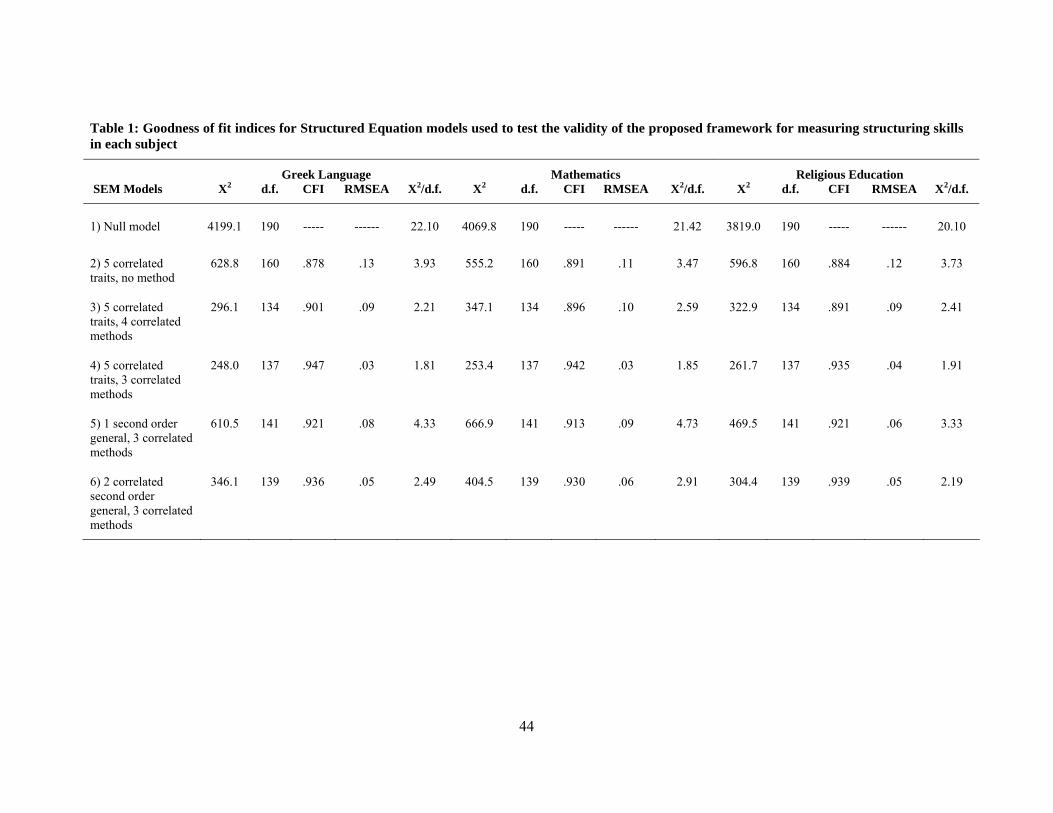
44
Table 1: Goodness of fit indices for Structured Equation models used to test the validity of the proposed framework for measuring structuring skills in each subject
Greek Language Mathematics Religious Education SEM Models X2 d.f. CFI RMSEA X2/d.f. X2 d.f. CFI RMSEA X2/d.f. X2 d.f. CFI RMSEA X2/d.f.
1) Null model 4199.1 190 ----- ------ 22.10 4069.8 190 ----- ------ 21.42 3819.0 190 ----- ------ 20.10
2) 5 correlated traits, no method
628.8 160 .878 .13 3.93 555.2 160 .891 .11 3.47 596.8 160 .884 .12 3.73
3) 5 correlated traits, 4 correlated methods
296.1 134 .901 .09 2.21 347.1 134 .896 .10 2.59 322.9 134 .891 .09 2.41
4) 5 correlated traits, 3 correlated methods
248.0 137 .947 .03 1.81 253.4 137 .942 .03 1.85 261.7 137 .935 .04 1.91
5) 1 second order general, 3 correlated methods
610.5 141 .921 .08 4.33 666.9 141 .913 .09 4.73 469.5 141 .921 .06 3.33
6) 2 correlated second order general, 3 correlated methods
346.1 139 .936 .05 2.49 404.5 139 .930 .06 2.91 304.4 139 .939 .05 2.19
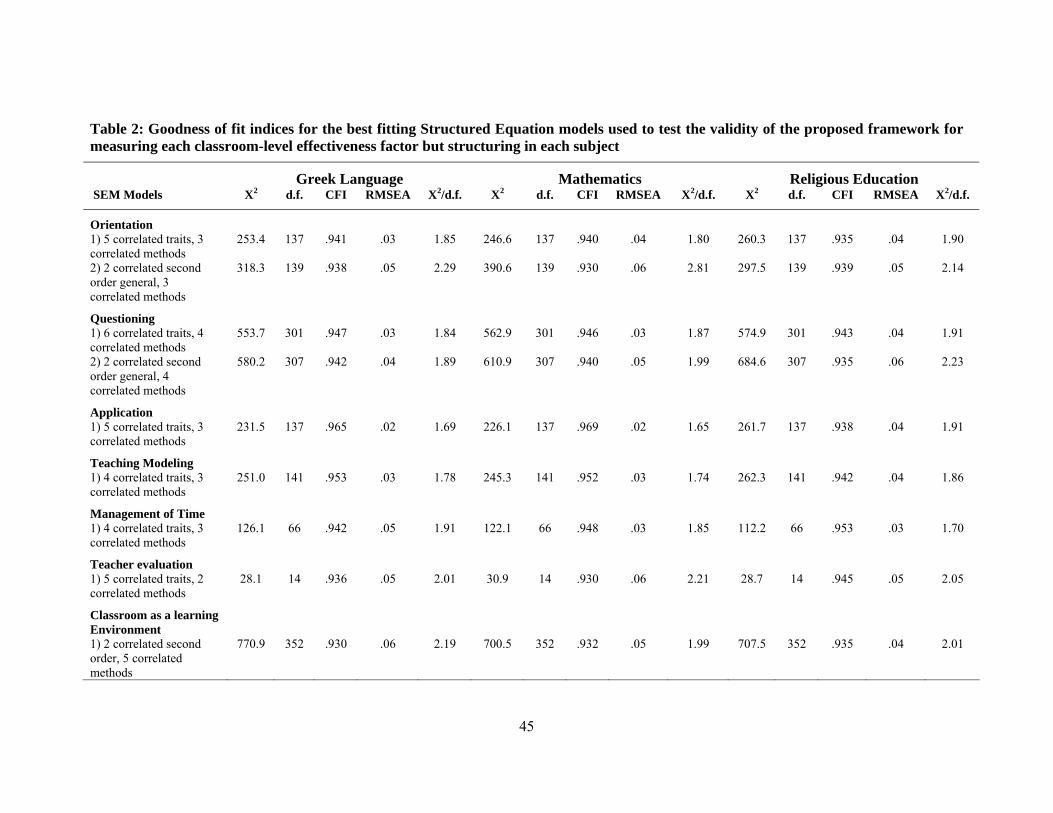
45
Table 2: Goodness of fit indices for the best fitting Structured Equation models used to test the validity of the proposed framework for measuring each classroom-level effectiveness factor but structuring in each subject
Greek Language Mathematics Religious Education SEM Models X2 d.f. CFI RMSEA X2/d.f. X2 d.f. CFI RMSEA X2/d.f. X2 d.f. CFI RMSEA X2/d.f.
Orientation
1) 5 correlated traits, 3 correlated methods
253.4 137 .941 .03 1.85 246.6 137 .940 .04 1.80 260.3 137 .935 .04 1.90
2) 2 correlated second order general, 3 correlated methods
318.3 139 .938 .05 2.29 390.6 139 .930 .06 2.81 297.5 139 .939 .05 2.14
Questioning
1) 6 correlated traits, 4 correlated methods
553.7 301 .947 .03 1.84 562.9 301 .946 .03 1.87 574.9 301 .943 .04 1.91
2) 2 correlated second order general, 4 correlated methods
580.2 307 .942 .04 1.89 610.9 307 .940 .05 1.99 684.6 307 .935 .06 2.23
Application
1) 5 correlated traits, 3 correlated methods
231.5 137 .965 .02 1.69 226.1 137 .969 .02 1.65 261.7 137 .938 .04 1.91
Teaching Modeling
1) 4 correlated traits, 3 correlated methods
251.0 141 .953 .03 1.78 245.3 141 .952 .03 1.74 262.3 141 .942 .04 1.86
Management of Time
1) 4 correlated traits, 3 correlated methods
126.1 66 .942 .05 1.91 122.1 66 .948 .03 1.85 112.2 66 .953 .03 1.70
Teacher evaluation
1) 5 correlated traits, 2 correlated methods
28.1 14 .936 .05 2.01 30.9 14 .930 .06 2.21 28.7 14 .945 .05 2.05
Classroom as a learning Environment
1) 2 correlated second order, 5 correlated methods
770.9 352 .930 .06 2.19 700.5 352 .932 .05 1.99 707.5 352 .935 .04 2.01
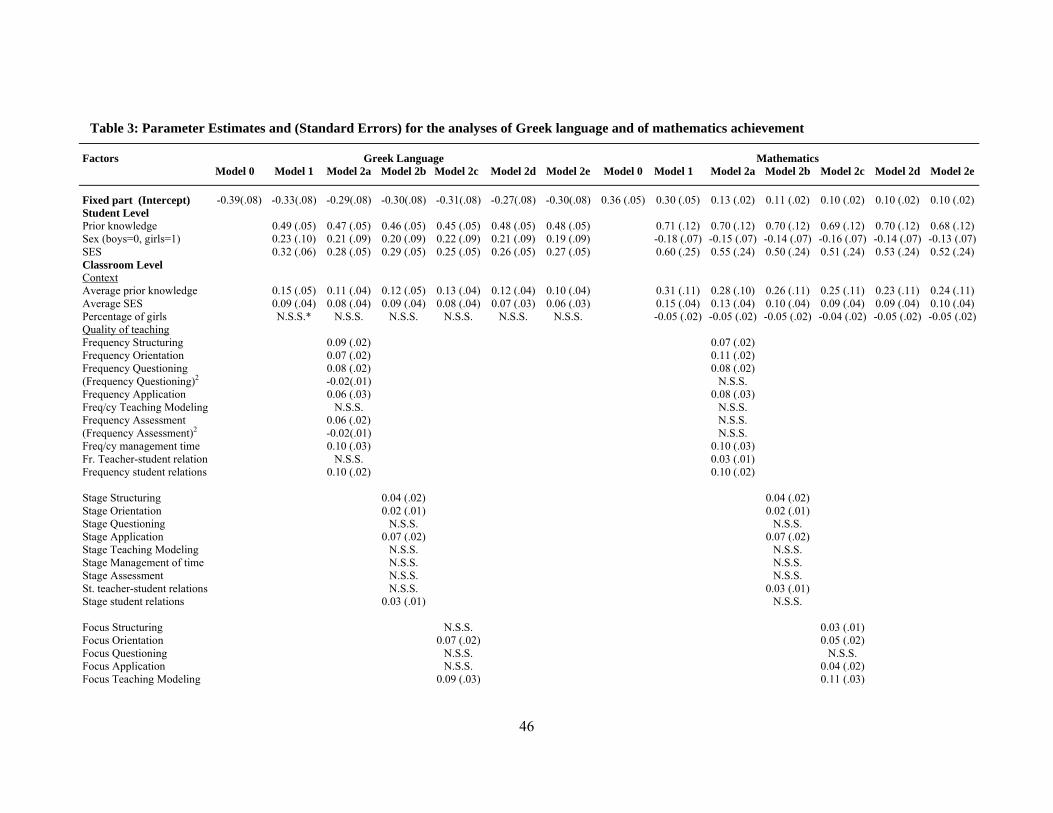
46
Table 3: Parameter Estimates and (Standard Errors) for the analyses of Greek language and of mathematics achievement
Factors Greek Language Mathematics Model 0 Model 1 Model 2a Model 2b Model 2c Model 2d Model 2e Model 0 Model 1 Model 2a Model 2b Model 2c Model 2d Model 2e
Fixed part (Intercept) -0.39(.08) -0.33(.08) -0.29(.08) -0.30(.08) -0.31(.08) -0.27(.08) -0.30(.08) 0.36 (.05) 0.30 (.05) 0.13 (.02) 0.11 (.02) 0.10 (.02) 0.10 (.02) 0.10 (.02)Student Level Prior knowledge 0.49 (.05) 0.47 (.05) 0.46 (.05) 0.45 (.05) 0.48 (.05) 0.48 (.05) 0.71 (.12) 0.70 (.12) 0.70 (.12) 0.69 (.12) 0.70 (.12) 0.68 (.12)Sex (boys=0, girls=1) 0.23 (.10) 0.21 (.09) 0.20 (.09) 0.22 (.09) 0.21 (.09) 0.19 (.09) -0.18 (.07) -0.15 (.07) -0.14 (.07) -0.16 (.07) -0.14 (.07) -0.13 (.07)SES 0.32 (.06) 0.28 (.05) 0.29 (.05) 0.25 (.05) 0.26 (.05) 0.27 (.05) 0.60 (.25) 0.55 (.24) 0.50 (.24) 0.51 (.24) 0.53 (.24) 0.52 (.24)Classroom Level Context Average prior knowledge 0.15 (.05) 0.11 (.04) 0.12 (.05) 0.13 (.04) 0.12 (.04) 0.10 (.04) 0.31 (.11) 0.28 (.10) 0.26 (.11) 0.25 (.11) 0.23 (.11) 0.24 (.11)Average SES 0.09 (.04) 0.08 (.04) 0.09 (.04) 0.08 (.04) 0.07 (.03) 0.06 (.03) 0.15 (.04) 0.13 (.04) 0.10 (.04) 0.09 (.04) 0.09 (.04) 0.10 (.04)Percentage of girls N.S.S.* N.S.S. N.S.S. N.S.S. N.S.S. N.S.S. -0.05 (.02) -0.05 (.02) -0.05 (.02) -0.04 (.02) -0.05 (.02) -0.05 (.02)Quality of teaching Frequency Structuring 0.09 (.02) 0.07 (.02) Frequency Orientation 0.07 (.02) 0.11 (.02) Frequency Questioning 0.08 (.02) 0.08 (.02) (Frequency Questioning)2 -0.02(.01) N.S.S. Frequency Application 0.06 (.03) 0.08 (.03) Freq/cy Teaching Modeling N.S.S. N.S.S. Frequency Assessment 0.06 (.02) N.S.S. (Frequency Assessment)2 -0.02(.01) N.S.S. Freq/cy management time 0.10 (.03) 0.10 (.03) Fr. Teacher-student relation N.S.S. 0.03 (.01) Frequency student relations 0.10 (.02) 0.10 (.02) Stage Structuring 0.04 (.02) 0.04 (.02) Stage Orientation 0.02 (.01) 0.02 (.01) Stage Questioning N.S.S. N.S.S. Stage Application 0.07 (.02) 0.07 (.02) Stage Teaching Modeling N.S.S. N.S.S. Stage Management of time N.S.S. N.S.S. Stage Assessment N.S.S. N.S.S. St. teacher-student relations N.S.S. 0.03 (.01) Stage student relations 0.03 (.01) N.S.S. Focus Structuring N.S.S. 0.03 (.01) Focus Orientation 0.07 (.02) 0.05 (.02) Focus Questioning N.S.S. N.S.S. Focus Application N.S.S. 0.04 (.02) Focus Teaching Modeling 0.09 (.03) 0.11 (.03)
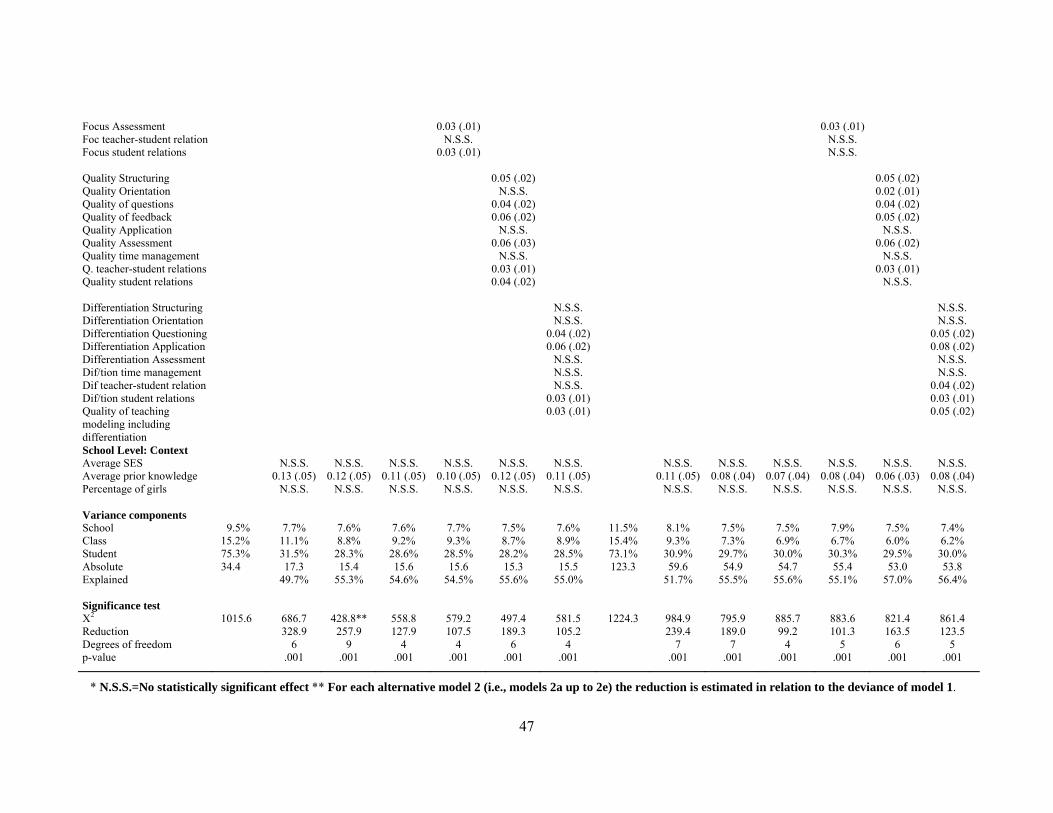
47
Focus Assessment 0.03 (.01) 0.03 (.01) Foc teacher-student relation N.S.S. N.S.S. Focus student relations 0.03 (.01) N.S.S. Quality Structuring 0.05 (.02) 0.05 (.02) Quality Orientation N.S.S. 0.02 (.01) Quality of questions 0.04 (.02) 0.04 (.02) Quality of feedback 0.06 (.02) 0.05 (.02) Quality Application N.S.S. N.S.S. Quality Assessment 0.06 (.03) 0.06 (.02) Quality time management N.S.S. N.S.S. Q. teacher-student relations 0.03 (.01) 0.03 (.01) Quality student relations 0.04 (.02) N.S.S. Differentiation Structuring N.S.S. N.S.S. Differentiation Orientation N.S.S. N.S.S. Differentiation Questioning 0.04 (.02) 0.05 (.02) Differentiation Application 0.06 (.02) 0.08 (.02) Differentiation Assessment N.S.S. N.S.S. Dif/tion time management N.S.S. N.S.S. Dif teacher-student relation N.S.S. 0.04 (.02) Dif/tion student relations 0.03 (.01) 0.03 (.01) Quality of teaching modeling including differentiation
0.03 (.01) 0.05 (.02)
School Level: Context Average SES N.S.S. N.S.S. N.S.S. N.S.S. N.S.S. N.S.S. N.S.S. N.S.S. N.S.S. N.S.S. N.S.S. N.S.S. Average prior knowledge 0.13 (.05) 0.12 (.05) 0.11 (.05) 0.10 (.05) 0.12 (.05) 0.11 (.05) 0.11 (.05) 0.08 (.04) 0.07 (.04) 0.08 (.04) 0.06 (.03) 0.08 (.04)Percentage of girls N.S.S. N.S.S. N.S.S. N.S.S. N.S.S. N.S.S. N.S.S. N.S.S. N.S.S. N.S.S. N.S.S. N.S.S. Variance components School 9.5% 7.7% 7.6% 7.6% 7.7% 7.5% 7.6% 11.5% 8.1% 7.5% 7.5% 7.9% 7.5% 7.4% Class 15.2% 11.1% 8.8% 9.2% 9.3% 8.7% 8.9% 15.4% 9.3% 7.3% 6.9% 6.7% 6.0% 6.2% Student 75.3% 31.5% 28.3% 28.6% 28.5% 28.2% 28.5% 73.1% 30.9% 29.7% 30.0% 30.3% 29.5% 30.0% Absolute 34.4 17.3 15.4 15.6 15.6 15.3 15.5 123.3 59.6 54.9 54.7 55.4 53.0 53.8 Explained 49.7% 55.3% 54.6% 54.5% 55.6% 55.0% 51.7% 55.5% 55.6% 55.1% 57.0% 56.4% Significance test X2 1015.6 686.7 428.8** 558.8 579.2 497.4 581.5 1224.3 984.9 795.9 885.7 883.6 821.4 861.4 Reduction 328.9 257.9 127.9 107.5 189.3 105.2 239.4 189.0 99.2 101.3 163.5 123.5 Degrees of freedom 6 9 4 4 6 4 7 7 4 5 6 5 p-value .001 .001 .001 .001 .001 .001 .001 .001 .001 .001 .001 .001
* N.S.S.=No statistically significant effect ** For each alternative model 2 (i.e., models 2a up to 2e) the reduction is estimated in relation to the deviance of model 1.
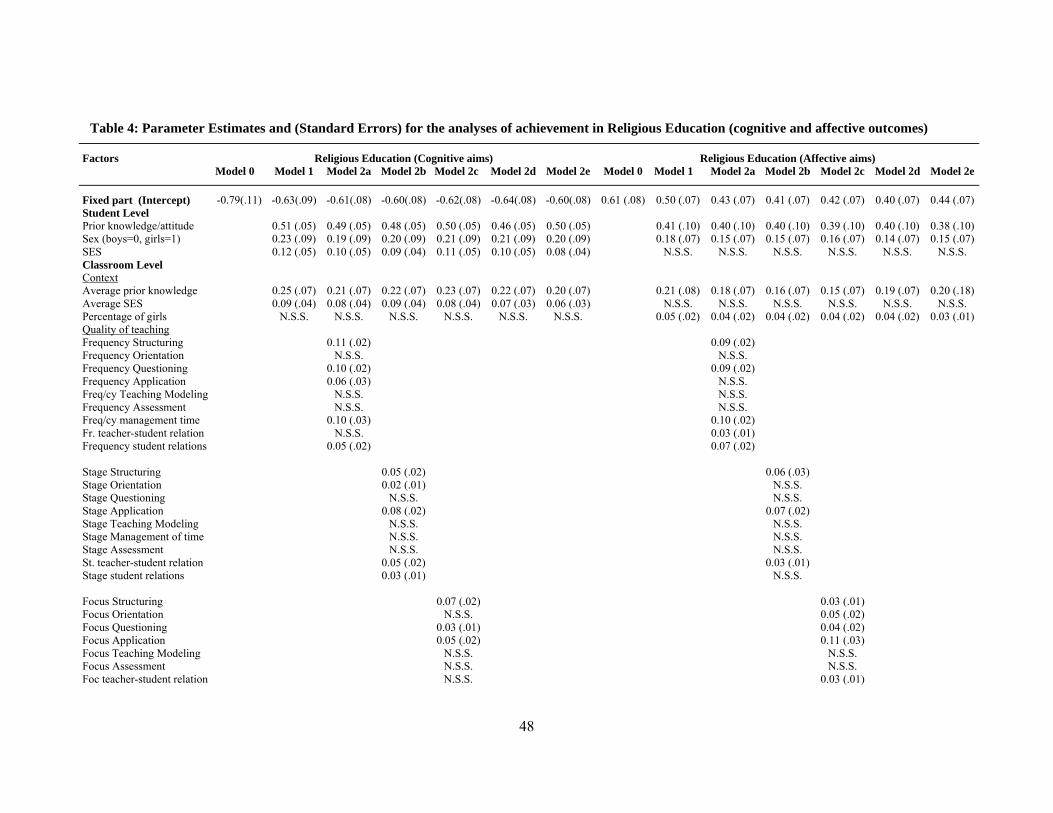
48
Table 4: Parameter Estimates and (Standard Errors) for the analyses of achievement in Religious Education (cognitive and affective outcomes)
Factors Religious Education (Cognitive aims) Religious Education (Affective aims) Model 0 Model 1 Model 2a Model 2b Model 2c Model 2d Model 2e Model 0 Model 1 Model 2a Model 2b Model 2c Model 2d Model 2e
Fixed part (Intercept) -0.79(.11) -0.63(.09) -0.61(.08) -0.60(.08) -0.62(.08) -0.64(.08) -0.60(.08) 0.61 (.08) 0.50 (.07) 0.43 (.07) 0.41 (.07) 0.42 (.07) 0.40 (.07) 0.44 (.07)Student Level Prior knowledge/attitude 0.51 (.05) 0.49 (.05) 0.48 (.05) 0.50 (.05) 0.46 (.05) 0.50 (.05) 0.41 (.10) 0.40 (.10) 0.40 (.10) 0.39 (.10) 0.40 (.10) 0.38 (.10)Sex (boys=0, girls=1) 0.23 (.09) 0.19 (.09) 0.20 (.09) 0.21 (.09) 0.21 (.09) 0.20 (.09) 0.18 (.07) 0.15 (.07) 0.15 (.07) 0.16 (.07) 0.14 (.07) 0.15 (.07)SES 0.12 (.05) 0.10 (.05) 0.09 (.04) 0.11 (.05) 0.10 (.05) 0.08 (.04) N.S.S. N.S.S. N.S.S. N.S.S. N.S.S. N.S.S. Classroom Level Context Average prior knowledge 0.25 (.07) 0.21 (.07) 0.22 (.07) 0.23 (.07) 0.22 (.07) 0.20 (.07) 0.21 (.08) 0.18 (.07) 0.16 (.07) 0.15 (.07) 0.19 (.07) 0.20 (.18)Average SES 0.09 (.04) 0.08 (.04) 0.09 (.04) 0.08 (.04) 0.07 (.03) 0.06 (.03) N.S.S. N.S.S. N.S.S. N.S.S. N.S.S. N.S.S. Percentage of girls N.S.S. N.S.S. N.S.S. N.S.S. N.S.S. N.S.S. 0.05 (.02) 0.04 (.02) 0.04 (.02) 0.04 (.02) 0.04 (.02) 0.03 (.01)Quality of teaching Frequency Structuring 0.11 (.02) 0.09 (.02) Frequency Orientation N.S.S. N.S.S. Frequency Questioning 0.10 (.02) 0.09 (.02) Frequency Application 0.06 (.03) N.S.S. Freq/cy Teaching Modeling N.S.S. N.S.S. Frequency Assessment N.S.S. N.S.S. Freq/cy management time 0.10 (.03) 0.10 (.02) Fr. teacher-student relation N.S.S. 0.03 (.01) Frequency student relations 0.05 (.02) 0.07 (.02) Stage Structuring 0.05 (.02) 0.06 (.03) Stage Orientation 0.02 (.01) N.S.S. Stage Questioning N.S.S. N.S.S. Stage Application 0.08 (.02) 0.07 (.02) Stage Teaching Modeling N.S.S. N.S.S. Stage Management of time N.S.S. N.S.S. Stage Assessment N.S.S. N.S.S. St. teacher-student relation 0.05 (.02) 0.03 (.01) Stage student relations 0.03 (.01) N.S.S. Focus Structuring 0.07 (.02) 0.03 (.01) Focus Orientation N.S.S. 0.05 (.02) Focus Questioning 0.03 (.01) 0.04 (.02) Focus Application 0.05 (.02) 0.11 (.03) Focus Teaching Modeling N.S.S. N.S.S. Focus Assessment N.S.S. N.S.S. Foc teacher-student relation N.S.S. 0.03 (.01)
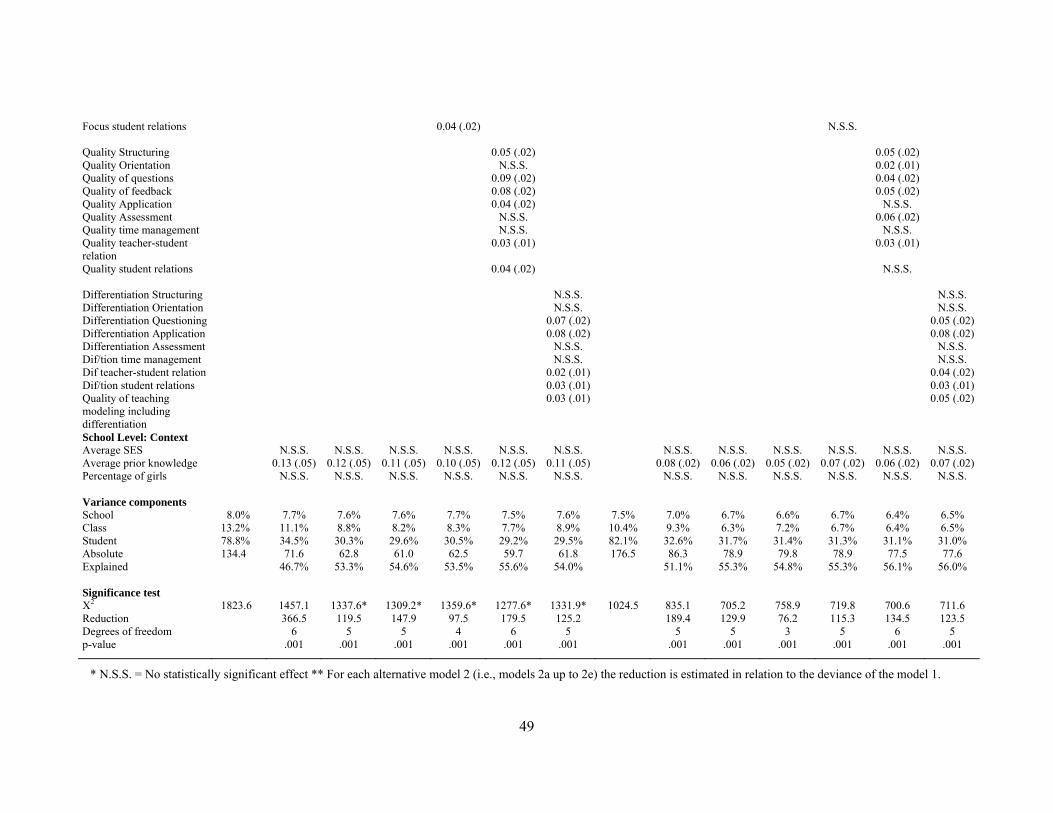
49
Focus student relations 0.04 (.02) N.S.S. Quality Structuring 0.05 (.02) 0.05 (.02) Quality Orientation N.S.S. 0.02 (.01) Quality of questions 0.09 (.02) 0.04 (.02) Quality of feedback 0.08 (.02) 0.05 (.02) Quality Application 0.04 (.02) N.S.S. Quality Assessment N.S.S. 0.06 (.02) Quality time management N.S.S. N.S.S. Quality teacher-student relation
0.03 (.01) 0.03 (.01)
Quality student relations 0.04 (.02) N.S.S. Differentiation Structuring N.S.S. N.S.S. Differentiation Orientation N.S.S. N.S.S. Differentiation Questioning 0.07 (.02) 0.05 (.02) Differentiation Application 0.08 (.02) 0.08 (.02) Differentiation Assessment N.S.S. N.S.S. Dif/tion time management N.S.S. N.S.S. Dif teacher-student relation 0.02 (.01) 0.04 (.02) Dif/tion student relations 0.03 (.01) 0.03 (.01) Quality of teaching modeling including differentiation
0.03 (.01) 0.05 (.02)
School Level: Context Average SES N.S.S. N.S.S. N.S.S. N.S.S. N.S.S. N.S.S. N.S.S. N.S.S. N.S.S. N.S.S. N.S.S. N.S.S. Average prior knowledge 0.13 (.05) 0.12 (.05) 0.11 (.05) 0.10 (.05) 0.12 (.05) 0.11 (.05) 0.08 (.02) 0.06 (.02) 0.05 (.02) 0.07 (.02) 0.06 (.02) 0.07 (.02)Percentage of girls N.S.S. N.S.S. N.S.S. N.S.S. N.S.S. N.S.S. N.S.S. N.S.S. N.S.S. N.S.S. N.S.S. N.S.S. Variance components School 8.0% 7.7% 7.6% 7.6% 7.7% 7.5% 7.6% 7.5% 7.0% 6.7% 6.6% 6.7% 6.4% 6.5% Class 13.2% 11.1% 8.8% 8.2% 8.3% 7.7% 8.9% 10.4% 9.3% 6.3% 7.2% 6.7% 6.4% 6.5% Student 78.8% 34.5% 30.3% 29.6% 30.5% 29.2% 29.5% 82.1% 32.6% 31.7% 31.4% 31.3% 31.1% 31.0% Absolute 134.4 71.6 62.8 61.0 62.5 59.7 61.8 176.5 86.3 78.9 79.8 78.9 77.5 77.6 Explained 46.7% 53.3% 54.6% 53.5% 55.6% 54.0% 51.1% 55.3% 54.8% 55.3% 56.1% 56.0% Significance test X2 1823.6 1457.1 1337.6* 1309.2* 1359.6* 1277.6* 1331.9* 1024.5 835.1 705.2 758.9 719.8 700.6 711.6 Reduction 366.5 119.5 147.9 97.5 179.5 125.2 189.4 129.9 76.2 115.3 134.5 123.5 Degrees of freedom 6 5 5 4 6 5 5 5 3 5 6 5 p-value .001 .001 .001 .001 .001 .001 .001 .001 .001 .001 .001 .001
* N.S.S. = No statistically significant effect ** For each alternative model 2 (i.e., models 2a up to 2e) the reduction is estimated in relation to the deviance of the model 1.
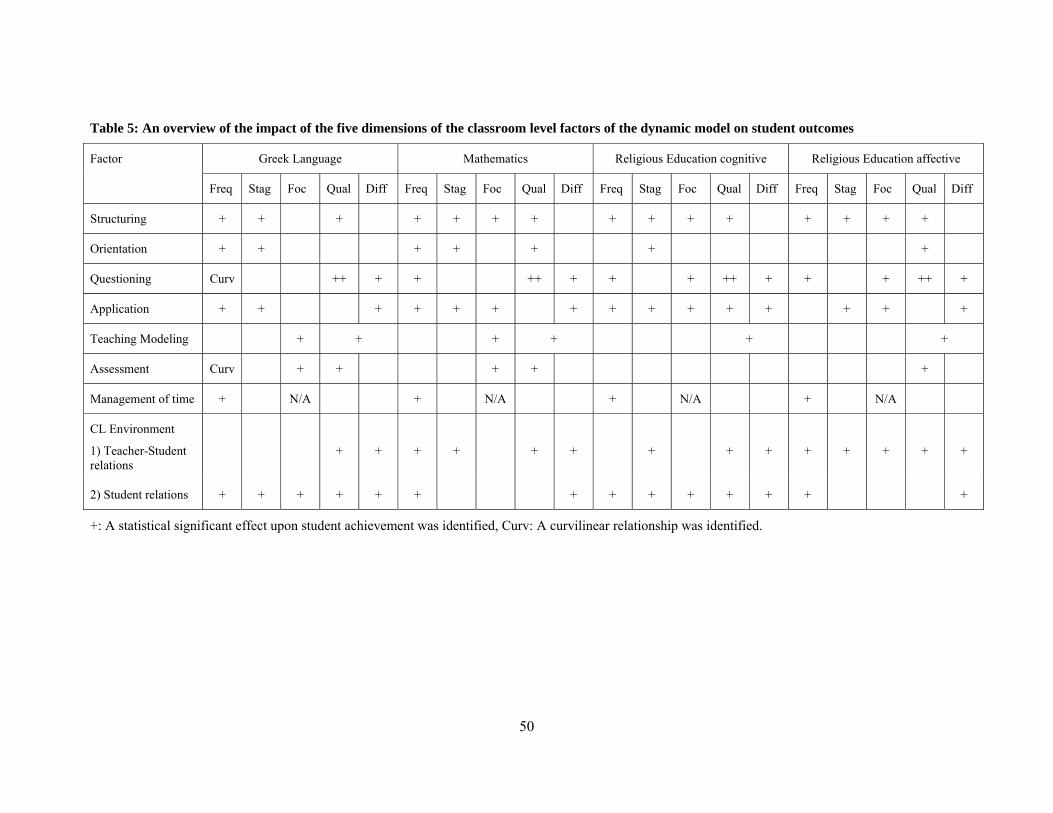
50
Table 5: An overview of the impact of the five dimensions of the classroom level factors of the dynamic model on student outcomes
Greek Language Mathematics Religious Education cognitive Religious Education affective Factor
Freq Stag Foc Qual Diff Freq Stag Foc Qual Diff Freq Stag Foc Qual Diff Freq Stag Foc Qual Diff
Structuring + + + + + + + + + + + + + + +
Orientation + + + + + + +
Questioning Curv ++ + + ++ + + + ++ + + + ++ +
Application + + + + + + + + + + + + + + +
Teaching Modeling + + + + + +
Assessment Curv + + + + +
Management of time + N/A + N/A + N/A + N/A
CL Environment
1) Teacher-Student relations
+
+
+
+
+
+
+
+
+
+
+
+
+
+
2) Student relations + + + + + + + + + + + + + +
+: A statistical significant effect upon student achievement was identified, Curv: A curvilinear relationship was identified.
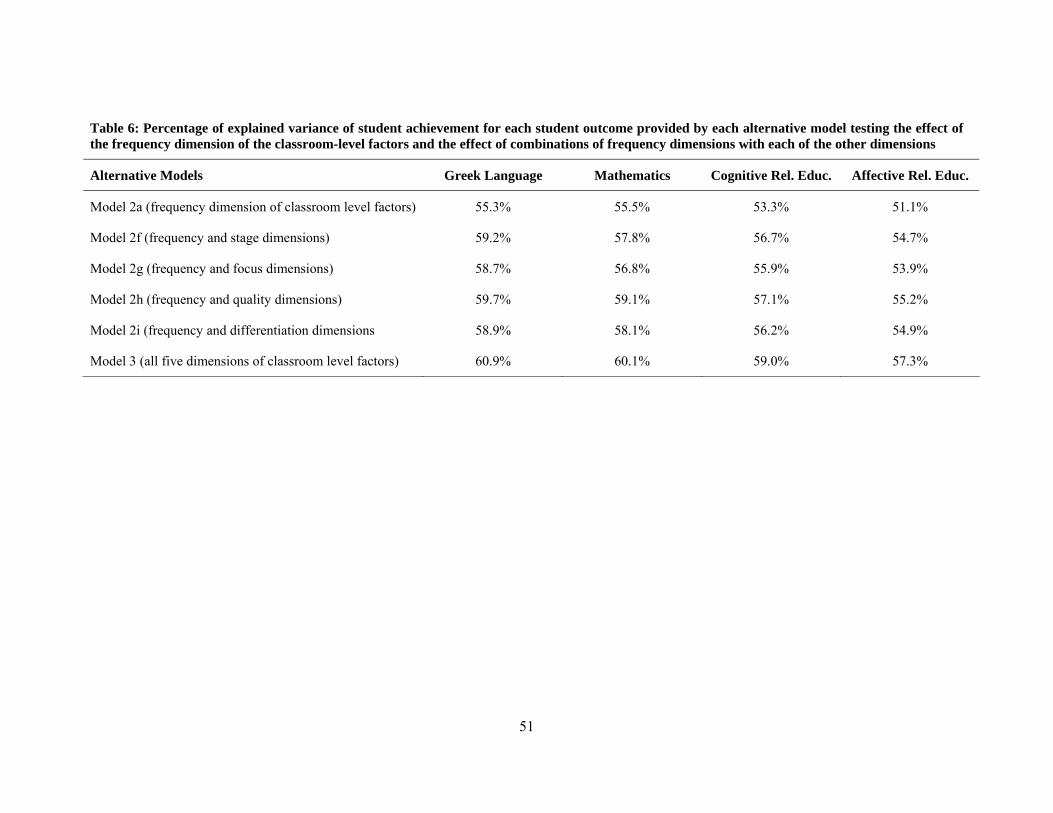
51
Table 6: Percentage of explained variance of student achievement for each student outcome provided by each alternative model testing the effect of the frequency dimension of the classroom-level factors and the effect of combinations of frequency dimensions with each of the other dimensions
Alternative Models Greek Language Mathematics Cognitive Rel. Educ. Affective Rel. Educ.
Model 2a (frequency dimension of classroom level factors) 55.3% 55.5% 53.3% 51.1%
Model 2f (frequency and stage dimensions) 59.2% 57.8% 56.7% 54.7%
Model 2g (frequency and focus dimensions) 58.7% 56.8% 55.9% 53.9%
Model 2h (frequency and quality dimensions) 59.7% 59.1% 57.1% 55.2%
Model 2i (frequency and differentiation dimensions 58.9% 58.1% 56.2% 54.9%
Model 3 (all five dimensions of classroom level factors) 60.9% 60.1% 59.0% 57.3%