testing the efficiency of indian wheat futuresecon.upm.edu.my/ijem/vol7no2/bab12.pdf · testing the...
TRANSCRIPT

Int. Journal of Economics and Management 7(2): 408 – 430 (2013) ISSN 1823 - 836X
Testing the Efficiency of Indian Wheat Futures
SENDHIL, Ra*, AMIT KARb, MATHUR, V.C.c AND GIRISH, K. JHAd
aDirectorate of Wheat Research, Karnal, Haryana, Indiab,c,dDivision of Agricultural Economics,
Indian Agricultural Research Institute, Delhi, India
ABSTRACTEfficiency of wheat futures trading has been analysed in terms of price transmission, price discovery and extent of volatility. Cointegration analysis reveals a long-run equilibrium owing to price transmission between futures and spot markets for three contracts. Analysis on price discovery indicates hedging only in one contract and the rest experience speculative prices. GARCH results exhibit persistence of price volatility. The above analyses point the inefficiency in wheat futures. This paper concludes that farmer participation through institutional intervention and innovation will improve its efficiency substantially.
Keywords: Futures trading, wheat, price discovery, cointegration, volatility
JEL Classification: C13, C32, G13, G14, M31, M38, Q13
INTRODUCTIONVolatility in food prices is a major concern for producers as well as consumers particularly in an agrarian economy like India. The uncertain movement of prices over time can be managed either by an individual’s own decision or group/government’s initiative. Though various management techniques exist, futures trading is considered to be one of the effective strategies in countering price volatility. It involves an obligation between the buyer and seller to fulfill the terms of contract (i.e., pre-determined standardised futures contract entered today which is set for delivery in a future date). Many developing countries have been establishing and promoting commodity futures in view of its accrued benefits to the economy. In India also, where the futures trading had been in a dormant stage
* Corresponding author: E-mail: [email protected] remaining errors or omissions rest solely with the author(s) of this paper.
409
Testing the Efficiency of Indian Wheat Futures
and unorganised for a long time, the interest has revived in the recent past. Efforts were being made to promote organised agricultural commodity futures in the country for its wider role in the context of changing economic scenario (Forward Markets Commission, 2000).
Futures contract made under organised commodity exchanges perform two important functions viz., price discovery and risk management (Velmurugan et al., 2010). The twin functions are expected to help in the process of price stabilisation and safeguard the interests of farmers, exporters and others stakeholders. Price discovery is a continuous process of arriving at a price, which a person buys and another sells a futures contract in a commodity exchange. Competitive price discovery is a major economic function and, indeed, a major economic benefit of futures trading. Through this competition, all the available information is continuously transmitted into future price, providing a dynamic barometer of supply and demand (Easwaran and Ramasundaram, 2008).
Testing market efficiency in terms of price discovery and information flow across markets has received much attention among academicians, regulators and policy makers (Brosig et al., 2011; Easwaran and Ramasundaram, 2008; Sen, 2008; Garbade and Silber, 1982). The essence of price discovery function depends on whether new information is reflected first in futures or spot market. Infact both the markets contribute to the discovery of a unique and common unobservable price, which is the efficient price (Velmurugan et al., 2010). Through this information, farmers and other stakeholders sought to lock in a value on the commodity and wish to pay a price for certainty. They give up the chance of very high prices in return for protection against abysmally low prices, technically called hedging i.e., risk transfer function. To evaluate the effectiveness of the function, various hedging performance measure are often employed (Lien, 2012). For the market to function there must be someone to take the risk, so called speculators. They monitor market information and activity, accordingly take risk and make money. But the focus of present study is to examine how far futures trading helpful in hedging as a means of price risk management. However, such type of hedging will be successful only if the futures markets are efficient in price discovery. Hence, assessment of futures efficiency in terms of price discovery and transmission needs attention.
During 1990s, the economic liberalisation in many countries led to increasing withdrawal of the government’s intervention from the agricultural commodity sector, which made food prices to depend on the domestic and international market forces (UNCTAD, 1997; World Bank, 1997). Increase in the overall price of food commodities in India during mid-2009 blamed the operation of futures trading and questioned both the sustainability of current economic growth process as well as the
410
International Journal of Economics and Management
efficiency of public management system. In light of this argument, it is necessary to have an in-depth analysis of price transmission and volatility in domestic markets.
The analysis of commodity futures efficiency though received much attention in India in the recent past, most of the studies focus on non-agricultural commodities. In India, only a few studies have focused on testing the efficiency of futures trading in agricultural commodities. Among the food crops cultivated in India, wheat offers a rich source of energy being the country’s staple food. Futures price and flow of information to the economic agents plays a major role in facilitating the acreage under wheat with India currently holding the maximum share under global wheat area. Further, volatile price is unpleasant to wheat growers in deciding the crop area and the economy as well where a substantial population consume. In this context, the present study is carried out to analyse the efficiency of futures trading in wheat, to examine the extent of volatility in spot market due to futures trading, and to analyse its relevance for the small scale production system prevailing in India.
LITERATURE REVIEWExtensive literature pertaining to futures markets is available, but only few studies have been carried out in India. Futures trading is said to have originated in Japan during 17th century for silk and rice. The Dojima Rice Exchange in Osaka, Japan, is said to be the world’s first organised futures exchange, where trading started in 1710. It is believed that commodity futures have existed in India for thousands of years. To quote, Kautilya’s ‘Arthashastra’ written in 4th century has cited market operations similar to futures markets (Srinivasan, 2008). In India, though organised commodity derivatives trading began with the formation of cotton trade association, the year 2003 was a watershed in the history of commodity trading with the establishment of organised commodity exchanges. The volume of agricultural commodities traded in futures market has increased exponentially since the inception of trading. Although the trade value shows an increasing trend, the share of agricultural commodities in the total trade is declining drastically (Ballabh et al., 2010). Given the growth in trading volumes and increasing integration of Indian economy with rest of the world, the Indian commodity futures market has been recognized among the top commodity exchanges of the world (Velmurugan et al, 2010).
Under efficient markets, new information is transmitted simultaneously into spot and futures markets (Zhong et al., 2004). In other words, commodity market pricing theory states that market efficiency is a function of how fast and how much information is reflected in prices. The rate at which prices exhibit market information is the rate at which this information is disseminated to market participants (Zapata
411
Testing the Efficiency of Indian Wheat Futures
et al., 2005). However, in reality, institutional factors such as liquidity, transaction costs, and other market restrictions may produce an empirical lead-lag relationship between price changes in the two markets. Futures markets could incorporate new information more quickly than spot market given their inherent leverage, low transaction costs, and lack of short sale restrictions (Tse, 1999). Several studies suggest that futures markets play a critical role in price discovery for the underlying spot market (Lien and Tse, 2000). Garbade and Silber (GS) in 1983 developed a model and analysed price movements in spot and futures market (CBOT) in U.S. for four storable agricultural commodities. They found that futures are dominant in price discovery. Thomas and Karande (2001) analysed the price discovery across spot and futures in Indian castor seed market at Ahemadabad (production center) and Mumbai (export destination) using a mathematical model developed by Garbade and Silber. In Mumbai, futures market dominates the price discovery whereas in Ahemadabad, neither futures nor spot market does it. Bhardwaj and Vasisht (2010) examined the price discovery in commodity markets of Gram using the same model considering Bikaner and Delhi as the reference spot market. They reported that futures market helps in the process of price discovery.
Few studies suggest that futures market fails to provide hedge against volatile prices (Easwaran and Ramasundaram, 2008; and Sahadevan, 2002). Easwaran and Ramasundaram (2008) investigated whether futures markets are efficient in price discovery for castor, cotton, pepper and soybean. The study used Wald-Chi-square procedure parametric restriction on coefficients to test market efficiency and unbiasedness of futures prices. The results indicated that futures market failed to provide hedge against volatile prices. Sahadevan (2002) studied the risk management of futures market in selected six commodities traded across four national exchanges in India. The analysis revealed that futures market fails in price discovery.
Price discovery function implies prices in the futures and spot markets are systematically related in the short run and/or in the long run. In a cointegration framework, the price discovery function implies the presence of an equilibrium relation binding the two prices together. If a departure from equilibrium occurs, prices in one or both markets should adjust to correct the disparity. Most of the economic studies reveal that the spot and futures market are integrated in the long run (Singh et al., 2005; Mahalik et al., 2009; and, Vasisht and Bhardwaj, 2010). The results of Singh et al., (2005) indicated that there exists a mechanism for long run equilibrium in the maize as well as wheat contracts. Mahalik et al., (2009) analysed the price discovery using vector error correction model in Indian futures-spot commodity markets from 2005 to 2008. The results showed that
412
International Journal of Economics and Management
agriculture future price index served for the price discovery function. Vasisht and Bhardwaj (2010) analysed the extent of integration between futures and spot maize prices (Nizamabad) for August and September contract, 2008 using Johansen’s methodology. The empirical results showed the presence of unit roots and long run equilibrium in the price series.
Kumar and Sharma (2003) attempted to study the spatial price integration and pricing efficiency at the farm level. Spatial price behaviour in regional markets had been an important indicator of the overall market performance. The authors suggested that Johansen’s (1988) maximum likelihood procedure was more powerful than cointegration technique using Augmented Dickey-Fuller to test the null hypothesis of no cointegration. Thus, superiority of this test was proved when testing for cointegration between more than two variables. This test also helped to find out the exogenous and endogenous variables in the system through ‘error correction’ procedure. The study concluded that the price adjustment process was found to be quicker in the post-liberalisation compared to the pre-liberalisation period.
Agricultural commodity market quantities and prices are often random. A wide range of models that deal with systematic volatility have been developed since the seminal one proposed by Engle (1982). The principles underlying the autoregressive conditional heteroscedasticity or ARCH model (Engle, 1982) and its generalised forms as the GARCH model (Bollerslev, 1986) posit that there are periods of relative high and low volatility, though the underlying unconditional remains unchanged. Evidence of ARCH and GARCH is widespread in series that are partly driven by speculative forces. However, these may also be present in the behaviour of agricultural prices. A positive transmission of volatility of prices is expected across commodities. Hence it becomes the wide used model in estimating the price volatility of agricultural commodities. Jordaan et al. (2004) determined the conditional volatility in the daily spot prices of the crops traded on the South African Futures Exchange (yellow maize, white maize, wheat, sunflower seed and soybeans). They quantified the true stochastic components in the prices of white maize, yellow maize, wheat, sunflower seed and soybeans as accurately as possible by eliminating some of the known components (such as the trend and seasonal effect) in the price process, and to compare the risk. The price of white maize was found to be the most volatile, followed by yellow maize, sunflower seed, soybeans, and wheat, respectively. These results suggest that the more risk averse farmers will more likely produce wheat, sunflower seed and to a lesser extent soybeans, while maize producers are expected to utilize forward pricing methods, especially
413
Testing the Efficiency of Indian Wheat Futures
put options, at a high level to manage the higher volatility. Guida and Matringe (2004) applied different generalised autoregressive conditional heteroscedasticity (GARCH) models for forecasting the volatility of agricultural commodities in U.S. futures market. They found that agricultural commodities time series could not be used with the same methodology. Moreover, it was pointed out that no real ‘model leader’ was found in the sample of commodities.
The argument that futures markets are dominated by speculative middlemen rather than farmers questions the integrity of the futures trade. The benefits of futures trading have been limited due to the lack of awareness among farmers. It is true, that the direct participation of farmers on the futures platform has been limited, in India as elsewhere. However the major benefit to farmers is price discovery, which is directly relatable to information dissemination and making the market transparent (Srikanth and Alagu Rani, 2010). The availability of futures price not only improves the bargaining power of farmers but also gives him/her the choice to decide on the timing of sale. The gains that a typical Indian farmer used to reap from futures trading are those that arise as a spillover effect of futures trading and not from the participation of farmers in forward markets (Kumar and Velmurugan, 2010). But still the present market ecosystem doesn’t allow an Indian farmer to participate in futures trading. In this context, the present study aims to find the relevance of futures trading to Indian farmers.
DATAAmong commodity exchanges operating in India, National Commodity Derivatives Exchange (NCDEX), Mumbai which holds a major share (47%) in agricultural commodity trading is purposively selected. The present study is based on the secondary data published by the NCDEX. Monthly data on quantity traded and its value, daily prices of wheat futures and spot (contract wise) are collected from the NCDEX portal for 2009-10 (period representing the historic food inflation in India) and for whole period (right from commencement date of futures trading till December, 2010). Spot prices are collected from Delhi market, the specialised market for wheat trade. Data on marketed surplus ratio and productivity are collected from the recent publications of Directorate of Economics and Statistics, Ministry of Agriculture, India. However, the present study has its own limitations. It is restricted to a specific commodity, geographical location and period. Hence the results may not be applicable to all commodities, regions and time. Several other economic factors influence the results of the study.
414
International Journal of Economics and Management
METHODOLOGY AND FINDINGS
Growth and Instability in Wheat FuturesThe following functional form is used to estimate the growth in trade quantity and value: Yt = Y0 (1+r)t. Transforming this to logarithmic form, ln Yt = ln Y0 + t ln (1+r)where, Yt is the variable at time ‘t’ for which growth is calculated and r is the compound growth rate. The above equation is estimated by Ordinary Least Square (OLS) method.
Instability in quantity and value of trade is estimated to examine the extent of risk involved in futures trading using the coefficient of variation for series having no trend and Cuddy-Della Valle instability index for the series exhibiting time trend. The Cuddy-Della Valle Index (Cuddy and Della Valle, 1978) is computed as, I CV R1 2
#= -^ h where, I is the instability index (%), CV is the coefficient of variation (%), and R 2 is the coefficient of determination from a time trend regression.
Futures trading achieved a phenomenal growth in terms of number of products offered, participants, spatial distribution and volume of trade since the establishment of the organised commodity exchanges. National Multi Commodity Exchange (NMCE) was the first exchange to be granted permanent recognition by the government, where futures trading started from 26th November, 2002 in 24 commodities. Then, Multi Commodity Exchange of India (MCX), National Commodity and Derivatives Exchange Limited (NCDEX), Indian Commodity Exchange (ICEX) and Ace Commodity Exchange (ACE) commenced their operations, respectively, from November 2003, December 2003, November 2009 and October 2010.
Apart from these, there are about 16 recognised regional futures exchanges in India with more than 3000 registered members. Trading platforms can be accessed through 20000 terminals spread over 800 towns/cities across the country. Forward Markets Commission (FMC) under the Ministry of Consumer Affairs is the chief regulator of futures trading in India. About 40 agricultural commodities are permitted for trading by the FMC across different exchanges in the country during 2012.
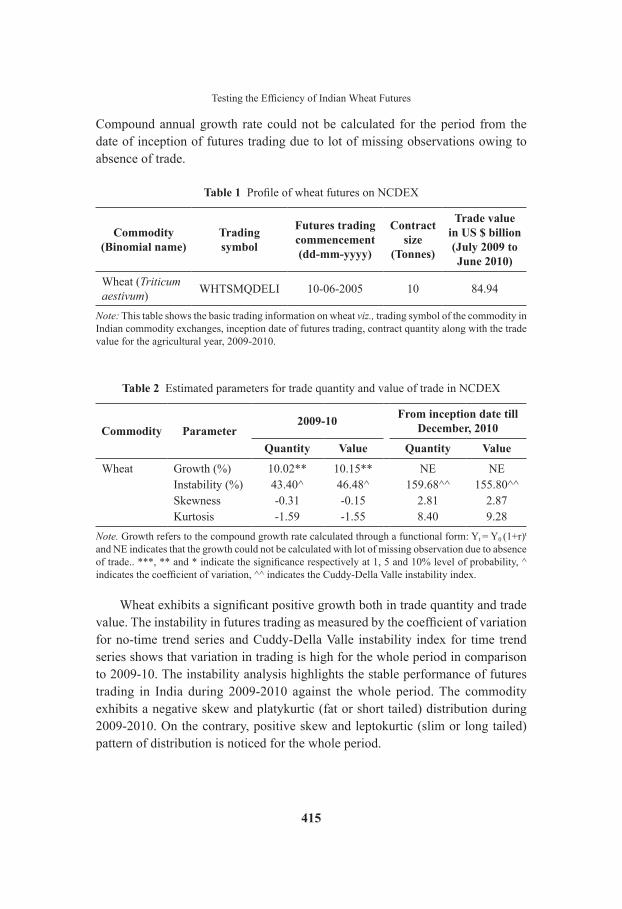
Table 1 furnishes the basic information of wheat futures in India. Trading commenced in the mid-2005 with a contract size of 10 tonnes set by the market regulator. The turnover of wheat is worked out at US $ 84.94 billion for 2009-2010. Table 2 furnishes the estimated growth, instability, skewness and kurtosis for trade quantity and trade value during 2009-2010 and from the date of inception.
415
Testing the Efficiency of Indian Wheat Futures
Compound annual growth rate could not be calculated for the period from the date of inception of futures trading due to lot of missing observations owing to absence of trade.
Table 1 Profile of wheat futures on NCDEX
Commodity (Binomial name)
Trading symbol
Futures trading commencement (dd-mm-yyyy)
Contract size
(Tonnes)
Trade value in US $ billion (July 2009 to June 2010)
Wheat (Triticum aestivum) WHTSMQDELI 10-06-2005 10 84.94
Note: This table shows the basic trading information on wheat viz., trading symbol of the commodity in Indian commodity exchanges, inception date of futures trading, contract quantity along with the trade value for the agricultural year, 2009-2010.
Table 2 Estimated parameters for trade quantity and value of trade in NCDEX
Commodity Parameter2009-10 From inception date till
December, 2010
Quantity Value Quantity Value
Wheat Growth (%) 10.02** 10.15** NE NEInstability (%) 43.40^ 46.48^ 159.68^^ 155.80^^Skewness -0.31 -0.15 2.81 2.87Kurtosis -1.59 -1.55 8.40 9.28
Note. Growth refers to the compound growth rate calculated through a functional form: Yt = Y0 (1+r)t and NE indicates that the growth could not be calculated with lot of missing observation due to absence of trade.. ***, ** and * indicate the significance respectively at 1, 5 and 10% level of probability, ^ indicates the coefficient of variation, ^^ indicates the Cuddy-Della Valle instability index.
Wheat exhibits a significant positive growth both in trade quantity and trade value. The instability in futures trading as measured by the coefficient of variation for no-time trend series and Cuddy-Della Valle instability index for time trend series shows that variation in trading is high for the whole period in comparison to 2009-10. The instability analysis highlights the stable performance of futures trading in India during 2009-2010 against the whole period. The commodity exhibits a negative skew and platykurtic (fat or short tailed) distribution during 2009-2010. On the contrary, positive skew and leptokurtic (slim or long tailed) pattern of distribution is noticed for the whole period.

416
International Journal of Economics and Management
Efficiency in Terms of Market Integration Economic theory often states that certain pair of economic variables possesses long run equilibrium relationship, if then, the pair is cointegrated. Although these variables may drift away from equilibrium for a while, economic forces act on them and tend to restore its equilibrium. In case of wheat futures too, there is a likelihood of market integration and price transmission between futures market and spot market, if the markets are efficient. Several studies have suggested a number of cointegration methodologies including Engle and Granger (1987) and Johansen (1988). In the present study, the most popular Johansen’s cointegration test is used to explore the cointegration possibility of futures prices with that of spot market prices.
Unit Root Testing: Before testing for cointegration, the time series is checked for its stationarity. The stationarity properties and the exhibition of unit roots in the time series are substantiated by performing the Augmented Dickey-Fuller (ADF) test (Dickey and Fuller, 1979). This test is conducted on the variables in original price series (ADF regression including the intercept and trend) and first differences (ADF regression with only intercept as trend will be removed while differencing). The variables that are integrated of the same order may be cointegrated, while the unit root test finds out which variables are integrated of same order, for example; if integrated by order one then it is denoted as I(1). The following ADF regression equation is used for testing the stationarity,
Y t Y Y ut t i t i ti
m
1 2 11
T Tb b d a= + + + +- -=
/
where, Yt is a vector to be tested for cointegration, t is the time or trend variable, YtT is the first order difference i.e., Y Yt t 1- -^ h and ut is a pure white noise error
term. The null hypothesis that, δ = 0; signifying unit root, states that the time series is non-stationary while, the alternative hypothesis, δ < 0 signifies that the time series is stationary, thereby rejecting the null hypothesis.
Johansen’s Maximum Likelihood Method of Cointegration: The cointegrated
equation system is represented as, Y Y Yt i t i t k ti
k
1
1
T T ab fC= + +- -=
-
l/ where, Yt is the
price time series, D is the first difference operator Y Yt t 1- -^ hand matrix ab= l% is (n × n) with rank 0r r n# #= ^ h, which is the number of linear independent cointegration relations in the vector space of matrix. The Johansen’s method of cointegrated system is a restricted maximum likelihood method with rank restriction

417
Testing the Efficiency of Indian Wheat Futures
on matrix ab= l% . The rank of % can be determined by using ltrace or lmax test statistics. The trace statistics ltrace, is given by
,lnT 1trace ii r
n
1
m m=- -= +
ta k/ for r = 0, 1,…, n–1
where, imt ’s are the Eigen values representing the strength of the correlation between
the first difference part and the error-correction part. Now the following hypotheses are tested, H0: rank of r=% (null hypothesis), and H1: rank of H r2% (alternate hypothesis), where ‘r’ is the number of cointegration equations. The above test is carried out with the assumption of linear deterministic trend in original data and only intercept in the cointegrating equation. The cointegrating equation has only intercept (no trend) owing to differencing the price series while checking for its stationarity, whereas; the original price series follows a trend since the mean and variance are non-constant over a period of time (non-stationary).
Cointegration test resultsBefore testing for cointegration between futures and spot prices, it becomes mandatory to check the order of integration of the level variables. Therefore, unit root testing is done for each series at their levels as well as first differences for each contract after converting the original price series to natural logarithms. Futures contracts are the standardised and pre-determined contracts framed by the market regulator and opened for trade for a delivery date in the future. Wheat, a Rabi crop is sown during October to December and harvested during March to May (Table 3).
Table 3 Wheat crop calendar
Crop Jan Feb Mar Apr May Jun Jul Aug Sep Oct Nov Dec
Wheat Harvest Sowing
Note. This table shows the sowing and harvesting period for wheat in India. Unlike other major wheat growing countries where the crop is grown as a winter wheat, in India it is grown as a spring wheat (rabi season).
The contracts (closing date normally coincides with the harvest months) announced by the NCDEX that falls within 2009-10 are considered for testing the efficiency due to the issue of peak food inflation during mid-2009.
The results of the estimated ADF statistic indicates the presence of unit root at their levels i.e., non-stationarity of both futures and spot price time series (Table 4). However, all the non-stationary variables are found to be stationary at their

418
International Journal of Economics and Management
first differences, and therefore, are integrated of order one, I(1). This conformation allows for the Johansen’s cointegration test.
Table 4 Unit root testing
Contract periodFutures market price Spot market (Delhi)
price Order of integration
Level 1st difference Level 1st difference
10.09.09 to 20.01.10 -1.69 -10.07* -1.91 -9.52* I (1)10.09.09 to 19.02.10 -1.95 -11.01* -2.23 -10.52* I (1)10.09.09 to 19.03.10 -1.62 -12.12* -1.81 -10.86* I (1)10.10.09 to 20.04.10 -0.65 -12.11* 0.13 -9.01* I (1)10.11.09 to 20.05.10 -1.27 -12.82* -0.70 -8.98* I (1)10.12.09 to 18.06.10 -1.20 -12.82* -1.49 -8.98* I (1)
Note. This table shows the results of the augmented Dickey-Fuller (ADF) test applied for testing the stationarity of the original (level) and first differenced price series for different wheat futures contract made during 2009-10.
The following ADF regression equation is tested for stationarity, Y t Y Y ut t i t i ti
m
1 2 11
T Tb b d a= + + + +- -=
/
where, Yt is a vector to be tested for cointegration, t is the time or trend variable, YtT is the first order difference i.e., Y Yt t 1- -^ h and ut is a pure white noise error term. The * indicates the significance at 1% level of MacKinnon (1996) one-sided p-values.
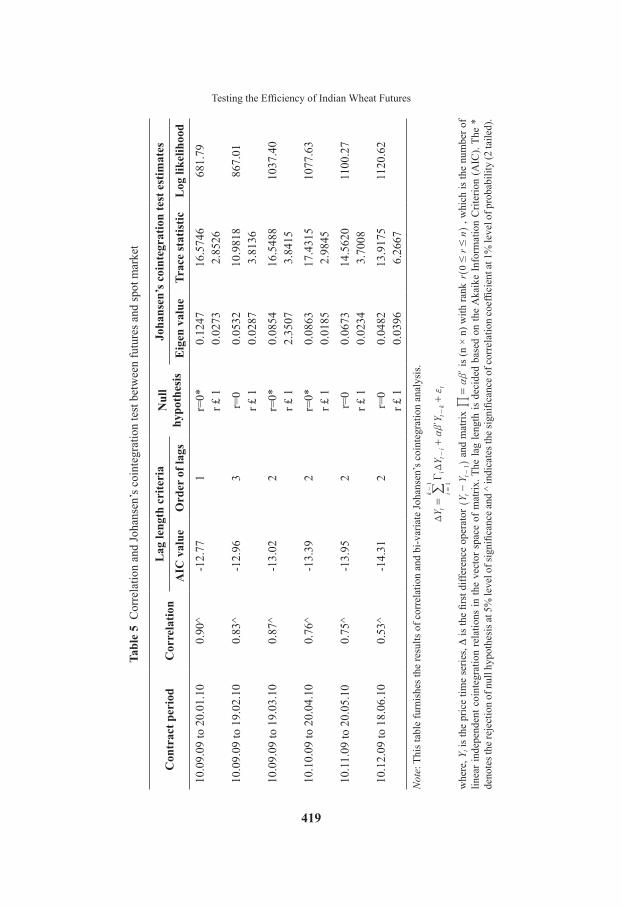
The estimates of the cointegration analysis are presented in Table 5 along with the coefficient of correlation between futures market and spot market. Correlation analysis reveals a significant positive co-movement between the futures and spot price series, apriori. The cointegration test brings out the Eigen value and the trace statistic for each set of variables. The test rejects the null hypothesis of no cointegration relationship between the futures and spot market (r=0) at 5% level of probability which indicates the presence of one or more cointegration equation between the two markets.
From the table it is clear that one cointegration relationship exist between the futures and spot market prices in three contracts out of six. The purpose of this analysis is to know whether the futures and spot market are integrated, and thereby price transmission (information flow) takes place helping in the process of price discovery. Overall, the above analysis highlights the equal share of efficiency and inefficiency in wheat futures.
419
Testing the Efficiency of Indian Wheat Futures
Tabl
e 5
Cor
rela
tion
and
Joha
nsen
’s c
oint
egra
tion
test
bet
wee
n fu
ture
s and
spot
mar
ket
Con
trac
t per
iod
Cor
rela
tion
Lag
leng
th c
rite
ria
Nul
l hy
poth
esis
Joha
nsen
’s c
oint
egra
tion
test
est
imat
es
AIC
val
ueO
rder
of l
ags
Eig
en v
alue
Trac
e st
atis
ticL
og li
kelih
ood
10.0
9.09
to 2
0.01
.10
0.90
^-1
2.77
1r=
0*0.
1247
16.5
746
681.
79r £
10.
0273
2.85
26
10.0
9.09
to 1
9.02
.10
0.83
^-1
2.96
3r=
00.
0532
10.9
818
867.
01r £
10.
0287
3.81
36
10.0
9.09
to 1
9.03
.10
0.87
^-1
3.02
2r=
0*0.
0854
16.5
488
1037
.40
r £ 1
2.35
073.
8415
10.1
0.09
to 2
0.04
.10
0.76
^-1
3.39
2r=
0*0.
0863
17.4
315
1077
.63
r £ 1
0.01
852.
9845
10.1
1.09
to 2
0.05
.10
0.75
^-1
3.95
2r=
00.
0673
14.5
620
1100
.27
r £ 1
0.02
343.
7008
10.1
2.09
to 1
8.06
.10
0.53
^-1
4.31
2r=
00.
0482
13.9
175
1120
.62
r £ 1
0.03
966.
2667
Not
e: T
his t
able
furn
ishe
s the
resu
lts o
f cor
rela
tion
and
bi-v
aria
te Jo
hans
en’s
coi
nteg
ratio
n an
alys
is.
YY
Yt
it
it
kt
ik
11
TT
ab
fC
=+
+-
-=-
l/
whe
re, Y
t is
the
pric
e tim
e se
ries, D
is th
e fir
st d
iffer
ence
ope
rato
r Y
Yt
t1
--
^h
and
mat
rix
ab
=l
% is
(n ×
n) w
ith ra
nk r
rn
0#
#^
h , w
hich
is th
e nu
mbe
r of
linea
r ind
epen
dent
coi
nteg
ratio
n re
latio
ns in
the
vect
or s
pace
of m
atrix
. The
lag
leng
th is
dec
ided
bas
ed o
n th
e A
kaik
e In
form
atio
n C
riter
ion
(AIC
). Th
e *
deno
tes t
he re
ject
ion
of n
ull h
ypot
hesi
s at 5
% le
vel o
f sig
nific
ance
and ̂
indi
cate
s the
sign
ifica
nce o
f cor
rela
tion
coef
ficie
nt at
1%
leve
l of p
roba
bilit
y (2
taile
d).

420
International Journal of Economics and Management
Efficiency in terms of Price Discovery ProcessAfter testing for cointegration between futures and spot market, the residuals shows the deviation from equilibrium and this equilibrium error in the long run tends to zero. Vector error correction model (VECM) can be used to capture the deviations from the long run equilibrium (Brosig et al., 2011). In the case of VECM, a linear deterministic trend model is run only for the cointegrated price series across wheat contracts specifying the number of cointegration equations between the spot and futures market. The model is represented as,
S f ut t t t0 1 2 1T Ta a a f= + + +-
where, St is the spot price, ft is the futures price and ut is the cointegration vector.The coefficient (α2) of the error correction term (ut-1) indicates the speed at
which the series returns to equilibrium. If it is less than zero, the series converge to long run equilibrium and if it is positive and zero, the series diverges from equilibrium. If the estimated error correction coefficient in futures prices is negative (positive), it indicates that decrease (increase) in the previous period’s equilibrium error leads to a decrease (increase) in the current period spot price. Similarly, if the spot price coefficient is positive (negative), it implies that increase (decrease) in previous period equilibrium error leads to an increase (decrease) in current period spot price. Both the error correction coefficient suggests that sustainable long run equilibrium is achieved by bridging the gap between futures and spot prices. In efficient market, spot price rise to meet the futures price while futures price revert to spot price, and vice versa.
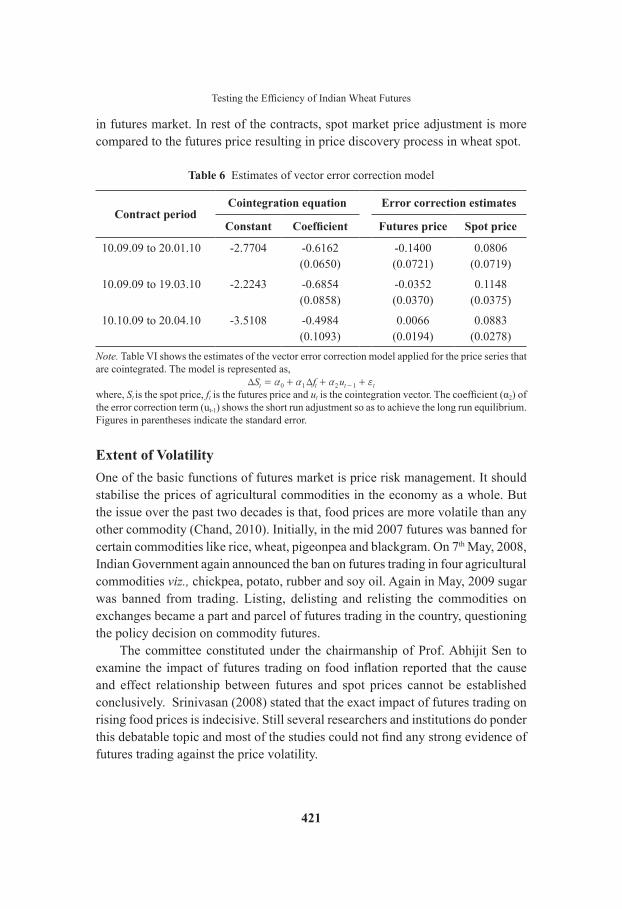
Effect of error correction mechanismJohansen’s test reveals the long run equilibrium between spot and futures prices for three contracts of wheat, justifying the use of a vector error correction model (VECM) for showing the short run dynamics. The results of the VECM indicate that most of the estimated coefficients turn positive for both futures and spot market (Table 6). The vector error correction coefficient is estimated at -0.14 for futures price and 0.08 for spot price (contract ending January, 2010). This indicates that how quickly the dependent variables such as spot and futures prices absorb and adjust themselves for previous period disequilibrium errors. In other words, the coefficient measures the ability of the prices to incorporate shocks or news in the prices. In this case, futures and spot market absorb 14% and 8% respectively to bring about the equilibrium in prices. The information flow is more in futures market as evident by the magnitude of the coefficient (-0.14). Hence price discovery occurs
421
Testing the Efficiency of Indian Wheat Futures
in futures market. In rest of the contracts, spot market price adjustment is more compared to the futures price resulting in price discovery process in wheat spot.
Table 6 Estimates of vector error correction model
Contract periodCointegration equation Error correction estimates
Constant Coefficient Futures price Spot price
10.09.09 to 20.01.10 -2.7704 -0.6162 -0.1400 0.0806(0.0650) (0.0721) (0.0719)
10.09.09 to 19.03.10 -2.2243 -0.6854 -0.0352 0.1148(0.0858) (0.0370) (0.0375)
10.10.09 to 20.04.10 -3.5108 -0.4984 0.0066 0.0883(0.1093) (0.0194) (0.0278)
Note. Table VI shows the estimates of the vector error correction model applied for the price series that are cointegrated. The model is represented as,
S f ut t t t0 1 2 1T Ta a a f= + + +-
where, St is the spot price, ft is the futures price and ut is the cointegration vector. The coefficient (α2) of the error correction term (ut-1) shows the short run adjustment so as to achieve the long run equilibrium. Figures in parentheses indicate the standard error.
Extent of Volatility One of the basic functions of futures market is price risk management. It should stabilise the prices of agricultural commodities in the economy as a whole. But the issue over the past two decades is that, food prices are more volatile than any other commodity (Chand, 2010). Initially, in the mid 2007 futures was banned for certain commodities like rice, wheat, pigeonpea and blackgram. On 7th May, 2008, Indian Government again announced the ban on futures trading in four agricultural commodities viz., chickpea, potato, rubber and soy oil. Again in May, 2009 sugar was banned from trading. Listing, delisting and relisting the commodities on exchanges became a part and parcel of futures trading in the country, questioning the policy decision on commodity futures.
The committee constituted under the chairmanship of Prof. Abhijit Sen to examine the impact of futures trading on food inflation reported that the cause and effect relationship between futures and spot prices cannot be established conclusively. Srinivasan (2008) stated that the exact impact of futures trading on rising food prices is indecisive. Still several researchers and institutions do ponder this debatable topic and most of the studies could not find any strong evidence of futures trading against the price volatility.
422
International Journal of Economics and Management
Volatility in agricultural commodity prices originates mainly from the supply shocks. These disturbances coupled with short run demand and supply elasticity coefficients give rise to acute price fluctuations. Usually, commodity markets exhibit volatile prices based on the flow of market information, hedging and speculation, and physical transaction of commodities. These features can justify the use of informational based process to model the pattern of volatility. In this context, the widely used Generalised Autoregressive Conditional Heteroscedasticity (GARCH) model is used to measure the extent of volatility in wheat spot prices due to futures trading. This approach distinguishes not only between predictable and unpredictable components of prices but also allows the variance of unpredictable element to be time varying (Bollerslev, 1986). Auto Regressive Integrated Moving Average (ARIMA) filtration analysis is first done to identify the best fit ARCH term and then proceeded with fitting the best order GARCH model. The common GARCH (1,1) model is described below.
Y a b Y b Yit it it it0 1 1 2 2 f= + + +- - (1)
where, Yit is the spot price in tth period of ith commodity and t=1, 2, 3…n
, , ,i t i i t i i t2 2
12
v ~ a f b v= + + - (2)
The mean equation given in (1) is written as a function of exogenous variables with an error term. Since t
2v is the one period ahead forecast variance based on past
information, it is called the conditional variance. The conditional variance equation specified in equation (2) is a function of three terms viz., the mean (ω), news about volatility from the previous period measured as the lag of the squared residual from the mean equation ( t 1
2f - , the ARCH term) and the last period’s forecast variance
( t 12v - , the GARCH term). The (1,1) in GARCH (1,1) refers to the presence of first
order GARCH (the first term in parenthesis) and first order ARCH (the second term in parenthesis). The sum of αi and βi gives the degree of persistence of volatility in the price series. Closer the sum to one, greater is the tendency of volatility to persist for long time. If the sum exceeds one, it indicates an explosive series with a tendency to meander away from mean value.
An ordinary ARCH model is a special case of a GARCH specification in which there are no lagged forecast variances in the conditional variance equation. Higher order GARCH models, denoted as GARCH (p, q), are estimated by choosing either p or q, or both greater than one. The representation of the GARCH (p, q) is given as,
,i t i t ii
p
i t ii
q2 2
1
2
1
v ~ b v a f= +-=
-=
/ /
423
Testing the Efficiency of Indian Wheat Futures
where, p is the order of the GARCH and q is the order of the ARCH. After fitting the model, it is tested for ARCH-LM to identify whether the fitted model has any further ARCH effect. ARCH-LM is the test for identifying the presence of serial correlation in the residuals. The best fit model with no further ARCH effects is presented in the following section and discussed further.
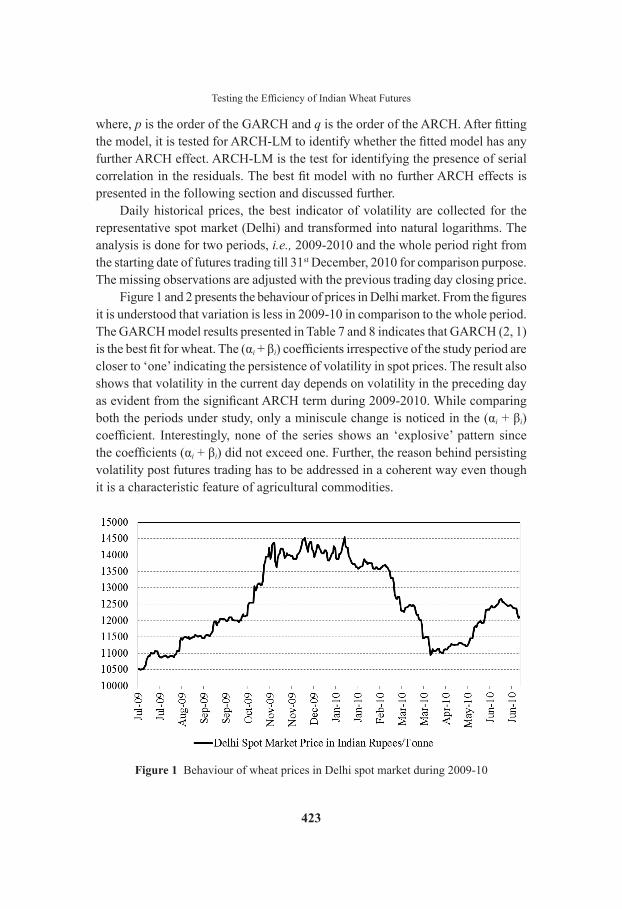
Daily historical prices, the best indicator of volatility are collected for the representative spot market (Delhi) and transformed into natural logarithms. The analysis is done for two periods, i.e., 2009-2010 and the whole period right from the starting date of futures trading till 31st December, 2010 for comparison purpose. The missing observations are adjusted with the previous trading day closing price.
Figure 1 and 2 presents the behaviour of prices in Delhi market. From the figures it is understood that variation is less in 2009-10 in comparison to the whole period. The GARCH model results presented in Table 7 and 8 indicates that GARCH (2, 1) is the best fit for wheat. The (αi + βi) coefficients irrespective of the study period are closer to ‘one’ indicating the persistence of volatility in spot prices. The result also shows that volatility in the current day depends on volatility in the preceding day as evident from the significant ARCH term during 2009-2010. While comparing both the periods under study, only a miniscule change is noticed in the (αi + βi) coefficient. Interestingly, none of the series shows an ‘explosive’ pattern since the coefficients (αi + βi) did not exceed one. Further, the reason behind persisting volatility post futures trading has to be addressed in a coherent way even though it is a characteristic feature of agricultural commodities.
Figure 1 Behaviour of wheat prices in Delhi spot market during 2009-10

424
International Journal of Economics and Management
Figure 2 Behaviour of wheat prices in Delhi spot market from start of futures trading
Table 7 Extent of volatility during 2009-2010
Particulars Wheat spot (Delhi)
Observations (days) 365Standard deviation 117.55Skewness 0.17Kurtosis 1.63C.V (%) 9.41GARCH estimatesConstant 6.95E-06*
(5.83)(1) Estimate of the ARCH term (αi)
t 12f -
0.3293*(5.56)
(2) Estimates of the GARCH term (βi)
t 12v -
0.2271*(3.10)
t 22v -
0.4029*(4.86)
Log likelihood 1271.57GARCH fit 2, 1ARCH-LM test (Durbin-Watson test statistic) 2.0038αi + βi 1.00Volatility Persist
Note. Figures in parenthesis indicate the calculated z statistic and * indicate the significance at 1% level of probability.
425
Testing the Efficiency of Indian Wheat Futures
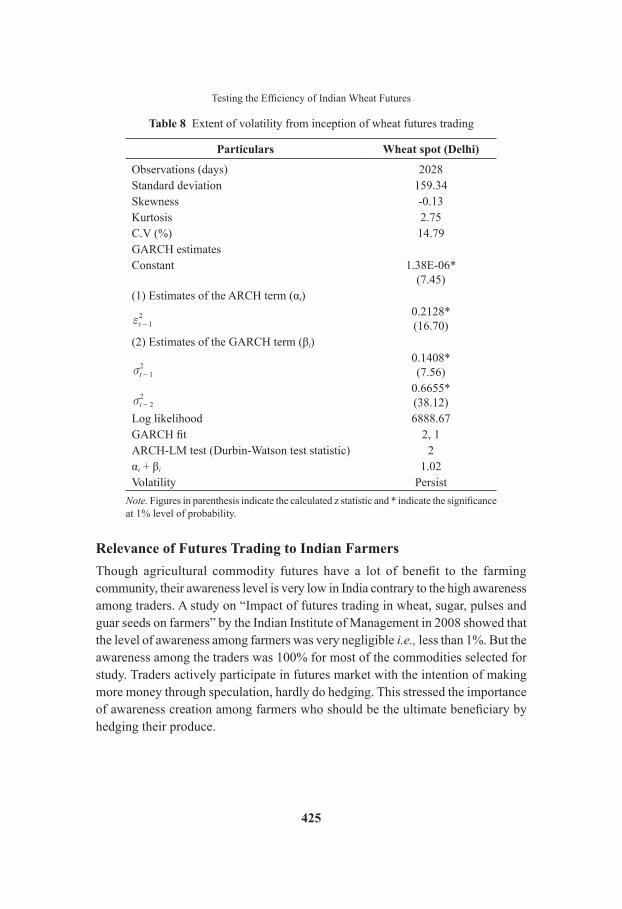
Table 8 Extent of volatility from inception of wheat futures trading
Particulars Wheat spot (Delhi)
Observations (days) 2028Standard deviation 159.34Skewness -0.13Kurtosis 2.75C.V (%) 14.79GARCH estimatesConstant 1.38E-06*
(7.45)(1) Estimates of the ARCH term (αi)
t 12f -
0.2128*(16.70)
(2) Estimates of the GARCH term (βi)
t 12v -
0.1408*(7.56)
t 22v -
0.6655*(38.12)
Log likelihood 6888.67GARCH fit 2, 1ARCH-LM test (Durbin-Watson test statistic) 2αi + βi 1.02Volatility Persist
Note. Figures in parenthesis indicate the calculated z statistic and * indicate the significance at 1% level of probability.
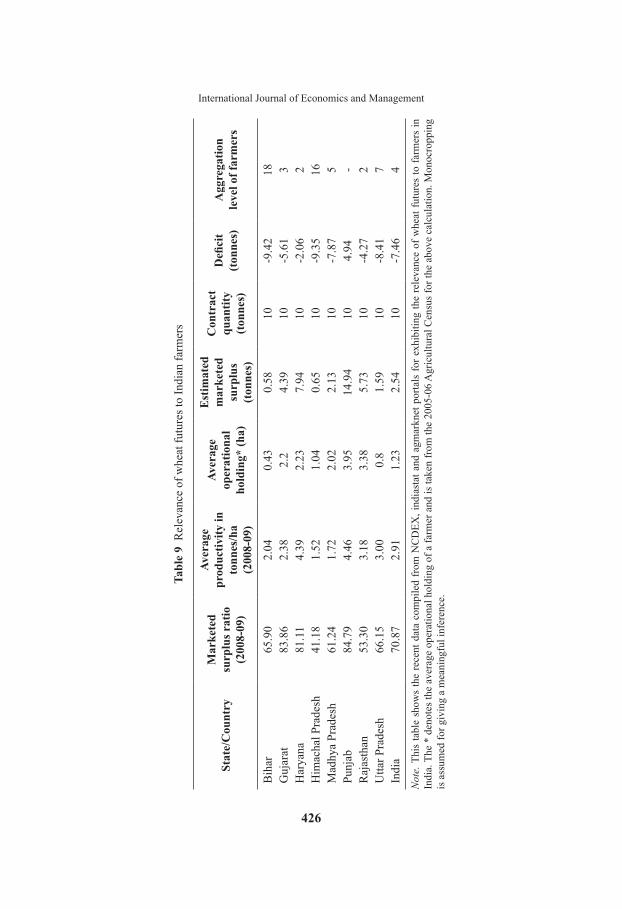
Relevance of Futures Trading to Indian FarmersThough agricultural commodity futures have a lot of benefit to the farming community, their awareness level is very low in India contrary to the high awareness among traders. A study on “Impact of futures trading in wheat, sugar, pulses and guar seeds on farmers” by the Indian Institute of Management in 2008 showed that the level of awareness among farmers was very negligible i.e., less than 1%. But the awareness among the traders was 100% for most of the commodities selected for study. Traders actively participate in futures market with the intention of making more money through speculation, hardly do hedging. This stressed the importance of awareness creation among farmers who should be the ultimate beneficiary by hedging their produce.
426
International Journal of Economics and Management
Tabl
e 9
Rel
evan
ce o
f whe
at fu
ture
s to
Indi
an fa
rmer
s
Stat
e/C
ount
ryM
arke
ted
surp
lus r
atio
(2
008-
09)
Aver
age
prod
uctiv
ity in
to
nnes
/ha
(2
008-
09)
Aver
age
oper
atio
nal
hold
ing*
(ha)
Est
imat
ed
mar
kete
d su
rplu
s (t
onne
s)
Con
trac
t qu
antit
y (t
onne
s)
Defi
cit
(ton
nes)
Agg
rega
tion
le
vel o
f far
mer
s
Bih
ar65
.90
2.04
0.43
0.58
10-9
.42
18G
ujar
at83
.86
2.38
2.2
4.39
10-5
.61
3H
arya
na81
.11
4.39
2.23
7.94
10-2
.06
2H
imac
hal P
rade
sh41
.18
1.52
1.04
0.65
10-9
.35
16M
adhy
a Pr
ades
h61
.24
1.72
2.02
2.13
10-7
.87
5Pu
njab
84.7
94.
463.
9514
.94
104.
94-
Raj
asth
an53
.30
3.18
3.38
5.73
10-4
.27
2U
ttar P
rade
sh66
.15
3.00
0.8
1.59
10-8
.41
7In
dia
70.8
72.
911.
232.
5410
-7.4
64
Not
e. T
his
tabl
e sh
ows
the
rece
nt d
ata
com
pile
d fr
om N
CD
EX, i
ndia
stat
and
agm
arkn
et p
orta
ls fo
r exh
ibiti
ng th
e re
leva
nce
of w
heat
futu
res
to fa
rmer
s in
In
dia.
The
* d
enot
es th
e av
erag
e op
erat
iona
l hol
ding
of a
farm
er a
nd is
take
n fr
om th
e 20
05-0
6 A
gric
ultu
ral C
ensu
s for
the
abov
e ca
lcul
atio
n. M
onoc
ropp
ing
is a
ssum
ed fo
r giv
ing
a m
eani
ngfu
l inf
eren
ce.

427
Testing the Efficiency of Indian Wheat Futures
The present system of futures trading in India has its own limitations. Commodity exchanges do not maintain data regarding the participation of farmers, the contract size is also much higher than the marketed surplus and the actual physical delivery after the contract ending period is very low. Velmurugan et al., (2010) reported that conceptual difficulties due to high illiteracy rate prevailing among farmers, cumbersome trading procedures, huge contract size which is much higher than the marketed surplus and high market margin were the constraints faced by the farmers.
It is evident from Table 9 that baring Punjab state in India with an estimated marketed surplus of 14.94 tonnes (average productivity x average operational holdings x marketed surplus ratio), rest of the state’s average marketed surplus is much less than the contract quantity. On the whole, deficit is more in Bihar (9.42 tonnes) followed by Himachal Pradesh (9.35 tonnes) and Uttar Pradesh (8.41 tonnes).
This analysis highlights the need for the market regulator to adopt some strategies like reducing the contract size or to appoint some agencies that serve as an aggregator to collect the farmer’s produce and pool them for ensuring the participation of farmers in futures market. The table also furnishes the level of aggregation i.e., the number of farmers whose produce should be aggregated to meet out the contact size set by the FMC. The number of aggregators ranges from 2 farmers (Haryana and Rajasthan) to as high as 18 farmers (Bihar).
CONCLUSIONCointegration analysis to test the futures efficiency reveals the co-movement and long run equilibrium between futures and spot prices for 3 contracts. Many implications can be drawn from this result. Market integration is a result of price transmission which occurs due to the flow of information owing to the development of information technology. The speed of price convergence depends on the market regulations and policy changes from time to time, and finally market integration itself is an indicator for efficient functioning. The relationship between futures and spot market price in terms of price discovery reveal that spot market prices adjusts faster and dominates in the process of price discovery. The extent of volatility in spot prices due to futures trading as measured by the coefficients of GARCH model indicates the persistence of volatility. Even though it is of not an explosive type, the reason behind the volatile prices has to be explained in a coherent way. On whole, all the above analyses indicate the inefficient performance of futures trading in wheat. The study wish that Indian farmers should come forward to hedge their produce by understanding and participating in futures trading, market regulator

428
International Journal of Economics and Management
role has to reduce the futures contract size owing to the small scale production system prevailing in India and the need for some institutional innovations like aggregator’s role to reap the benefits derived from futures trading. The benefit of hedging may attract large investments in the agriculture marketing sector in the forthcoming years. Further, the results of the present study will be useful for academicians, researchers and policy makers in addressing the food inflation issue and to increase the overall efficiency of the system.
ACKNOWLEDGEMENTThe authors are thankful to the referee for his constructive and valuable comments for improving the presentation of this paper.
REFERENCESBallabh, V., Prantik, R., and Singhania, V. (2010) Commodity Futures and Indian Farmers:
Myth or Reality, Chapter Edited in Indian Commodity Market (Derivatives and Risk Management), Serials Publications, New Delhi.
Bhardwaj, S.P and Vasisht, A.K. (2010) Price discovery in commodity markets - A Case Study of Gram, Chapter Edited in Indian Commodity Market (Derivatives and Risk Management), Serials Publications, New Delhi.
Bollerslev, T. (1986) Generalized Autoregressive Conditional Heteroscedasticity, Journal of Econometrics, 31, 307-327.
Brosig, S., Glauben, T., Gotz, L., Weitzel, E., and Bayaner, A. (2011) The Turkish Wheat Market: Spatial Price Transmission and the Impact of Transaction Costs, Agribusiness, 27(2), 147-161.
Chand, R. (2010) Understanding the Nature and Causes of Food Inflation, Economic and Political Weekly, 45(9), 10-13.
Cuddy, J. D. A., and Della Valle, P.A. (1978) Measuring the Instability of Time Series Data, Oxford Bulletin of Economics and Statistics, 40, no. 1, 79-85.
Dickey, D., and Fuller, W.A. (1979) Distribution of the Estimators for Autoregressive Time Series Regressions with Unit Roots, Journal of American Statistical Association, 74, 427-431.
Easwaran, S.R., and Ramasundaram, P. (2008) Whether the Commodity Futures in Agriculture are Efficient in Price Discovery? - An Econometric Analysis. Agricultural Economics Research Review, 21, 337-344.
Engle, R.F. (1982) Autoregressive Conditional Heteroscedasticity with estimates of the variance of United Kingdom Inflation, Econometrica, 50, no. 4, 987-1007.
Engle, R.F., and Granger, C.W.J. (1987) Cointegration and Error-Correction: Representation, Estimation and Testing, Econometrica, 55, 251-276.
429
Testing the Efficiency of Indian Wheat Futures
Forward Markets Commission. (2000) Ministry of Food and Consumer Affairs, Government of India: Forward Contracts (Regulation) Act.
Garbade, K.D., and Silber, W.L. (1982) Price Movements and Price Discovery in Future and Cash Markets, Review of Economics and Statistics, 65, 289-297.
Guida, T and Matringe, O. (2004) Application of GARCH Models in Forecasting the Volatility of Agricultural Commodities, UNCTAD Publications.
Johansen, S. (1988) Statistical Analysis of Cointegration Vectors, Journal of Economic Dynamics and Control, 12, 231-254.
Jordaan, H., Grove, B., Jooste, A andAlemu, Z.G. (2004) Measuring the Price Volatility of Certain Field Crops in South Africa using the ARCH/GARCH Approach, Agrekon, 46 no. 3.
Kumar, A.P and Velmurugan, P.S. (2010) Impact of Government Interventions on Growth and Development of Agricultural Commodity Futures, Chapter Edited in Indian commodity market (Derivatives and risk management), Serials Publications, New Delhi.
Kumar, P and Sharma, R.K. (2003) Spatial Price Integration and Price Efficiency at Farm Level: A Study of Paddy in Haryana, Indian Journal of Agricultural Economics, 58, no. 2, 201-217.
Lien, D and Tse, Y.K. (2000) Some Recent Development in Futures Hedging, Working Paper University of Texas at San Antonio.
Lien, D. (2012) A Note on Utility-based Futures Hedging Performance Measure, The Journal of Futures Markets, 32, no. 1, 92-98.
Mahalik, M.K., Acharya, D and Babu, M.S. (2009) Price Discovery and Volatility Spillovers in Futures and Spot Commodity Markets: Some Empirical Evidence from India, IGIDR Proceedings/Project Reports Series: 06-10.
Sahadevan, K.G. (2002) Risk Management in Agricultural Commodity Markets: A Study of some Selected Commodity Futures, Working Paper Series: 2002, Indian Institute of Management, Lucknow.
Sen, A. (2008) Report of the Expert Committee to Study the Impact of Futures Trading on Agricultural Commodity Prices. Ministry of Consumer Affairs, Government of India.
Singh, N.P., Kumar, R., Singh, R.P and Jain, P.K. (2005) Is Futures Market Mitigating Price Risk: An Exploration of Wheat and Maize Market, Agricultural Economics Research Review, 18, 35-46.
Srikanth, T and Alagu Rani, R. (2010) Performance of Commodity Futures in India: The Way Ahead, Chapter Edited in Indian commodity market (Derivatives and Risk Management), Serials Publications, New Delhi.
Srinivasan, S. (2008) Futures Trading in Agricultural Commodities - Is the Government Ban on Commodities Trading Logical?. Centre for Civil Society, Working Paper, 183.
Thomas, S and Karande, K. (2001) Price Discovery across Multiple Spot and Futures Markets, Working paper available at URL, http://www.igidr.ac.in/ (accessed October 5, 2011).
430
International Journal of Economics and Management
Tse, Y. (1999) Price Discovery and Volatility Spillovers in the DJIA Index and Futures Markets, Journal of Futures Markets, 29, 911-930.
UNCTAD (United Nations Conference on Trade and Development). (1997) Emerging Commodity Exchanges: From Potential to Success.
Vasisht, A.K and Bhardwaj, S.P. (2010) An Analysis of Volatility of Agricultural Prices – A Case Study of Maize, Chapter edited in Indian Commodity Market (Derivatives and Risk Management), Serials Publications, New Delhi.
Velmurugan, P.S., Palanichamy, P and Shanmugam, V. (2010) Indian Commodity Market (Derivatives and Risk Management), Serials Publications, New Delhi.
World Bank. (1997) Managing Price Risks in India’s Liberalized Agriculture: Can Futures Markets Help?. Allied Publishers Limited, New Delhi.
Zapata, H., Fortenbery, T.R and Armstrong, D. (2005) Price Discovery in the World Sugar Futures and Cash Markets: Implications for the Dominican Republic, Staff Working Paper No.469, Agricultural and Applied Economics.
Zhong, M., Darrat, A.F and Otero, R. (2004) Price Discovery and Volatility Spillovers in Index Futures Markets: Some Evidence from Mexico, Journal of Banking and Finance, 28, 3037-3054.