tetrad the galleria nielsen 2014 retail market power · tetrad the galleria nielsen 2014 retail...
TRANSCRIPT
PCensus for MapInfo Page 1
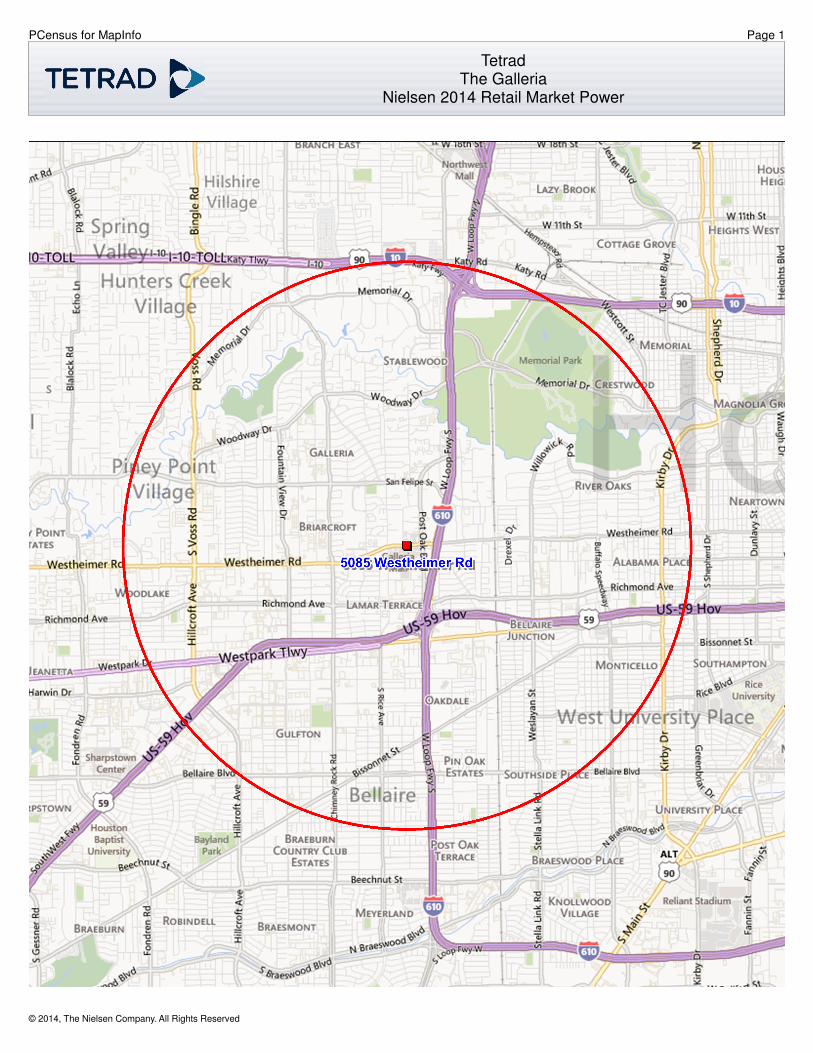
TetradThe Galleria
Nielsen 2014 Retail Market Power
© 2014, The Nielsen Company. All Rights Reserved
PCensus for MapInfo Page 2
TetradThe Galleria
Nielsen 2014 Retail Market Power
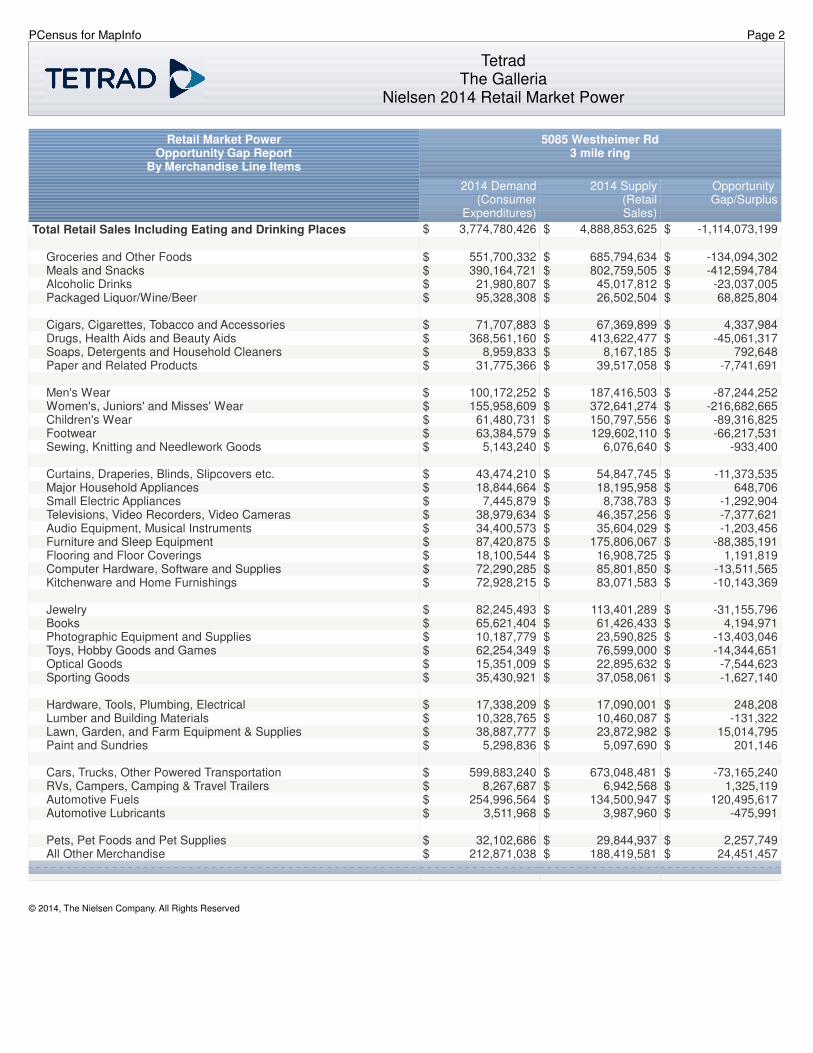
Retail Market PowerOpportunity Gap Report
By Merchandise Line Items
Total Retail Sales Including Eating and Drinking Places
Groceries and Other FoodsMeals and SnacksAlcoholic DrinksPackaged Liquor/Wine/Beer
Cigars, Cigarettes, Tobacco and AccessoriesDrugs, Health Aids and Beauty AidsSoaps, Detergents and Household CleanersPaper and Related Products
Men's WearWomen's, Juniors' and Misses' WearChildren's WearFootwearSewing, Knitting and Needlework Goods
Curtains, Draperies, Blinds, Slipcovers etc.Major Household AppliancesSmall Electric AppliancesTelevisions, Video Recorders, Video CamerasAudio Equipment, Musical InstrumentsFurniture and Sleep EquipmentFlooring and Floor CoveringsComputer Hardware, Software and SuppliesKitchenware and Home Furnishings
JewelryBooksPhotographic Equipment and SuppliesToys, Hobby Goods and GamesOptical GoodsSporting Goods
Hardware, Tools, Plumbing, ElectricalLumber and Building MaterialsLawn, Garden, and Farm Equipment & SuppliesPaint and Sundries
Cars, Trucks, Other Powered TransportationRVs, Campers, Camping & Travel TrailersAutomotive FuelsAutomotive Lubricants
Pets, Pet Foods and Pet SuppliesAll Other Merchandise
5085 Westheimer Rd3 mile ring
2014 Demand (Consumer
Expenditures)
2014 Supply (Retail Sales)
Opportunity Gap/Surplus
$ 3,774,780,426 $ 4,888,853,625 $ -1,114,073,199
$ 551,700,332 $ 685,794,634 $ -134,094,302$ 390,164,721 $ 802,759,505 $ -412,594,784$ 21,980,807 $ 45,017,812 $ -23,037,005$ 95,328,308 $ 26,502,504 $ 68,825,804
$ 71,707,883 $ 67,369,899 $ 4,337,984$ 368,561,160 $ 413,622,477 $ -45,061,317$ 8,959,833 $ 8,167,185 $ 792,648$ 31,775,366 $ 39,517,058 $ -7,741,691
$ 100,172,252 $ 187,416,503 $ -87,244,252$ 155,958,609 $ 372,641,274 $ -216,682,665$ 61,480,731 $ 150,797,556 $ -89,316,825$ 63,384,579 $ 129,602,110 $ -66,217,531$ 5,143,240 $ 6,076,640 $ -933,400
$ 43,474,210 $ 54,847,745 $ -11,373,535$ 18,844,664 $ 18,195,958 $ 648,706$ 7,445,879 $ 8,738,783 $ -1,292,904$ 38,979,634 $ 46,357,256 $ -7,377,621$ 34,400,573 $ 35,604,029 $ -1,203,456$ 87,420,875 $ 175,806,067 $ -88,385,191$ 18,100,544 $ 16,908,725 $ 1,191,819$ 72,290,285 $ 85,801,850 $ -13,511,565$ 72,928,215 $ 83,071,583 $ -10,143,369
$ 82,245,493 $ 113,401,289 $ -31,155,796$ 65,621,404 $ 61,426,433 $ 4,194,971$ 10,187,779 $ 23,590,825 $ -13,403,046$ 62,254,349 $ 76,599,000 $ -14,344,651$ 15,351,009 $ 22,895,632 $ -7,544,623$ 35,430,921 $ 37,058,061 $ -1,627,140
$ 17,338,209 $ 17,090,001 $ 248,208$ 10,328,765 $ 10,460,087 $ -131,322$ 38,887,777 $ 23,872,982 $ 15,014,795$ 5,298,836 $ 5,097,690 $ 201,146
$ 599,883,240 $ 673,048,481 $ -73,165,240$ 8,267,687 $ 6,942,568 $ 1,325,119$ 254,996,564 $ 134,500,947 $ 120,495,617$ 3,511,968 $ 3,987,960 $ -475,991
$ 32,102,686 $ 29,844,937 $ 2,257,749$ 212,871,038 $ 188,419,581 $ 24,451,457
© 2014, The Nielsen Company. All Rights Reserved
PCensus for MapInfo Page 3
TetradThe Galleria
Nielsen 2014 Retail Market Power
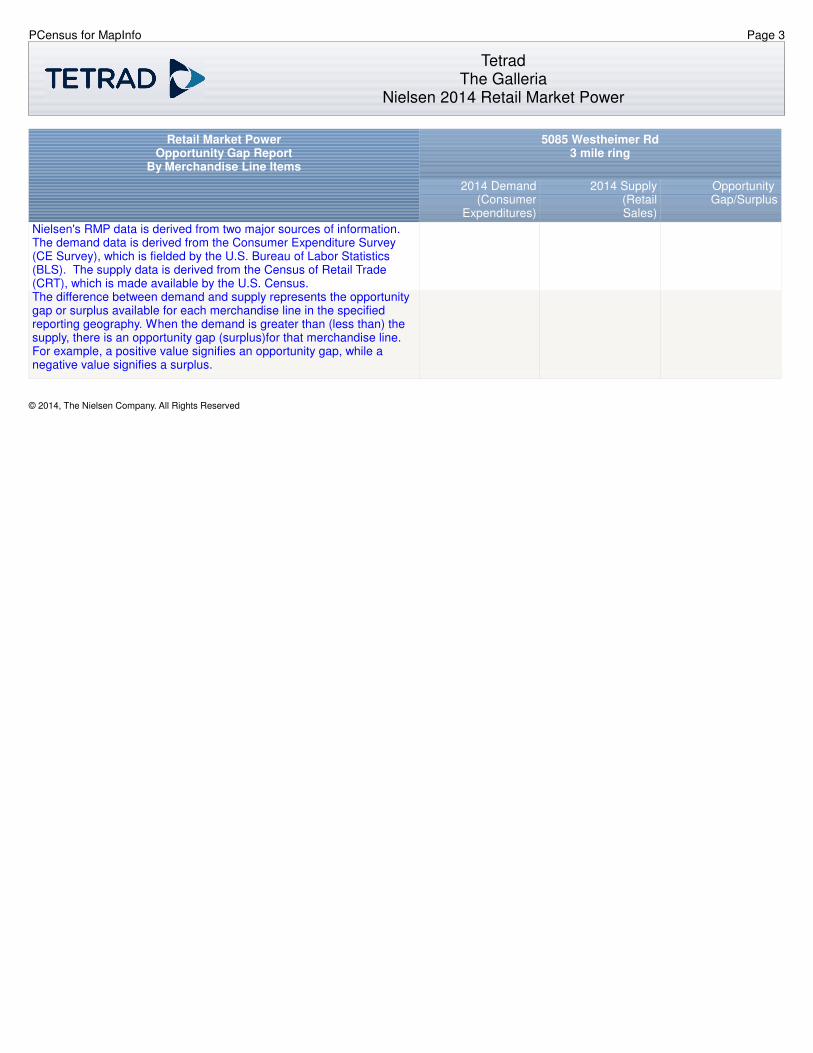
Retail Market PowerOpportunity Gap Report
By Merchandise Line Items
Nielsen's RMP data is derived from two major sources of information. The demand data is derived from the Consumer Expenditure Survey (CE Survey), which is fielded by the U.S. Bureau of Labor Statistics (BLS). The supply data is derived from the Census of Retail Trade (CRT), which is made available by the U.S. Census.The difference between demand and supply represents the opportunity gap or surplus available for each merchandise line in the specified reporting geography. When the demand is greater than (less than) the supply, there is an opportunity gap (surplus)for that merchandise line. For example, a positive value signifies an opportunity gap, while a negative value signifies a surplus.
5085 Westheimer Rd3 mile ring
2014 Demand (Consumer
Expenditures)
2014 Supply (Retail Sales)
Opportunity Gap/Surplus
© 2014, The Nielsen Company. All Rights Reserved
PCensus for MapInfo Page 4
TetradThe Galleria
Nielsen 2014 Retail Market Power
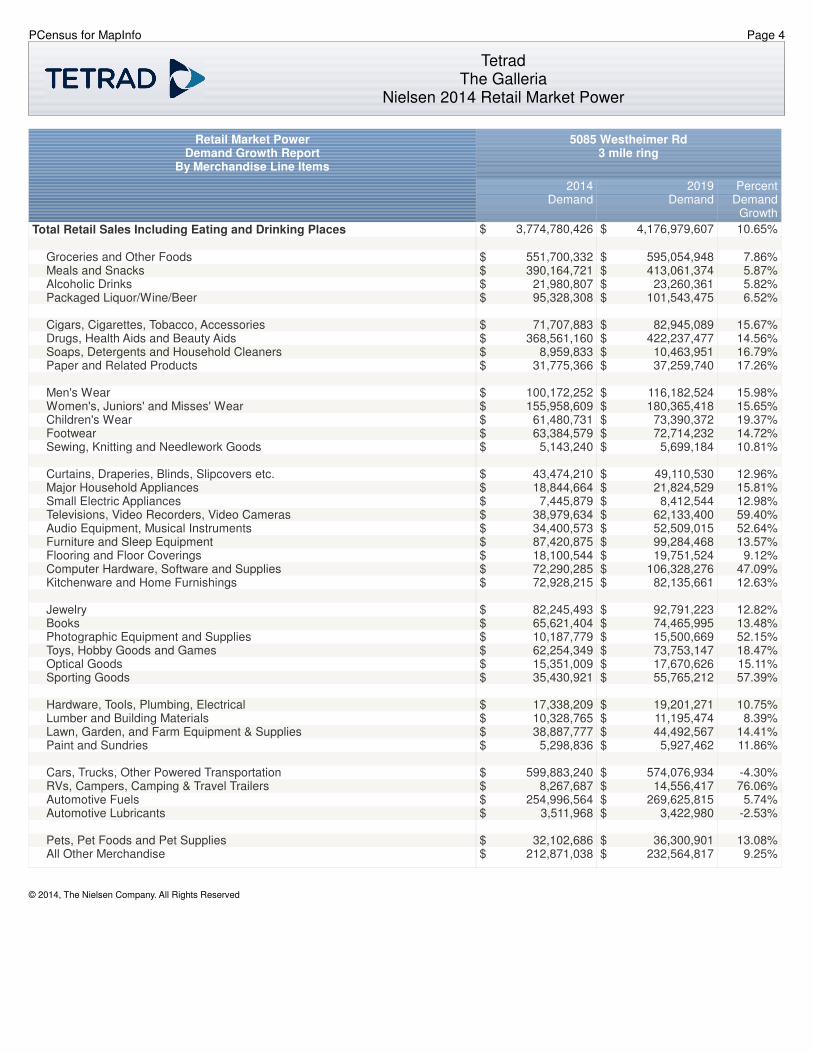
Retail Market PowerDemand Growth Report
By Merchandise Line Items
Total Retail Sales Including Eating and Drinking Places
Groceries and Other FoodsMeals and SnacksAlcoholic DrinksPackaged Liquor/Wine/Beer
Cigars, Cigarettes, Tobacco, AccessoriesDrugs, Health Aids and Beauty AidsSoaps, Detergents and Household CleanersPaper and Related Products
Men's WearWomen's, Juniors' and Misses' WearChildren's WearFootwearSewing, Knitting and Needlework Goods
Curtains, Draperies, Blinds, Slipcovers etc.Major Household AppliancesSmall Electric AppliancesTelevisions, Video Recorders, Video CamerasAudio Equipment, Musical InstrumentsFurniture and Sleep EquipmentFlooring and Floor CoveringsComputer Hardware, Software and SuppliesKitchenware and Home Furnishings
JewelryBooksPhotographic Equipment and SuppliesToys, Hobby Goods and GamesOptical GoodsSporting Goods
Hardware, Tools, Plumbing, ElectricalLumber and Building MaterialsLawn, Garden, and Farm Equipment & SuppliesPaint and Sundries
Cars, Trucks, Other Powered TransportationRVs, Campers, Camping & Travel TrailersAutomotive FuelsAutomotive Lubricants
Pets, Pet Foods and Pet SuppliesAll Other Merchandise
5085 Westheimer Rd3 mile ring
2014Demand
2019Demand
PercentDemand Growth
$ 3,774,780,426 $ 4,176,979,607 10.65%
$ 551,700,332 $ 595,054,948 7.86%$ 390,164,721 $ 413,061,374 5.87%$ 21,980,807 $ 23,260,361 5.82%$ 95,328,308 $ 101,543,475 6.52%
$ 71,707,883 $ 82,945,089 15.67%$ 368,561,160 $ 422,237,477 14.56%$ 8,959,833 $ 10,463,951 16.79%$ 31,775,366 $ 37,259,740 17.26%
$ 100,172,252 $ 116,182,524 15.98%$ 155,958,609 $ 180,365,418 15.65%$ 61,480,731 $ 73,390,372 19.37%$ 63,384,579 $ 72,714,232 14.72%$ 5,143,240 $ 5,699,184 10.81%
$ 43,474,210 $ 49,110,530 12.96%$ 18,844,664 $ 21,824,529 15.81%$ 7,445,879 $ 8,412,544 12.98%$ 38,979,634 $ 62,133,400 59.40%$ 34,400,573 $ 52,509,015 52.64%$ 87,420,875 $ 99,284,468 13.57%$ 18,100,544 $ 19,751,524 9.12%$ 72,290,285 $ 106,328,276 47.09%$ 72,928,215 $ 82,135,661 12.63%
$ 82,245,493 $ 92,791,223 12.82%$ 65,621,404 $ 74,465,995 13.48%$ 10,187,779 $ 15,500,669 52.15%$ 62,254,349 $ 73,753,147 18.47%$ 15,351,009 $ 17,670,626 15.11%$ 35,430,921 $ 55,765,212 57.39%
$ 17,338,209 $ 19,201,271 10.75%$ 10,328,765 $ 11,195,474 8.39%$ 38,887,777 $ 44,492,567 14.41%$ 5,298,836 $ 5,927,462 11.86%
$ 599,883,240 $ 574,076,934 -4.30%$ 8,267,687 $ 14,556,417 76.06%$ 254,996,564 $ 269,625,815 5.74%$ 3,511,968 $ 3,422,980 -2.53%
$ 32,102,686 $ 36,300,901 13.08%$ 212,871,038 $ 232,564,817 9.25%
© 2014, The Nielsen Company. All Rights Reserved
PCensus for MapInfo Page 5
TetradThe Galleria
Nielsen 2014 Retail Market Power
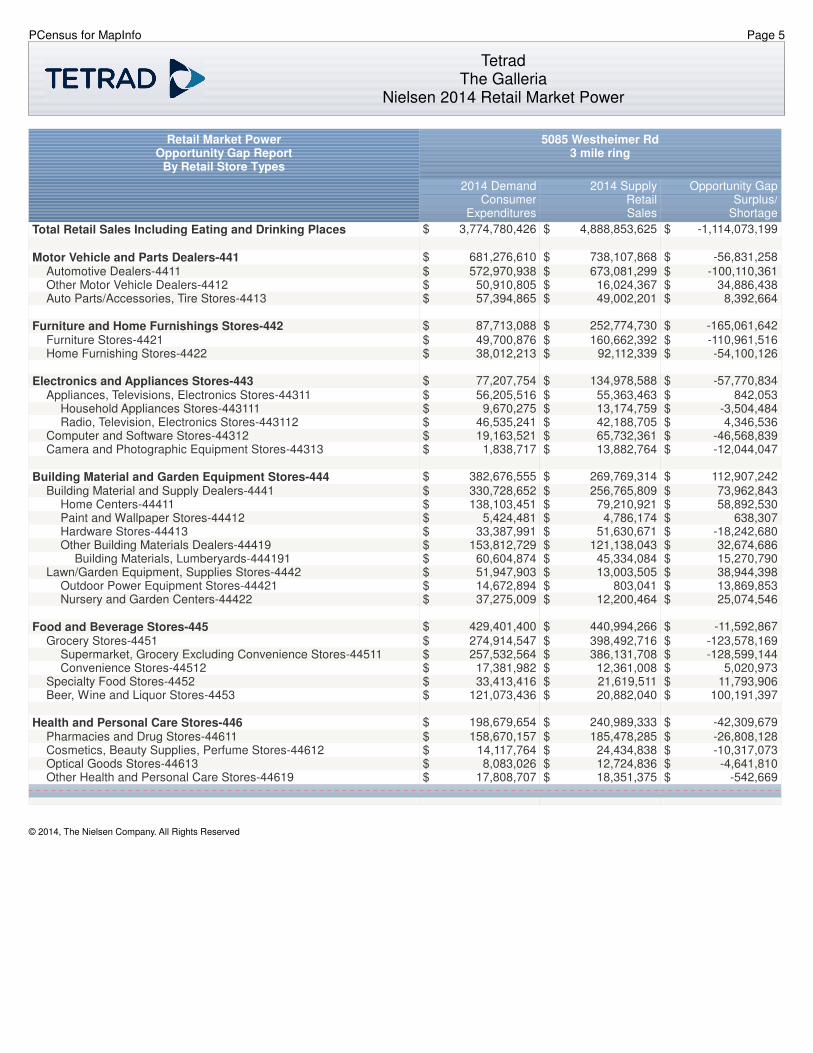
Retail Market PowerOpportunity Gap Report
By Retail Store Types
Total Retail Sales Including Eating and Drinking Places
Motor Vehicle and Parts Dealers-441Automotive Dealers-4411Other Motor Vehicle Dealers-4412Auto Parts/Accessories, Tire Stores-4413
Furniture and Home Furnishings Stores-442Furniture Stores-4421Home Furnishing Stores-4422
Electronics and Appliances Stores-443Appliances, Televisions, Electronics Stores-44311
Household Appliances Stores-443111Radio, Television, Electronics Stores-443112
Computer and Software Stores-44312Camera and Photographic Equipment Stores-44313
Building Material and Garden Equipment Stores-444Building Material and Supply Dealers-4441
Home Centers-44411Paint and Wallpaper Stores-44412Hardware Stores-44413Other Building Materials Dealers-44419
Building Materials, Lumberyards-444191Lawn/Garden Equipment, Supplies Stores-4442
Outdoor Power Equipment Stores-44421Nursery and Garden Centers-44422
Food and Beverage Stores-445Grocery Stores-4451
Supermarket, Grocery Excluding Convenience Stores-44511Convenience Stores-44512
Specialty Food Stores-4452Beer, Wine and Liquor Stores-4453
Health and Personal Care Stores-446Pharmacies and Drug Stores-44611Cosmetics, Beauty Supplies, Perfume Stores-44612Optical Goods Stores-44613Other Health and Personal Care Stores-44619
5085 Westheimer Rd3 mile ring
2014 Demand Consumer
Expenditures
2014 Supply Retail Sales
Opportunity GapSurplus/
Shortage
$ 3,774,780,426 $ 4,888,853,625 $ -1,114,073,199
$ 681,276,610 $ 738,107,868 $ -56,831,258$ 572,970,938 $ 673,081,299 $ -100,110,361$ 50,910,805 $ 16,024,367 $ 34,886,438$ 57,394,865 $ 49,002,201 $ 8,392,664
$ 87,713,088 $ 252,774,730 $ -165,061,642$ 49,700,876 $ 160,662,392 $ -110,961,516$ 38,012,213 $ 92,112,339 $ -54,100,126
$ 77,207,754 $ 134,978,588 $ -57,770,834$ 56,205,516 $ 55,363,463 $ 842,053$ 9,670,275 $ 13,174,759 $ -3,504,484$ 46,535,241 $ 42,188,705 $ 4,346,536$ 19,163,521 $ 65,732,361 $ -46,568,839$ 1,838,717 $ 13,882,764 $ -12,044,047
$ 382,676,555 $ 269,769,314 $ 112,907,242$ 330,728,652 $ 256,765,809 $ 73,962,843$ 138,103,451 $ 79,210,921 $ 58,892,530$ 5,424,481 $ 4,786,174 $ 638,307$ 33,387,991 $ 51,630,671 $ -18,242,680$ 153,812,729 $ 121,138,043 $ 32,674,686$ 60,604,874 $ 45,334,084 $ 15,270,790$ 51,947,903 $ 13,003,505 $ 38,944,398$ 14,672,894 $ 803,041 $ 13,869,853$ 37,275,009 $ 12,200,464 $ 25,074,546
$ 429,401,400 $ 440,994,266 $ -11,592,867$ 274,914,547 $ 398,492,716 $ -123,578,169$ 257,532,564 $ 386,131,708 $ -128,599,144$ 17,381,982 $ 12,361,008 $ 5,020,973$ 33,413,416 $ 21,619,511 $ 11,793,906$ 121,073,436 $ 20,882,040 $ 100,191,397
$ 198,679,654 $ 240,989,333 $ -42,309,679$ 158,670,157 $ 185,478,285 $ -26,808,128$ 14,117,764 $ 24,434,838 $ -10,317,073$ 8,083,026 $ 12,724,836 $ -4,641,810$ 17,808,707 $ 18,351,375 $ -542,669
© 2014, The Nielsen Company. All Rights Reserved
PCensus for MapInfo Page 6
TetradThe Galleria
Nielsen 2014 Retail Market Power
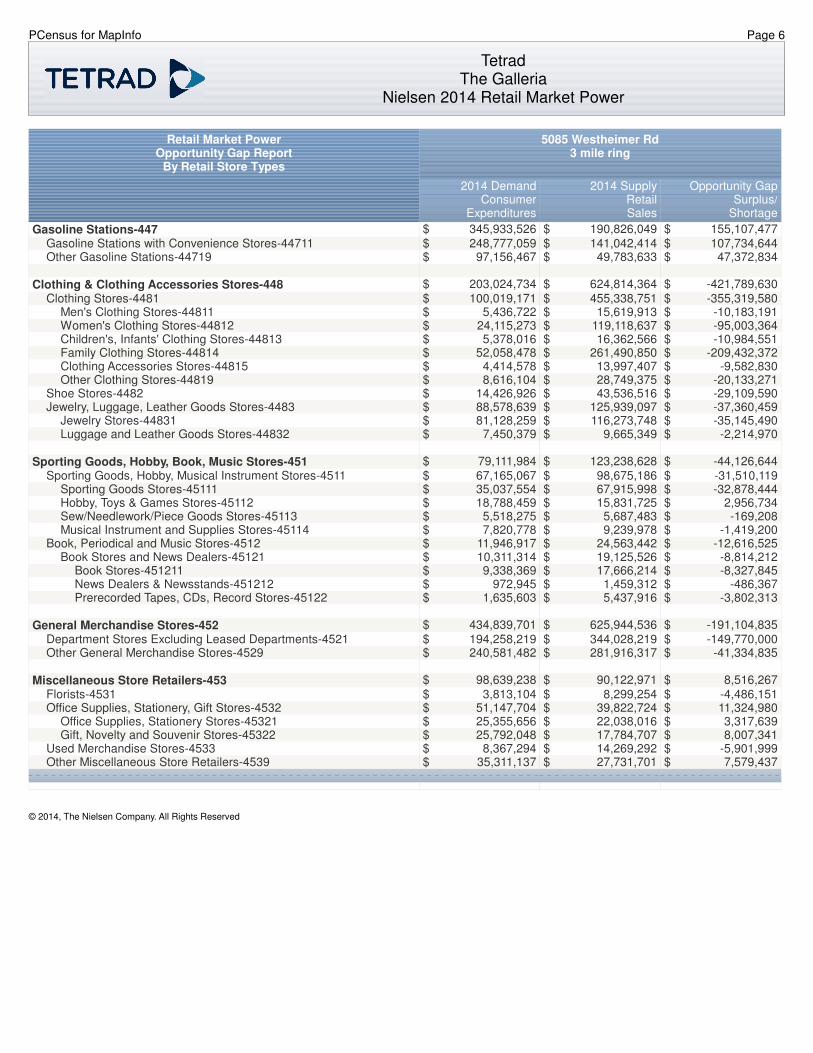
Retail Market PowerOpportunity Gap Report
By Retail Store Types
Gasoline Stations-447Gasoline Stations with Convenience Stores-44711Other Gasoline Stations-44719
Clothing & Clothing Accessories Stores-448Clothing Stores-4481
Men's Clothing Stores-44811Women's Clothing Stores-44812Children's, Infants' Clothing Stores-44813Family Clothing Stores-44814Clothing Accessories Stores-44815Other Clothing Stores-44819
Shoe Stores-4482Jewelry, Luggage, Leather Goods Stores-4483
Jewelry Stores-44831Luggage and Leather Goods Stores-44832
Sporting Goods, Hobby, Book, Music Stores-451Sporting Goods, Hobby, Musical Instrument Stores-4511
Sporting Goods Stores-45111Hobby, Toys & Games Stores-45112Sew/Needlework/Piece Goods Stores-45113Musical Instrument and Supplies Stores-45114
Book, Periodical and Music Stores-4512Book Stores and News Dealers-45121
Book Stores-451211News Dealers & Newsstands-451212Prerecorded Tapes, CDs, Record Stores-45122
General Merchandise Stores-452Department Stores Excluding Leased Departments-4521Other General Merchandise Stores-4529
Miscellaneous Store Retailers-453Florists-4531Office Supplies, Stationery, Gift Stores-4532
Office Supplies, Stationery Stores-45321Gift, Novelty and Souvenir Stores-45322
Used Merchandise Stores-4533Other Miscellaneous Store Retailers-4539
5085 Westheimer Rd3 mile ring
2014 Demand Consumer
Expenditures
2014 Supply Retail Sales
Opportunity GapSurplus/
Shortage
$ 345,933,526 $ 190,826,049 $ 155,107,477$ 248,777,059 $ 141,042,414 $ 107,734,644$ 97,156,467 $ 49,783,633 $ 47,372,834
$ 203,024,734 $ 624,814,364 $ -421,789,630$ 100,019,171 $ 455,338,751 $ -355,319,580$ 5,436,722 $ 15,619,913 $ -10,183,191$ 24,115,273 $ 119,118,637 $ -95,003,364$ 5,378,016 $ 16,362,566 $ -10,984,551$ 52,058,478 $ 261,490,850 $ -209,432,372$ 4,414,578 $ 13,997,407 $ -9,582,830$ 8,616,104 $ 28,749,375 $ -20,133,271$ 14,426,926 $ 43,536,516 $ -29,109,590$ 88,578,639 $ 125,939,097 $ -37,360,459$ 81,128,259 $ 116,273,748 $ -35,145,490$ 7,450,379 $ 9,665,349 $ -2,214,970
$ 79,111,984 $ 123,238,628 $ -44,126,644$ 67,165,067 $ 98,675,186 $ -31,510,119$ 35,037,554 $ 67,915,998 $ -32,878,444$ 18,788,459 $ 15,831,725 $ 2,956,734$ 5,518,275 $ 5,687,483 $ -169,208$ 7,820,778 $ 9,239,978 $ -1,419,200$ 11,946,917 $ 24,563,442 $ -12,616,525$ 10,311,314 $ 19,125,526 $ -8,814,212$ 9,338,369 $ 17,666,214 $ -8,327,845$ 972,945 $ 1,459,312 $ -486,367$ 1,635,603 $ 5,437,916 $ -3,802,313
$ 434,839,701 $ 625,944,536 $ -191,104,835$ 194,258,219 $ 344,028,219 $ -149,770,000$ 240,581,482 $ 281,916,317 $ -41,334,835
$ 98,639,238 $ 90,122,971 $ 8,516,267$ 3,813,104 $ 8,299,254 $ -4,486,151$ 51,147,704 $ 39,822,724 $ 11,324,980$ 25,355,656 $ 22,038,016 $ 3,317,639$ 25,792,048 $ 17,784,707 $ 8,007,341$ 8,367,294 $ 14,269,292 $ -5,901,999$ 35,311,137 $ 27,731,701 $ 7,579,437
© 2014, The Nielsen Company. All Rights Reserved
PCensus for MapInfo Page 7
TetradThe Galleria
Nielsen 2014 Retail Market Power
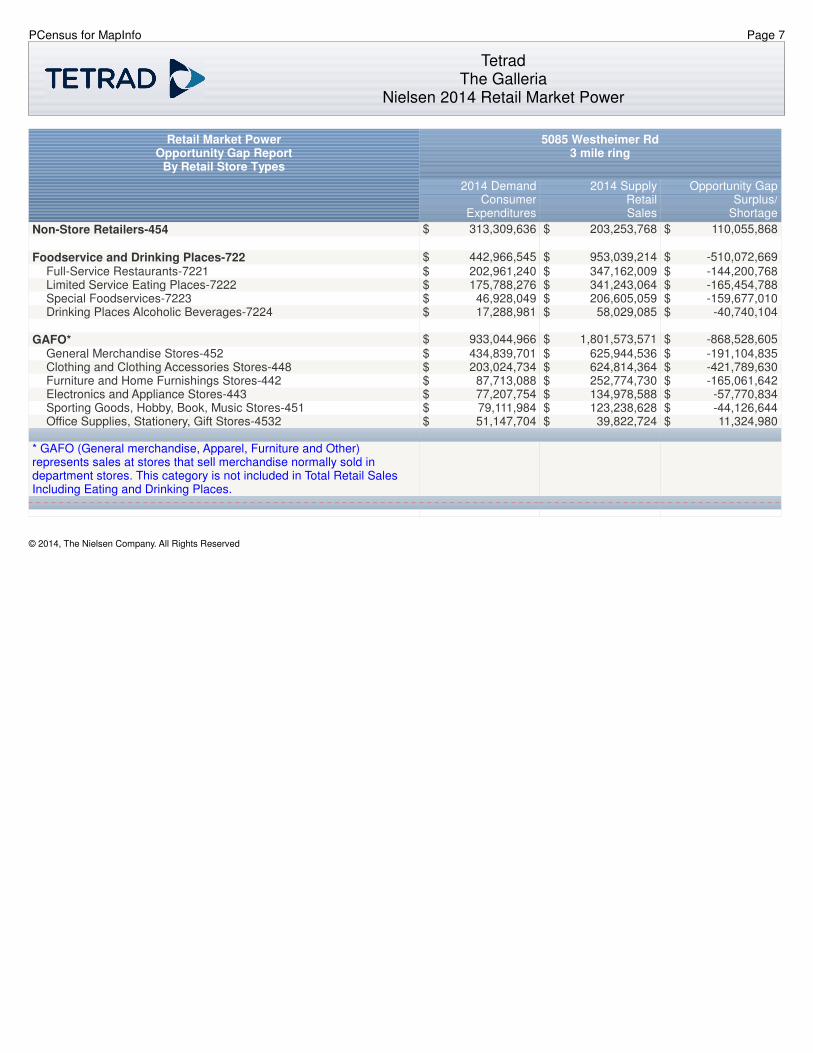
Retail Market PowerOpportunity Gap Report
By Retail Store Types
Non-Store Retailers-454
Foodservice and Drinking Places-722Full-Service Restaurants-7221Limited Service Eating Places-7222Special Foodservices-7223Drinking Places Alcoholic Beverages-7224
GAFO*General Merchandise Stores-452Clothing and Clothing Accessories Stores-448Furniture and Home Furnishings Stores-442Electronics and Appliance Stores-443Sporting Goods, Hobby, Book, Music Stores-451Office Supplies, Stationery, Gift Stores-4532
* GAFO (General merchandise, Apparel, Furniture and Other) represents sales at stores that sell merchandise normally sold in department stores. This category is not included in Total Retail Sales Including Eating and Drinking Places.
5085 Westheimer Rd3 mile ring
2014 Demand Consumer
Expenditures
2014 Supply Retail Sales
Opportunity GapSurplus/
Shortage
$ 313,309,636 $ 203,253,768 $ 110,055,868
$ 442,966,545 $ 953,039,214 $ -510,072,669$ 202,961,240 $ 347,162,009 $ -144,200,768$ 175,788,276 $ 341,243,064 $ -165,454,788$ 46,928,049 $ 206,605,059 $ -159,677,010$ 17,288,981 $ 58,029,085 $ -40,740,104
$ 933,044,966 $ 1,801,573,571 $ -868,528,605$ 434,839,701 $ 625,944,536 $ -191,104,835$ 203,024,734 $ 624,814,364 $ -421,789,630$ 87,713,088 $ 252,774,730 $ -165,061,642$ 77,207,754 $ 134,978,588 $ -57,770,834$ 79,111,984 $ 123,238,628 $ -44,126,644$ 51,147,704 $ 39,822,724 $ 11,324,980
© 2014, The Nielsen Company. All Rights Reserved

PCensus for MapInfo Page 8
TetradThe Galleria
Nielsen 2014 Retail Market Power
Retail Market PowerOpportunity Gap Report
By Retail Store Types
Nielsen's RMP data is derived from two major sources of information. The demand data is derived from the Consumer Expenditure Survey (CE Survey), which is fielded by the U.S. Bureau of Labor Statistics (BLS). The supply data is derived from the Census of Retail Trade (CRT), which is made available by the U.S. Census. Additional data sources are incorporated to create both supply and demand estimates.The difference between demand and supply represents the opportunity gap or surplus available for each merchandise line in the specified reporting geography. When the demand is greater than (less than) the supply, there is an opportunity gap (surplus)for that merchandise line. For example, a positive value signifies an opportunity gap, while a negative value signifies a surplus.
5085 Westheimer Rd3 mile ring
2014 Demand Consumer
Expenditures
2014 Supply Retail Sales
Opportunity GapSurplus/
Shortage
© 2014, The Nielsen Company. All Rights Reserved
PCensus for MapInfo Page 9
TetradThe Galleria
Nielsen 2014 Retail Market Power
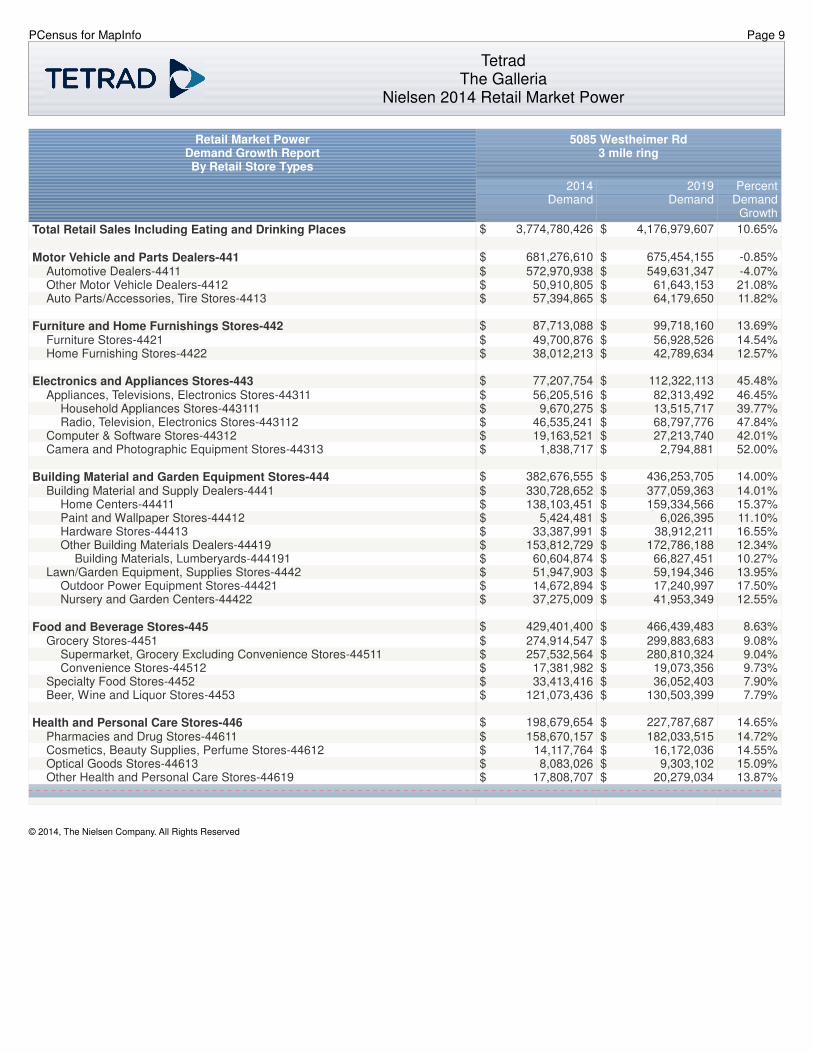
Retail Market PowerDemand Growth ReportBy Retail Store Types
Total Retail Sales Including Eating and Drinking Places
Motor Vehicle and Parts Dealers-441Automotive Dealers-4411Other Motor Vehicle Dealers-4412Auto Parts/Accessories, Tire Stores-4413
Furniture and Home Furnishings Stores-442Furniture Stores-4421Home Furnishing Stores-4422
Electronics and Appliances Stores-443Appliances, Televisions, Electronics Stores-44311
Household Appliances Stores-443111Radio, Television, Electronics Stores-443112
Computer & Software Stores-44312Camera and Photographic Equipment Stores-44313
Building Material and Garden Equipment Stores-444Building Material and Supply Dealers-4441
Home Centers-44411Paint and Wallpaper Stores-44412Hardware Stores-44413Other Building Materials Dealers-44419
Building Materials, Lumberyards-444191Lawn/Garden Equipment, Supplies Stores-4442
Outdoor Power Equipment Stores-44421Nursery and Garden Centers-44422
Food and Beverage Stores-445Grocery Stores-4451
Supermarket, Grocery Excluding Convenience Stores-44511Convenience Stores-44512
Specialty Food Stores-4452Beer, Wine and Liquor Stores-4453
Health and Personal Care Stores-446Pharmacies and Drug Stores-44611Cosmetics, Beauty Supplies, Perfume Stores-44612Optical Goods Stores-44613Other Health and Personal Care Stores-44619
5085 Westheimer Rd3 mile ring
2014 Demand
2019 Demand
PercentDemand Growth
$ 3,774,780,426 $ 4,176,979,607 10.65%
$ 681,276,610 $ 675,454,155 -0.85%$ 572,970,938 $ 549,631,347 -4.07%$ 50,910,805 $ 61,643,153 21.08%$ 57,394,865 $ 64,179,650 11.82%
$ 87,713,088 $ 99,718,160 13.69%$ 49,700,876 $ 56,928,526 14.54%$ 38,012,213 $ 42,789,634 12.57%
$ 77,207,754 $ 112,322,113 45.48%$ 56,205,516 $ 82,313,492 46.45%$ 9,670,275 $ 13,515,717 39.77%$ 46,535,241 $ 68,797,776 47.84%$ 19,163,521 $ 27,213,740 42.01%$ 1,838,717 $ 2,794,881 52.00%
$ 382,676,555 $ 436,253,705 14.00%$ 330,728,652 $ 377,059,363 14.01%$ 138,103,451 $ 159,334,566 15.37%$ 5,424,481 $ 6,026,395 11.10%$ 33,387,991 $ 38,912,211 16.55%$ 153,812,729 $ 172,786,188 12.34%$ 60,604,874 $ 66,827,451 10.27%$ 51,947,903 $ 59,194,346 13.95%$ 14,672,894 $ 17,240,997 17.50%$ 37,275,009 $ 41,953,349 12.55%
$ 429,401,400 $ 466,439,483 8.63%$ 274,914,547 $ 299,883,683 9.08%$ 257,532,564 $ 280,810,324 9.04%$ 17,381,982 $ 19,073,356 9.73%$ 33,413,416 $ 36,052,403 7.90%$ 121,073,436 $ 130,503,399 7.79%
$ 198,679,654 $ 227,787,687 14.65%$ 158,670,157 $ 182,033,515 14.72%$ 14,117,764 $ 16,172,036 14.55%$ 8,083,026 $ 9,303,102 15.09%$ 17,808,707 $ 20,279,034 13.87%
© 2014, The Nielsen Company. All Rights Reserved
PCensus for MapInfo Page 10
TetradThe Galleria
Nielsen 2014 Retail Market Power
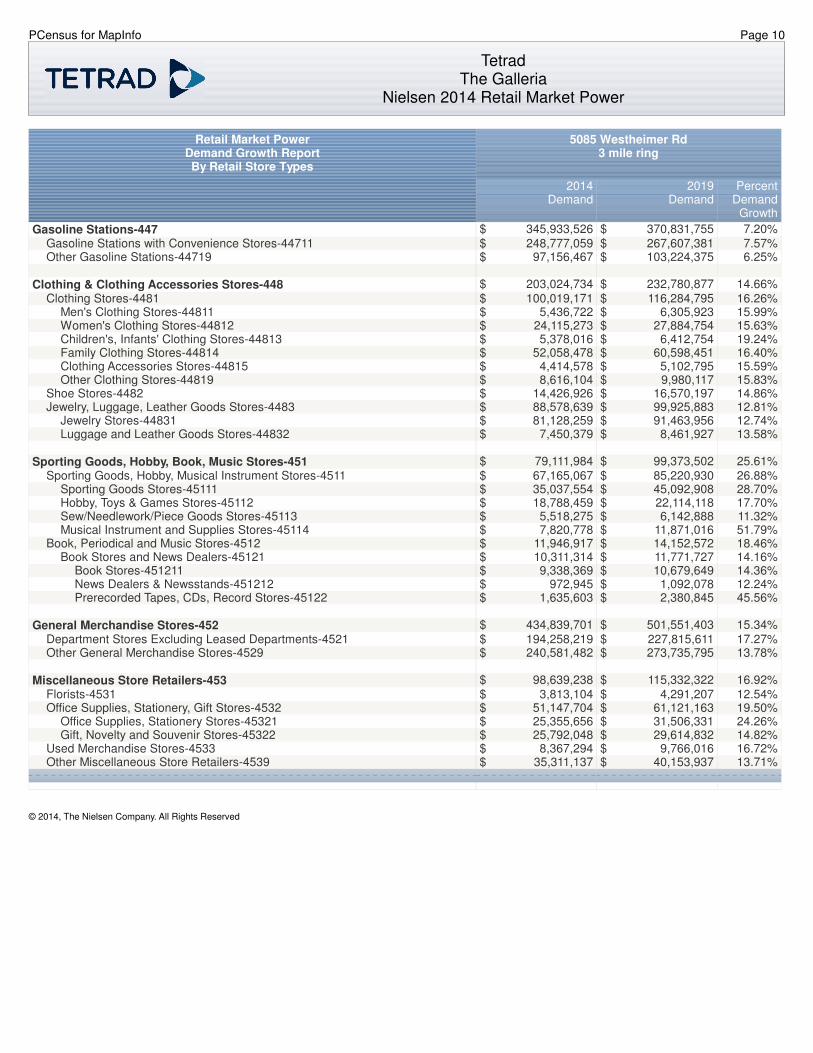
Retail Market PowerDemand Growth ReportBy Retail Store Types
Gasoline Stations-447Gasoline Stations with Convenience Stores-44711Other Gasoline Stations-44719
Clothing & Clothing Accessories Stores-448Clothing Stores-4481
Men's Clothing Stores-44811Women's Clothing Stores-44812Children's, Infants' Clothing Stores-44813Family Clothing Stores-44814Clothing Accessories Stores-44815Other Clothing Stores-44819
Shoe Stores-4482Jewelry, Luggage, Leather Goods Stores-4483
Jewelry Stores-44831Luggage and Leather Goods Stores-44832
Sporting Goods, Hobby, Book, Music Stores-451Sporting Goods, Hobby, Musical Instrument Stores-4511
Sporting Goods Stores-45111Hobby, Toys & Games Stores-45112Sew/Needlework/Piece Goods Stores-45113Musical Instrument and Supplies Stores-45114
Book, Periodical and Music Stores-4512Book Stores and News Dealers-45121
Book Stores-451211News Dealers & Newsstands-451212Prerecorded Tapes, CDs, Record Stores-45122
General Merchandise Stores-452Department Stores Excluding Leased Departments-4521Other General Merchandise Stores-4529
Miscellaneous Store Retailers-453Florists-4531Office Supplies, Stationery, Gift Stores-4532
Office Supplies, Stationery Stores-45321Gift, Novelty and Souvenir Stores-45322
Used Merchandise Stores-4533Other Miscellaneous Store Retailers-4539
5085 Westheimer Rd3 mile ring
2014 Demand
2019 Demand
PercentDemand Growth
$ 345,933,526 $ 370,831,755 7.20%$ 248,777,059 $ 267,607,381 7.57%$ 97,156,467 $ 103,224,375 6.25%
$ 203,024,734 $ 232,780,877 14.66%$ 100,019,171 $ 116,284,795 16.26%$ 5,436,722 $ 6,305,923 15.99%$ 24,115,273 $ 27,884,754 15.63%$ 5,378,016 $ 6,412,754 19.24%$ 52,058,478 $ 60,598,451 16.40%$ 4,414,578 $ 5,102,795 15.59%$ 8,616,104 $ 9,980,117 15.83%$ 14,426,926 $ 16,570,197 14.86%$ 88,578,639 $ 99,925,883 12.81%$ 81,128,259 $ 91,463,956 12.74%$ 7,450,379 $ 8,461,927 13.58%
$ 79,111,984 $ 99,373,502 25.61%$ 67,165,067 $ 85,220,930 26.88%$ 35,037,554 $ 45,092,908 28.70%$ 18,788,459 $ 22,114,118 17.70%$ 5,518,275 $ 6,142,888 11.32%$ 7,820,778 $ 11,871,016 51.79%$ 11,946,917 $ 14,152,572 18.46%$ 10,311,314 $ 11,771,727 14.16%$ 9,338,369 $ 10,679,649 14.36%$ 972,945 $ 1,092,078 12.24%$ 1,635,603 $ 2,380,845 45.56%
$ 434,839,701 $ 501,551,403 15.34%$ 194,258,219 $ 227,815,611 17.27%$ 240,581,482 $ 273,735,795 13.78%
$ 98,639,238 $ 115,332,322 16.92%$ 3,813,104 $ 4,291,207 12.54%$ 51,147,704 $ 61,121,163 19.50%$ 25,355,656 $ 31,506,331 24.26%$ 25,792,048 $ 29,614,832 14.82%$ 8,367,294 $ 9,766,016 16.72%$ 35,311,137 $ 40,153,937 13.71%
© 2014, The Nielsen Company. All Rights Reserved

PCensus for MapInfo Page 11
TetradThe Galleria
Nielsen 2014 Retail Market Power
Retail Market PowerDemand Growth ReportBy Retail Store Types
Non-Store Retailers-454
Foodservice and Drinking Places-722Full-Service Restaurants-7221Limited Service Eating Places-7222Special Foodservices-7223Drinking Places Alcoholic Beverages-7224
GAFOGeneral Merchandise Stores-452Clothing and Clothing Accessories Stores-448Furniture and Home Furnishings Stores-442Electronics and Appliance Stores-443Sporting Goods, Hobby, Book, Music Stores-451Office Supplies, Stationery, Gift Stores-4532
* GAFO (General merchandise, Apparel, Furniture and Other) represents sales at stores that sell merchandise normally sold in department stores. This category is not included in Total Retail Sales Including Eating and Drinking Places.
5085 Westheimer Rd3 mile ring
2014 Demand
2019 Demand
PercentDemand Growth
$ 313,309,636 $ 369,207,006 17.84%
$ 442,966,545 $ 469,927,440 6.09%$ 202,961,240 $ 215,117,995 5.99%$ 175,788,276 $ 186,443,945 6.06%$ 46,928,049 $ 49,809,591 6.14%$ 17,288,981 $ 18,555,910 7.33%
$ 933,044,966 $ 1,106,867,219 18.63%$ 434,839,701 $ 501,551,403 15.34%$ 203,024,734 $ 232,780,877 14.66%$ 87,713,088 $ 99,718,160 13.69%$ 77,207,754 $ 112,322,113 45.48%$ 79,111,984 $ 99,373,502 25.61%$ 51,147,704 $ 61,121,163 19.50%
© 2014, The Nielsen Company. All Rights Reserved