teva pharmaceutical industries technical analysis charts
TRANSCRIPT

April 26, 2016
TEVA: Teva Pharmaceutical Industries technical analysis charts
On Monday, compared to Friday, price action opened lower (56.51, vs Friday's
close of 57.05), saw a lower high (57.41, vs Friday's high of 57.52) and lower low
(55.50, vs Friday's low of 56.61); and closed lower (55.77, vs Friday's close of
57.05). The day's range was 191 ticks.
On the DAILY BOLLINGER BANDS CHART below, Monday represents the 1st
consecutive entire day above the middle of the Bollinger Band envelope (55.57).
The Bollinger Bands (53.54-57.61) are converging; and narrowed from a width of
433 ticks on Friday to a width of 407 ticks on Monday.
The RSI (49.07) below is in neutral mode between the key 20 (oversold) and 80
(overbought) levels.
April 26, 2016
The MACD 12 day moving average is below the MACD 26 day moving average;
both are above zero.
The Slow Stochastics, below, are in positive mode, with the K line above the D
line.
The Commodity Channel Index (49.25), below, is in positive mode above the
oversold -200 level.
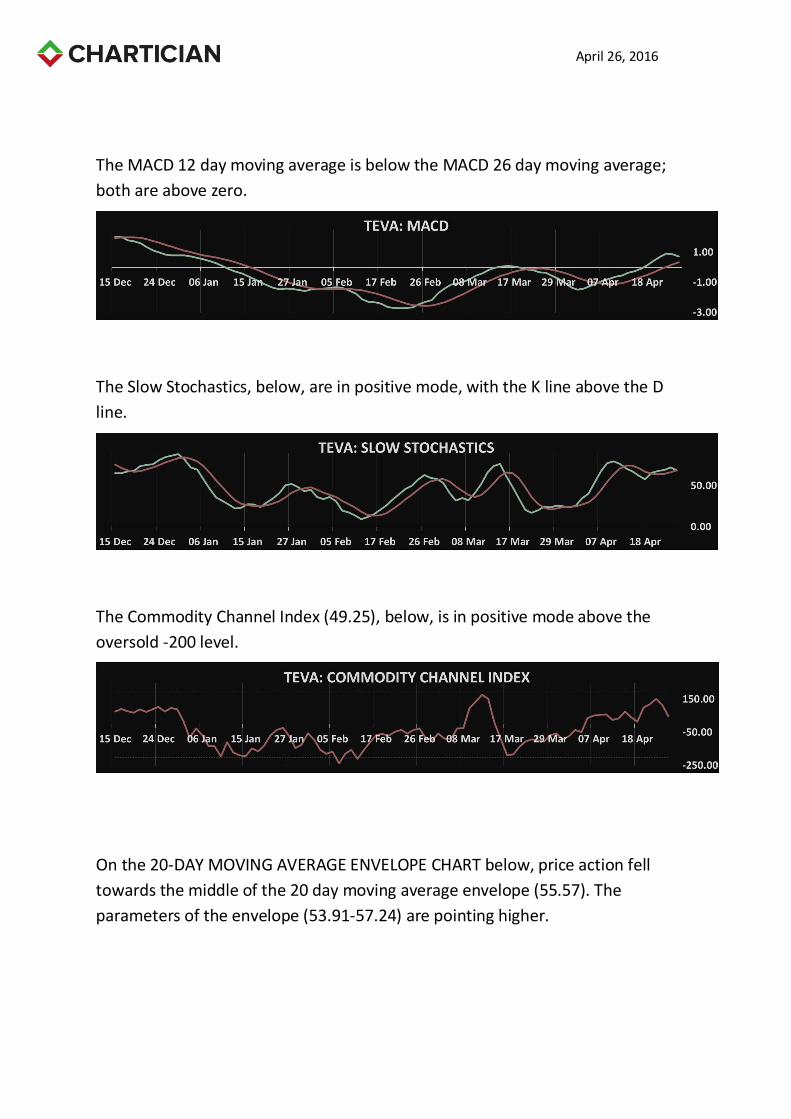
On the 20-DAY MOVING AVERAGE ENVELOPE CHART below, price action fell
towards the middle of the 20 day moving average envelope (55.57). The
parameters of the envelope (53.91-57.24) are pointing higher.
April 26, 2016
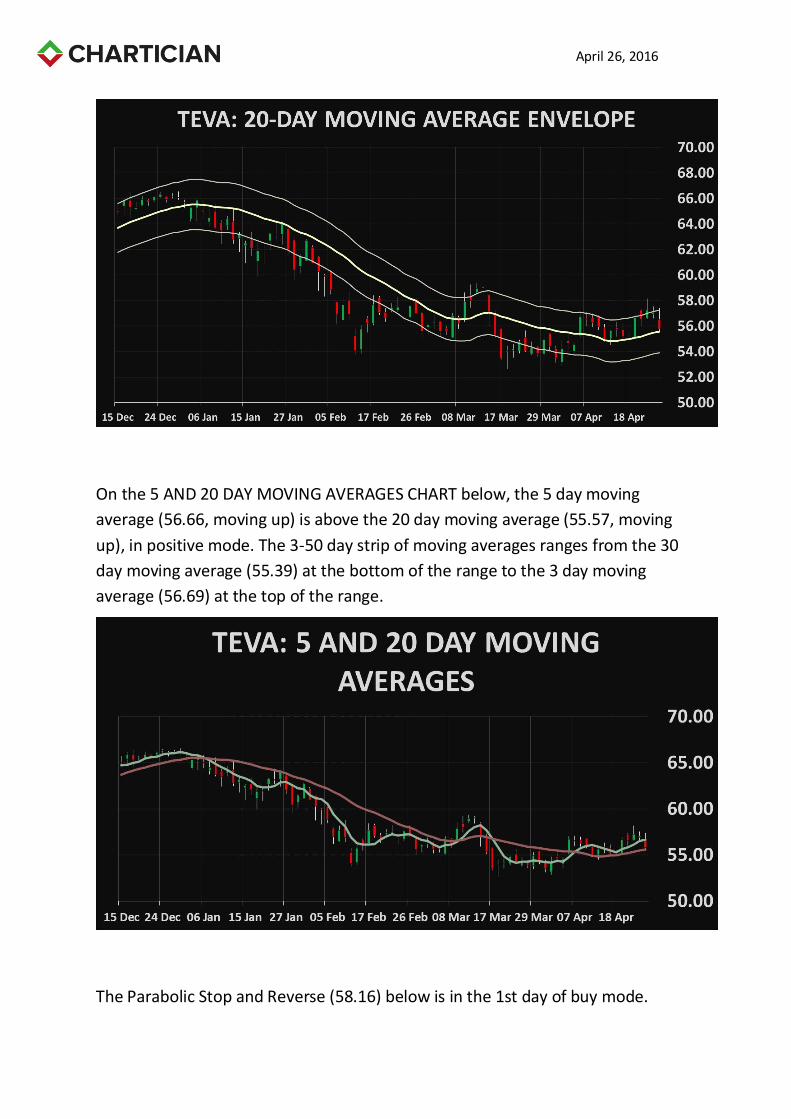
On the 5 AND 20 DAY MOVING AVERAGES CHART below, the 5 day moving
average (56.66, moving up) is above the 20 day moving average (55.57, moving
up), in positive mode. The 3-50 day strip of moving averages ranges from the 30
day moving average (55.39) at the bottom of the range to the 3 day moving
average (56.69) at the top of the range.
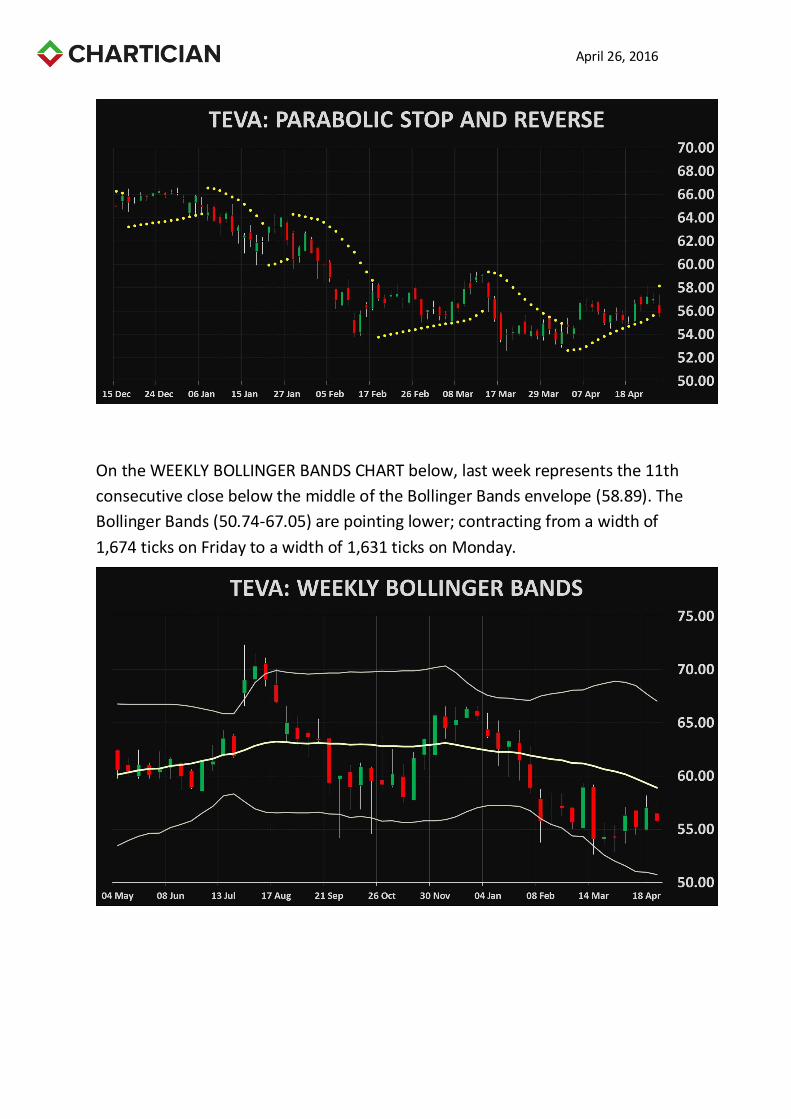
The Parabolic Stop and Reverse (58.16) below is in the 1st day of buy mode.
April 26, 2016
On the WEEKLY BOLLINGER BANDS CHART below, last week represents the 11th
consecutive close below the middle of the Bollinger Bands envelope (58.89). The
Bollinger Bands (50.74-67.05) are pointing lower; contracting from a width of
1,674 ticks on Friday to a width of 1,631 ticks on Monday.