številka 2 / 2020 - microsoft · 2020-03-26 · 1 vsebina ekonomska in denarna gibanja 2 povzetek...
TRANSCRIPT

Ekonomski bilten
številka 2 / 2020

Ekonomski bilten ECB, številka 2 / 2020
1
Vsebina
Ekonomska in denarna gibanja 2
Povzetek 2
1 Zunanje okolje 9
2 Finančna gibanja 17
3 Gospodarska aktivnost 23
4 Cene in stroški 28
5 Denar in krediti 33
6 Javnofinančna gibanja 41
Okvirji 44
1 Uporaba informacij v časopisnih člankih kot kazalnika realne gospodarske aktivnosti 44
2 Vloga obdavčitve multinacionalnih podjetij v prvem preobratu tokov neposrednih tujih naložb v euroobmočju 47
3 Likvidnostne razmere in operacije denarne politike v obdobju od 30. oktobra 2019 do 28. januarja 2020 51
4 Posledice javnofinančnih ukrepov za spopadanje s podnebnimi spremembami 57
Članki 60
1 Multinational enterprises, financial centres and their implications for external imbalances: a euro area perspective 60
2 Short-term forecasting of euro area economic activity at the ECB 84
3 The state of play regarding the deepening agenda for Economic and Monetary Union 96
Statistični podatki 120

Ekonomski bilten ECB, številka 2 / 2020
2
Ekonomska in denarna gibanja
Povzetek
Svet ECB se je na seji o denarni politiki 12. marca odločil sprejeti celovit sveženj ukrepov denarne politike. Ti ukrepi bodo skupaj z znatnimi spodbudami denarne politike, ki so že v veljavi, podpirali likvidnostne pogoje in pogoje financiranja za gospodinjstva, podjetja in banke ter bodo prispevali k ohranjanju nemotenega kreditiranja realnega gospodarstva. Od zadnje seje Sveta ECB konec januarja je širjenje koronavirusa (COVID-19) povzročilo velik šok za nadaljnjo rast svetovnega gospodarstva in gospodarstva v euroobmočju ter povišano volatilnost na trgih. Tudi če se bo nazadnje izkazalo, da je šok po svoji naravi začasen, bo imel precejšen vpliv na gospodarsko aktivnost. Upočasnil bo namreč proizvodnjo zaradi prekinjenih dobavnih verig ter zmanjšal domače in tuje povpraševanje, zlasti prek negativnega vpliva, ki ga imajo potrebni zajezitveni ukrepi. Poleg tega povišana negotovost negativno vpliva na načrtovanje izdatkov in njihovo financiranje. Tveganja, ki spremljajo gospodarske obete v euroobmočju, so nedvomno na strani nižje rasti. Poleg že prej ugotovljenih tveganj, povezanih z geopolitičnimi dejavniki, vse večjim protekcionizmom in ranljivostmi v nastajajočih tržnih gospodarstvih, predstavlja širjenje koronavirusa nov in precejšen vir navzdol usmerjenih tveganj za prihodnjo gospodarsko rast. V takšnih razmerah je Svet ECB sprejel več sklepov o denarni politiki, da bi ohranil naravnanost denarne politike in podprl transmisijo denarne politike v realno gospodarstvo.
Ocena gospodarskih in denarnih razmer v času seje Sveta ECB 12. marca 2020
S širjenjem epidemije COVID-19 se poslabšujejo svetovni gospodarski obeti, predstavljeni v marčnih makroekonomskih projekcijah strokovnjakov ECB. Dogajanja od presečnega datuma projekcij kažejo, da so se navzdol usmerjena tveganja za svetovno gospodarsko aktivnost, povezana z izbruhom COVID-19, deloma uresničila, kar pomeni, da bo svetovna gospodarska aktivnost letos šibkejša, kot je predvideno v projekcijah. Izbruh je svetovno gospodarstvo prizadel v času, ko so se začeli pojavljati znaki stabilizacije aktivnosti in trgovinske menjave, negotovost pa se je zmanjšala zaradi podpisa t. i. prve faze trgovinskega sporazuma med ZDA in Kitajsko, ki ga je spremljalo znižanje carin. Gledano dolgoročneje bo globalno okrevanje predvidoma pridobilo le skromen zagon. Odvisno bo predvsem od okrevanja v vrsti še vedno ranljivih nastajajočih tržnih gospodarstev, medtem ko bosta pričakovana ciklična upočasnitev v razvitih gospodarstvih in strukturni prehod kitajskega gospodarstva k nižjim stopnjam rasti prispevala k slabšim obetom v srednjeročnem obdobju. Tveganja za svetovno gospodarsko aktivnost so se spremenila, še vedno pa so na strani upočasnjevanja aktivnosti. Trenutno so najbolj akutna navzdol usmerjena tveganja povezana z možnostjo, da bo imel izbruh COVID-19 širše in dolgotrajnejše posledice, saj se ves čas širi. Svetovni inflacijski pritiski ostajajo šibki.

Ekonomski bilten ECB, številka 2 / 2020
3
Dojemanje tveganj se je globalno strmo poslabšalo, volatilnost trgov pa je poskočila, saj se je koronavirus do konca obravnavanega obdobja (od 12. decembra 2019 do 11. marca 2020) razširil po celem svetu. Dolgoročne netvegane obrestne mere so se v euroobmočju znatno znižale in dosegle raven, ki je precej nižja kot na začetku obravnavanega obdobja. Krivulja terminskih obrestnih mer EONIA (povprečja indeksa transakcij čez noč v eurih) se je premaknila strmo navzdol, njena vbočenost pri krajših do srednjih ročnostih pa nakazuje, da so trgi vračunali nadaljnjo okrepitev spodbujevalne naravnanosti denarne politike. V skladu s strmim povečanjem globalne nenaklonjenosti tveganju so se tečaji delnic v euroobmočju zelo znižali, medtem ko so se razmiki v donosnosti državnih in podjetniških obveznic povečali. Na volatilnih deviznih trgih je euro precej apreciiral v razmerju do valut 38 najpomembnejših trgovinskih partneric euroobmočja.
Realna rast BDP v euroobmočju je v zadnjem četrtletju 2019 ostala nizka na ravni 0,1% v primerjavi s prejšnjim četrtletjem, ko je rast znašala 0,3%, kar je bilo posledica nadaljnje šibke aktivnosti v predelovalnih dejavnostih in upočasnjevanja rasti naložb. Najnovejši ekonomski podatki in anketne informacije kažejo na dinamiko rasti v euroobmočju, ki je na nizki ravni, ter še ne odražajo v celoti gibanj, povezanih s koronavirusom, ki se je konec februarja začel širiti po kontinentalni Evropi in je negativno vplival na gospodarsko aktivnost. Če odmislimo motnje, ki so posledica širjenja koronavirusa, naj bi gospodarska rast v euroobmočju pridobila zagon v srednjeročnem obdobju ob podpori ugodnih pogojev financiranja, naravnanosti javnofinančnih politik v euroobmočju in pričakovane vrnitve svetovne gospodarske aktivnosti.
Po marčnih makroekonomskih projekcijah strokovnjakov ECB za euroobmočje bo medletna realna rast BDP znašala 0,8% leta 2020, 1,3% leta 2021 in 1,4% leta 2022. V primerjavi z lanskimi decembrskimi makroekonomskimi projekcijami strokovnjakov Eurosistema je bila napoved realne rasti BDP za leto 2020 popravljena navzdol za 0,3 odstotne točke, za leto 2021 pa za 0,1 odstotne točke, in sicer predvsem zaradi izbruha koronavirusa, vendar je novejše hitro širjenje virusa v euroobmočju le deloma upoštevano. Tveganja, ki spremljajo gospodarske obete v euroobmočju, so zato nedvomno na strani nižje rasti. Širjenje koronavirusa predstavlja nov in precejšen vir navzdol usmerjenih tveganj za gospodarsko rast poleg tveganj, ki so povezana z geopolitičnimi dejavniki, vse večjim protekcionizmom in ranljivostmi v nastajajočih tržnih gospodarstvih.
Po Eurostatovi prvi oceni se je medletna inflacija v euroobmočju, merjena z indeksom HICP, znižala z 1,4% v januarju 2020 na 1,2% v februarju. Glede na strm upad trenutnih in terminskih cen nafte se bo skupna inflacija v prihodnjih mesecih verjetno še znatno znižala. Takšno oceno deloma kažejo tudi marčne makroekonomske projekcije strokovnjakov ECB za euroobmočje, po katerih bo medletna inflacija v letu 2020 znašala 1,1%, v letu 2021 1,4%, v letu 2022 pa 1,6%. V primerjavi z decembrskimi makroekonomskimi projekcijami strokovnjakov Eurosistema so inflacijski obeti približno nespremenjeni. V srednjeročnem obdobju bodo inflacijo podpirali ukrepi denarne politike ECB. Posledice koronavirusa za inflacijo so izjemno negotove, saj bi lahko navzdol usmerjene pritiske zaradi šibkejšega povpraševanja odtehtali navzgor usmerjeni pritiski zaradi motenj v

Ekonomski bilten ECB, številka 2 / 2020
4
ponudbi. Nedavni strm padec cen nafte predstavlja precejšnje pritiske na znižanje inflacije v kratkoročnem obdobju.
Rast denarja se je od lanskega poznega poletja umirila z razmeroma visoke ravni. Kreditiranje zasebnega sektorja je še naprej beležilo raznolika gibanja v različnih kategorijah posojil. Medtem ko so posojila gospodinjstvom vztrajno rasla, so se posojila podjetjem umirila. Ugodni pogoji financiranja za banke in bančni posojilni pogoji so še naprej podpirali odobravanje posojil in s tem tudi gospodarsko rast. Skupno neto zunanje financiranje podjetij v euroobmočju se je stabiliziralo ob podpori ugodnih stroškov dolžniškega financiranja. Toda nedavno povečanje nenaklonjenosti tveganju bo verjetno povzročilo, da se bodo pogoji nebančnega financiranja za nefinančne družbe poslabšali.
Proračunski saldo širše opredeljene države naj bi se v euroobmočju v obdobju 2020–2021 poslabšal in se v letu 2022 stabiliziral. Poslabšanje je v veliki meri mogoče pripisati nižjemu primarnemu presežku. Takšna gibanja se kažejo tudi v projekcijah ekspanzivno naravnane javnofinančne politike v letih 2020 in 2021, čemur bo sledila večinoma nevtralna naravnanost v letu 2022. Kljub razmeroma ekspanzivno naravnani javnofinančni politiki naj bi se delež javnega dolga euroobmočja v razmerju do BDP po projekcijah še naprej postopoma zmanjševal zaradi ugodne razlike med obrestno mero in stopnjo rasti BDP ter nekoliko pozitivnega primarnega salda v celotnem obdobju. Gibanja, povezana s širjenjem COVID-19, v obdobju po dokončanju projekcij nedvomno nakazujejo poslabševanje obetov glede naravnanosti javnofinančne politike. Poleg že napovedanih ukrepov javnofinančnih politik je treba zelo pozdraviti tudi zavezanost Euroskupine k skupnemu in usklajenemu odzivanju politik v luči širjenja koronavirusa.
Sveženj ukrepov denarne politike
Svet ECB se je 12. marca 2020 odločil sprejeti celovit sveženj ukrepov denarne politike. Odziv denarne politike obsega tri glavne elemente: prvič, ohranjanje dobrih likvidnostnih razmer v bančnem sistemu s serijo cenovno ugodnih operacij dolgoročnejšega refinanciranja, drugič, vzdrževanje neprekinjenih tokov kreditiranja v realno gospodarstvo s temeljitim novim kalibriranjem ciljno usmerjenih operacij dolgoročnejšega refinanciranja (CUODR) ter, tretjič, preprečevanje, da bi se pogoji financiranja za gospodarstvo prociklično zaostrili, kar bomo dosegli s povečanjem programa nakupa vrednostnih papirjev.1
1. V obdobju povečane negotovosti je bistveno, da se finančnemu sistemu zagotovi likvidnost po zelo ugodnih pogojih, s čimer se bodo preprečili likvidnostni krč in pritiski na ceno likvidnosti, in sicer tudi v času, ko se lahko udeleženci v finančnem sistemu zaradi koronavirusa soočajo z izzivi na področju operativnih tveganj. Svet ECB je zato sklenil, da se bodo začasno izvajale dodatne operacije dolgoročnejšega refinanciranja, s katerimi bo finančnemu sistemu v euroobmočju zagotovljena takojšnja likvidnostna podpora. Čeprav Svet ECB ne
1 Nadaljnje podrobnosti so v Lane, P.R., »The Monetary Policy Package: An Analytical Framework«, Blog
ECB, ECB, 13. marec 2020.
Ekonomski bilten ECB, številka 2 / 2020
5
opaža pomembnih znakov napetosti na denarnih trgih ali pomanjkanja likvidnosti v bančnem sistemu, bodo te operacije zagotavljale učinkovito varovalo, če bi bilo to potrebno. Te operacije bodo izvedene v obliki avkcije s fiksno obrestno mero in polno dodelitvijo. Njihova cena bo zelo privlačna, saj bo obrestna mera enaka povprečni obrestni meri za odprto ponudbo mejnega depozita. Z novimi operacijami dolgoročnejšega refinanciranja bo likvidnost ponujena po ugodnih pogojih, s čimer se bo premostilo obdobje do operacije CUODR III, ki bo izvedena junija 2020.
2. Ker je širjenje koronavirusa prizadelo prihodke in načrtovane izdatke gospodinjstev in podjetij, je bistveno, da podpremo odobravanje bančnih posojil tistim, ki najbolj občutijo gospodarske posledice, zlasti mala in srednje velika podjetja. Svet ECB je zato sklenil, da bodo v obdobju od junija 2020 do junija 2021 veljali precej bolj ugodni pogoji v vseh operacijah CUODR III, izvedenih v tem času. V tem obdobju bo obrestna mera v operacijah CUODR III 25 bazičnih točk pod povprečno obrestno mero v Eurosistemovih operacijah glavnega refinanciranja. Za nasprotne stranke, ki ohranjajo raven kreditiranja, bo obrestna mera v teh operacijah nižja, v obdobju do konca junija 2021 pa je lahko celo 25 bazičnih točk nižja od povprečne obrestne mere za odprto ponudbo mejnega depozita. Poleg tega je največji skupni znesek, ki si ga bodo lahko odslej nasprotne stranke izposodile v operacijah CUODR III, povišan na 50% njihovega obsega primernih posojil na dan 28. februarja 2019. S tem se skupen možen obseg zadolževanja v okviru tega programa poveča za več kot 1 bilijon EUR na skupno skoraj 3 bilijone EUR. Gledano v celoti bodo novi pogoji v operacijah CUODR pripomogli k precejšnji ublažitvi pogojev financiranja, ki določajo ponudbo bančnih posojil podjetjem in gospodinjstvom. Hkrati je Svet ECB zadolžil odbore Eurosistema, da preučijo ukrepe za ublažitev zahtev glede zavarovanja terjatev v teh operacijah, da bi lahko nasprotne stranke še naprej v celoti izkoriščale podporo financiranju s strani ECB.
3. Bistveno je zagotoviti dovolj spodbujevalno naravnano denarno politiko, še posebno v okolju velike negotovosti in povišane finančne volatilnosti. V takšnih razmerah je Svet ECB sklenil tudi, da bo v obdobju do konca leta dodal začasen sveženj dodatnih neto nakupov vrednostnih papirjev v višini 120 milijard EUR, s čimer bo zagotovljen velik prispevek programov nakupa vrednostih papirjev zasebnega sektorja. Še naprej se pričakuje, da se bodo neto nakupi vrednostnih papirjev izvajali tako dolgo, kot bo potrebno, da se okrepi spodbujevalni učinek ključnih obrestnih mer ECB, ter končali, tik preden Svet ECB začne dvigovati ključne obrestne mere ECB. Začasni sveženj bo skupaj z obstoječim programom nakupa vrednostnih papirjev nudil širšo podporo finančnim pogojem ter tako prispeval tudi k znižanju obrestnih mer, ki so pomembne za realno gospodarstvo. Poleg tega bo z višjo ravnijo nakupov zagotovljena močnejša prisotnost Eurosistema na trgu v času povišane volatilnosti, pri čemer lahko pri odzivanju na tržne razmere v polni meri izkoristi fleksibilnost, ki je vgrajena v program nakupa vrednostnih papirjev. To pomeni, da lahko razporeditev nakupov po razredih finančnega premoženja in po državah začasno niha zaradi odzivanja na šoke, ki so posledica umikanja v varne oblike naložb, in na likvidnostne šoke. Takšna odstopanja od statičnega razporejanja nakupov po državah so skladna s pogoji
Ekonomski bilten ECB, številka 2 / 2020
6
programa pod pogojem, da kapitalski ključ dolgoročno še naprej določa skupno stanje Eurosistemovih imetij.
4. Poleg tega je Svet ECB sklenil, da pusti ključne obrestne mere ECB nespremenjene. Predvidoma bodo ostale na sedanji ali nižji ravni tako dolgo, dokler se inflacijski obeti v obdobju projekcij zanesljivo ne približajo ravni, ki je dovolj blizu 2%, vendar pod to mejo, in se takšno približevanje dosledno ne odraža v gibanju osnovne inflacije.
5. In nazadnje, Svet ECB namerava glavnico zapadlih vrednostnih papirjev, kupljenih v okviru programa, še naprej v celoti ponovno investirati, in sicer daljše obdobje po datumu, ko bo začel dvigovati ključne obrestne mere ECB, vsekakor pa tako dolgo, kot bo potrebno, da se vzdržujejo ugodne likvidnostne razmere in zelo spodbujevalno naravnana denarna politika.
Glede na trenutna dogajanja bo Svet ECB še naprej pozorno spremljal posledice širjenja koronavirusa za gospodarstvo, inflacijo v srednjeročnem obdobju in transmisijo denarne politike. Svet ECB je pripravljen, da ustrezno prilagodi vse svoje instrumente in tako v skladu s svojo zavezanostjo simetriji zagotovi, da se inflacija vzdržno giblje proti ciljni ravni.
Obenem je sedaj potrebna ambiciozna in usklajena naravnanost javnofinančnih politik zaradi oslabljenih obetov ter preprečitve nadaljnje uresničitve navzdol usmerjenih tveganj. Svet ECB pozdravlja ukrepe, ki so jih nekatere vlade že sprejele, da bi zdravstvenemu sektorju zagotovile zadostne vire ter nudile podporo prizadetim podjetjem in zaposlenim. Potrebni so zlasti ukrepi, kot je zagotavljanje kreditnih jamstev, ki bodo dopolnjevali in krepili ukrepe denarne politike, ki jih je sprejel Svet ECB.

Ekonomski bilten ECB, številka 2 / 2020
7
Dodatek o sklepih, ki jih je Svet ECB sprejel 18. marca
Pandemija koronavirusa je povzročila izredne razmere na področju javnega zdravja, ki so v novejši zgodovini praktično brez primere. Predstavlja tudi izjemno velik gospodarski šok, ki terja ambiciozno, usklajeno in takojšnje odzivanje politik na vseh frontah. Svet ECB je 18. marca napovedal nov izredni program nakupa vrednostnih papirjev ob pandemiji, da bi obvladoval negotove razmere, ki so v euroobmočju brez primere. Program je začasen in bo omogočil ECB, da ohrani transmisijo denarne politike in navsezadnje njeno sposobnost, da zagotovi cenovno stabilnost v euroobmočju. Gibanja na finančnih trgih so namreč povzročila zaostrovanje pogojev financiranja, zlasti pri daljših ročnostih. Krivulja netvegane obrestne mere se je pomaknila navzgor, krivulja donosnosti državnih vrednostnih papirjev – ki je ključna pri določanju cene vsega finančnega premoženja – pa se je povsod zvišala in je postala bolj razpršena. Svet ECB je sprejel naslednje sklepe, da bi izpolnil svoj mandat.
1. Uvedel je nov začasen program nakupa vrednostnih papirjev zasebnega in javnega sektorja, da bi preprečil resna tveganja za transmisijski mehanizem denarne politike in za gospodarske obete v euroobmočju, ki jih povzroča izbruh in vse hitrejše širjenje COVID-19.
Novi izredni program nakupa vrednostnih papirjev ob pandemiji bo znašal 750 milijard EUR. Nakupi se bodo izvajali do konca leta 2020, vključevali pa bodo vse kategorije finančnega premoženja, ki so primerne v obstoječem programu nakupa vrednostnih papirjev.
Pri nakupih vrednostnih papirjev javnega sektorja bo referenčno razporejanje nakupov po jurisdikcijah še naprej določal kapitalski ključ nacionalnih centralnih bank. Obenem se bodo nakupi v okviru novega izrednega programa ob pandemiji izvajali fleksibilno. S tem bo omogočeno nihanje razporeditve nakupov v času, po razredih finančnega premoženja in po jurisdikcijah.
Pri nakupih v okviru izrednega programa ob pandemiji bo opustitev kriterijev primernosti odobrena za vrednostne papirje, ki jih je izdala grška vlada.
Svet ECB bo neto nakupe v okviru izrednega programa ob pandemiji prenehal izvajati, ko bo ocenil, da je kriza zaradi koronavirusa končana, vsekakor pa ne pred koncem letošnjega leta.
2. V okviru programa nakupa vrednostnih papirjev podjetniškega sektorja je razširil nabor primernega finančnega premoženja na nefinančne komercialne zapise, tako da so za nakup v okviru programa primerni vsi komercialni zapisi zadostne kreditne kvalitete.
3. Ublažil je standarde zavarovanja terjatev s prilagoditvijo glavnih parametrov tveganja v sistemu zavarovanja terjatev. Tako se bo obseg dodatnih bančnih posojil razširil in bo vključeval tudi posojila podjetniškemu sektorju. S tem se bo zagotovilo, da lahko nasprotne stranke še naprej v celoti uporabljajo Eurosistemove operacije refinanciranja.
Ekonomski bilten ECB, številka 2 / 2020
8
Svet ECB je odločen izpolniti svojo vlogo in pomagati vsem državljanom v euroobmočju v teh izredno zahtevnih časih. V ta namen bo ECB zagotovila, da lahko vsi sektorji v gospodarstvu izkoristijo ugodne finančne pogoje, ki jim bodo omogočili, da ublažijo ta šok. To v enaki meri velja za družine, podjetja banke in vlade.
Svet ECB bo v okviru svojega mandata storil vse, kar je potrebno. Svet ECB je povsem pripravljen, da poveča velikost programa nakupa vrednostnih papirjev in da prilagodi njegovo sestavo, za kolikor bi bilo potrebno in za tako dolgo, kot bi bilo potrebno. Upošteval bo vse možnosti in vse nepredvidljive okoliščine, da bi gospodarstvu pomagal prebroditi ta šok.
Ker bi lahko nekatere lastne omejitve ovirale ukrepe, ki jih mora ECB sprejeti, da bi izpolnila svoj mandat, bo Svet ECB presodil, ali je treba te omejitve po potrebi revidirati, da bi bilo ukrepanje sorazmerno s tveganji, s katerimi se soočamo. ECB ne bo tolerirala nobenih tveganj, ki bi lahko ogrozila nemoteno transmisijo denarne politike v vse jurisdikcije v euroobmočju.

Ekonomski bilten ECB, številka 2 / 2020
9
1 Zunanje okolje
Zaradi epidemije koronovirusne bolezni COVID-19 so se obeti za svetovno gospodarstvo, predstavljeni v marčnih makroekonomskih projekcijah strokovnjakov ECB, poslabšali. Dogajanja od presečnega datuma za projekcije kažejo, da se je navzdol usmerjeno tveganje za svetovno aktivnost, povezano z izbruhom te bolezni, deloma že uresničilo, kar pomeni, da bo svetovna aktivnost letos šibkejša, kot je predvideno v projekcijah. Epidemija je svetovno gospodarstvo prizadela ravno v času, ko so se začeli pojavljati znaki stabilizacije aktivnosti in trgovinske menjave, negotovost pa se je zmanjšala zaradi podpisa prve faze trgovinskega sporazuma med ZDA in Kitajsko, ki ga je spremljalo znižanje carin. Po letošnjem letu bo svetovna gospodarska aktivnost predvidoma okrevala, vendar bo le počasi pridobivala zagon. Odvisna bo predvsem od okrevanja v vrsti še vedno ranljivih nastajajočih tržnih gospodarstev, medtem ko bodo na srednji rok gospodarski obeti pod pritiskom zaradi pričakovane ciklične upočasnitve v razvitih gospodarstvih in zaradi strukturnega prehoda kitajskega gospodarstva k nižjim stopnjam rasti. Tveganja za svetovno aktivnost so se spremenila, še vedno pa so zbrana na strani upočasnjevanja rasti. Trenutno je najbolj akutno navzdol usmerjeno tveganje povezano z možnostjo, da bo izbruh koronavirusa imel širše in dolgotrajnejše posledice, saj se razmere ves čas spreminjajo. Svetovni inflacijski pritiski ostajajo omejeni.
Svetovna gospodarska aktivnost in trgovinska menjava
Širjenje koronavirusa je negativno vplivalo na svetovne gospodarske obete. Ker se razmere še vedno vsak dan spreminjajo, je zelo težko oceniti, kako dolgo bodo trajale motnje v proizvodnji in trgovinski menjavi ter kako se bodo na povečano negotovost odzivali potrošniki v različnih delih sveta. Poleg tega je do izbruha prišlo po obdobju šibke svetovne aktivnosti. Svetovna realna rast BDP (brez euroobmočja) je lani upadla na 2,9%, kar je najnižja letna stopnja od velike recesije. Upočasnitev je bila bolj razširjena in močnejša kot v nedavnih preteklih epizodah v obdobjih 2012–2013 in 2015–2016. Povzročila so jo predvsem zaporedna zaostrovanja trgovinskih napetosti, zaradi katerih so podjetja v okolju povečane negotovosti odlagala naložbe, potrošniki pa nakupe trajnih dobrin. To je po drugi strani povzročilo strm upad svetovne predelovalne dejavnosti in trgovinske menjave. Poleg tega so več nastajajočih tržnih gospodarstev prizadeli idiosinkratični šoki, zaradi katerih se je svetovna gospodarska aktivnost lani še dodatno upočasnila. Istočasno so številna ključna razvita in nastajajoča tržna gospodarstva uvedla politike za spodbujanje povpraševanja, s čimer so omejila hitrost in globino globalnega upočasnjevanja rasti v letu 2019.
Izbruh koronavirusa je svetovno gospodarstvo prizadel v času, ko so se začeli pojavljati znaki stabilizacije aktivnosti in trgovinske menjave. Svetovni sestavljeni indeks vodij nabave (PMI) za gospodarsko aktivnost (brez euroobmočja) se je januarja zvišal, k čemur so prispevali boljši rezultati tako v predelovalnem kot tudi v storitvenem sektorju. Močnejša proizvodnja v predelovalnih dejavnostih je nakazovala, da bi se po daljšem obdobju šibkih rezultatov lahko začenjalo okrevanje. To je bilo vidno predvsem v nastajajočih tržnih gospodarstvih, medtem ko so bila gibanja v razvitih gospodarstvih bolj mešana. Ta trend je prekinil izbruh koronavirusa,

Ekonomski bilten ECB, številka 2 / 2020
10
ki so ga kitajske oblasti skušale zajeziti s podaljšanjem praznikov ob lunarnem novem letu in uvedbo stroge karantene v provinci Hubei kot epicentru izbruha. Zaradi teh ukrepov je predelovalna dejavnost na Kitajskem v februarju močno upadla, negativni prelivni učinki pa so se deloma čutili v celotni azijsko-pacifiški regiji, ki je na Kitajsko vezana z dobavnimi verigami in je tudi ena najljubših destinacij kitajskih turistov. Vseeno v februarju verjetno ni prišlo do večjega prelivanja v svetovno gospodarstvo, kot kaže razmeroma stabilen indeks PMI za svetovne predelovalne dejavnosti razen Kitajske (glej graf 1). Kljub temu je mogoče pričakovati dolgotrajnejše in širše posledice za svetovno predelovalno dejavnost v bližnji prihodnosti, saj se proizvodnja na Kitajskem zelo postopno vrača v normalne okvire, številne države pa so sprejele ukrepe za zajezitev širjenja virusa.
Graf 1 Svetovni indeks PMI za predelovalne dejavnosti
(indeksi razpršitve)
Viri: Markit in Haver Analytics. Opomba: Zadnji podatki so za februar 2020.
Po obdobju popuščanja so se svetovni pogoji financiranja v zadnjem času občutno zaostrili. Prejšnje obdobje izboljševanje pogojev financiranja se je začelo po objavi prve faze zgoraj omenjenega trgovinskega sporazuma in je povzročilo odboj tečajev tveganih sredstev. Odboj je bil nenadoma prekinjen sredi februarja, ko so svetovni delniški trgi močno upadli, ker je epidemija koronavirusa še vedno hromila Kitajsko in se širila v druge države. Od presečnega datuma za marčne makroekonomske projekcije strokovnjakov ECB so se svetovni pogoji financiranja izrazito zaostrili tako v razvitih kot tudi v nastajajočih tržnih gospodarstvih, saj je zniževanje netveganih obrestnih mer samo delno odtehtalo globok popravek na delniških trgih in povečanje razmikov pri podjetniških obveznicah. V nastajajočih tržnih gospodarstvih je bila zaostritev manj izrazita kot v prejšnjih obdobjih finančnih pretresov, npr. poleti 2018, saj so devizni tečaji teh držav v odnosu do ameriškega dolarja ostali razmeroma stabilni. To je v glavnem posledica dejanskih in pričakovanih ukrepov ameriške centralne banke za popuščanje denarne politike, ki so tečaj dolarja potiskali navzdol in izravnavali pritisk navzgor, ki so ga ustvarjali prilivi v ameriške državne obveznice kot varno naložbo.
46
48
50
52
54
56
2013 2014 2015 2016 2017 2018 2019 2020
svetovni indekssvetovni indeks brez Kitajske

Ekonomski bilten ECB, številka 2 / 2020
11
V makroekonomskih projekcijah strokovnjakov ECB iz marca 2020 je predvideno, da bo svetovno okrevanje v obdobju projekcij pridobilo zelo malo zagona. Rast svetovne gospodarske aktivnosti brez euroobmočja bo po projekcijah letos dosegla 3,1%, kar je rahlo več, kot je po ocenah znašala v letu 2019 (2,9%). V srednjeročnem obdobju se bo predvidoma rahlo pospešila na 3,5% v letu 2021 in na 3,4% v letu 2022, vendar bo ostala pod dolgoročnim povprečjem (3,8%). V primerjavi z makroekonomskimi projekcijami strokovnjakov Eurosistema iz decembra 2019 je napoved svetovne gospodarske rasti v letu 2020 ostala večinoma nespremenjena, saj popravke navzgor zaradi nižjih carin izravnavajo popravki navzdol v prvem četrtletju 2020 zaradi izbruha koronavirusa na Kitajskem. V marčnih projekcijah so bili srednjeročni obeti za svetovno gospodarstvo odvisni predvsem od okrevanja v vrsti nastajajočih tržnih gospodarstev. Vseeno se ocenjuje, da bo okrevanje v teh državah krhko, med drugim zaradi zunanjih zaviralnih dejavnikov, ki bi skupaj z domačo politično nestabilnostjo lahko bistveno upočasnili okrevanje. Dogajanja od presečnega datuma dejansko kažejo, da se je neposredno navzdol usmerjeno tveganje zaradi učinkov koronavirusa na svetovno gospodarstvo deloma uresničilo. To po drugi strani pomeni, da bo svetovna aktivnost zelo verjetno šibkejša, kot je bilo predvideno v marčnih projekcijah.
Za ZDA je bilo pričakovano, da bo gospodarska aktivnost v bližnji prihodnosti ostala stabilna. Realni BDP je v četrtem četrtletju, preračunano na letno raven, zrasel za 2,1%, kar je enako kot v tretjem četrtletju. Rast potrošnje se je upočasnila bolj, kot je bilo pričakovano, poslovne naložbe v osnovna sredstva pa so upadle že tretje četrtletje zapored. Zaustavitev proizvodnje letala Boeing 737 Max je v prvem četrtletju 2020 predvidoma prizadela aktivnost v predelovalnih dejavnostih. Na daljši rok je bilo pričakovano, da se bo rast upočasnjevala skladno z zorenjem poslovnega cikla in popuščanjem učinkov davčne reforme iz leta 2018. Skupna medletna inflacija, merjena s cenami življenjskih potrebščin, je februarja rahlo upada na 2,3%, z 2,5% mesec prej. Medletna inflacija brez hrane in energentov pa se je z 2,3% v prejšnjih štirih mesecih rahlo zvišala na 2,4%. Po pričakovanjih se bo do konca obdobja projekcij postopno zvišala nad ciljno raven ameriške centralne banke pri 2%. Centralna banka je 3. marca 2020 po izrednem sestanku znižala ključno obrestno mero za 50 bazičnih točk na 1–1,25% in kot razlog navedla tveganja za ameriško gospodarstvo zaradi izbruha koronavirusa. Kasneje so bili za omejitev posledic izbruha za gospodarstvo sprejeti še drugi okrepi, vključno z zagotavljanjem likvidnosti in dodatno proračunsko potrošnjo.
Na Kitajskem se je aktivnost v prvem četrtletju predvidoma močno upočasnila, zatem pa naj bi okrevala. Na srednji rok se bo rast realnega BDP predvidoma še naprej postopno upočasnjevala. Na letni ravni se je tako v letu 2019 že upočasnila na 6,1%, s 6,6% v letu 2018, k čemur je največ prispevala šibkejša dinamika naložb in neto trgovinske menjave. V bližnji prihodnosti bo gibanja obvladoval izbruh koronavirusa, medtem ko bodo nižje carine zaradi trgovinskega sporazuma z ZDA predvidoma podpirale trgovinsko menjavo. Na srednji rok se pričakuje, da bo napredek pri izvajanju strukturnih reform omogočal urejeno upočasnjevanje gospodarske rasti in nekoliko bolj uravnovešena gibanja v kitajskem gospodarstvu. Po podatkih, prejetih po presečnem datumu za projekcije, bi bila upočasnitev v prvem četrtletju lahko močnejša, kot je bilo pričakovano. Poleg tega se proizvodnja v
Ekonomski bilten ECB, številka 2 / 2020
12
normalno stanje vrača bolj postopno, kar kaže, da bi okrevanje aktivnosti lahko trajalo dlje, kot je pričakovano v marčnih projekcijah. Od začetka izbruha koronavirusa so bili na Kitajskem sprejeti številni ukrepi gospodarske politike, med drugim bolj spodbujevalno naravnana denarna politika in dodatna javnofinančna poraba.
Na Japonskem se je gospodarska aktivnost v četrtem četrtletju močno skrčila, saj jo je hkrati prizadelo več negativnih šokov, med drugim upad domačega povpraševanja zaradi zvišanja davka na potrošnjo, motnje proizvodnje zaradi silovitih tajfunov v oktobru in šibko zunanje povpraševanje. Negativni prelivni učinki zaradi izbruha koronavirusa na Kitajskem, ki je japonsko gospodarstvo prizadel predvsem zaradi upada turističnih prihodkov v času lunarnih novoletnih praznikov bodo skupaj z zgodnjimi znaki možnih motenj v dobavnih verigah predvidoma zavirali gospodarsko aktivnost v prvem četrtletju. Poleg tega so japonske oblasti sprejele vrsto ukrepov za zajezitev širjenja koronavirusa, kar bo skupaj z previdnejšim vedenjem potrošnikov po pričakovanjih obremenjevalo gospodarsko aktivnost. Japonske oblasti so se na to odzvale z dvema svežnjema izrednih javnofinančnih ukrepov, vključno z ukrepi za pomoč malim in srednje velikim podjetjem. Japonska centralna banka je sporočila, da pozorno spremlja dogajanja in je pripravljena zagotoviti likvidnost in vzdrževati stabilnost na finančnih trgih. Fiskalne spodbude, ki so jih japonske oblasti napovedale konec leta 2019, bodo predvidoma podpirale rast v obdobju 2020–2021.
V Združenem kraljestvu je aktivnost v prvem četrtletju predvidoma okrevala. Vseeno bodo gospodarski učinki koronavirusa verjetno v drugem četrtletju povzročili novo upočasnitev. Rast realnega BDP je v četrtem četrtletju 2019 ostala enaka kot v tretjem, kar kaže, da osnovni zagon še naprej popušča, nadaljuje pa se tudi širše upočasnjevanje, ki traja od referenduma v letu 2016. Domače povpraševanje je v drugi polovici leta 2019 precej upadlo, med drugim zaradi negotovosti v zvezi z brexitom in predvolilne kampanje v zadnjem četrtletju lanskega leta. Čeprav se je razpoloženje po jasnem izidu splošnih volitev in kasnejši odločitvi o urejenem izstopu iz EU konec januarja precej popravilo, pa močan obrat v letu 2020 ni bil pričakovan niti pred izbruhom koronavirusa, saj so prihodnji trgovinski odnosi med Združenim kraljestvom in EU še vedno negotovi. V odgovor na koronavirus je britanska centralna banka znižala ključno obrestno mero za 50 bazičnih točk na 0,25% in uvedla program posojanja, ki je izrecno usmerjen na mala in srednje velika podjetja, medtem ko je v predlaganem osnutku proračuna predvidenih več javnofinančnih ukrepov za boj proti gospodarskim posledicam virusa.
V državah srednje in vzhodne Evrope se je gospodarska aktivnost predvidoma upočasnila s stopenj rasti, ki so bile nad potencialno. Ta umiritev odraža predvsem počasnejšo rast naložb zaradi poznejše faze v ciklu sredstev EU, medtem ko potrošnjo gospodinjstev verjetno podpirajo ugodna gibanja na trgu dela.
Za gospodarsko aktivnost v velikih izvoznicah surovin je bilo pričakovano, da se bo letos nekoliko okrepila. V Rusiji se je gospodarska aktivnost tekom leta 2019 povečala in naj bi se zaradi dodatnih izdatkov za socialne zahteve, ki jih je odobrila nova vlada, predvidoma še naprej izboljševala. Vseeno še vedno obstajajo velika navzdol usmerjena tveganja, tako da so gospodarski obeti spričo globalnega širjenja koronavirusa, nedavnega propada dogovora OPEC+ in strmega upada cen nafte nenavadno negotovi. Srednjeročni obeti so odvisni predvsem od negotovosti glede

Ekonomski bilten ECB, številka 2 / 2020
13
dodatnih mednarodnih sankcij ter od prednostnih nalog nedavno imenovane vlade. Napoved rasti BDP v bližnji prihodnosti je bila nedavno popravljena navzgor, in sicer predvsem zaradi večje javnofinančne porabe. V Braziliji se je razpoloženje v četrtem četrtletju začelo popravljati. Rast vseeno ostaja nizka zaradi velikih javnofinančnih omejitev (vključno z zamrznitvijo več segmentov proračunske porabe) in negotovega zunanjega okolja, ki se je zaradi hitrega širjenja koronavirusa v zadnjem času še poslabšalo. Na srednji rok bo rast zelo odvisna od tega, v kolikšni meri bodo izvedene dodatne nujne javnofinančne reforme. Obenem ostajajo javnofinančna neravnovesja tudi glavni vir tveganj, če ne bodo uspešno odpravljena. Če bo vlada spoštovala javnofinančna pravila, kot so omejitve izdatkov, je zato manj verjetno, da bo uvedla velike javnofinančne spodbude.
V Turčiji aktivnost še naprej okreva po nedavni s krizo povezani recesiji. Realna rast BDP se je v tretjem četrtletju na letni ravni vrnila v pozitivno območje in se v četrtem četrtletju še dodatno okrepila. Ekspanzivna javnofinančna politika in hitra kreditna rast sta poganjali robustno rast potrošnje gospodinjstev in odboj zasebnih naložb, ki so pred tem dosegle najnižjo točko. Ta dva dejavnika bosta rast predvidoma spodbujala tudi v letošnjem letu. Vseeno so stopnje rasti dolgoročno gledano še naprej razmeroma nizke, kar je posledica oslabljenega potenciala gospodarstva.
Proti koncu leta 2019 so se pokazali znaki stabilizacije svetovne trgovinske menjave. Svetovni uvoz je bil močnejši kot pričakovano, k čemur je največ prispevala hitra rast uvoza v Turčijo, na Kitajsko in v druga nastajajoča tržna gospodarstva. Nasprotno je bila v razvitih gospodarstvih rast uvoza v četrtem četrtletju 2019 šibkejša od pričakovane, kar je zlasti posledica vrste idiosinkratičnih šokov, ki bodo v bližnji prihodnosti predvidoma izginili. Tako se je na Japonskem rast uvoza upočasnila zaradi krčenja domačega povpraševanja po zvišanju davka na potrošnjo in zaradi posledic silovitega tajfuna, v Združenem kraljestvu in ZDA pa zaradi praznjenja prej nakopičenih zalog. Različna gibanja trgovinske menjave v razvitih in nastajajočih tržnih gospodarstvih so vidna tudi v podatkih o trgovinski blagovni menjavi. Na skupni ravni se je svetovni blagovni uvoz v četrtem četrtletju 2019 skrčil za 0,7% (glej graf 2). Pričakuje se, da bo izbruh koronavirusa upočasnil stabilizacijo svetovne trgovinske menjave in najbolj zaviral gibanja v predelovalnih dejavnostih, kot kažejo tudi najnovejši anketni podatki. Ker se virus še naprej širi po svetu, bo na trgovinsko menjavo vplival bolj, kot je predvideno v marčnih projekcijah.

Ekonomski bilten ECB, številka 2 / 2020
14
Graf 2 Ankete in svetovna blagovna menjava (brez euroobmočja)
(lestvica na levi strani: 3-mesečne spremembe v odstotkih glede na prejšnje 3 mesece; lestvica na desni strani: indeksi razpršitve)
Viri: Markit, CPB Netherlands Bureau for Economic Policy Analysis in izračuni ECB. Opomba: Zadnji podatki so za februar 2020 za indeksa PMI in za december 2019 za svetovni uvoz blaga. Indeksa in podatki se nanašajo na svetovni agregat brez euroobmočja.
Nedavni podpis prve faze trgovinskega sporazuma med ZDA in Kitajsko prinaša nekaj predaha v trgovinskih napetostih. S sporazumom sta obe državi znižali dvostranske carine, Kitajska pa se je zavezala, da bo v prihodnjih dveh letih od ZDA kupila za dodatnih 200 milijard USD blaga in storitev. Ta delna sprostitev trgovinskega spora podpira okrevanje svetovne aktivnosti v predelovalnih dejavnostih in trgovinski menjavi, vseeno pa negotovost glede prihodnjega razvoja svetovnih trgovinskih politik ostaja velika.
Dolgoročno gledano ostajajo obeti za svetovno trgovinsko menjavo dokaj skromni, saj bo trgovinska elastičnost prihodkov predvidoma ostala pod 1, ki je »novo normalno« stanje.2 To je posledica kombinacije dejavnikov, med katerimi so denimo višje carine, ki so bile uvedene doslej, ter povečana negotovost glede politik. Po marčnih makroekonomskih projekcijah strokovnjakov ECB se bo svetovna rast uvoza (brez euroobmočja) z lanskih 0,3% postopno zvišala na 1,4% v letu 2020, nato pa naj bi se leta 2021 okrepila na 2,6% in leta 2022 na 2,7%. Zunanje povpraševanje po izvozu euroobmočja se bo letos predvidoma povečalo za 1,6%, nato pa v letu 2021 še za 2,5% in v letu 2022 za 2,6%. Čeprav je bila napoved zunanjega povpraševanja euroobmočja za leto 2020 popravljena navzgor glede na decembrske makroekonomske projekcije strokovnjakov Eurosistema, je ta popravek predvsem posledica pozitivnih presenečenj v drugi polovici leta 2019 ter večjega dvostranskega uvoza med ZDA in Kitajsko zaradi nižjih uvoznih carin, uvedenih v skladu s prvo fazo trgovinskega sporazuma. Ker te carine podpirajo zlasti dvostransko trgovino med tema dvema državama, v njih ne gre videti signala, da se bo povpraševanje po blagu in storitvah iz euroobmočja povečalo. Ob upoštevanju teh dejavnikov se v marčnih projekcijah predvideva, da bo zunanje povpraševanje letos in prihodnje leto večinoma enako, kot je bilo predvideno v decembrskih projekcijah. Dogajanja po presečnem
2 Glej npr. IRC Trade Task Force, »Understanding the weakness in global trade – What is the new
normal?«, Occasional Paper Series, št. 178, ECB, september 2016.
42
44
46
48
50
52
54
56
58
-4
-3
-2
-1
0
1
2
3
4
2013 2014 2015 2016 2017 2018 2019 2020
svetovni uvoz blaga (lestvica na levi strani)povprečni svetovni uvoz blaga, 1991–2019 (lestvica na levi strani)svetovni PMI, predelovalne dejavnosti (lestvica na desni strani)svetovni PMI, nova izvozna naročila (lestvica na desni strani)

Ekonomski bilten ECB, številka 2 / 2020
15
datumu za projekcije nakazujejo, da bo pandemija koronavirusa negativno vplivala na svetovno trgovinsko menjavo in s tem tudi na zunanje povpraševanje euroobmočja. To pomeni, da bosta svetovni uvoz in povpraševanje po izvozu euroobmočja šibkejša, kot je predvideno v marčnih makroekonomskih projekcijah strokovnjakov ECB.
Tveganja za svetovno gospodarsko aktivnost so se spremenila, še vedno pa se nagibajo k upočasnjevanju aktivnosti. Novo in trenutno najbolj akutno navzdol usmerjeno tveganje je povezano z možnostjo, da bodo posledice pandemije koronavirusa širše in bodo trajale dalj časa. Gibanja v svetovnem gospodarstvu od presečnega datuma za projekcije nakazujejo, da se je to tveganje deloma že uresničilo.3 Navzdol usmerjena tveganja zaradi trgovinskih napetosti so se po prvi fazi trgovinskega sporazuma nekoliko zmanjšala, kljub temu pa negotovost glede prihodnjega poteka svetovnih trgovinskih politik ostaja povišana. Tveganje brexita brez dogovora je bilo odloženo do konca leta in bo odvisno od izida pogajanj med Združenim kraljestvom in EU glede njunih prihodnih odnosov. Poleg tega bo večjo upočasnitev kitajskega gospodarstva morda vedno težje izravnavati s spodbudami državnih politik, kar bi lahko oteževalo proces iskanja novega ravnovesja na Kitajskem. Prilagajanje cen na svetovnih finančnih trgih bi lahko zaviralo svetovno aktivnost, še zlasti v nastajajočih tržnih gospodarstvih.
Svetovna cenovna gibanja
Cene nafte so se močno znižale, saj se je spričo napredovanja epidemije povečala zaskrbljenost glede svetovnega povpraševanja. Nesoglasja med članicami skupine OPEC+ glede zmanjšanja proizvodnje so ta upad še poglobila. Na začetku so cene nafte najbolj prizadele novice o izbruhu koronavirusa na Kitajskem proti koncu januarja. Nato so se cene za kratek čas ponovno nekoliko zvišale, a začele ponovno upadati, ko se je virus začel širiti po svetu. V začetku marca je zveza OPEC+, ki združuje države OPEC in nekatere druge večje proizvajalke nafte, razpadla, ker Rusija ni želela spoštovati dogovora o zmanjšanju proizvodnje. Saudova Arabija je na to odgovorila z napovedjo, da bo povečala proizvodnjo in nafto ponujala s popustom, da bi povečala svoj tržni delež. To je povzročilo največji enodnevni padec cen nafte doslej.
V marčnih makroekonomskih projekcijah strokovnjakov ECB je predvideno, da bodo cene nafte v obdobju projekcij ostale razmeroma stabilne. Zaradi zniževanja promptnih cen se je kratki del krivulje terminskih cen nafte premaknil navzdol glede na daljši del, tako da je krivulja v obdobju projekcij postala bolj položna. V primerjavi z decembrskimi projekcijami je v marčnih predvideno, da bodo cene nafte v letu 2020 nižje za 5,5%, v letu 2021 za 3,2%, v letu 2022 pa za 2,5%. Po presečnem datumu za marčne projekcije se je cena nafte močno znižala in 11. marca znašala 34,5 USD za sod surove nafte Brent.
Svetovna inflacija ostaja nizka, kar odraža trenutno dinamiko rasti. V državah OECD se je skupna medletna inflacija, merjena s cenami življenjskih potrebščin,
3 Za nadaljnje podrobnosti o različnih scenarijih v zvezi s tveganji glej okvir 3 v makroekonomskih
projekcijah strokovnjakov ECB za euroobmočje, marec 2020.

Ekonomski bilten ECB, številka 2 / 2020
16
decembra 2019 zvišala na 2,1%, medtem ko je novembra znašala 1,8% (glej graf 3). Medletna inflacija v skupini energentov je decembra zrasla nad nič, potem ko je bila štiri mesece zapored v negativnem območju, cene hrane pa so ostale razmeroma stabilne. Osnovna inflacija (brez hrane in energentov) je glede na mesec prej ostala nespremenjena na ravni 2,1%.
Graf 3 Inflacija, merjena s cenami življenjskih potrebščin, v državah OECD
(medletne spremembe v odstotkih; prispevki v odstotnih točkah)
Viri: OECD in izračuni ECB. Opomba: Zadnji podatki se nanašajo na januar 2020.
-1,5
-1,0
-0,5
0,0
0,5
1,0
1,5
2,0
2,5
3,0
3,5
2013 2014 2015 2016 2017 2018 2019 2020
prispevek energentovprispevek hraneprispevek vseh komponent razen hrane in energentovinflacija brez hrane in energentovinflacija z vsemi komponentami

Ekonomski bilten ECB, številka 2 / 2020
17
2 Finančna gibanja
Ko se je ob koncu obravnavanega obdobja (od 12. decembra 2019 do 11. marca 2020) po svetu razširil koronavirus (COVID-19), se je dojemanje tveganj globalno strmo poslabšalo, volatilnost na trgih pa je poskočila. Dolgoročne netvegane obrestne mere so se v euroobmočju izrazito zmanjšale na raven, ki je bistveno nižja kakor na začetku obdobja, razponi med državnimi obveznicami v euroobmočju pa so se proti koncu obravnavanega obdobja občutno povečali. Krivulja terminskih obrestnih mer EONIA (povprečja indeksa transakcij čez noč v eurih) se je premaknila strmo navzdol, vbočenost krivulje pri krajših do srednjih ročnostih pa nakazuje, da so trgi vračunali nadaljnjo okrepitev spodbujevalne naravnanosti denarne politike. V skladu z velikim svetovnim povečanjem nenaklonjenosti k prevzemanju tveganj so se tečaji delnic v euroobmočju močno zmanjšali, razmiki v donosnosti državnih in podjetniških obveznic pa so se povečali. Na volatilnih deviznih trgih se je euro bistveno okrepil v razmerju do valut 38 najpomembnejših trgovinskih partneric euroobmočja.
Donosnost dolgoročnih državnih obveznic se je v euroobmočju v celoti in po svetu ob visoki volatilnosti precej zmanjšala (glej graf 4). Gibanja povprečne donosnosti državnih obveznic euroobmočja bi lahko razdelili na tri ločene faze. Od 12. decembra 2019 do sredine januarja 2020 se je donosnost rahlo povečala ob boljšem svetovnem dojemanju tveganj in ob ocenah, da so makroekonomski kazalniki dosegli najnižjo točko. V drugi fazi, do 21. februarja 2020, se je dojemanje tveganj zaradi novic v zvezi s koronavirusom in zaradi makroekonomskih podatkov, ki so bili slabši od pričakovanih, začelo poslabševati, donosnost državnih obveznic pa se je začela v povprečju zmanjševati. V zadnji fazi se je donosnost državnih obveznic še precej zmanjšala, ko se je začel koronavirus širiti po svetu ter je zaskrbljenost glede ekonomskih in družbenih posledic začela pretresati svetovne finančne trge. V celotnem obravnavanem obdobju se je donosnost 10-letnih državnih obveznic euroobmočja, tehtana z BDP, zmanjšala za 33 bazičnih točk in postala ponovno negativna (–0,12%). Donosnost 10-letnih državnih obveznic se je zmanjšala tudi v ZDA, in sicer za 102 bazični točki na 0,88%, in v Združenem kraljestvu za 54 bazičnih točk na 0,27%, kar je zlasti posledica zaskrbljenosti zaradi koronavirusa in pričakovanih odzivov denarne politike v povezavi z umikanjem k varnim naložbam v netvegano finančno premoženje.

Ekonomski bilten ECB, številka 2 / 2020
18
Graf 4 Donosnost 10-letnih državnih obveznic
(v odstotkih na leto)
Viri: Thomson Reuters in izračuni ECB. Opombe: Dnevni podatki. Navpična siva črta označuje začetek obravnavanega obdobja (12. december 2019). Zadnji podatki se nanašajo na 11. marec 2020.
V skladu s spreminjanjem dojemanja tveganj so se razmiki državnih obveznic euroobmočja glede na obrestno mero v zamenjavah na indeks transakcij čez noč v številnih državah povečali, z izjemo Nemčije (glej graf 5). Razmiki 10-letnih grških, italijanskih, portugalskih in španskih državnih obveznic so se povečali za 45, 25, 15 oziroma 32 bazičnih točk ter dosegli 1,87, 1,64, 0,77 oziroma 0,67 odstotne točke. Nasprotno so se razmiki 10-letnih nemških državnih obveznic zmanjšali za 10 bazičnih točk na –0,32 odstotne točke, medtem ko so ostali v Franciji na splošno stabilni na ravni 0,08 odstotne točke. Razmik v donosnosti državnih obveznic euroobmočja, tehtan z BDP, se je povečal za 5 bazičnih točk na 0,31 odstotne točke.
-1,0
-0,5
0,0
0,5
1,0
1,5
2,0
2,5
3,0
3,5
01.15 07.15 01.16 07.16 01.17 07.17 01.18 07.18 01.19 07.19 01.20
povprečje euroobmočja, tehtano z BDPZdruženo kraljestvoZDANemčija

Ekonomski bilten ECB, številka 2 / 2020
19
Graf 5 Razmiki v donosnosti 10-letnih državnih obveznic euroobmočja glede na obrestno mero v obrestnih zamenjavah na indeks transakcij čez noč
(v odstotnih točkah)
Viri: Thomson Reuters in izračuni ECB. Opombe: Razmik je izračunan kot razlika med donosnostjo 10-letnih državnih obveznic in obrestno mero v 10-letnih obrestnih zamenjavah na indeks transakcij čez noč. Navpična siva črta označuje začetek obravnavanega obdobja (12. december 2019). Zadnji podatki se nanašajo na 11. marec 2020.
EONIA in nova referenčna eurska kratkoročna obrestna mera (€STR) sta v obravnavanem obdobju v povprečju znašali –45 oziroma –54 bazičnih točk.4 Presežna likvidnost se je v obravnavanem obdobju rahlo zmanjšala za okrog 22 milijard EUR na okoli 1.770 milijard EUR. Ta sprememba je zlasti posledica prostovoljnih odplačil sredstev iz druge serije ciljno usmerjenih operacij dolgoročnejšega refinanciranja (CUODR II) in v manjši meri povečanja avtonomnih dejavnikov umikanja likvidnosti, ki so odtehtali povečano likvidnost zaradi ponovnega začetka izvajanja Eurosistemovih neto nakupov vrednostnih papirjev dne 1. novembra 2019.
Krivulja terminskih obrestnih mer EONIA se je do konca obravnavanega obdobja premaknila navzdol in se preobrnila pri krajših do srednjih ročnostih (glej graf 6). Medtem ko je bila v začetku krivulja pri krajših do srednjih ročnostih praktično položna, je ob koncu obravnavanega obdobja sredi maja 2020 dosegla -0,60%, aprila 2021 pa najnižjo vrednost na ravni -0,72%. Kljub znižanju ostaja krivulja terminskih obrestnih mer EONIA nad ravnmi, zabeleženimi poleti 2019. Udeleženci na trgu na splošno še naprej pričakujejo, da bo obdobje nizkih in negativnih obrestnih mer dolgotrajno.
4 Metodologija za izračun obrestne mere EONIA se je 2. oktobra 2019 spremenila, tako da se ta zdaj
izračunava kot obrestna mera €STR, ki se ji doda fiksni pribitek 8,5 bazične točke. Glej okvir z naslovom »Goodbye EONIA, welcome €STR!«, Economic Bulletin, številka 7, ECB, 2019.
-1,0
-0,5
0,0
0,5
1,0
1,5
2,0
2,5
3,0
3,5
4,0
01.15 07.15 01.16 07.16 01.17 07.17 01.18 07.18 01.19 07.19 01.20
povprečje euroobmočja, tehtano z BDPNemčijaFrancijaItalijaŠpanijaPortugalska

Ekonomski bilten ECB, številka 2 / 2020
20
Graf 6 Terminske obrestne mere EONIA
(v odstotkih na leto)
Viri: Thomson Reuters in izračuni ECB.
Tečaji delnic v euroobmočju so se ob koncu februarja začeli močno zmanjševati zaradi višjih premij za tveganje (glej graf 7). Tečaji delnic v euroobmočju in po svetu so v prvem delu obravnavanega obdobja še rasli in v nekaterih segmentih trga dosegli nove najvišje vrednosti. Ob koncu januarja so trgi delnic utrpeli začetno in kratkotrajno zmanjšanje, ko se je začela krepiti zaskrbljenost zaradi koronavirusa, ki je bila omejena predvsem na Kitajsko. Nazadnje so tečaji delnic povsod strmo padli, ko se je koronavirus razširil iz Kitajske, proti koncu februarja pa sta se vzporedno povečali nenaklonjenost tveganju in negotovost. Cene lastniških vrednostnih papirjev nefinančnih družb v euroobmočju so se od 21. februarja do 11. marca 2020 zmanjšale za 19%, cene lastniških vrednostnih papirjev bank pa za 30%. V ZDA so se cene lastniških vrednostnih papirjev nefinančnih družb zmanjšale za 12%, cene lastniških vrednostnih papirjev bank pa za 36%. Implicitna volatilnost delniškega trga v euroobmočju in po svetu se je močno povečala.
-0,75
-0,50
-0,25
0,00
0,25
0,50
2019 2020 2021 2022 2023 2024 2025 2026 2027
11. marec 202012. december 2019

Ekonomski bilten ECB, številka 2 / 2020
21
Graf 7 Delniški indeksi v euroobmočju in ZDA
(indeks: 1. januar 2015 = 100)
Viri: Thomson Reuters in izračuni ECB. Opombe: Navpična siva črta označuje začetek obravnavanega obdobja (12. december 2019). Zadnji podatki se nanašajo na 11. marec 2020.
Potem ko so bili nekaj časa razmeroma stabilni, so se razmiki v donosnosti obveznic finančnih in nefinančnih družb v euroobmočju močno povečali proti koncu februarja, ko se je koronavirus razširil iz Kitajske (glej graf 8). Razmik v donosnosti obveznic nefinančnih družb naložbenega razreda in obveznic finančnega sektorja glede na netvegano obrestno mero se je od 21. februarja 2020 povečal za 42 bazičnih točk na 104 bazične točke oziroma za 53 bazičnih točk na 127 bazičnih točk. Povečanje je bilo posledica poslabšanja dojemanja tveganj, ki se je pokazalo tudi na trgu lastniškega kapitala. Hkrati so ostale bonitetne ocene in pričakovana pogostost neplačila na splošno nespremenjene.
Graf 8 Razmiki v donosnosti podjetniških obveznic v euroobmočju
(v bazičnih točkah)
Viri: indeksi Markit iBoxx in izračuni ECB. Opombe: Razmiki so izračunani kot razlika med obrestno mero v poslih zamenjave in netvegano obrestno mero. Indeksi obsegajo obveznice različnih ročnosti (vendar s preostalo ročnostjo vsaj enega leta) z bonitetno oceno naložbenega razreda. Navpična siva črta označuje začetek obravnavanega obdobja (12. december 2019). Zadnji podatki se nanašajo na 11. marec 2020.
25
50
75
100
125
150
175
01.15 07.15 01.16 07.16 01.17 07.17 01.18 07.18 01.19 07.19 01.20
banke v euroobmočjunefinančne družbe v euroobmočjubanke v ZDAnefinančne družbe v ZDA
0
20
40
60
80
100
120
140
160
01.15 07.15 01.16 07.16 01.17 07.17 01.18 07.18 01.19 07.19 01.20
razmiki v donosnosti obveznic finančnih družbrazmiki v donosnosti obveznic nefinančnih družb

Ekonomski bilten ECB, številka 2 / 2020
22
Na deviznih trgih je euro, tehtano z utežmi trgovinskih partneric, ob povečani volatilnosti precej apreciiral (glej graf 9). Nominalni efektivni tečaj eura, merjen v razmerju do valut 38 najpomembnejših trgovinskih partneric euroobmočja, se je v obravnavanem obdobju povečal za 2,6%. Kar zadeva gibanje dvostranskih deviznih tečajev, se je euro močno okrepil v primerjavi z ameriškim dolarjem (za 1,8%), čeprav se je to zgodilo v okolju povečane volatilnosti. Ameriški dolar se je okrepil v prvi polovici februarja, deloma zaradi večje negotovosti zaradi svetovnih gospodarskih obetov, vendar je začel proti koncu februarja slabeti zaradi pričakovanega rahljanja denarne politike v ZDA, to pa se je nadaljevalo tudi potem, ko je ameriška centralna banka v začetku marca znižala obrestno mero in so postajale novice o koronavirusu vse slabše. Euro je hkrati močno apreciiral v razmerju do britanskega funta (za 3,7%) in se okrepil tudi v razmerju do večine drugih valut, vključno z valutami držav članic, ki niso članice euroobmočja, ter valut večjih nastajajočih tržnih gospodarstev. Precej je oslabel v razmerju do švicarskega franka (za 3,2%) in japonskega jena (za 2,0%), kar je skladno z zmanjševanjem nagnjenosti k prevzemanju tveganj.
Graf 9 Spremembe tečaja eura v razmerju do izbranih valut
(v odstotkih)
Vir: ECB. Opombe: EDT-38 je nominalni efektivni tečaj eura v razmerju do valut 38 najpomembnejših trgovinskih partneric euroobmočja. Pozitivna (negativna) sprememba pomeni apreciacijo (depreciacijo) eura. Vse spremembe so izračunane na podlagi tečajev na dan 11. marca 2020.
-8 -4 0 4 8 12 16 20 24
hrvaška kunaindijska rupijabrazilski real
tajvanski dolarromunski lev
danska kronamadžarski forint
indonezijska rupijajužnokorejski won
turška liraruski rubelj
švedska kronačeška krona
poljski zlotjaponski jen
švicarski frankbritanski funt
ameriški dolarkitajski renminbi
EDT-38
od 12. decembra 2019od 11. marca 2019

Ekonomski bilten ECB, številka 2 / 2020
23
3 Gospodarska aktivnost
Realna rast BDP v euroobmočju je zaradi šibke aktivnosti v predelovalnih dejavnostih in upočasnjevanja rasti naložb v zadnjem četrtletju 2019 ostala nizka (medčetrtletno 0,1%), potem ko je v četrtletju prej dosegla 0,3%. Najnovejši ekonomski podatki in informacije iz anket kažejo na dinamiko rasti v euroobmočju, ki je na nizki ravni. Vendar še ne odražajo v celoti gibanj, povezanih s koronavirusom (COVID-19), ki se je konec februarja začel širiti po celinski Evropi in je negativno vplival na gospodarsko aktivnost. Če odmislimo motnje, ki izhajajo iz širjenja koronavirusa, naj bi rast srednjeročno pridobila zagon ob podpori ugodnih pogojev financiranja, naravnanosti fiskalne politike v euroobmočju in pričakovane ponovne rasti svetovne gospodarske aktivnosti. Po letošnjih marčnih makroekonomskih projekcijah strokovnjakov ECB za euroobmočje bo medletna realna rast BDP znašala 0,8% leta 2020, 1,3% leta 2021 in 1,4% leta 2022. V primerjavi z makroekonomskimi projekcijami strokovnjakov Eurosistema iz decembra 2019 je bila projekcija realne rasti BDP za leto 2020 popravljena navzdol za 0,3 odstotne točke zlasti zaradi izbruha koronavirusa, za leto 2021 pa za 0,1 odstotne točke, čeprav je hitro širjenje koronavirusa v euroobmočju v zadnjem času le delno upoštevano. Tveganja, ki spremljajo gospodarske obete v euroobmočju, so torej nedvomno na strani nižje rasti. Širjenje koronavirusa je poleg tveganj, povezanih z geopolitičnimi dejavniki, naraščanjem protekcionizma in ranljivostmi v nastajajočih tržnih gospodarstvih, nov in precej velik vir tveganja, ki obeta upočasnjevanje rasti.
Gospodarska rast v euroobmočju se je v zadnjem četrtletju 2019 umirila, ker aktivnost v predelovalnih dejavnostih ostajajo šibka. BDP se je v zadnjem četrtletju 2019 realno medčetrtletno zvišal za 0,1% v primerjavi z 0,3% v četrtletju prej (glej graf 10). Oslabljena rast v zadnjem četrtletju je bila posledica močnega krčenja aktivnosti v predelovalnih dejavnostih, za storitvene dejavnosti in gradbeništvo pa je bila še naprej značilna vztrajnejša dinamika. Domače povpraševanje je pozitivno prispevalo k rasti (1,0 odstotne točke), neto izvoz in spremembe zalog pa so prispevale negativno (0,8 oziroma 0,1 odstotne točke). Na splošno je gospodarska rast v zadnjem četrtletju privedla do letne rasti BDP v višini 1,2% v letu 2019, medtem ko je leta 2018 znašala 1,9%.

Ekonomski bilten ECB, številka 2 / 2020
24
Graf 10 Realni BDP in komponente v euroobmočju
(medčetrtletne spremembe v odstotkih; četrtletni prispevek v odstotnih točkah)
Viri: Eurostat in izračuni ECB. Opombe: Zadnji podatki se nanašajo na zadnje četrtletje 2019.
Zaposlenost je v zadnjem četrtletju 2019 še naprej naraščala, in sicer za 0,3% glede na četrtletje prej (glej graf 11). Zaposlenost se je povečala v večini držav euroobmočja, vendar je bila bolj skoncentrirana v gradbeništvu in storitvenih dejavnostih. Stopnja zaposlenosti je trenutno skoraj 4,3% nad najvišjo predkrizno vrednostjo, doseženo v prvem četrtletju 2008. Zaposlenost v euroobmočju kumulativno raste, če upoštevamo zadnje povečanje, saj ima zdaj zaposlitev 12,0 milijona ljudi več kot v drugem četrtletju 2013, ko je zaposlenost dosegla najnižjo točko. Pozitivno gibanje rasti zaposlenosti v zadnjem četrtletju 2019 je v nasprotju z okoljem šibkejše realne aktivnosti, produktivnost dela na zaposlenega pa se je zmanjšala za 0,2%. Višja rast zaposlenosti v euroobmočju od pričakovane bi bila lahko skladna tudi z vztrajnim delovno intenzivnejšim domačim povpraševanjem v primerjavi s šibkejšo rastjo v delovno manj intenzivnem izvoznem sektorju.
Kljub doslej stabilnim novejšim kratkoročnim kazalnikom na trgu dela v prvem četrtletju 2020 ostaja kratkoročna dinamika zaposlenosti odvisna od vpliva koronavirusa. Stopnja brezposelnosti v euroobmočju je januarja 2020 znašala 7,4%, torej je bila nespremenjena od zadnjega četrtletja 2019, in ostala na najnižji ravni od julija 2008. Anketni kazalniki kažejo, da se bo v prvem četrtletju 2020 zaposlenost še povečala, sestavljeni indeks vodij nabave (PMI) za zaposlenost pa ostaja februarja 2020 na splošno stabilen na ravni 51,4, potem ko je znašal 51,4 januarja 2020 in 51,3 v zadnjem četrtletju 2019.
-1,5
-1,0
-0,5
0,0
0,5
1,0
1,5
2,0
Q1 Q2 Q3 Q4 Q1 Q2 Q3 Q4 Q1 Q2 Q3 Q4 Q1 Q2 Q3 Q4 Q1 Q2 Q3 Q4 Q1 Q2 Q3 Q4 Q1 Q2 Q3 Q4
2013 2014 2015 2016 2017 2018 2019
BDP po tržnih cenahzasebna potrošnjadržavna potrošnjabruto investicije v osnovna sredstvaneto izvozspremembe zalog

Ekonomski bilten ECB, številka 2 / 2020
25
Graf 11 Zaposlenost, pričakovano zaposlovanje po PMI in brezposelnost v euroobmočju
(medčetrtletne spremembe v odstotkih, difuzijski indeks, odstotek delovne sile)
Viri: Eurostat, Markit in izračuni ECB. Opombe: Indeks vodij nabave (PMI) je izražen kot odstopanje od 50, deljeno z 10. Zadnji podatki se nanašajo na zadnje četrtletje 2019 za zaposlenost, na februar 2020 za PMI in januar 2020 za stopnjo brezposelnosti.
Zasebna potrošnja je v zadnjem četrtletju 2019 še naprej rasla, čeprav počasneje kakor v četrtletju prej. Zasebna potrošnja se je v zadnjem četrtletju 2019 medčetrtletno povečala za 0,1%, potem ko je bila rast v tretjem četrtletju nekoliko močnejša. Novejši nižji izdatki gospodinjstev so deloma posledica decembrskih sezonskih gibanj. Rast zaposlenosti se v zadnjem četrtletju 2019 povečala v okolju močnega zvišanja plač. To prinaša stabilno rast realnega razpoložljivega dohodka gospodinjstev ter povečuje zaupanje potrošnikov in potrošnjo. Poleg tega so pogoji financiranja še vedno zelo ugodni, zato se je neto vrednost gospodinjstev v tretjem četrtletju 2019 povečala.
Razpoložljivi kratkoročni kazalniki nakazujejo vztrajno rast zasebne potrošnje na začetku leta 2020, vendar je to odvisno od širjenja koronavirusa v Evropi. Zadnji podatki o prodaji v trgovini na drobno kažejo zmerno, toda stabilno rast zasebne potrošnje, z nekaj volatilnosti okoli novega leta. Obseg prodaje v trgovini na drobno se je po zmanjšanju za 1,1% v decembru 2019 januarja 2020 povečal za 0,6%. Poleg tega se je zaupanje potrošnikov februarja 2020 povečalo že drugi mesec zapored. Novejše izboljšanje je pokazatelj ugodnejših ocen gospodinjstev glede preteklega in prihodnjega finančnega stanja. Zaupanje potrošnikov še vedno presega dolgoročno povprečje in je skladno s sedanjo vztrajno rastjo zasebne potrošnje. Po pričakovanjih pa bodo zadnji ukrepi za omejevanje širjenja koronavirusa močno vplivali na prihodnjo potrošnjo.
Okrevanje na stanovanjskih trgih naj bi se nadaljevalo počasneje kot leta 2019 in bo pod negativnim vplivom izbruha koronavirusa. Stanovanjske naložbe so se v zadnjem četrtletju 2019 medčetrtletno povečale za 0,4%, kar je posledica umirjanja rasti na stanovanjskih trgih euroobmočja. Čeprav se je rast stanovanjskih naložb leta 2019 že tretje leto zapored umirjala, zadnji kratkoročni kazalniki in rezultati anket kažejo pozitiven, vendar upočasnjen zagon. Gradbena aktivnost na področju visokih gradenj se je v zadnjem četrtletju 2019 medčetrtletno povečala za 1,0%, kar je že
7
8
9
10
11
12
13
-0,6
-0,4
-0,2
0,0
0,2
0,4
0,6
2013 2014 2015 2016 2017 2018 2019 2020
zaposlenost (lestvica na levi strani)pričakovano zaposlovanje po PMI (lestvica na levi strani)stopnja brezposelnosti (lestvica na desni strani)

Ekonomski bilten ECB, številka 2 / 2020
26
tretje zaporedno četrtletno zmanjšanje. Kazalnik Evropske komisije o zaupanju v gradbeništvu zadnjih nekaj mesecev kaže pozitiven, čeprav šibkejši zagon v zadnjem četrtletju 2019 in na začetku leta 2020. Indeks vodij nabave (PMI) o aktivnosti na stanovanjskem trgu je v zadnjem četrtletju 2019 v povprečju dosegel 50,6, januarja in februarja 2020 pa 52,6.
Rast podjetniških investicij v euroobmočju je bila leta 2019 posebej volatilna in je prikrivala upočasnitev investicij v stroje in opremo ter velika nihanja neopredmetenih investicij. Negradbene investicije so se v zadnjem četrtletju 2019 medčetrtletno povečale za 8,0% zaradi 20-odstotnega četrtletnega povečanja investicij v proizvode intelektualne lastnine, ki so zlasti povezani z Irsko. Obenem so se četrtletne investicije v stroje in opremo leta 2019 upočasnile in v zadnjem četrtletju zmanjšale, kar je pokazatelj posebej šibke industrijske proizvodnje investicijskega blaga v navedenem četrtletju. Izguba zagona je deloma posledica nadaljnje visoke gospodarske negotovosti in šibkejšega povpraševanja. Januarja in februarja 2020 se je ocena izvoznih naročil in pričakovane proizvodnje v sektorju investicijskega blaga po podatkih, zbranih pred izbruhom koronavirusa v Evropi, nekoliko izboljšala. Kar zadeva kazalnike zaupanja v proizvodnji investicijskega blaga, sta se indeks PMI za januar in kazalnik gospodarske klime za februar povečala z ravni iz zadnjega četrtletja 2019, vendar sta ostala nižja od zgodovinskega povprečja. Kazalniki prihodnjih gibanj, na primer negotovost v predelovalnih dejavnostih, so se januarja rahlo zmanjšali, zmanjševanje pričakovanj o dobičku javnih delniških družb pa se je februarja zaustavilo. Postopno okrevanje rasti investicij naj bi spodbujali tudi dejavniki, kot so rast dobička, ugodni pogoji financiranja in precejšnje likvidnostne rezerve podjetij.
Medtem ko se je izvoz blaga v države zunaj euroobmočja v zadnjem četrtletju 2019 okrepil zaradi izboljšanja v razmerju do nastajajočih tržnih gospodarstev, se bo okrevanje v prvem četrtletju 2020 verjetno obrnilo zaradi posledic izbruha koronavirusa. Nominalni izvoz blaga v države zunaj euroobmočja se je v zadnjem četrtletju 2019 medčetrtletno povečal za 1,3%. Ob koncu leta 2019 je okreval zlasti izvoz v Turčijo, Brazilijo, na Kitajsko in druge azijske države. Izvoz blaga v ZDA in Združeno kraljestvo je v istem obdobju oslabel, in sicer zaradi manjšega izvoza farmacevtskih izdelkov oziroma zmanjševanja zalog, ki so bile pred tem vzpostavljene zaradi brexita. Trgovinska menjava v euroobmočju je ostala šibka, kar je posledica šibke industrijske proizvodnje in investicij v euroobmočju. Glavni kazalniki kažejo, da se bo v prihodnje izvoz zaradi koronavirusa zmanjšal. Indeks PMI za nova izvozna naročila v euroobmočju za februar 2020 se je močno zmanjšal, zadnji špediterski kazalniki (npr. indeks cen ladijskih prevozov Baltic Dry Index) pa so se precej obrnili. Ti kazalniki še ne vključujejo posledic izbruha koronavirusa v Italiji in drugih državah euroobmočja. Učinek koronavirusa na trgovinsko menjavo v euroobmočju se bo po pričakovanjih pokazal v motnjah dobavnih verig v euroobmočju in zunaj njega, v manjšem tujem povpraševanju, poslabšanju zaupanja in v močnem zmanjšanju storitev, na primer turizma in prevoza.
Najnovejši ekonomski podatki in informacije iz anket kažejo določeno stabilizacijo dinamike rasti v euroobmočju, čeprav na nizki ravni, vendar pa ne odražajo v celoti gibanj, povezanih z izbruhom koronavirusa po celinski Evropi. Sestavljeni indeks PMI o gospodarski aktivnosti se je februarja 2020 povečal ob
Ekonomski bilten ECB, številka 2 / 2020
27
izboljšanju komponente za predelovalne dejavnosti in storitve, tako da je povprečje za prva dva meseca 2020 višje od povprečja za zadnje četrtletje 2019 (51,4 v primerjavi z 50,7). Kazalnik gospodarske klime Evropske komisije se je februarja povečal in presegel dolgoročno povprečje. Za leto 2020 do zdaj v povprečju znaša 103,0, kar je več od povprečne vrednosti iz zadnjega četrtletja 2019 (100,6). Čeprav se je kazalnik gospodarske klime zmanjšal za gradbeništvo in nekoliko oslabel za trgovino na drobno, je to v veliki meri odtehtalo pozitivno razpoloženje v predelovalnih in storitvenih dejavnostih ter med gospodinjstvi. Čeprav anketni podatki kažejo stabilizacijo, so dobavni roki in poslovna pričakovanja v anketah do februarja že pokazali nekatere omejitve aktivnosti v euroobmočju zaradi posledic koronavirusa na Kitajskem. Gibanja, povezana s širjenjem koronavirusa po izbruhu v Evropi, bi lahko povzročila nadaljnje motnje v dobavnih verigah ter vplivala na potrošnjo in investicije zaradi zelo visoke ravni negotovosti in povečane volatilnosti na finančnih trgih.
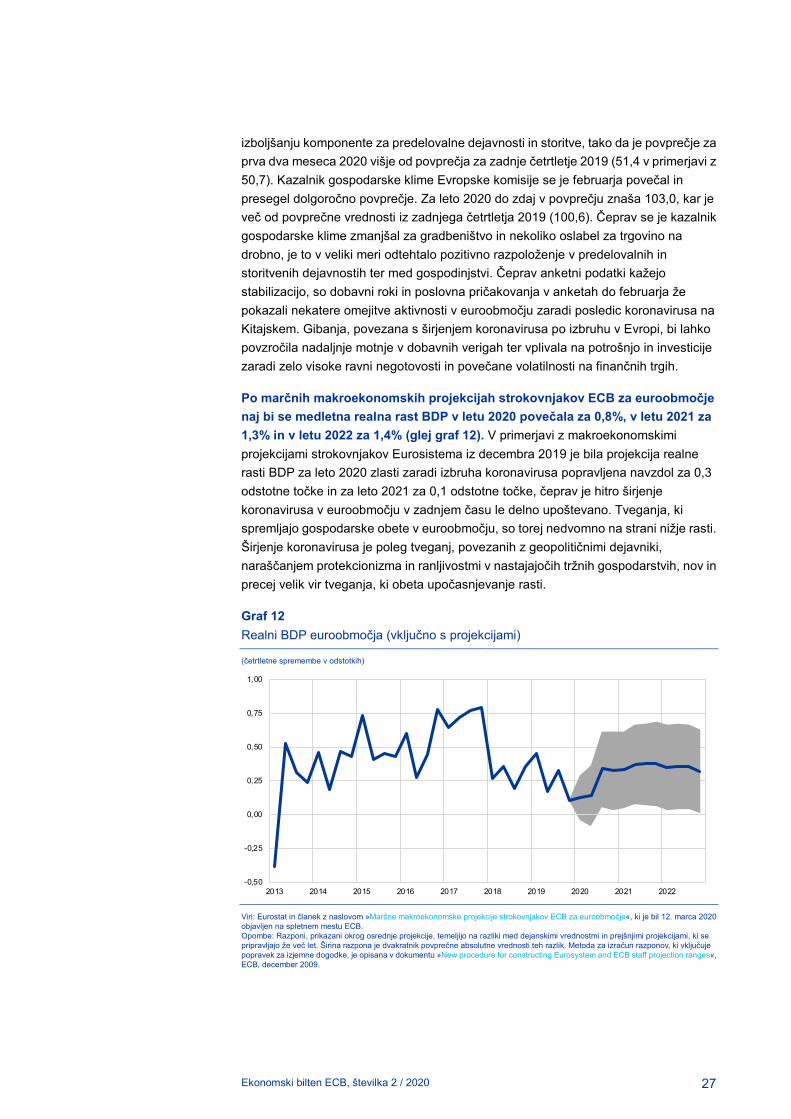
Po marčnih makroekonomskih projekcijah strokovnjakov ECB za euroobmočje naj bi se medletna realna rast BDP v letu 2020 povečala za 0,8%, v letu 2021 za 1,3% in v letu 2022 za 1,4% (glej graf 12). V primerjavi z makroekonomskimi projekcijami strokovnjakov Eurosistema iz decembra 2019 je bila projekcija realne rasti BDP za leto 2020 zlasti zaradi izbruha koronavirusa popravljena navzdol za 0,3 odstotne točke in za leto 2021 za 0,1 odstotne točke, čeprav je hitro širjenje koronavirusa v euroobmočju v zadnjem času le delno upoštevano. Tveganja, ki spremljajo gospodarske obete v euroobmočju, so torej nedvomno na strani nižje rasti. Širjenje koronavirusa je poleg tveganj, povezanih z geopolitičnimi dejavniki, naraščanjem protekcionizma in ranljivostmi v nastajajočih tržnih gospodarstvih, nov in precej velik vir tveganja, ki obeta upočasnjevanje rasti.
Graf 12 Realni BDP euroobmočja (vključno s projekcijami)
(četrtletne spremembe v odstotkih)
Viri: Eurostat in članek z naslovom »Marčne makroekonomske projekcije strokovnjakov ECB za euroobmočje«, ki je bil 12. marca 2020 objavljen na spletnem mestu ECB. Opombe: Razponi, prikazani okrog osrednje projekcije, temeljijo na razliki med dejanskimi vrednostmi in prejšnjimi projekcijami, ki se pripravljajo že več let. Širina razpona je dvakratnik povprečne absolutne vrednosti teh razlik. Metoda za izračun razponov, ki vključuje popravek za izjemne dogodke, je opisana v dokumentu »New procedure for constructing Eurosystem and ECB staff projection ranges«, ECB, december 2009.
-0,50
-0,25
0,00
0,25
0,50
0,75
1,00
2013 2014 2015 2016 2017 2018 2019 2020 2021 2022

Ekonomski bilten ECB, številka 2 / 2020
28
4 Cene in stroški
Po Eurostatovi prvi oceni se je medletna inflacija v euroobmočju, merjena z indeksom HICP, znižala z 1,4% v januarju 2020 na 1,2% v februarju. Glede na nedaven strm upad trenutnih in terminskih cen nafte se bo skupna inflacija v prihodnjih mesecih verjetno še znatno znižala. Takšno oceno deloma kažejo tudi makroekonomske projekcije za euroobmočje, ki so jih marca 2020 pripravili strokovnjaki ECB, po katerih bo medletna inflacija v letu 2020 znašala 1,1%, v letu 2021 1,4%, v letu 2022 pa 1,6%. Napoved inflacije je tako približno nespremenjena v primerjavi z lanskimi decembrskimi projekcijami strokovnjakov Eurosistema. V srednjeročnem obdobju bodo inflacijo podpirali ukrepi denarne politike ECB. Posledice koronavirusa za inflacijo so izjemno negotove, saj bi lahko navzdol usmerjene pritiske zaradi šibkejšega povpraševanja odtehtali navzgor usmerjeni pritiski zaradi motenj v ponudbi. Nedavni strm padec cen nafte predstavlja precejšnje pritiske na znižanje inflacije v kratkoročnem obdobju.
Po Eurostatovi prvi oceni se je inflacija februarja znižala. Znižanje z 1,4% v januarju na 1,2% v februarju je bilo odraz znižanja inflacije v skupini energentov, ki je več kot odtehtalo zvišanje inflacije v skupinah hrane, storitev in industrijskega blaga razen energentov. Medtem ko je gibanje skupne inflacije v glavnem še naprej poganjala rast cen energentov, pa je v zadnjem času k ravni inflacije znatno prispevala rast cen hrane, ki je znašala več kot 2%.
Graf 13 Prispevek skupin k skupni inflaciji euroobmočja
(medletne spremembe v odstotkih; prispevki v odstotnih točkah)
Viri: Eurostat in izračuni ECB. Opombe: Zadnji podatki se nanašajo na februar 2020 (prva ocena). Stopnje rasti za leto 2015 so zaradi metodološke spremembe izkrivljene navzgor (glej okvir z naslovom »Nova metoda izračunavanja cenovnega indeksa počitnic v paketu v Nemčiji in vpliv na stopnjo inflacije«, Ekonomski bilten, številka 2, ECB, 2019).
Merila osnovne inflacije so na splošno ostala umirjena. Inflacija brez hrane in energentov se je februarja zvišala na 1,2%, potem ko je novembra in decembra narasla na 1,3% in se januarja znižala na 1,1%. Druga merila osnovne inflacije so bila v zadnjih mesecih stabilnejša (podatki so na voljo samo do januarja, glej graf 14). Inflacija brez energentov, hrane, s potovanji povezanih postavk in oblačil, kazalnik
-1,5
-1,0
-0,5
0,0
0,5
1,0
1,5
2,0
2,5
3,0
2012 2013 2014 2015 2016 2017 2018 2019 2020
HICPstoritveindustrijsko blago razen energentovhranaenergenti

Ekonomski bilten ECB, številka 2 / 2020
29
vztrajne in skupne komponente inflacije ter kazalnik najožje osnovne inflacije5 še naprej kažejo, da je osnovna inflacija ostala nespremenjena tako kot vse prejšnje leto.
Graf 14 Merila osnovne inflacije
(medletne spremembe v odstotkih)
Viri: Eurostat in izračuni ECB. Opombe: Zadnji podatki se nanašajo na februar 2020 pri inflaciji brez energentov in hrane (prva ocena) in na januar 2020 pri vseh drugih merilih. Merila osnovne inflacije so naslednja: HICP brez energentov; HICP brez energentov in nepredelane hrane; HICP brez energentov in hrane; HICP brez energentov, hrane, s potovanji povezanih postavk in oblačil; 10-odstotna modificirana aritmetična sredina inflacije; 30-odstotna modificirana aritmetična sredina inflacije; tehtana mediana HICP. Stopnje rasti inflacije brez energentov in hrane za leto 2015 so zaradi metodološke spremembe izkrivljene navzgor (glej okvir z naslovom »Nova metoda izračunavanja cenovnega indeksa počitnic v paketu v Nemčiji in vpliv na stopnjo inflacije«, Ekonomski bilten, številka 2, ECB, 2019).
Pritiski iz proizvodne verige na postavke industrijskega blaga razen energentov v indeksu HICP so v poznejših fazah dobavne verige ostali večinoma nespremenjeni. Rast cen industrijskih proizvodov pri proizvajalcih v skupini neživilskih proizvodov za široko porabo, namenjenih domači prodaji, ki je kazalnik cenovnih pritiskov v poznejših fazah dobavne verige, je januarja na medletni ravni znašala 0,7% in je bila tako nespremenjena od oktobra ter nad zgodovinskim povprečjem. V tej skupini se je medletna stopnja rasti uvoznih cen zvišala z –0,1% decembra na 0,5% januarja. Kazalniki cenovnih pritiskov v zgodnejših fazah dobavne verige so ostali šibki, vendar so se vseeno rahlo zvišali, saj je medletna rast cen proizvodov za vmesno porabo pri proizvajalcih narasla z –1,1% v decembru na –1,0% v januarju, rast uvoznih cen proizvodov za vmesno porabo pa se je zvišala z –1,2% v decembru na –0,4% v januarju.
Rast plač se je znižala. Medletna rast sredstev za zaposlene na zaposlenega se je v zadnjem četrtletju 2019 znižala in je znašala 1,7%, potem ko je v tretjem četrtletju dosegla 2,1% (glej graf 15). Povprečna rast se je rahlo znižala, in sicer z 2,2% v letu 2018 na 2,0% v letu 2019. Na stopnjo rasti v letu 2019 je vplival precejšen upad prispevkov za socialno varnost v Franciji.6 Medletna rast plač na zaposlenega, ki ne vključuje prispevkov za socialno varnost, se je znižala z 2,5% v tretjem četrtletju 2019 na 2,1% v zadnjem četrtletju in lani v povprečju znašala 2,4%, potem ko je leta 2018 5 Več informacij o omenjenih merilih osnovne inflacije je v okvirjih 2 in 3 članka z naslovom »Measures of
underlying inflation for the euro area«, Ekonomski bilten, številka 4, ECB, 2018. 6 Več informacij je v okvirju 5 z naslovom »Novejša gibanja prispevkov za socialno varnost in minimalnih
plač v euroobmočju«, Ekonomski bilten, številka 8, ECB, 2019.
0,0
0,5
1,0
1,5
2,0
2,5
3,0
2011 2012 2013 2014 2015 2016 2017 2018 2019 2020
HICP brez energentov in hraneHICP brez energentov, hrane, s potovanji povezanih postavk in oblačilnajožja osnovna inflacijavztrajna in skupna komponenta inflacijerazpon meril

Ekonomski bilten ECB, številka 2 / 2020
30
povprečno znašala 2,3%. Medletna rast dogovorjenih plač v euroobmočju se je znižala z 2,6% v tretjem četrtletju 2019 na 2,0% v zadnjem četrtletju. Znižanje je bilo predvsem posledica enkratnih plačil v predelovalnih dejavnostih v Nemčiji v tretjem četrtletju. Če odmislimo začasne dejavnike, različni kazalniki kažejo, da se je rast plač tekom leta 2019 rahlo zniževala, vendar po stopnjah okrog zgodovinskega povprečja ali rahlo nad njim.
Graf 15 Prispevek komponent k sredstvom za zaposlene na zaposlenega
(medletne spremembe v odstotkih; prispevki v odstotnih točkah)
Viri: Eurostat in izračuni ECB. Opomba: Zadnji podatki se nanašajo na zadnje četrtletje 2019.
Tržni kazalniki dolgoročnejših inflacijskih pričakovanj so se na začetku marca znižali na novo rekordno nizko raven, in sicer po velikem popravku zaradi širjenja koronavirusa po svetu. Nedavno znižanje tržnih kazalnikov inflacijskih pričakovanj je sledilo zvišanju od zadnjega četrtletja 2019 do seje Sveta ECB v januarju. Obrestna mera v 5-letnih obrestnih zamenjavah na inflacijo čez pet let je sredi januarja upadla za 42 bazičnih točk in je znašala 0,91%. Do tveganja nevtralna verjetnost deflacije na podlagi tržnih pričakovanj (verjetnost temelji na negativni povprečni inflaciji v naslednjih petih letih) se je zvišala na 22%. Prihodnja dinamika tržnih kazalnikov inflacijskih pričakovanj še naprej kaže na dolgotrajno obdobje nizke inflacije. Kot kaže anketa ECB o napovedih drugih strokovnjakov za prvo četrtletje 2020, ki je bila opravljena v drugem tednu januarja 2020, ter zadnja anketa Consensus Economics in Euro Zone Barometer, so bila januarja tudi anketna merila dolgoročnih inflacijskih pričakovanj na zgodovinsko nizki ravni.
-1,5
-1,0
-0,5
0,0
0,5
1,0
1,5
2,0
2,5
3,0
2012 2013 2014 2015 2016 2017 2018 2019
rast sredstev za zaposlene na zaposlenegadogovorjene plačeprispevki za socialno varnostdodatki na osnovno plačo

Ekonomski bilten ECB, številka 2 / 2020
31
Graf 16 Tržni kazalniki inflacijskih pričakovanj
(medletne spremembe v odstotkih)
Viri: Thomson Reuters in izračuni ECB. Opomba: Zadnji podatki se nanašajo na 11. marec 2020.
Po letošnjih marčnih makroekonomskih projekcijah strokovnjakov ECB naj bi se osnovna inflacija v srednjeročnem obdobju zvišala. Te projekcije predvidevajo, da bo skupna inflacija v letu 2020 v povprečju znašala 1,1%, v letu 2021 1,4% in v letu 2022 1,6%, kar je na splošno nespremenjeno v primerjavi z makroekonomskimi projekcijami strokovnjakov Eurosistema iz decembra 2019 (glej graf 17). Nižja stopnja skupne inflacije v letu 2020 v primerjavi z letom 2019 je posledica znatnega znižanja cen energentov v indeksu HICP zaradi šibkega gibanja cen nafte (do presečnega datuma za tehnične predpostavke 18. februarja), kar je deloma posledica izbruha COVID-19. Inflacija brez energentov in hrane bo tekom leta 2020 predvidoma ostala nespremenjena na ravni 1,2%, nato pa se bo postopoma zviševala na 1,4% v letu 2021 in na 1,5% v letu 2022. Posledice širitve COVID-19 za inflacijo so razen vpliva na cene nafte precej negotove. V projekcijah je predvideno, da bodo pritiske na zniževanje cen, povezane s šibkejšim povpraševanjem v letu 2020, večinoma izravnali navzgor delujoči pritiski, povezani z motnjami v ponudbi, čeprav to oceno spremljajo jasna navzdol usmerjena tveganja.
0,0
0,5
1,0
1,5
2,0
2,5
3,0
2012 2013 2014 2015 2016 2017 2018 2019 2020
1-letna stopnja čez eno leto1-letna stopnja čez dve leti1-letna stopnja čez štiri leta1-letna stopnja čez devet let5-letna stopnja čez pet let

Ekonomski bilten ECB, številka 2 / 2020
32
Graf 17 Inflacija v euroobmočju (vključno s projekcijami)
(medletne spremembe v odstotkih)
Viri: Eurostat in članek z naslovom »Marčne makroekonomske projekcije strokovnjakov ECB za euroobmočje«, ki je bil 12. marca 2020 objavljen na spletnem mestu ECB. Opombe: Zadnji podatki se nanašajo na zadnje četrtletje 2019 (dejanski podatki) in na zadnje četrtletje 2022 (projekcije). Razponi, prikazani okrog osrednje projekcije, temeljijo na razliki med dejanskimi vrednostmi in prejšnjimi projekcijami, ki se pripravljajo že več let. Širina razpona je dvakratnik povprečne absolutne vrednosti teh razlik. Metoda za izračun razponov, ki vključuje popravek za izjemne dogodke, je opisana v dokumentu »New procedure for constructing Eurosystem and ECB staff projection ranges«, ECB, december 2009. Presečni datum za podatke v projekcijah je 18. februar 2020.
-0,5
0,0
0,5
1,0
1,5
2,0
2,5
3,0
2013 2014 2015 2016 2017 2018 2019 2020 2021 2022

Ekonomski bilten ECB, številka 2 / 2020
33
5 Denar in krediti
Denarna dinamika se je od konca poletja 2019 upočasnila z dokaj visokih ravni. Kreditiranje zasebnega sektorja se po različnih kategorijah posojil še naprej giblje raznoliko. Medtem ko je ostala rast posojil gospodinjstvom vztrajna, se je rast posojil podjetjem umirila. Ugodni pogoji financiranja za banke in bančni posojilni pogoji so še naprej spodbujali odobravanje posojil in s tem tudi gospodarsko rast. Skupno zunanje financiranje podjetij euroobmočja se je stabiliziralo ob ugodnih stroških dolžniškega financiranja. Zaradi nedavnega povečanja nenaklonjenosti tveganju bi se lahko nebančni pogoji financiranja za nefinančne družbe poslabšali.
Denarna dinamika se je od konca poletja 2019 umirila. Medletna stopnja rasti denarnega agregata M3 se je povečala s 4,9% v decembru na 5,2% v januarju (glej graf 18), zlasti zaradi pozitivnega baznega učinka v skupini tržnih instrumentov, kar je prikrilo nadaljnje umirjanje kratkoročne denarne dinamike. Rast širokega denarja so podpirali zelo nizki oportunitetni stroški imetja denarnih instrumentov. Nasprotno je upočasnitev gospodarske rasti zavirala rast M3. Rast agregata M3 je enako kot v prejšnjih četrtletjih še naprej spodbujal ožji agregat M1, ki obsega vloge čez noč in gotovino v obtoku. Medletna stopnja rasti agregata M1 je januarja dosegla 7,9%, potem ko je decembra znašala 8,0%.
Graf 18 Agregata M3 in M1 ter posojila zasebnemu sektorju
(medletne spremembe v odstotkih, desezonirano in prilagojeno za število delovnih dni)
Vir: ECB. Opombi: Posojila so prilagojena za prodajo in listinjenje posojil ter navidezno združevanje denarnih sredstev. Zadnji podatki so za januar 2020.
Vloge čez noč so še naprej največ prispevale k rasti denarja. Medletna stopnja rasti vlog čez noč je januarja ostala približno stabilna na ravni 8,4%, potem ko je decembra znašala 8,5%, prispevek k medletni rasti agregata M3 pa se je od jeseni 2019 nekoliko zmanjšal. S sektorskega vidika so k umirjanju prispevale vloge podjetij in gospodinjstev. Medletna stopnja rasti gotovine v obtoku se je januarja še naprej gibala okoli 5% in ne kaže na hitrejšo zamenjavo vlog z gotovino v okolju, kjer prevladujejo nizke obrestne mere. Januarja je prišlo do majhne medletne rasti agregata M3, zlasti zaradi tržnih instrumentov (tj. M3 minus M2), kar je pozitivno prispevalo k mesečni dinamiki M3. S tem se je obrnil zaviralni vpliv tržnih instrumentov
-4
-2
0
2
4
6
8
10
12
2013 2014 2015 2016 2017 2018 2019 2020
M3M1posojila zasebnemu sektorju

Ekonomski bilten ECB, številka 2 / 2020
34
na rast agregata M3 v decembru zaradi močno negativnega izdajanja dolžniških vrednostnih papirjev v tem mesecu, kar je bilo verjetno posledica učinkov konca leta.
K rasti širokega denarja je še vedno največ prispevalo kreditiranje zasebnega sektorja. Kreditiranje zasebnega sektorja je januarja še naprej precej prispevalo k rasti širokega denarja (glej modri del stolpcev v grafu 19). Medletni prispevek kreditiranja zasebnega sektorja je bil do januarja 2020 večinoma posledica močne medletne rasti posojil. Zunanji denarni tokovi so bili drugi glavni vir ustvarjanja denarja in so na splošno stabilno prispevali k rasti agregata M3 od novembra 2019, kar je kazalo, da investitorji dajejo prednost finančnemu premoženju euroobmočja (glej rumeni del stolpcev v grafu 19). Ponovno izvajanje nakupov s strani ECB v okviru programa nakupa vrednostnih papirjev v novembru so samo omejeno neposredno vplivali na agregat M3 v prvih treh mesecih. To je verjetno zato, ker so obveznice Eurosistemu prodajale zlasti banke in nerezidenti. Poleg tega ponovni nakupi v okviru programa niso odtehtali zaviralnega učinka na rast agregata M3, ki izhaja iz zapadlih dolžniških vrednostnih papirjev, ki niso povezani s programom (glej rdeči del stolpcev v grafu 19). Zaviralni učinek dolgoročnejših finančnih obveznosti je ostal majhen (glej zeleni del stolpcev v grafu 19).
Graf 19 M3 in protipostavke
(medletne spremembe v odstotkih, prispevek v odstotnih točkah, desezonirano in prilagojeno za število delovnih dni)
Vir: ECB. Opombe: Krediti zasebnemu sektorju obsegajo posojila denarnih finančnih institucij (DFI) zasebnemu sektorju in dolžniške vrednostne papirje v imetju DFI, ki jih je izdal zasebni nedenarni sektor euroobmočja. Obsegajo tudi Eurosistemove nakupe dolžniških vrednostnih papirjev nedenarnih sektorjev v okviru programa nakupa vrednostnih papirjev podjetniškega sektorja. Zadnji podatki so za januar 2020.
-6
-4
-2
0
2
4
6
8
10
2013 2014 2015 2016 2017 2018 2019 2020
M3 neto zunanji denarni tokovidržavni dolžniški vrednostni papirji v imetju Eurosistemakrediti DFI razen Eurosistema širše opredeljeni državikrediti zasebnemu sektorjuprilivi iz dolgoročnejših finančnih obveznosti in druge protipostavke

Ekonomski bilten ECB, številka 2 / 2020
35
Medletna stopnja rasti posojil zasebnemu sektorju je kljub raznolikim gibanjem po sektorjih v celoti ostala na splošno stabilna. Januarja je medletna stopnja rasti posojil denarnih finančnih institucij (DFI) zasebnemu sektorju (prilagojena za prodajo in listinjenje posojil ter navidezno združevanje denarnih sredstev) znašala 3,8% (v primerjavi s 3,7% v decembru) (glej graf 18). Medtem ko se je medletna stopnja rasti posojil gospodinjstvom rahlo povečala (3,6% decembra in 3,7% januarja), se je medletna stopnja rasti posojil podjetjem ustalila na 3,2%, tako da se je nadaljeval trend umirjanja od septembra 2018. Precej heterogena rast posojil po državah med drugim razkriva razlike med državami na področju gospodarske rasti, razpoložljivosti drugih virov financiranja, stopnje zadolženosti gospodinjstev in podjetij ter raznolikih gibanj cen stanovanj po državah (glej graf 20).
Umirjanje rasti posojil podjetjem sovpada z dinamiko cikličnega zaostajanja posojil v primerjavi z realno gospodarsko aktivnostjo. Umirjanje bančnega posojanja podjetjem je še naprej osredotočeno na sektorje predelovalnih dejavnosti in trgovine, na katere je izrazito vplivalo vztrajno upočasnjevanje svetovne gospodarske aktivnosti. Nasprotno doslej ni veliko znakov prelivanja umirjenega kreditiranja v storitvene dejavnosti (vključno s podjetji, ki opravljajo nepremičninske storitve), ki predstavljajo največji delež rasti posojil nefinančnim družbam. Glede na rezultate ankete o bančnih posojilih v euroobmočju je videti, da je upočasnitev rasti posojil podjetjem odvisna predvsem od povpraševanja, npr. zaradi nižjih potreb po financiranju naložb v osnovna sredstva. Anketa o bančnih posojilih, ki ima lastnosti vodilnega kazalnika, kaže nadaljnje umirjanje rasti posojil podjetjem v prvi polovici leta 2020. Kreditni standardi so ostali do zdaj na splošno nespremenjeni, ob rahlem negativnem prevrednotenju ocen kreditnega tveganja podjetij, zlasti malih in srednje velikih podjetij, ki so ponavadi posebej občutljiva na ekonomski cikel.
Graf 20 Posojila DFI v izbranih državah euroobmočja
(medletne spremembe v odstotkih)
Vir: ECB. Opombe: Posojila so prilagojena za prodajo in listinjenje posojil ter navidezno združevanje denarnih sredstev v primeru nefinančnih družb. Razlike po državah so izračunane na podlagi minimalnih in maksimalnih vrednosti na fiksnem vzorcu 12 držav euroobmočja. Zadnji podatki so za januar 2020.
-15
-10
-5
0
5
10
15
20
2013 2014 2015 2016 2017 2018 2019 2020
euroobmočjeNemčijaFrancijaItalijaŠpanijarazlike po državah
a) posojila DFI nefinančnim družbam
-9
-6
-3
0
3
6
9
12
2013 2014 2015 2016 2017 2018 2019 2020
b) posojila DFI gospodinjstvom

Ekonomski bilten ECB, številka 2 / 2020
36
Stanovanjska posojila gospodinjstvom so še naprej postopno rasla, rast potrošniških posojil pa se je ustalila. Medletna stopnja rasti stanovanjskih posojil gospodinjstvom se je januarja povečala na 4,1% v primerjavi s 3,9% v decembru, v skladu z vztrajnim trendom naraščanja od leta 2015 (glej graf 21). Medletna stopnja rasti potrošniških posojil je ostala močna na ravni euroobmočja in je januarja znašala 6%, enako kot decembra. Nekoliko se je umirila z ravni, ki so v začetku leta 2018 presegale 7%. V nasprotju z močno rastjo hipotekarnih in potrošniških posojil je ostala medletna stopnja rasti drugih posojil gospodinjstvom šibka ter je januarja znašala –1,0%, potem ko je bila decembra –1,2%. Šibko rast tovrstnih posojil bi lahko v veliki meri pripisali posojilom malim podjetjem (individualnim lastnikom in partnerskim podjetjem brez pravnega statusa), ki se evidentirajo v sektorju gospodinjstev. Upočasnitev gospodarske aktivnosti bi lahko še posebno vplivala na te subjekte, ki za pokrivanje svojih potreb po financiranju verjetno uporabljajo tudi nebančne vire financiranja, vključno z notranje ustvarjenimi sredstvi.
Graf 21 Posojila DFI gospodinjstvom po namenu
(medletne spremembe v odstotkih, desezonirano in prilagojeno za število delovnih dni)
Vir: ECB. Opombi: Podatki za skupna posojila gospodinjstvom so prilagojeni za prodajo in listinjenje posojil. Zadnji podatki so za januar 2020.
Bruto zadolženost gospodinjstev se je v euroobmočju v zadnjih četrtletjih ustalila na visoki ravni, tj. blizu ravni, dosežene konec leta 2007.7 Na ravni euroobmočja je do ustalitve prišlo ob raznolikih gibanjih zadolženosti gospodinjstev po državah. Hkrati so stroški gospodinjstev za servisiranje dolga dosegli novo najnižjo vrednost, kar podpira vzdržnost dolga.
Pogoji financiranja za banke so še naprej ugodni. Skupni stroški dolžniškega financiranja za banke v euroobmočju, ki so se od začetka leta 2019 zmanjšali v skladu z gibanjem tržnih obrestnih mer, so ostali v zadnjem četrtletju 2019 in januarja 2020 zelo nizki (glej graf 22). To je posledica precejšnjega zmanjšanja donosnosti bančnih obveznic med letom 2019, ko je dosegla najnižje ravni, medtem ko je donosnost ponovno začela rasti zlasti zaradi širjenja koronavirusa (COVID-19) od konca
7 Glej »Households and non-financial corporations in the euro area: third quarter of 2019«, Evropska
centralna banka, januar 2020.
-4
-2
0
2
4
6
8
2013 2014 2015 2016 2017 2018 2019 2020
skupajstanovanjska posojilapotrošniška posojiladruga posojila

Ekonomski bilten ECB, številka 2 / 2020
37
februarja. Obrestne mere bank euroobmočja za vloge, ki predstavljajo večji del bančnega financiranja in za katere so podatki na voljo do januarja 2020, so ostale na najnižjih ravneh in s tem prispevale k ugodnim pogojem dolžniškega financiranja. Pogoje financiranja za banke podpira tudi tretja serija ciljno usmerjenih operacij dolgoročnejšega refinanciranja (CUODR III), kot poročajo banke v anketi o bančnih posojilih, pa tudi ponovno izvajanje neto nakupov vrednostnih papirjev s strani ECB novembra 2019.
Obrestne marže v bankah euroobmočja so ostale januarja na splošno stabilne. Medtem ko so obrestne marže (razlika med posojilnimi in depozitnimi obrestnimi merami) pri novih poslih od leta 2014 majhne, saj so se posojilne obrestne mere znižale bolj kakor depozitne obrestne mere, so banke posledice zmanjšanih marž za dobičkonosnost odtehtale s povečevanjem obsega posojil. Skupni vpliv na neto obrestne prihodke (kot zmnožek posojilnih obrestnih mer in obsega) je bil v tem obdobju rahlo pozitiven. Odkar je ECB septembra 2019 zmanjšala obrestno mero za odprto ponudbo mejnega depozita, se je še povečal delež vlog podjetij, ki se obrestujejo po negativnih obrestih merah, kar je podpiralo obrestne marže bank, ki so januarja 2020 znašale 1,34%. Banke so dosegle nadaljnji napredek tudi pri izboljševanju bilanc, na primer z zmanjševanjem obsega nedonosnih posojil. Dobičkonosnost bank je glede na pretekle standarde še vedno nizka, tudi zaradi močne konkurence v bančnem sektorju in s strani nebančnih institucij ter zaradi potreb po večji stroškovni učinkovitost v sektorju.8
Graf 22 Skupni stroški dolžniškega financiranja bank
(skupni stroški financiranja z vlogami in nezavarovanega tržnega dolžniškega financiranja, v odstotkih na leto)
Viri: ECB, Markit Iboxx in izračuni ECB. Opombe: Skupni stroški vlog so izračunani kot povprečje obrestnih mer za vloge čez noč, vezane vloge in vloge na odpoklic z odpovednim rokom pri novih poslih, tehtano s stanjem. Zadnji podatki so za januar 2020.
8 Glej »Financial Integration and Structure in the Euro Area«, Evropska centralna banka, marec 2020
0
1
2
3
2013 2014 2015 2016 2017 2018 2019 2020
euroobmočjeNemčijaFrancijaItalijaŠpanija

Ekonomski bilten ECB, številka 2 / 2020
38
Ugodne obrestne mere za posojila še naprej podpirajo gospodarsko rast. Skupne obrestne mere bank za posojila podjetjem in za stanovanjska posojila gospodinjstvom so ostale v treh mesecih do januarja 2020 na splošno stabilne (glej graf 23). To je skladno z umirjenim gibanjem kratkoročnih tržnih obrestnih mer, kljub volatilnosti dolgoročnejših tržnih obrestih mer. Januarja 2020 so skupne obrestne mere bank za posojila podjetjem znašale 1,55%, enako kot decembra in le rahlo nad najnižjo vrednostjo, zabeleženo avgusta 2019. Skupne obrestne mere bank za stanovanjska posojila so ostale večinoma stabilne na ravni 1,44% v primerjavi z najnižjo vrednostjo, ki je decembra 2019 znašala 1,41%. Konkurenčni pritiski, ugodni stroški financiranja za banke in vpliv znižanja obrestne mere ECB za odprto ponudbo mejnega depozita septembra 2019 so ohranili obrestne mere za posojila podjetjem in gospodinjstvom euroobmočja blizu najnižjih vrednosti. Od napovedi ukrepov ECB za sprostitev kreditnih pogojev junija 2014 so se skupne obrestne mere za posojila podjetjem in gospodinjstvom na splošno precej znižale. Od maja 2014 do januarja 2020 so se skupne obrestne mere za posojila podjetjem znižale za okoli 140 bazičnih točk, za stanovanjska posojila gospodinjstvom pa za okoli 150 bazičnih točk.
Graf 23 Skupne obrestne mere za posojila v izbranih državah euroobmočja
(v odstotkih na leto, 3-mesečna drseča sredina)
Vir: ECB. Opombe: Kazalnik skupnih stroškov bančnih posojil je izračunan z agregiranjem kratkoročnih in dolgoročnih obrestnih mer z uporabo 24-mesečne drseče sredine obsega novih poslov. Standardni odklon med državami je izračunan na fiksnem vzorcu 12 držav euroobmočja. Zadnji podatki so za januar 2020.
Letni tokovi skupnega zunanjega financiranja v nefinančne družbe euroobmočja so se v zadnjem četrtletju 2019 stabilizirali na solidnih ravneh (glej sliko a) v grafu 24). Tokovi dolžniškega financiranja v nefinančne družbe so se od zadnjega četrtletja 2018 umirili skupaj z upočasnitvijo gospodarske aktivnosti. Zniževanje tokov zunanjega financiranja pa se je v zadnjem četrtletju 2019 ustavilo. Leta 2019 je neto izdajanje obveznic doseglo na splošno podobne ravni kot leta 2016 in 2017 ter precej preseglo ravni iz leta 2018. Hkrati se je konec leta 2019 zadolževanje podjetij pri bankah upočasnilo zaradi zmanjšanja potreb podjetij po financiranju, kar je posledica zapoznelega vpliva umirjanja gospodarske aktivnosti od
0,0
0,4
0,8
1,2
1,6
2,0
0
1
2
3
4
5
2011 2012 2013 2014 2015 2016 2017 2018 2019 2020
euroobmočjeNemčijaFrancijaItalijaŠpanijastandardni odklon med državami (lestvica na desni strani)
a) obrestne mere za posojila nefinančnim družbam
0,0
0,2
0,4
0,6
0,8
1,0
0
1
2
3
4
5
2011 2012 2013 2014 2015 2016 2017 2018 2019 2020
b) obrestne mere za stanovanjska posojila gospodinjstvom

Ekonomski bilten ECB, številka 2 / 2020
39
sredine leta 2018, čeprav so bili stroški dolžniškega financiranja relativno ugodni. Nebančna posojila (iz nedenarnih sektorjev) so postala v tretjem četrtletju 2019 manj negativna, nato pa v zadnjem četrtletju rahlo pozitivna, kar kaže na rahlo krepitev izdajanja podjetniških obveznic prek namenskih družb za financiranje nefinančnih družb. Zadnji podatki kažejo, da je bilo neto izdajanje dolžniških vrednostnih papirjev januarja in februarja 2020 veliko. Neto izdajanje delnic, ki kotirajo na borzi, je postalo v zadnjem četrtletju 2019 medletno bolj negativno, kar je bilo posledica nadaljevanja šibkega izdajanja, prenosa delnic v borzni kotaciji v lastniški kapital izven borzne kotacije v drugem četrtletju 2019 ter precejšnjega baznega učinka. Vztrajno višji stroški lastniškega kapitala, ki kotira na borzi, v primerjavi s stroški dolžniškega financiranja zavirajo uporabo delnic, ki kotirajo na borzi, kot instrumenta za financiranje.
Stroški financiranja za nefinančne družbe so januarja 2020 približno dosegali ravni iz septembra 2019, vendar so se po ocenah od takrat precej zvišali (glej sliko b) v grafu 24). Skupni nominalni stroški zunanjega financiranja za nefinančne družbe, vključno z bančnimi posojili, izdajanjem dolžniških vrednostnih papirjev na trgu in lastniškim financiranjem, so januarja 2020 znašali 4,7%. Stroški financiranja so tako januarja 2020 znašali le 14 bazičnih točk več kot aprila 2019, ko so bili najnižji. Od takrat in do konca referenčnega obdobja (11. marca 2020) pa naj bi se po ocenah skupni stroški financiranja močno povečali na 5,1%. To je posledica povečanja stroškov lastniških vrednostnih papirjev za 85 bazičnih točk in stroškov tržnega dolžniškega financiranja za 10 bazičnih točk. Gibanja stroškovnih kazalnikov bi lahko bila posledica hitrega in močnega poslabšanja dojemanja tveganj zaradi širjenja koronavirusa, ki je povzročilo višje premije za tveganje lastniškega kapitala in širše razmike v donosnosti podjetniških obveznic (glej razdelek 2).

Ekonomski bilten ECB, številka 2 / 2020
40
Graf 24 Zunanje financiranje nefinančnih družb v euroobmočju
(letni tokovi v milijardah EUR – slika a); v odstotkih na leto – slika b))
Viri: Eurostat, Dealogic, ECB, Merrill Lynch, Bloomberg, Thomson Reuters in ocene ECB. Opombe: Slika a: Neto zunanje financiranje je vsota posojil DFI, neto izdajanja dolžniških vrednostnih papirjev, neto izdajanja delnic, ki kotirajo na borzi, in posojil nedenarnih sektorjev. Posojila DFI so prilagojena za prodajo in listinjenje posojil ter združevanje denarnih sredstev. Posojila nedenarnih sektorjev obsegajo posojila, ki so jih odobrili drugi finančni posredniki ter zavarovalne družbe in pokojninski skladi, razen listinjenih posojil. Črtkani stolpec se nanaša na ocene za zadnje četrtletje 2019. Slika b: Skupni stroški financiranja za nefinančne družbe so izračunani kot tehtano povprečje stroškov bančnih posojil, stroškov tržnega dolžniškega financiranja in stroškov lastniškega kapitala na podlagi stanj. Modra karo oznaka se nanaša na ocene za marec 2020 za skupne stroške financiranja, če predpostavimo, da bodo ostale obrestne mere bank za posojila nespremenjene na ravni iz januarja 2020. Zadnji podatki za sliko a) so za tretje četrtletje 2019 iz računov euroobmočja – ocene za zadnje četrtletje 2019 temeljijo na podatkih ECB BSI in SEC ter Dealogic. Zadnji podatki za sliko b) so za 11. marec 2020 za stroške lastniških vrednostnih papirjev in stroške tržnega dolžniškega financiranja ter za januar 2020 za stroške kreditiranja.
-200
-100
0
100
200
300
400
2013 2014 2015 2016 2017 2018 2019
posojila DFI nefinančnim družbam (prilagojeno)neto izdajanje dolžniških vrednostnih papirjev s strani nefinančnih družbneto izdajanje delnic, ki kotirajo na borzi, s strani nefinančnih družbposojila nedenarnih sektorjev nefinančnim družbam (razen listinjenja)skupaj
a) neto zunanje financiranje nefinančnih družb euroobmočja na podlagi izbranih instrumentov
0
2
4
6
8
10
2013 2014 2015 2016 2017 2018 2019 2020
skupni stroški financiranjastroški lastniških vrednostnih papirjevstroški tržnega dolžniškega financiranjakazalnik stroškov kratkoročnega kreditiranjakazalnik stroškov dolgoročnega kreditiranja
b) nominalni stroški zunanjega financiranja za nefinančne družbe euroobmočja po komponentah

Ekonomski bilten ECB, številka 2 / 2020
41
6 Javnofinančna gibanja
Proračunski saldo širše opredeljene države naj bi se v euroobmočju v letih 2020 in 2021 po marčnih projekcijah strokovnjakov ECB poslabšal ter se v letu 2022 stabiliziral. Poslabšanje bi lahko pripisali predvsem nižjemu primarnemu presežku. To se kaže tudi v naravnanosti fiskalne politike, ki bo po projekcijah v letih 2020 in 2021 ekspanzivna, v letu 2022 pa na splošno nevtralna. Kljub razmeroma ekspanzivni naravnanosti fiskalne politike naj bi se delež javnega dolga euroobmočja v razmerju do BDP po projekcijah še naprej postopoma zmanjševal, in sicer zaradi ugodne razlike med obrestno mero in stopnjo gospodarske rasti ter nekoliko pozitivnega primarnega salda v celotnem obdobju projekcij. Gibanja, povezana s širjenjem koronavirusa (COVID-19), v obdobju po dokončanju projekcij pa kažejo na nadaljnjo ekspanzivno naravnanost javnofinančne politike. Ob tem je treba zelo pozdraviti zavezanost Euroskupine k skupnemu in usklajenemu ukrepanju politik.
V marčnih makroekonomskih projekcijah strokovnjakov ECB je predvideno, da se bo proračunski saldo širše opredeljene države v euroobmočju v letih 2020 in 2021 poslabšal ter se v letu 2022 stabiliziral.9 Strokovnjaki ECB v letošnjih marčnih makroekonomskih projekcijah napovedujejo povečanje deleža javnofinančnega primanjkljaja v euroobmočju z 0,7% BDP v letu 2019 na 1,1% leta 2020 ter nato na 1,5% v letih 2021 in 2022 (glej graf 25). Poslabšanje proračunskega salda v obdobju 2020–2021 je predvsem posledica manjšega ciklično prilagojenega primarnega salda, kar delno odtehtajo nižji odhodki za obresti, medtem ko se ciklična komponenta v obdobju projekcij rahlo zmanjša.
Graf 25 Proračunski saldo in komponente
(v odstotkih BDP)
Viri: ECB in marčne makroekonomske projekcije strokovnjakov ECB. Opomba: Podatki se nanašajo na agregat sektorja širše opredeljene države v euroobmočju.
9 Glej članek z naslovom »Marčne makroekonomske projekcije strokovnjakov ECB za euroobmočje«, ki je
bil 12. marca 2020 objavljen na spletnem mestu ECB.
-2,0
-1,5
-1,0
-0,5
0,0
0,5
1,0
1,5
2018 2019 2020 2021 2022
ciklično prilagojeni primarni saldo (brez pomoči finančnemu sektorju)ciklična komponentaplačila obrestipomoč finančnemu sektorjuproračunski saldo

Ekonomski bilten ECB, številka 2 / 2020
42
Po marčnih makroekonomskih projekcijah strokovnjakov ECB javnofinančni obeti v euroobmočju za obdobje 2020–2022 kažejo na bistveno bolj spodbujevalno naravnano fiskalno politiko kot v projekcijah strokovnjakov Eurosistema decembra 2019. Proračunski saldo širše opredeljene države v euroobmočju kot delež BDP je bil za leto 2020 popravljen navzdol za 0,2 odstotne točke ter za leti 2021 in 2022 za 0,4 odstotne točke. Ti popravki so rezultat nižjega primarnega salda in šibkejše ciklične komponente od pričakovane, medtem ko ostaja komponenta odhodkov za obresti nespremenjena.
Agregatna naravnanost fiskalne politike v euroobmočju bo po ocenah v letih 2020 in 2021 ekspanzivna, v letu 2022 pa približno nevtralna.10 Fiskalna politika je v letu 2019 po ocenah postala rahlo ekspanzivna ter naj bi bila v letih 2020 in 2021 po pričakovanjih še bolj spodbujevalno naravnana, s čimer bo podpirala gospodarsko aktivnost. To gre večinoma na račun višjega trošenja, zlasti za transferje, v Nemčiji, Španiji in Italiji, ter zmanjševanja neposrednih davkov in prispevkov za socialno varnost v Franciji in na Nizozemskem. Leta 2022 naj bi bila po ocenah naravnanost fiskalne politike približno nevtralna.
Skupni delež javnega dolga euroobmočja v razmerju do BDP naj bi se po marčnih makroekonomskih projekcijah strokovnjakov ECB še naprej postopoma zmanjševal. Projekcije napovedujejo zmanjšanje skupnega deleža javnega dolga euroobmočja v razmerju do BDP s 84,5% BDP leta 2019 na 82,6% BDP leta 2022. K predvidenemu zmanjšanju tega deleža naj bi prispevala ugodna razlika med obrestno mero in stopnjo rasti BDP,11 medtem ko je skupni prispevek primarnega salda v obdobju projekcij blizu nič (glej graf 26). V primerjavi s projekcijami iz decembra 2019 se pričakuje, da se bo delež javnega dolga zmanjševal počasneje zaradi nižjega predvidenega primarnega presežka in manj ugodne ciklične komponente. Hitrejše širjenje koronavirusa potem, ko so bile marčne projekcije dokončane, pa kaže, da bo gibanje razmerja med javnim dolgom in BDP slabše, kot predvidevajo projekcije.
10 Naravnanost javnofinančne politike odraža smer in velikost spodbujevalnih vplivov javnofinančne politike
na gospodarstvo, poleg samodejnega odziva javnih financ na gospodarski cikel. Tukaj se meri kot sprememba ciklično prilagojenega primarnega salda brez državne pomoči finančnemu sektorju. Koncept naravnanosti javnofinančne politike v euroobmočju je podrobneje obravnavan v članku z naslovom »The euro area fiscal stance«, Ekonomski bilten, številka 4, ECB, junij 2016.
11 Več informacij je v okvirju z naslovom »Razlika med obrestno mero in stopnjo rasti BDP ter gibanje javnega dolga«, Ekonomski bilten, številka 2, ECB, marec 2019.

Ekonomski bilten ECB, številka 2 / 2020
43
Graf 26 Dejavniki sprememb javnega dolga
(v odstotnih točkah BDP)
Viri: ECB in marčne makroekonomske projekcije strokovnjakov ECB. Opomba: Podatki se nanašajo na agregat sektorja širše opredeljene države v euroobmočju.
Širjenje koronavirusa je velik šok za svetovno gospodarstvo in gospodarstvo euroobmočja, kar bo terjalo ambiciozen in usklajen odziv javnofinančnih politik. Zdaj so potrebni pravočasni in ciljno usmerjeni ukrepi pomoči zdravstvenemu sektorju ter prizadetim podjetjem in gospodinjstvom, da bi se spopadli z izzivom omejevanja širjenja koronavirusa, s katerim se sooča javno zdravje, ter ublažili gospodarske posledice. Zavezanost Euroskupine k skupnemu in usklajenemu ukrepanju politik ima torej veliko podporo.
-5
-4
-3
-2
-1
0
1
2018 2019 2020 2021 2022 2019-22
primarni saldo (-)prilagoditev med primanjkljajem in dolgomrazlika med obrestno mero in stopnjo rasti BDPkonsolidirani bruto dolg kumulativna
sprememba

Ekonomski bilten ECB, številka 2 / 2020
44
Okvirji
1 Uporaba informacij v časopisnih člankih kot kazalnika realne gospodarske aktivnosti
Pripravila Massimo Ferrari in Helena Le Mezo
V ekonomski literaturi se metode analize besedil veliko uporabljajo za merjenje makroekonomskih tveganj in negotovosti.12 Vseeno je na voljo le malo informacij o tem, koliko informacij o realni gospodarski aktivnosti je iz takšnih kazalnikov mogoče izluščiti. V tem okvirju je predstavljen kazalnik realne gospodarske aktivnosti v ZDA, ki temelji na besedilni analizi časopisnih člankov. Kazalnik se oblikuje na podlagi podatkov iz baze Factiva, v kateri se zbirajo vsi članki iz najpomembnejših časopisov v mnogih državah. Časopisni članki, objavljeni v ZDA, se pridobijo iz baze in uporabijo za pripravo kazalnika aktivnosti na podlagi besedil.13 Za vsak dan od januarja 1970 kazalnik meri število člankov, ki govorijo o upadu gospodarske aktivnosti (ali recesiji) v ZDA, glede na skupno število člankov, objavljenih v ZDA. Intuitivno je mogoče pričakovati, da se bo kazalnik gibal skladno z gospodarskim ciklom, saj časopisi namenjajo več prostora temi gospodarske upočasnitve. Poleg tega bi se moral hitreje odzivati na gibanja v gospodarskem ciklu, ki v agregatnih makro spremenljivkah postanejo vidna šele čez nekaj časa in se pogosto objavljajo z zamikom. In nazadnje, ta indeks se lahko brez težav posodablja z veliko frekvenco (vsakodnevno) in ga je mogoče uporabiti za veliko število razvitih in nastajajočih tržnih gospodarstev.
Indeks se lahko uporabi za spremljanje gospodarske aktivnosti ZDA v realnem času. Graf A kaže, da kazalnik korelira z obdobji gospodarske upočasnitve v ZDA, če se ta merijo z upadom industrijske proizvodnje, ali z datumi recesij, ki jih ugotovi nacionalni urad za ekonomske raziskave NBER. Korelacija nakazuje, da bi se indeks, temelječ na analizi besedil, lahko uporabljal kot kazalnik, ki v realnem času omogoča visokofrekvenčno spremljanje gospodarskih gibanj, saj vsebuje relevantne informacije o poslovnem ciklu.
12 Nedavni primeri so Caldara, D. in Iacoviello, M., »Measuring Geopolitical Risk« International Finance
Discussion Papers, No 1222, Board of Governors of the Federal Reserve System (ZDA), 2018; Baker, R.S., Bloom, N. in Davis, S.J., »Measuring Economic Policy Uncertainty«, The Quarterly Journal of Economics, Vol. 131(4), Oxford University Press, 2016, str. 1593–1636; za nedavno analizo besedila, uporabljeno za euroobmočje, glej Azqueta-Gavaldón, A., Hirschbühl, D., Onorante, L. in Saiz, L., »Sources of economic policy uncertainty in the euro area: a machine learning approach«, Economic Bulletin, št. 5, ECB, Frankfurt na Majni, november 2019.
13 Z isto metodologijo, kot sta jo uporabila Caldara, D. in Iacoviello, M., »Measuring Geopolitical Risk«, International Finance Discussion Papers, No 1222, Board of Governors of the Federal Reserve System (ZDA), 2018.

Ekonomski bilten ECB, številka 2 / 2020
45
Graf A Na besedilih temelječ kazalnik in recesije v ZDA
(na besedilih temelječ kazalnik upočasnitve; recesije in industrijska proizvodnja v ZDA, indeks (2010=100))
Viri: Factiva, Haver Analytics in izračuni avtorjev. Opombe: Na besedilih temelječ kazalnik je oblikovan na podlagi razmerja med številom v ZDA objavljenih člankov, ki govorijo o upočasnjevanju ameriškega gospodarstva, in številom vseh člankov, ki so istega dne objavljeni v ZDA. Podatki se zatem agregirajo z mesečno frekvenco. Zadnji podatki so za januar 2020.
Indeks omogoča tudi predvidevanje gospodarske aktivnosti v prihodnjem obdobju. To predpostavko je mogoče formalno testirati tako, da se na besedilih temelječ kazalnik doda standardnemu modelu za verjetnost recesije.14 Oceni se naslednja enačba:
𝑃𝑃(𝑘𝑘𝑘𝑘𝑘𝑘𝑘𝑘𝑘𝑘)𝑡𝑡+𝑘𝑘 = 𝛼𝛼 + 𝛽𝛽1[𝑑𝑑𝑑𝑑𝑑𝑑𝑑𝑑𝑑𝑑𝑑𝑑𝑑𝑑𝑑𝑑𝑑𝑑𝑡𝑡3−𝑚𝑚𝑚𝑚𝑚𝑚𝑚𝑚𝑚𝑚𝑚𝑚 − 𝑑𝑑𝑑𝑑𝑑𝑑𝑑𝑑𝑑𝑑𝑑𝑑𝑑𝑑𝑑𝑑𝑑𝑑𝑡𝑡10−𝑙𝑙𝑚𝑚𝑡𝑡] + 𝛽𝛽2𝑘𝑘𝑑𝑑𝑑𝑑𝑖𝑖𝑘𝑘𝑑𝑑𝑡𝑡 + 𝜀𝜀𝑡𝑡+𝑘𝑘 (1)
kjer je verjetnost recesije v prihodnjem obdobju (𝑑𝑑 + 𝑘𝑘) napovedana z naklonom krivulje donosnosti v sedanjem obdobju (razlika med kratkoročno in dolgoročno donosnostjo), ki je standardni napovedovalec recesije, in s kazalnikom, ki temelji na besedilih.15 Indeks daje dodatne informacije o naklonu krivulje donosnosti v ZDA. Natančnost modelov za izračunavanje verjetnosti recesije je povzeta s t. i. krivuljo ROC (receiver operator curve), ki jo je mogoče razumeti kot merilo natančnosti napovedi, oblikovanih z modelom.16 Statistika ROC je prikazana v grafu B, ki kaže, da je za krajša obdobja specifikacija z uporabo indeksa na podlagi časopisnih člankov boljša od navadne krivulje donosnosti. Z vključitvijo podatkov iz časopisnih člankov se uspešnost modela bistveno izboljša. Ta ocena vzdrži različne opredelitve recesije, razen tiste, ki jo uporablja NBER (po kateri recesija pomeni osem zaporednih
14 Na podlagi Wright, J.H., »The yield curve and predicting recessions«’, Finance and Economics
Discussion Series, 2006–2007, oddelek za raziskave in statistiko ter oddelek za denarne zadeve, Federal Reserve Board, Washington D.C., februar 2006.
15 Modeli krivulje donosnosti so bile v zadnjem času revidirani zaradi programov nakupa vrednostnih papirjev, ki jih izvajajo pomembnejše centralne banke. Glej okvir z naslovom »US yield curve inversion and financial market signals of recession«, Economic Bulletin, št. 1, ECB, Frankfurt na Majni, 2020.
16 Krivulja ROC primerja prave pozitivne rezultate, tj. ugotovitev recesije, ko dejansko obstaja recesija, od lažnih pozitivnih rezultatov, tj. ugotovitev recesije, ko recesije ni. Čim bližje navpični osi se nahaja ocenjena statistika ROC, tem večja je napovedovalna moč modela. Poleg tega je graf ROC mogoče povzeti z izračunom površine, ki je pod krivuljo ROC, vendar nad 45-stopinjsko črto (ki pomeni naključne vrednosti). Čim večja je površina pod krivuljo, tem natančnejši je model.
0,00
0,01
0,02
0,03
0,04
0,05
0,06
0,07
60
70
80
90
100
110
120
130
1985 1987 1989 1991 1993 1995 1997 1999 2001 2003 2005 2007 2009 2011 2013 2015 2017 2019
industrijska proizvodnja ZDA (lestvica na levi strani)indeks (lestvica na desni strani)recesije NBER

Ekonomski bilten ECB, številka 2 / 2020
46
mesecev krčenja industrijske proizvodnje), in izključitev obdobja svetovne finančne krize.
V tem okvirju predstavljene ugotovitve kažejo, da so informacije, pridobljene iz časopisnih člankov, uporabne za spremljanje gospodarskih gibanj in dopolnjujejo makroekonomske podatke. Časopisni članki vsebujejo velike količine informacij o poslovnem ciklu, ki se v makroekonomskih časovnih vrstah ne pojavijo takoj. Ker takšen na besedilih temelječ kazalnik obstaja in ga je mogoče dnevno posodabljati, je uporaben za spremljanje in predvidevanje gospodarskih gibanj, zlasti na krajši rok.
Graf B Statistika natančnosti modelov o verjetnosti recesije za različna mesečna obdobja napovedovanja gospodarskih gibanj
(indeks, lestvica na levi strani)
Viri: Factiva, Haver Analytics in izračuni avtorjev. Opombe: Natančnost temelji na statistiki ROC, izpeljani iz modela o verjetnosti recesije, ki je ocenjena i) samo s krivuljo donosnosti, ii) samo s kazalnikom na podlagi besedil, iii) s krivuljo donosnosti in s kazalnikom na podlagi besedil. Statistika je izračunana kot normalizirana razdalja med pravilnimi predvidevanj modela in naključno vrednostjo (tj. 50% konstantna verjetnost krčenja gospodarske aktivnosti); čim večja je razdalja, tem višja je vrednost statistike ROC. Zadnji podatki so za januar 2020.
0,5
0,6
0,7
0,8
0,9
1,0
1 2 3 4 5 6 7 8 9 10 11 12 13 14 15 16
samo indekssamo krivulja donosnostiindeks in krivulja donosnosti
a) Recesije NBER
0,5
0,6
0,7
0,8
0,9
1,0
1 2 3 4 5 6 7 8 9 10 11 12 13 14 15 16
b) Osem zaporednih mesecev krčenja industrijske proizvodnje

Ekonomski bilten ECB, številka 2 / 2020
47
2 Vloga obdavčitve multinacionalnih podjetij v prvem preobratu tokov neposrednih tujih naložb v euroobmočju
Pripravila Virginia Di Nino in Andrejs Semjonovs
V tem okvirju je razloženo, kako je obdavčitev multinacionalnih podjetij po zadnji reformi davka od dobička pravnih oseb v ZDA vplivala na tokove neposrednih tujih naložb v euroobmočje in iz njega.17 Tako kot v drugih razvitih gospodarstvih so tudi v euroobmočju naložbe rezidenčnih podjetij v tujini ponavadi večje kot naložbe tujih podjetij v euroobmočju. Leta 2018 pa so neto odlivi neposrednih tujih naložb (ki bi jih lahko opisali tudi kot neto imetja iz naslova neposrednih tujih naložb euroobmočja – večinoma naložbe domačih podjetij v tuje podružnice) postali prilivi, neto prilivi neposrednih tujih naložb (ali neto obveznosti, tj. neto naložbe tujih podjetij v euroobmočju) pa so postali odlivi. Omenjena kapitalska gibanja so v veliki meri povezana z nekaterimi ukrepi reforme davka od dobička pravnih oseb v ZDA, ki je začela veljati v začetku leta 2018.18
Preobrat tokov neposrednih tujih naložb euroobmočja je bil v celoti posledica tokov (i) iz in v ZDA ter (ii) v eksteritorialna središča in iz njih (glej graf A). Multinacionalna podjetja iz ZDA so leta 2017 začela zmanjševati naložbe v euroobmočju (kar je bilateralno ustvarilo neto odlive neposrednih tujih naložb), tj. pred reformo davka od dobička pravnih oseb, vendar je bil preobrat agregiranih tokov neposrednih tujih naložb zabeležen šele v drugi polovici leta 2018, ko so tudi eksteritorialna središča začela zmanjševati naložbe v euroobmočju.
17 Glej tudi okvir z naslovom »Euro area foreign direct investment since 2018: the role of special purpose
entities«, Economic Bulletin, številka 5, ECB, 2019. 18 Glej tudi članek z naslovom »Multinational enterprises, financial centres and their implications for
external imbalances: a euro area perspective« v tej številki Ekonomskega biltena.

Ekonomski bilten ECB, številka 2 / 2020
48
Graf A Tokovi neposrednih tujih naložb v euroobmočju (neto imetja in neto obveznosti) glede na izvor ali regijo prejemnico
(drseča vsota transakcij v štirih četrtletjih; v milijardah EUR; nedesezonirani podatki)
Vir: Eurostat. Opombe: Kar zadeva imetja, pozitivna (negativna) številka kaže neto nakupe (prodajo) tujih instrumentov (tj. izdanih zunaj euroobmočja) s strani vlagateljev iz euroobmočja. Kar zadeva obveznosti, pozitivna (negativna) številka kaže neto nakupe (prodajo) instrumentov euroobmočja s strani vlagateljev zunaj euroobmočja. Eksteritorialna središča so: Andora, Antigua in Barbuda, Angvila, Aruba, Barbados, Bahrajn, Bermudi, Bahami, Belize, Cookovi otoki, Curaçao, Dominika, Grenada, Guernsey, Gibraltar, Hongkong, Isle of Man, Jersey, Saint Kitts in Nevis, Kajmanski otoki, Libanon, Sveta Lucija, Lihtenštajn, Liberija, Marshallovi otoki, Montserrat, Mavricij, Nauru, Niue, Panama, Filipini, Sejšeli, Singapur, Sint Maarten, Otoki Turks in Caicos, Saint Vincent in Grenadine, Britanski Deviški otoki, Deviški otoki Združenih držav, Vanuatu in Samoa. Zadnji podatki se nanašajo na tretje četrtletje 2019.
Preobrat neto tokov neposrednih tujih naložb se je zgodil le v nekaterih finančnih središčih euroobmočja, tj. v državah, ki imajo visoke finančne tokove, in sicer prek transakcij subjektov s posebnim namenom (glej graf B). V drugih gospodarstvih euroobmočja so ostali tokovi umirjeni, pomembne geografske spremembe v sestavi neposrednih tujih naložb pa niso bile zabeležene. Dvojni preobrat (imetja in obveznosti) kaže tudi visoko stopnjo sogibanja med tokovi na strani imetij in obveznosti v državah, kjer multinacionalna podjetja uporabljajo prakse povratnega trgovanja in premeščanja.19 Na Irskem je upad prilivov in odlivov neposrednih tujih naložb zadeval predvsem transakcije z drugimi finančnimi središči euroobmočja (in ne ZDA) ter se je pokazal prej, in sicer že od zadnjega četrtletja 2017.20 Glede na zapleteno strukturo svetovne mreže neposrednih tujih naložb je v skladu s temi informacijami mogoče domnevati, da je nekaj vračanja dobička iz Irske potekalo prek drugih finančnih središč v euroobmočju.
19 Pri povratnem trgovanju podjetje proda finančno premoženje drugemu podjetju (ali podjetjem), ki se
ponavadi nahaja(jo) v drugi jurisdikciji, z dogovorom, da bo isto ali podobno premoženje odkupilo nazaj po približno isti ceni. Take transakcije povečujejo prihodke in stroške, vendar ne vplivajo na dobiček. Pogosto so povezane s praksami premeščanja, v katerih drugo podjetje plača davek na donosnost finančnega premoženja, prvotno podjetje pa pridobi vračilo davka.
20 Glej Emter, L., Kennedy, B., in McQuade, P., »US profit repatriations and Ireland’s Balance of Payments statistics«, Quarterly Bulletin, Central Bank of Ireland, II 2019.
-1.000
-800
-600
-400
-200
0
200
400
600
800
1.000
03.16 06.16 09.16 12.16 03.17 06.17 09.17 12.17 03.18 06.18 09.18 12.18 03.19 06.19 09.19
obveznosti skupajobveznosti do ZDA
obveznosti do drugih območijobveznosti do eksteritorialnih središč
imetja v ZDA
imetja v drugih območjihimetja v eksteritorialnih središčih

Ekonomski bilten ECB, številka 2 / 2020
49
Graf B Transakcije neposrednih tujih naložb na strani obveznosti v euroobmočju: subjekti s posebnim namenom v primerjavi z drugimi rezidenčnimi subjekti
(drseča vsota transakcij v štirih četrtletjih; v milijardah EUR; nedesezonirani podatki)
Vir: OECD in Eurostat. Opombe: Modri in rdeči deli stolpcev kažejo neto vhodne naložbe v operativne enote, ki so subjekti s posebnim namenom. Rumeni in zeleni deli stolpcev kažejo neto vhodne neposredne tuje naložbe v vsa druga rezidenčna podjetja v euroobmočju, ki so podružnice tujih podjetij. Finančna središča so: Belgija, Luksemburg in Nizozemska. Druge države euroobmočja so vse druge države članice razen Španije, Cipra, Latvije in Malte, ki so izključene zaradi pomanjkanja podatkov. Zadnji podatki se nanašajo na tretje četrtletje 2019.
Razčlenitev bruto tokov neposrednih tujih naložb po vrstah instrumentov kaže, da je preobrat zadeval zlasti lastniški kapital, izključeval pa je komponento reinvestiranega dobička (glej graf C). Preobrat torej kaže, da se odločitve o neposrednih tujih naložbah sprejemajo zlasti zaradi davkov, saj ni povzročil sprememb v sestavi ali preselitev kapitalskih in dolžniških instrumentov iz naslova neposrednih tujih naložb v druga gospodarstva euroobmočja. Poleg tega to ni vplivalo na reinvestirani dobiček, ker pretekli dobiček, vrnjen v matično državo po enkratni preferenčni davčni stopnji, odobreni podjetjem iz ZDA, ni bil zabeležen kot razdelitev dobička (»super« – ali velike, izjemne – dividende so v plačilni bilanci v okviru neposrednih tujih naložb zabeležene pod transakcijami z lastniškim kapitalom). Zaradi tega in glede na stabilne neto neposredne tuje naložbe na Irskem ter preselitev nekaterih velikih multinacionalnih podjetij na Irsko so na Irskem leta 2018 prihodki od davka od dobička pravnih oseb še naprej rasli.21
21 V preteklosti je bilo videti, da se je zaradi znižanja davka od dobička pravnih oseb v ZDA povečala
zaposlenost in rast na Irskem zaradi naložb v gospodarske panoge, financirane iz tujine. Tokrat pa bi lahko obstajalo tveganje kapitalskih odlivov zaradi sprememb v aktivnosti multinacionalnih podjetij v državi. Glej Clancy, D., »US corporate tax rate cuts: Spillovers to the Irish economy«, Working Paper Series, št. 38, Evropski mehanizem za stabilnost, 2019.
-1.000
-500
0
500
1.000
1.500
2014 2015 2016 2017 2018 2019
finančna središča: transakcije podjetij za posebne namenefinančna središča: transakcije drugih rezidenčnih podjetijdruge države euroobmočja: transakcije podjetij za posebne namenedruge države euroobmočja: transakcije drugih rezidenčnih podjetij

Ekonomski bilten ECB, številka 2 / 2020
50
Graf C Neto tokovi neposrednih tujih naložb v finančna središča euroobmočja (imetja in obveznosti) po vrstah finančnih instrumentov
(drseča vsota transakcij v štirih četrtletjih; v milijardah EUR; nedesezonirani podatki)
Vir: OECD. Opombe: Za Irsko za nekatera četrtletja niso bili objavljeni podatki o dolžniških instrumentih, lastniškem kapitalu in reinvestiranem dobičku. Podatki za Malto in Ciper niso na voljo. Neto obveznosti so navedene v obratni lestvici na negativnem delu (če so pozitivni) vertikalne osi. Zadnji podatki se nanašajo na tretje četrtletje 2019.
Medtem ko je bilo pričakovano, da bodo imele nekatere določbe davčne reforme v ZDA prehoden vpliv na transakcije iz naslova neposrednih tujih naložb, je reforma vključevala tudi ukrepe zoper zmanjšanje davčne osnove, ki lahko dolgoročno vplivajo na bruto in neto tokove neposrednih tujih naložb. Reforma je obsegala enkratni nižji davek na pretekli dobiček, ki se ne vrača v matično državo. Toda polna oprostitev davka, ki sedaj velja za dobiček, ustvarjen v tujini v obliki dividend, se uporablja na splošno ne glede na to, ali se vrne v matično državo ali ostane v tujini. S tem imajo multinacionalna podjetja iz ZDA manjšo spodbudo, da reinvestirajo dobiček v tujini. Poleg tega reforma vključuje tudi ukrepe zoper zmanjšanje davčne osnove, ki lahko dolgoročno vplivajo na bruto in neto tokove neposrednih tujih naložb. S tem se zmanjšuje spodbuda ameriškim podjetjem, da bi svoja neopredmetena sredstva preselila v eksteritorialna središča, saj jim je omogočeno znižanje davka do 37,5% od dohodka iz neopredmetenih sredstev v tujini. Preobrat bruto tokov neposrednih tujih naložb euroobmočja bi torej lahko pomenil prehod na novo ravnotežje tujih naložb. Čeprav je prezgodaj za ocene, se je zmanjševanje naložb nadaljevalo tudi leta 2019 in je v finančnih središčih euroobmočja prizadelo ne le obveznosti iz naslova lastniškega kapitala, ampak tudi dolžniško komponento neposrednih tujih naložb (glej graf C). Mesečne ocene za zadnje četrtletje 2019 kažejo, da se je preobrat verjetno ustavil in da se stanje verjetno normalizira, vendar pa so ostali tokovi precej umirjeni glede na pretekle podatke.
-1.500
-1.000
-500
0
500
1.000
1.500
2014 2015 2016 2017 2018 2019
reinvestirani dobički (imetja)reinvestirani dobički (obveznosti)kapital (imetja)kapital (obveznosti)
dolg (imetja)dolg (obveznosti)brez razčlenitveneto neposredne tuje naložbe skupaj

Ekonomski bilten ECB, številka 2 / 2020
51
3 Likvidnostne razmere in operacije denarne politike v obdobju od 30. oktobra 2019 do 28. januarja 2020
Pripravila Pamina Karl in Marco Weißler
V tem okvirju so opisane operacije denarne politike ECB v sedmem in osmem obdobju izpolnjevanja obveznih rezerv v letu 2019, ki sta trajali od 30. oktobra do 17. decembra 2019 oziroma od 18. decembra 2019 do 28. januarja 2020. Obravnavano obdobje zajema začetek izvajanja dvostopenjskega sistema obrestovanja imetij presežne likvidnosti. Od sedmega obdobja izpolnjevanja obveznih rezerv, ki se je začelo 30. oktobra 2019, je del imetij presežne likvidnosti kreditne institucije (tj. rezervna imetja nad obveznimi rezervami) izvzet iz negativnega obrestovanja po obrestni meri za mejni depozit.22 Ta imetja presežne likvidnosti se zdaj obrestujejo po 0-odstotni letni obrestni meri. Med drugimi novejšimi spremembami sta še neto odplačilo likvidnosti, zagotovljene s ciljno usmerjenimi operacijami dolgoročnejšega refinanciranja (CUODR), in ponovno izvajanje nakupov vrednostnih papirjev.
Likvidnostne potrebe
V obravnavanem obdobju so povprečne dnevne likvidnostne potrebe bančnega sistema – opredeljene kot seštevek neto avtonomnih dejavnikov in obveznih rezerv – znašale 1.505,7 milijarde EUR. To je bilo za 53,7 milijarde EUR manj kot v predhodnem obdobju (tj. v petem in šestem obdobju izpolnjevanja obveznih rezerv leta 2019) (glej tabelo A). Neto avtonomni dejavniki so se zmanjšali za 55,4 milijarde EUR, obvezne rezerve pa so se povečale za 1,7 milijarde EUR na 134,3 milijarde EUR.
Zmanjšanje neto avtonomnih dejavnikov je bilo predvsem posledica povečanja aktive v bilanci stanja Eurosistema (neto tuje aktive in neto aktive v eurih). Avtonomni dejavniki na strani aktive so se povečali za 55,1 milijarde EUR na 1.009,1 milijarde EUR, kar je posledica povečanja neto tuje aktive za 33,2 milijarde EUR, ki je bilo podobno rasti v prejšnjem obdobju, in povečanja neto aktive v eurih za 21,9 milijarde EUR na 238,0 milijarde EUR. Avtonomni dejavniki na strani pasive so skupno ostali skoraj nespremenjeni (zmanjšanje za 0,4 milijarde EUR). Medtem ko so se drugi avtonomni dejavniki in bankovci v obtoku povečali za 42,3 milijarde EUR oziroma 20,0 milijarde EUR, so to povečanje v celoti odtehtale nižje vloge države, ki so v obravnavanem obdobju znašale povprečno 219,8 milijarde EUR, potem ko so v šestem obdobju izpolnjevanja obveznih rezerv dosegle najvišjo vrednost na ravni 298,6 milijarde EUR. Na splošno so se neto avtonomni dejavniki – opredeljeni kot avtonomni dejavniki umikanja likvidnosti na strani pasive minus avtonomni dejavniki povečevanja likvidnosti na strani aktive – zmanjšali na 1.371,4 milijarde EUR.
22 Rezervna imetja finančnih institucij so izračunana na podlagi povprečnega stanja na tekočih računih
kreditnih institucij ob koncu koledarskega dneva v obdobju izpolnjevanja obveznih rezerv. Izvzetje iz negativne obrestne mere se uporablja za imetja presežne likvidnosti na tekočem računu do določenega večkratnika obveznih rezerv institucije. Svet ECB je začetni večkratnik določil kot šestkratnik.

Ekonomski bilten ECB, številka 2 / 2020
52
Tabela A Likvidnostne razmere v Eurosistemu
Pasiva (povprečje; v milijardah EUR)
Sedanje obravnavano obdobje: od 30. oktobra 2019 do 28. januarja 2020
Prejšnje obravnavano
obdobje: od 31. julija 2019
do 29. oktobra 2019
Sedmo in osmo obdobje
izpolnjevanja obveznih rezerv
Sedmo obdobje izpolnjevanja
obveznih rezerv: od 30. oktobra do
17. decembra
Osmo obdobje izpolnjevanja
obveznih rezerv: od 18. decembra do 28. januarja
Peto in šesto obdobje
izpolnjevanja obveznih rezerv
Avtonomni likvidnostni dejavniki 2.380,2 (–0,4) 2.384,8 (–37,1) 2.375,0 (–9,8) 2.380,6 (+87,3)
Bankovci v obtoku 1.271,8 (+20,0) 1.262,9 (+10,1) 1.282,2 (+19,3) 1.251,8 (+17,8)
Vloge države 219,8 (–62,7) 226,6 (–72,1) 211,8 (–14,7) 282,4 (+11,9)
Drugi avtonomni dejavniki1 888,7 (+42,3) 895,3 (+24,8) 880,9 (–14,4) 846,4 (+57,6)
Tekoči računi nad obveznimi rezervami 1.510,1 (+284,9) 1.528,0 (+272,7) 1.489,2 (–38,8) 1.225,2 (–17,2)
Obvezne rezerve 134,3 (+1,7) 134,1 (+0,9) 134,5 (+0,3) 132,6 (+2,5)
Odprta ponudba mejnega depozita 256,4
(–
253,6) 257,9
(–
198,7) 254,6 (–3,3) 510,0 (–77,4)
Operacije finega uravnavanja za umikanje likvidnosti 0,0 (+0,0) 0,0 (+0,0) 0,0 (+0,0) 0,0 (+0,0)
Vir: ECB. Opombe: Vse številke v tabeli so zaokrožene na najbližjo 0,1 milijarde EUR. Odstotki v oklepajih pomenijo spremembo od prejšnjega obravnavanega obdobja ali obdobja izpolnjevanja obveznih rezerv. 1) Izračunano kot seštevek računov prevrednotenja, drugih terjatev in obveznosti rezidentov euroobmočja ter kapitala in rezerv.

Ekonomski bilten ECB, številka 2 / 2020
53
Aktiva (povprečje; v milijardah EUR)
Sedanje obravnavano obdobje: od 30. oktobra 2019 do 28. januarja 2020
Prejšnje obravnavano
obdobje: od 31. julija 2019
do 29. oktobra 2019
Sedmo in osmo obdobje
izpolnjevanja obveznih rezerv
Sedmo obdobje izpolnjevanja
obveznih rezerv: od 30. oktobra do
17. decembra
Osmo obdobje izpolnjevanja
obveznih rezerv: od 18. decembra
do 28. januarja
Peto in šesto obdobje
izpolnjevanja obveznih rezerv
Avtonomni likvidnostni dejavniki 1.009,1 (+55,1) 1.020,9 (+32,7) 995,4 (–25,5) 954,0 (+41,7)
Neto tuja aktiva 771,1 (+33,2) 773,3 (+14,8) 768,6 (–4,7) 737,9 (+38,5)
Neto aktiva v eurih 238,0 (+21,9) 247,6 (+17,9) 226,9 (–20,7) 216,1 (+3,2)
Instrumenti denarne politike 3.272,2 (–22,4) 3.284,3 (+5,1) 3.258,1 (–26,2) 3.294,6 (–46,6)
Operacije odprtega trga 3.272,2 (–22,4) 3.284,3 (+5,1) 3.258,1 (–26,2) 3.294,6 (–46,4)
Avkcijski postopki 644,0 (–39,9) 665,5 (–5,0) 619,0 (–46,5) 683,9 (–31,1)
Operacije glavnega refinanciranja 2,3 (–0,2) 1,8 (–0,2) 2,9 (+1,1) 2,5 (–2,6)
Trimesečne operacije dolgoročnejšega refinanciranja
3,4 (+0,5) 2,7 (–0,1) 4,3 (+1,6) 2,9 (–0,3)
Druga serija ciljno usmerjenih operacij dolgoročnejšega refinanciranja (CUODR II)
589,8 (–87,3) 657,6 (–5,3) 510,8 (–146,8) 677,2 (–29,5)
Tretja serija ciljno usmerjenih operacij dolgoročnejšega refinanciranja (CUODR III)
48,5 (–47,2) 3,4 (+0,6) 101,1 (+97,7) 1,3 (+1,3)
Dokončni portfelji 2.628,2 (+17,5) 2.618,8 (+10,1) 2.639,1 (+20,3) 2.610,7 (–15,1)
Prvi program nakupa kritih obveznic 2,0 (–0,8) 2,3 (–0,5) 1,7 (–0,5) 2,8 (–0,3)
Drugi program nakupa kritih obveznic 2,9 (–0,3) 2,9 (–0,1) 2,9 (–0,0) 3,2 (–0,3)
Tretji program nakupa kritih obveznic 263,8 (+2,8) 262,9 (+2,3) 264,8 (+1,9) 260,9 (–0,8)
Program v zvezi s trgi vrednostnih papirjev
47,9 (–4,9) 47,8 (–3,6) 47,9 (+0,0) 52,8 (–8,6)
Program nakupa listinjenih vrednostnih papirjev
28,2 (+2,1) 27,9 (+1,7) 28,6 (+0,7) 26,1 (–0,1)
Program nakupa vrednostnih papirjev javnega sektorja
2.099,9 (+12,3) 2.093,4 (+6,0) 2.107,6 (+14,3) 2.087,6 (–4,8)
Program nakupa vrednostnih papirjev podjetniškega sektorja
183,5 (+6,2) 181,6 (+4,2) 185,6 (+4,0) 177,3 (–0,4)
Odprta ponudba mejnega posojila 0,0 (–0,0) 0,0 (–0,0) 0,0 (+0,0) 0,0 (–0,2)
Vir: ECB. Opombe: Vse številke v tabeli so zaokrožene na najbližjo 0,1 milijarde EUR. Odstotki v oklepajih pomenijo spremembo od prejšnjega obravnavanega obdobja ali obdobja izpolnjevanja obveznih rezerv.

Ekonomski bilten ECB, številka 2 / 2020
54
Druge informacije o likvidnosti (povprečje; v milijardah EUR)
Sedanje obravnavano obdobje: od 30. oktobra 2019 do 28. januarja 2020
Prejšnje obravnavano
obdobje: od 31. julija 2019
do 29. oktobra 2019
Sedmo in osmo obdobje
izpolnjevanja obveznih rezerv
Sedmo obdobje izpolnjevanja
obveznih rezerv: od 30. oktobra do
17. decembra
Osmo obdobje izpolnjevanja
obveznih rezerv: od 18. decembra do
28. januarja
Peto in šesto obdobje
izpolnjevanja obveznih rezerv
Agregatne likvidnostne potrebe1 1.505,7 (–53,7) 1.498,4 (–69,0) 1.514,3 (+15,9) 1.559,5 (+48,2)
Neto avtonomni dejavniki2 1.371,4 (–55,4) 1.364,3 (–69,9) 1.379,8 (+15,6) 1.426,9 (+45,6)
Presežna likvidnost3 1.766,5 (+31,3) 1.785,9 (+74,0) 1.743,8 (–42,0) 1.735,2 (–94,5)
Vir: ECB. Opombe: Vse številke v tabeli so zaokrožene na najbližjo 0,1 milijarde EUR. Odstotki v oklepajih pomenijo spremembo od prejšnjega obravnavanega obdobja ali obdobja izpolnjevanja obveznih rezerv. 1) Izračunano kot seštevek neto avtonomnih dejavnikov in obveznih rezerv. 2) Izračunano kot razlika med avtonomnimi likvidnostnimi dejavniki na strani pasive in avtonomnimi likvidnostnimi dejavniki na strani aktive. Za namene te tabele so med neto avtonomne dejavnike vključene tudi neporavnane postavke. 3) Izračunano kot seštevek tekočih računov nad obveznimi rezervami in uporabe odprte ponudbe mejnega depozita, od katere je odšteta uporaba odprte ponudbe mejnega posojila.
Gibanje obrestnih mer (povprečje; v odstotkih)
Sedanje obravnavano obdobje: od 30. oktobra 2019 do 28. januarja 2020
Prejšnje obravnavano
obdobje: od 31. julija 2019
do 29. oktobra 2019
Sedmo in osmo obdobje
izpolnjevanja obveznih rezerv
Sedmo obdobje izpolnjevanja
obveznih rezerv: od 30. oktobra do
17. decembra
Osmo obdobje izpolnjevanja
obveznih rezerv: od 18. decembra do
28. januarja
Peto in šesto obdobje
izpolnjevanja obveznih rezerv
Operacije glavnega refinanciranja 0,00 (+0,00) 0,00 (+0,00) 0,00 (+0,00) 0,00 (+0,00)
Odprta ponudba mejnega posojila 0,25 (+0,00) 0,25 (+0,00) 0,25 (+0,00) 0,25 (+0,00)
Odprta ponudba mejnega depozita –0,50 (–0,05) –0,50 (+0,00) –0,50 (+0,00) –0,45 (–0,05)
EONIA1 –0,454 (–0,05) –0,454 (+0,01) –0,454 (+0,00) –0,408 (–0,04)
€STR2 –0,539 (–0,04) –0,539 (+0,00) –0,540 (–0,00) –0,496 (–0,05)
Vir: ECB. Opombe: Vse številke v tabeli so zaokrožene na najbližjo 0,1 milijarde EUR. Odstotki v oklepajih pomenijo spremembo od prejšnjega obravnavanega obdobja ali obdobja izpolnjevanja obveznih rezerv. 1) Od 1. oktobra 2019 izračunano kot eurska kratkoročna obrestna mera (€STR) plus 8,5 bazične točke. Razlike v spremembah pri obrestni meri EONIA in €STR so posledica zaokroževanja. 2) V izračun povprečnih vrednosti pred 30. septembrom 2019 so vključeni podatki za uvajalno €STR.
Zagotavljanje likvidnosti z instrumenti denarne politike
Povprečni znesek ponujene likvidnosti z operacijami odprtega trga (tj. z avkcijskimi postopki in portfelji denarne politike) se je zmanjšal za 22,4 milijarde EUR na 3.272,2 milijarde EUR (glej graf A). Enako kot v preteklih dveh obdobjih izpolnjevanja obveznih rezerv je bilo zmanjšanje predvsem posledica nižjega povpraševanja v avkcijskih postopkih. Za razliko od prejšnjih obravnavanih obdobij leta 2019 pa se je likvidnost, zagotovljena s portfelji denarne politike, znova povečala

Ekonomski bilten ECB, številka 2 / 2020
55
zaradi ponovnega izvajanja neto nakupov v okviru programa nakupa vrednostnih papirjev, ki se je začelo novembra 2019.
Graf A Likvidnost, zagotovljena z operacijami odprtega trga, in presežna likvidnost
(v milijardah EUR)
Vir: ECB. Opomba: Zadnji podatki se nanašajo na 28. januar 2020.
Povprečni znesek likvidnosti, zagotovljene z avkcijskimi postopki, se je v obravnavanem obdobju zmanjšal, enako kot v prejšnjem obravnavanem obdobju. Zmanjšanje za 39,9 milijarde EUR na 644,0 milijarde EUR je bilo predvsem posledica nižje likvidnosti, zagotovljene s ciljno usmerjenimi operacijami dolgoročnejšega refinanciranja. Finančne institucije v euroobmočju so v dveh obravnavanih obdobjih izpolnjevanja obveznih rezerv prostovoljno odplačale 87,3 milijarde EUR iz operacij CUODR II. To je preseglo financiranje iz operacij CUODR III, ki se je v obravnavanem obdobju povprečno povečalo za 47,2 milijarde EUR na 48,5 milijarde EUR. Poleg tega se je rahlo zmanjšalo zagotavljanje likvidnosti z operacijami glavnega refinanciranja, in sicer z 2,5 milijarde EUR na 2,3 milijarde EUR. Povprečno zmanjšanje bi bilo še večje brez operacije glavnega refinanciranja ob koncu leta, v kateri je bilo dodeljenih 7,9 milijarde EUR. Stanje trimesečnih operacij dolgoročnejšega refinanciranja se je rahlo povečalo, in sicer za 0,5 milijarde EUR.
Zaradi ponovnega izvajanja neto nakupov vrednostnih papirjev se je znesek likvidnosti, zagotovljene z Eurosistemovimi portfelji denarne politike, povečal za 17,5 milijarde EUR na 2.628,2 milijarde EUR. Povprečna imetja so se povečala za 12,3 milijarde EUR na 2.099,9 milijarde EUR v okviru programa nakupa vrednostnih papirjev javnega sektorja in za 6,2 milijarde EUR na 183,5 milijarde EUR v okviru programa nakupa vrednostnih papirjev podjetniškega sektorja. Poleg tega so se imetja v okviru tretjega programa nakupa kritih obveznic povečala za 2,8 milijarde EUR in v okviru programa nakupa listinjenih vrednostnih papirjev za 2,1 milijarde
0
500
1.000
1.500
2.000
2.500
3.000
3.500
07.14 01.15 07.15 01.16 07.16 01.17 07.17 01.18 07.18 01.19 07.19 01.20
avkcijski postopkidokončni portfeljipresežna likvidnost

Ekonomski bilten ECB, številka 2 / 2020
56
EUR.23 Unovčenje obveznic v portfelju programa v zvezi s trgi vrednostnih papirjev je v obravnavanem obdobju znašalo 4,9 milijarde EUR.
Presežna likvidnost
V primerjavi s prejšnjim obravnavanim obdobjem se je ob zmanjšanju agregatnih likvidnostnih potreb povprečna presežna likvidnost povečala za 31,3 milijarde EUR na 1.766,5 milijarde EUR (glej graf A). Kljub nižji ponudbi likvidnosti z avkcijskimi postopki se je v euroobmočju presežna likvidnost povečala zaradi zmanjšanja neto avtonomnih dejavnikov in nadaljevanja neto nakupov vrednostnih papirjev.
Poleg tega je na sestavo presežne likvidnosti vplival začetek izvajanja dvostopenjskega sistema obrestovanja imetij presežne likvidnosti v euroobmočju od sedmega obdobja izpolnjevanja obveznih rezerv. Samo stanja na tekočih računih finančnih institucij do največje dovoljene ravni so izvzeta iz negativnega obrestovanja po obrestni meri za mejni depozit. Zaradi tega so bila sredstva v imetju finančnih institucij prenesena iz mejnega depozita, ki se je zmanjšal za 253,6 milijarde EUR, na tekoče račune, ki so se povečali za 284,9 milijarde EUR.
Gibanje obrestnih mer
V sedmem in osmem obdobju izpolnjevanja obveznih rezerv je ostala eurska kratkoročna obrestna mera (€STR) na splošno stabilna. Obrestne mere ECB za odprto ponudbo mejnega depozita, operacije glavnega refinanciranja in odprto ponudbo mejnega posojila so ostale v obravnavanem obdobju nespremenjene. Posledično je v sedmem in osmem obdobju izpolnjevanja obveznih rezerv €STR ostala stabilna na ravni –53,9 oziroma –54,0 bazičnih točk. Uvedba dvostopenjskega sistema obrestovanja ni bistveno vplivala na raven €STR. EONIA, ki se od oktobra 2019 izračunava kot obrestna mera €STR plus fiksni pribitek, se je gibala vzporedno z €STR.
23 Tudi če se glavnica ponovno investira v celoti, se lahko zaradi operativnih razlogov pri skupnem obsegu
in sestavi programa nakupa vrednostnih papirjev pojavijo manjša začasna odstopanja. Glej članek z naslovom »Taking stock of the Eurosystem's asset purchase programme after the end of net asset purchases«, Ekonomski bilten, številka 2, ECB, 2019.

Ekonomski bilten ECB, številka 2 / 2020
57
4 Posledice javnofinančnih ukrepov za spopadanje s podnebnimi spremembami
Pripravil Steffen Osterloh
V tem okvirju ocenjujemo vpliv, ki ga bodo imeli javnofinančni ukrepi za zmanjšanje emisij toplogrednih plinov na rast in inflacijo v obdobju, ki ga zajemajo letošnje marčne projekcije strokovnjakov ECB. Sedanji cilji glede zmanjšanja emisij in cilji politik na ravni EU za obdobje 2021–2030 temeljijo na okviru podnebnih in energetskih politik do leta 2030, ki ga je Evropski svet sprejel leta 2014. V okviru so določeni zavezujoči cilji za zmanjšanje emisij toplogrednih plinov pod raven iz leta 1990, in sicer zmanjšanje emisij za 20% do leta 2020 in za vsaj 40% do leta 2030. Politike za zmanjšanje emisij ogljikovega dioksida v Evropski uniji sestavljajo: (a) sistem EU za trgovanje z emisijami, ki zajema približno 45% emisij toplogrednih plinov v EU in omejuje emisije predvsem iz sektorjev z veliko porabo energije v Evropski uniji ter na Islandiji, v Lihtenštajnu in na Norveškem, kot so na primer elektrarne, energetsko intenzivne panoge in leti med letališči v Evropskem gospodarskem prostoru (EGP); (b) nacionalni ukrepi v sektorjih, ki niso zajeti v sistem za trgovanje z emisijami, kot so na primer promet, ogrevanje in kmetijstvo.
Sistem EU za trgovanje z emisijami zagotavlja zanesljivo zmanjšanje letnih emisij v sektorjih, ki jih zajema, vendar pa ne odpravlja negotovosti glede gibanja cen pravic do emisij. Sistem EU za trgovanje z emisijami deluje po načelu omejevanja emisij in trgovanja z njimi, pri čemer določa zgornjo mejo skupne količine nekaterih toplogrednih plinov, ki jih lahko izpustijo v ozračje naprave, zajete v sistemu, in omogoča podjetjem, da trgujejo s svojimi pravicami do emisij. Zgornja meja se sčasoma znižuje, tako da se skupne emisije zmanjšujejo. Delež pravic za prodajo na dražbi – to so pravice, ki podjetjem niso razdeljene brezplačno – se je sčasoma povečeval in se je v obdobju trgovanja 2013–2020 zvišal na 57%. Cena, ki jo morajo podjetja plačati za delež pravic za prodajo na dražbi, ima podoben učinek kot davek na vsebnost ogljika v proizvodnih dejavnikih podjetja, saj se zaradi tega takoj povečajo proizvodni stroški. Empirična literatura kaže, da se je zvišanje stroškov zaradi zvišanja cen pravic iz sistema za trgovanje z emisijami, v veliki meri preneslo na cene življenjskih potrebščin.24
Gibanje cen pravic iz sistema EU za trgovanje z emisijami v zadnjih dveh letih bi lahko ustvarilo določene omejene inflacijske pritiske, vendar trgi pričakujejo, da se bodo cene v obdobju projekcij kvečjemu še naprej zmerno zviševale. Potem ko je bila cena iz sistema za trgovanje z emisijami razmeroma stabilna na nizki ravni, ki je med letoma 2012 in 2017 v povprečju znašala okrog 6 EUR na tono CO2, se je v letih 2018 in 2019 precej zvišala ter na koncu leta 2019 znašala okrog 25 EUR na tono. Zvišanje je povzročilo tudi skokovit porast javnofinančnih prihodkov od pravic za prodajo na dražbi in dodatne stroške za podjetja. To nakazuje pozitiven vpliv na inflacijo v euroobmočju v letih 2018 in 2019 ter negativen, a zelo majhen vpliv na rast BDP. Kljub sedanjemu omejevanju pravic do emisij terminske cene iz sistema za
24 Glej na primer Martin, R. et al., »The Impact of the European Union Emissions Trading Scheme on
Regulated Firms: What Is the Evidence after Ten Years?«, Review of Environmental Economics and Policy, letnik 10, številka 1, 2016, str. 129–148.

Ekonomski bilten ECB, številka 2 / 2020
58
trgovanje z emisijami trenutno vseeno ne kažejo na nadaljnji skokovit porast cen, kar nakazuje, da se v prihodnjih letih ne pričakuje velikega vpliva na cene življenjskih potrebščin. Kljub temu pa volatilne cene pravic še naprej predstavljajo dejavnik tveganja za inflacijo.
Zmanjšanje emisij v ostalih sektorjih (ki niso zajeti v sistem za trgovanje z emisijami) je opredeljeno v uredbi o porazdelitvi prizadevanj. S to zakonodajo se določajo zavezujoči letni cilji glede emisij toplogrednih plinov za države članice EU za obdobji 2013–2020 in 2021–2030. Na splošno so nacionalni cilji, da bi se emisije v primerjavi z ravnijo iz leta 2005 skupno zmanjšale za okrog 10% do leta 2020 in 30% do leta 2030. Za razliko od sektorjev, vključenih v sistem za trgovanje z emisijami, so za oblikovanje politik za doseganje nacionalnih ciljev v sektorjih, ki niso zajeti v sistem za trgovanje z emisijami, odgovorne države članice.
V Nemčiji je bil pred kratkih sklenjen dogovor o nacionalnem sistemu za določanje cen emisij ogljikovega dioksida v sektorjih, ki niso zajeti v sistem EU za trgovanje z emisijami, kar bo predvidoma pozitivno vplivalo na inflacijo. V okviru »podnebnega svežnja«, o katerem je bil sklenjen dogovor decembra 2019, bo leta 2021 uveden nacionalni sistem za določanje cen emisij ogljikovega dioksida v sektorju prometa in ogrevanja stavb. Ker bo cena v sistemu za določanje cen emisij na začetku fiksna, nato pa se bo od leta 2025 postopno zviševala, bo sistem sprva podoben davku na ogljikov dioksid. V napovedih iz decembra 2019 se je upošteval prvotni koalicijski dogovor o začetni ceni 10 EUR na tono CO2 v letu 2021. Napovedan je bil pozitiven učinek na inflacijo med letoma 2021 in 2022, učinek na BDP pa naj bi bil po pričakovanjih majhen.25 Vpliv na cene in BDP bo po pričakovanjih omejen, ker se bo velik delež prihodkov od prodaje pravic izplačal kot nadomestilo industriji in potrošnikom, predvsem kot nižje cene elektrike zaradi znižanja dajatve, ki jo nalaga nemški zakon o obnovljivih virih energije (Erneuerbare-Energien-Gesetz) v skladu z naraščajočimi cenami CO2. Obenem se bodo povečali tudi odhodki, povezani s podnebnimi ukrepi. V napovedi iz marca 2020 je vključen revidiran sveženj, ki predvideva veliko višjo ceno na tono CO2 v letu 2021 (25 EUR), ki bo do leta 2025 narasla na 55 EUR na tono. Vseeno pa bodo makroekonomske posledice teh popravkov predvidoma majhne, ker bo učinek višje cene CO2 zmanjšan zaradi napovedi, da bodo dodatni prihodki v celoti porabljeni za nadaljnje zniževanje cen elektrike prek znižanja dajatve iz zakona o obnovljivih virih energije.
V naslednjih letih se ne pričakuje, da bo davek na ogljikov dioksid velikokrat zvišan. Davki na ogljikov dioksid, ki se zaračunavajo glede na vsebnost ogljika v gorivih, so skupaj z omejitvijo emisij ogljikovega dioksida in shemami trgovanja z emisijami najbolj stroškovno učinkovit instrument za zmanjševanje emisij ogljikovega dioksida. Samodejno postopno zviševanje cen ogljikovega dioksida za doseganje nacionalnih ciljev glede zmanjšanja emisij bi gospodinjstvom in podjetjem omogočilo, da se prilagodijo, vendar trenutno takšen samodejen mehanizem ni vzpostavljen v nobeni od osmih držav euroobmočja z davkom na ogljikov dioksid. Irska je sprejela zakonodajo za zvišanje davkov na ogljikov dioksid v letu 2020, ki ima zelo majhne javnofinančne posledice za euroobmočje kot celoto, hkrati pa je vlada izrazila namero,
25 Kvantifikacija je na voljo v »The impact of the Climate Package on economic growth and inflation«,
Monthly Report, Deutsche Bundesbank, Frankfurt na Majni, december 2019.
Ekonomski bilten ECB, številka 2 / 2020
59
da se bo davek do leta 2030 zviševal linearno. Na Portugalskem je vzpostavljen mehanizem, ki stopnjo davka na ogljikov dioksid povezuje s ceno pravic iz sistema EU za trgovanje z emisijami v predhodnem letu, kar je pred kratkim povzročilo zvišanje davka. V preostalih državah trenutno ni predvideno zvišanje stopnje davka na ogljikov dioksid.
V obdobju projekcij več držav načrtuje zvišanje okoljskih davkov, vendar je njihov skupni obseg na ravni euroobmočja omejen. Več kot polovica držav euroobmočja načrtuje, da bodo v naslednjih dveh letih zvišale druge okoljske davke (razen davkov na ogljikov dioksid). Zvišanje je večinoma povezano s trošarinami na energente in goriva, vendar se nanaša tudi na davke na vozila in letalske vozovnice. Največje zvišanje teh davkov je predvideno na Nizozemskem, čeprav bo makroekonomske učinke večinoma odtehtalo kompenzacijsko znižanje davkov na energente. V drugih državah so ti ukrepi običajno majhni (v skoraj vseh primerih je medletno zvišanje nižje od 0,1% BDP), njihov obseg za euroobmočje kot celoto pa je neznaten. Obenem se bodo v nekaterih primerih izvajali ukrepi posrednega obdavčenja z ekspanzivnim učinkom, kot je na primer znižanje davkov, ki spodbuja uporabo javnega prevoza, električne mobilnosti ali utekočinjenega naftnega plina. Poleg tega zelo majhno število držav podpira prehod v zeleno gospodarstvo z ukrepi neposrednega obdavčenja.
Gledano v celoti, bo vpliv podnebnih ukrepov na BDP in cene v euroobmočju v
obdobju 2020–2022 predvidoma majhen, v srednjeročnem obdobju pa lahko zaostrovanje ciljev za zmanjšanje emisij predstavlja tveganje navzgor
usmerjenih pritiskov na inflacijo. Medtem ko bo imel nemški zakonodajni sveženj
po pričakovanjih določen vpliv na inflacijo v euroobmočju v letih 2021 in 2022, pa
nobena druga velika država članica trenutno nima konkretnih načrtov za podoben
sistem za določanje cen emisij. Znatnega učinka ni pričakovati niti v drugih državah, ki
so že uvedle davke na ogljikov dioksid. Več držav članic načrtuje zvišanje okoljskih
davkov, vendar bodo v euroobmočju kot celoti posledice za rast in cene v obdobju
projekcij predvidoma majhne. Vseeno pa se vpliv podnebnih ukrepov na cene
srednjeročno lahko poveča zaradi možnega nadaljnjega zaostrovanja ciljev za
zmanjšanje emisij v okviru evropskega zelenega dogovora, ki ga je Evropska komisija
napovedala decembra 2019. Ambicioznejši cilji imajo lahko pozitiven učinek na cene
pravic do emisij v sistemu EU za trgovanje z emisijami, hkrati pa se lahko v ciljih določi
tudi izvajanje novih nacionalnih ukrepov (na primer nacionalni sistem za trgovanje z
emisijami ali davki na ogljikov dioksid), kar bo imelo pozitiven učinek na splošno raven
cen.

Ekonomski bilten ECB, številka 2 / 2020
60
Članki
1 Multinational enterprises, financial centres and their implications for external imbalances: a euro area perspective
Prepared by Virginia Di Nino, Maurizio Michael Habib and Martin Schmitz
This article analyses how the operations of large multinational enterprises (MNEs) affect the external account of the euro area and, in general, financial centres. The increased ease of moving intangible assets, profits and headquarters across borders poses challenges to the current framework of international statistics and economic analysis. First, the article shows how MNE operations are recorded in cross-border statistics, as well as the challenges in measuring such data. Second, the article highlights evidence of the impact that MNEs have on the external account of the euro area – this is most evident in current account balances and foreign direct investment in euro area financial centres, often involving special-purpose entities (SPEs). Third, the article looks at the tendency of financial centres to report current account surpluses that may be tentatively attributed, in part, to the activity of MNEs. Multilateral initiatives could help to improve the transparency of MNE operations and ensure an exchange of information across borders for statistical and tax purposes.
1 Introduction
The rise of large, profitable, global firms and the mobility of intangible assets26 have increased the relevance of firms’ profit-shifting activities, posing challenges to the current framework of international statistics. The balance sheets of large multinational enterprises (MNEs)27 have become very sizeable. The assets of the largest listed companies in major advanced economies, amounting to a value of several hundred billions of US dollars, are roughly equal to the gross domestic product of many small open economies. In order to reduce their tax burden, MNEs carry out a range of activities: these include shifting profits to low-tax jurisdictions by manipulating transfer pricing28 and shifting intra-company positions – often this involves complex financial structures and the creation of SPEs in low-tax, or no-tax, jurisdictions. These activities are extremely difficult to track. The novelty of some 26 Intangible assets include non-physical items such as goodwill items, brand recognition products and
intellectual property products (IPPs). IPPs, such as licenses and patents, result from varying combinations of research, development, investigation and innovation that lead to knowledge; using this knowledge is restricted by laws or other means of protection (see European system of accounts - ESA 2010). Research and development leading to assets of intellectual property are recorded as gross fixed capital formation.
27 Multinational enterprises are enterprises producing goods or delivering services in more than one country. MNE headquarters are rarely located in more than one country (the home country). However they operate in a number of other countries (the host countries).
28 Transfer pricing refers to the rules and methods for pricing transactions within and between enterprises under common ownership or control.

Ekonomski bilten ECB, številka 2 / 2020
61
activities – in particular the growth in intellectual property products and improved opportunities to strategically choose their location – poses significant challenges for the existing framework of national and international statistics, which is based on the concept of residence29.
International tax avoidance by MNEs is not a novel phenomenon but its rapid growth increasingly attracts the attention of academics and policy makers.30 Global firms respond to tax incentives when recording worldwide income among affiliates. A recent survey of this literature finds that a decrease by one percentage point in the statutory corporate tax rate translates into a 1% expansion of before-tax income for global firms.31 Importantly, this study shows that the estimated impact appears to be increasing over time. Transfer pricing and licensing seem to be the main channels of tax avoidance – these appear to be more important than financial planning.32 International taxation may also alter the geography of foreign direct investment (FDI): a higher statutory tax rate in a target investment country discourages the acquisition of firms in that country, while lower tax burdens may attract FDI related to profit-shifting activities.33 Another area of research focuses on the implications of these tax-avoidance activities for the measurement of the external wealth of nations and the diminished ability of governments when it comes to taxing the corporate profits of global firms.34
A number of policy initiatives at the international level have been launched to counteract the intensification of tax avoidance. The Organisation for Economic Co-operation and Development (OECD) estimates that 240 billion US dollars in tax revenues are lost globally every year as a result of tax avoidance by MNEs. As a result, the OECD and the G20 sponsored the Base Erosion and Profit Shifting (BEPS) Project, including an action plan that identifies 15 actions intended to limit international tax avoidance.35 This initiative currently involves over 135 countries, including the European Union (EU) Member States. The EU built on the BEPS Project’s recommendations by adopting two Anti-Tax Avoidance Directives, which entered into force between 2019 and 2020. The EU reform package includes concrete measures to reduce tax avoidance, boost tax transparency and move towards a level playing field
29 See Avdjiev, S., Everett, M., Lane, P.R. and Shin, H.S., “Tracking the international footprints of global
firms”, BIS Quarterly Review, March 2018. 30 See, for example, Tørsløv, L., Wier, L. and Zucman, G., “The Missing Profits of Nations”, NBER working
paper, No 24701, August 2018. 31 See Beer. S. de Mooij, R and Liu, L., “International corporate tax avoidance: A review of the channels,
magnitudes, and blind spots”, Journal of Economic Surveys, Special issue, January 2019, pp. 1-29. 32 See Heckemeyer, J. H., Overesch, M., “Multinationals’ profit response to tax differentials: Effect size and
shifting channels”, Canadian Journal of Economics/Revue canadienne d'économique, Vol. 50, No 4, 2017.
33 See Arulampalam, W., Devereux, M.P. and Liberini, F., “Taxes and the location of targets, Journal of Public Economics, Vol. 176, 2019, pp. 161-178.
34 See Zucman, G., “Taxing across Borders: Tracking Personal Wealth and Corporate Profits”, Journal of Economic Perspectives, fall, Vol. 28, No 4, 2014, pp. 121-148.
35 See OECD BEPS 2015 Final Reports.
Ekonomski bilten ECB, številka 2 / 2020
62
for all businesses in the EU, but also new requirements for MNE financial reporting (see Box 1).36
Box 1 Tax avoidance and transparency: policy initiatives at the international and EU level
Prepared by Maurizio Michael Habib and Martin Schmitz
At the international level, the OECD, with the support of the G20, championed work on limiting tax avoidance. The OECD/G20 BEPS Project, finalised in 2015, proposes measures to reduce tax avoidance; it also includes new requirements for MNE financial reporting, in particular for country-by-country reporting by 2025. Many of the recommendations of the OECD/G20 BEPS Project have been transposed at the EU level via the European Commission’s broad Anti-Tax Avoidance Package.37 This package also includes the revision of the Administrative Cooperation Directive, proposing country-by-country reporting between Member States' tax authorities on key tax-related information concerning multinationals operating in the EU.
Statistical compilers need to closely cooperate internationally to ensure that MNE activities are recorded consistently from country to country. This means that they have to share confidential data on MNEs and their subsidiaries across borders. The GNI pilot project, launched by the European Statistical System Committee in 2018, takes steps in this direction; it aims to jointly assess the consistency of statistical recording among national statistical authorities, using a sample of 25 MNEs in Europe.
Moreover, some national statistical authorities have set up large case units to monitor the activities of MNEs nationally. However, no formal coordination exists yet at the international level. Further development of legal entity identifiers and business registers would also be instrumental in improving national accounts and b.o.p. statistics.38
The traces of MNE operations are particularly apparent in the external statistics of financial centres. Since the euro area hosts some significant financial centres, this article discusses the dynamics of their external accounts. We adopt a standard operational definition of financial centres on the basis of the size of their stock of foreign liabilities relative to GDP. These are therefore economies where financial activities tend to dominate domestic economic activity. In particular, financial centres are defined as the ten advanced economies with the largest ratios of foreign liabilities to GDP in a large sample of more than 60 countries. These ten financial centres include six euro area economies (Belgium, Cyprus, Ireland, Luxembourg, Malta and the Netherlands) and four non-euro area economies (Hong Kong SAR, Singapore,
36 See Directive (EU) 2016/1164 of 12 July 2016 laying down rules against tax avoidance practices that
directly affect the functioning of the internal market (OJ L 193, 19.7.2016, p. 1) and Directive (EU) 2017/952 of 29 May 2017 amending Directive (EU) 2016/1164 as regards hybrid mismatches with third countries (OJ L 144, 7.6.2017, p. 1).
37 See the European Commission’s Anti-Tax Avoidance Package. 38 Initiatives in this field include the LEI (Legal Entity Identifier), the Register of Institutions and Affiliates
Database (RIAD) – which is a business register, operated by the European System of Central Banks (ESCB) – and the Eurogroup’s Register (EGR), which is used for statistical purposes on MNEs in the EU and operated by the European Statistical System.
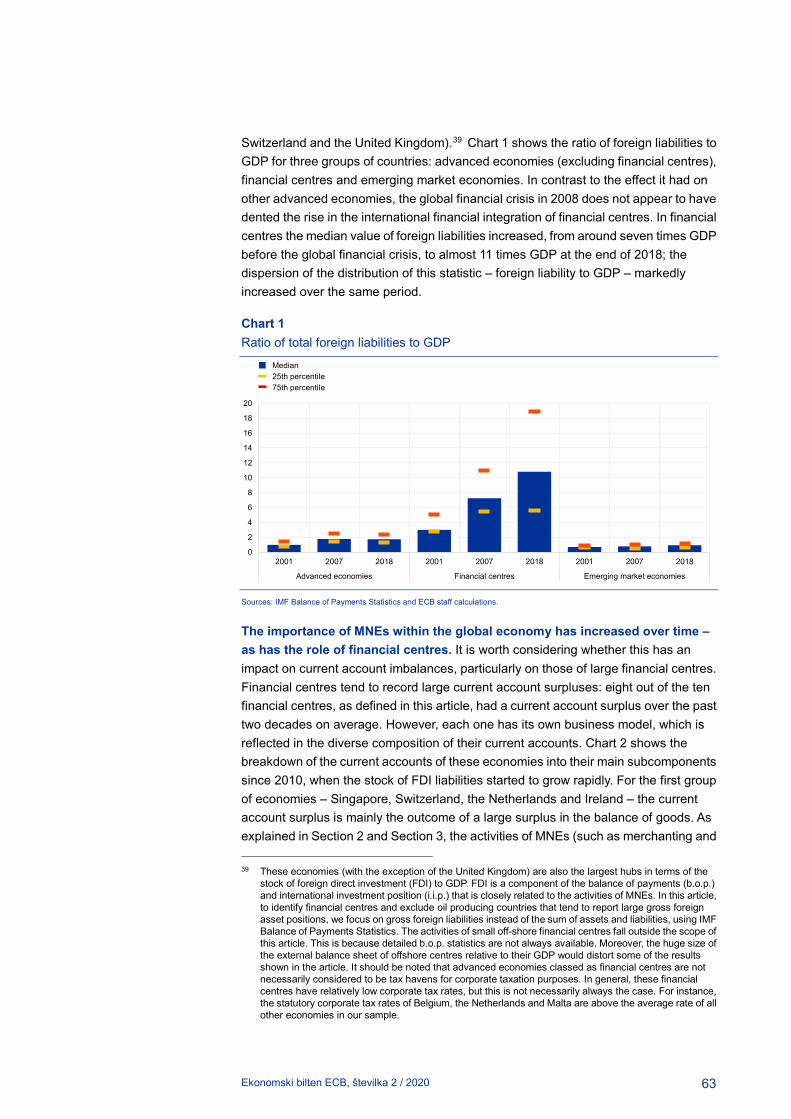
Ekonomski bilten ECB, številka 2 / 2020
63
Switzerland and the United Kingdom).39 Chart 1 shows the ratio of foreign liabilities to GDP for three groups of countries: advanced economies (excluding financial centres), financial centres and emerging market economies. In contrast to the effect it had on other advanced economies, the global financial crisis in 2008 does not appear to have dented the rise in the international financial integration of financial centres. In financial centres the median value of foreign liabilities increased, from around seven times GDP before the global financial crisis, to almost 11 times GDP at the end of 2018; the dispersion of the distribution of this statistic – foreign liability to GDP – markedly increased over the same period.
Chart 1 Ratio of total foreign liabilities to GDP
Sources: IMF Balance of Payments Statistics and ECB staff calculations.
The importance of MNEs within the global economy has increased over time – as has the role of financial centres. It is worth considering whether this has an impact on current account imbalances, particularly on those of large financial centres. Financial centres tend to record large current account surpluses: eight out of the ten financial centres, as defined in this article, had a current account surplus over the past two decades on average. However, each one has its own business model, which is reflected in the diverse composition of their current accounts. Chart 2 shows the breakdown of the current accounts of these economies into their main subcomponents since 2010, when the stock of FDI liabilities started to grow rapidly. For the first group of economies – Singapore, Switzerland, the Netherlands and Ireland – the current account surplus is mainly the outcome of a large surplus in the balance of goods. As explained in Section 2 and Section 3, the activities of MNEs (such as merchanting and 39 These economies (with the exception of the United Kingdom) are also the largest hubs in terms of the
stock of foreign direct investment (FDI) to GDP. FDI is a component of the balance of payments (b.o.p.) and international investment position (i.i.p.) that is closely related to the activities of MNEs. In this article, to identify financial centres and exclude oil producing countries that tend to report large gross foreign asset positions, we focus on gross foreign liabilities instead of the sum of assets and liabilities, using IMF Balance of Payments Statistics. The activities of small off-shore financial centres fall outside the scope of this article. This is because detailed b.o.p. statistics are not always available. Moreover, the huge size of the external balance sheet of offshore centres relative to their GDP would distort some of the results shown in the article. It should be noted that advanced economies classed as financial centres are not necessarily considered to be tax havens for corporate taxation purposes. In general, these financial centres have relatively low corporate tax rates, but this is not necessarily always the case. For instance, the statutory corporate tax rates of Belgium, the Netherlands and Malta are above the average rate of all other economies in our sample.
0
2
4
6
8
10
12
14
16
18
20
2001 2007 2018 2001 2007 2018 2001 2007 2018
Advanced economies Financial centres Emerging market economies
Median25th percentile75th percentile

Ekonomski bilten ECB, številka 2 / 2020
64
contract manufacturing) may boost the goods balance of financial centres. For a second group of economies – Luxembourg, Malta and Hong Kong – the surplus is mostly due to the service balance, in turn driven by the financial services sector.
Chart 2 Average current account balances of financial centres between 2010 and 2018
(percentage of GDP)
Sources: IMF Balance of Payments Statistics and ECB staff calculations.
The correct measurement of external statistics, such as those discussed in this article, is important for central banks. Large external imbalances may raise concerns about the sustainability of economic growth and about financial stability, which can affect monetary policy and macroprudential policies. For instance, central banks monitor external accounts to assess the equilibrium value of exchange rates, while noting potential misalignments – this is because abrupt and significant corrections in exchange rates may influence inflation developments. A distorted representation of aggregate current account imbalances could provide flawed signals to policy makers.
This article is structured as follows. Section 2 explains how typical operations by MNEs are recorded in balance of payments (b.o.p.) and international investment position (i.i.p.) statistics; it also highlights relevant challenges faced when measuring these statistics. Section 3 aims to gauge the quantitative relevance of MNE operations for the external accounts of euro area countries, in particular distinguishing financial centres from other euro area economies, and focusing on aspects of trade and the composition of euro area FDI. Section 4 summarises and concludes the article.
-40
-30
-20
-10
0
10
20
30
40
Singapore Switzerland Netherlands Luxembourg Ireland Malta Hong KongSAR
Belgium UnitedKingdom
Cyprus
Current accountTrade in goodsTrade in servicesInvestment incomeOther income

Ekonomski bilten ECB, številka 2 / 2020
65
2 Recording multinational enterprise operations in balance of payments statistics
2.1 The origins of measurement challenges
The operations of large MNEs affect national accounts statistics and, in particular, external accounts, thus creating challenges for statistical compilation and economic analysis.40 This section reviews how typical MNE operations are captured in b.o.p. and i.i.p. statistics; it also highlights some of the associated measurement challenges. MNE tax planning strategies mainly affect b.o.p. data in three ways: (i) by shifting profits to affiliates in low-tax jurisdictions, which can involve moving IPPs or manipulation of transfer prices on intra-firm trade; (ii) by shifting intra-firm debt obligations and capital linkages; (iii) by redomiciling headquarters and legal incorporations to financial centres with favourable tax arrangements. This section also shows why these activities have different implications for the current account and i.i.p. of countries hosting MNEs and their affiliates.
Measurement challenges are caused by friction between residence-based national statistics methodologies and the global activities and ownership structures of large MNEs. B.o.p. and national accounts statistics, and their associated data collection processes, are based on the residency concept, according to which each institutional unit41 is resident of one economic territory: the place where they have their centre of predominant economic interest. However, MNEs tend to organise their production chains and corporate structures across the globe involving numerous legal entities, including SPEs (see Box 2).42 Data on these entities are recorded in the national b.o.p. statistics for the economy of the country where they reside. Consequently these data are not consolidated across borders with the home country of their parent MNE.43
40 See Stapel-Weber, S. et al., “Meaningful Information for Domestic Economies in the Light of
Globalization - Will Additional Macroeconomic Indicators and Different Presentations Shed Light?”, NBER Working Paper, No 24859, 2018.
41 The following qualify as institutional units: households, corporations, non-profit institutions, government units and legal or social entities recognised by law or society, or other entities that may own or control them.
42 The UNCTAD World Investment Report 2015 shows that larger MNEs are associated with a greater complexity of their internal ownership structures. The top 100 MNEs in UNCTAD’s Transnationality Index have on average more than 500 affiliates across more than 50 countries, with seven hierarchical levels, involving 20 holding companies.
43 The BIS provides accounts for international banking groups consolidated to their home country (in the locational banking statistics by nationality). In a similar vein, Tissot 2016 (“Globalisation and financial stability risks: is the residency-based approach of the national accounts old-fashioned?” BIS Working Papers, No 587, 2016) argues that large MNE groups should be consolidated with the home country. This would require the sharing of confidential data across borders, as statistical data collection is also organised according to the residency principle.

Ekonomski bilten ECB, številka 2 / 2020
66
Box 2 Towards a recording of special-purpose entities in cross-border statistics
Prepared by Martin Schmitz
The use of SPEs by MNEs has increased rapidly in recent years.44 According to a recent Task Force of the Balance of Payments Committee (BOPCOM) at the International Monetary Fund (IMF), an SPE is: (i) a formally registered or incorporated legal entity that is resident in an economy and recognised as an institutional unit with little or no employment (up to a maximum of five employees), little or no physical presence, and little or no physical production activities in the host economy; (ii) directly or indirectly controlled by non-residents; (iii) established to obtain specific advantages provided by the host jurisdiction; (iv) transacting almost entirely with non-residents with large parts of the financial balance of a cross-border nature.45 The IMF BOPCOM Task Force proposed this internationally agreed definition of SPEs with the aim of collecting comparable cross-country data that separately identify SPEs in cross-border statistics. This is because the size of SPE-related cross-border financial flows and positions often tends to be outsized relative to a country’s domestic economy, blurring the analysis of macroeconomic statistics in the affected countries.
There is a high presence of SPEs in a number of euro area countries. This group of countries includes Cyprus, Ireland, Luxembourg, Malta and the Netherlands, which are all part of the financial centres group shown in Chart 1. In these economies SPEs have a significant impact on the i.i.p. and cross-border transactions, mainly affecting FDI but also portfolio and other investment. Moreover, in some cases, SPEs have non-financial assets (such as IPPs) on their balance sheet.
EU economies with SPE presence tend to a have a well-developed legal, financial and consulting services sector.46 MNEs may set up SPEs to organise their internal financing arrangement, which requires the availability of highly specialised service providers such as lawyers, tax consultants and financial sector experts in the economies that are hosting SPEs. Tax-avoidance strategies, for instance, often involve the establishment of complex corporate structures involving SPEs across several EU countries.
The IMF BOPCOM Task Force’s definition of SPEs would be helpful in ensuring the availability of internationally consistent external sector statistics with a separate breakdown for SPEs. The IMF BOPCOM aims to publish data that separately identify SPEs in cross-border statistics by the end of 2021. Achieving this goal would require further practical guidance on the application of the definition of SPEs in the light of their heterogeneous nature and their cross-border activities.
Measurement challenges are exacerbated by digitalisation and the increasing importance of IPPs, which are particularly relevant for financial centres. Over time the corporate structures of MNEs have become increasingly dynamic as a result of the redomiciling of headquarters and the increased relevance of intangible assets (such as patents and copyrights), which can be moved across borders with greater 44 See Lane, P.R. and Milesi-Ferretti, G.M., “International Financial Integration in the Aftermath of the
Global Financial Crisis”, IMF Economic Review, 66, 2018, pp. 189–222. 45 See the IMF Committee on Balance of Payments Statistics (BOPCOM)’s Final Report of the Task Force
on Special Purpose Entities, 2018. 46 See Jellema, T., Pastoris, F. and Picon-Aguilar, C., “A European perspective to observing and reporting
on SPEs”, ISI World Statistics Congress, 2019, and Galstyan, V., Maqui, E., McQuade, P., "International debt and Special Purpose Entities: evidence from Ireland", ECB Working Paper Series, No 2301, ECB, Frankfurt am Main, July 2019.

Ekonomski bilten ECB, številka 2 / 2020
67
ease than physical assets, such as factories. These phenomena can have large effects in terms of magnitude and volatility of statistical indicators, which become especially visible in those economies where MNE transactions and balance sheets are large relative to the size of the domestic economy.
2.2 MNEs and current account balances
To trace the impact that MNE operations have on external accounts, various components of the b.o.p. need to be looked at separately.47 According to the b.o.p. identity, it holds that
𝐶𝐶𝐶𝐶 + 𝐾𝐾𝐶𝐶 + 𝐸𝐸𝐸𝐸 = 𝐹𝐹𝐶𝐶 (1)
where CA stands for the current account balance, KA for the capital account balance (comprising mainly transfers of capital and non-produced non-financial assets), EO for errors and omissions (capturing any statistical discrepancy), and FA for the financial account balance.48
MNE operations affect various items of a country’s current account balance, the key variable measuring trade, and income and transfer flows vis-à-vis non-residents. The current account consists of the trade balances in goods and services as well as cross-border factor income (primary income) and transfers (secondary income), with the first three being directly affected by the actions of MNEs:
𝐶𝐶𝐶𝐶 = 𝐺𝐺𝑑𝑑𝑑𝑑𝑑𝑑𝑑𝑑 + 𝑆𝑆𝑖𝑖𝑘𝑘𝑆𝑆𝑘𝑘𝑆𝑆𝑖𝑖𝑑𝑑 + 𝑃𝑃𝑘𝑘𝑘𝑘𝑃𝑃𝑘𝑘𝑘𝑘𝑃𝑃 𝐼𝐼𝑑𝑑𝑆𝑆𝑑𝑑𝑃𝑃𝑖𝑖 + 𝑆𝑆𝑖𝑖𝑆𝑆𝑑𝑑𝑑𝑑𝑑𝑑𝑘𝑘𝑘𝑘𝑃𝑃 𝐼𝐼𝑑𝑑𝑆𝑆𝑑𝑑𝑃𝑃𝑖𝑖 (2)
Cross-border production arrangements and merchanting activities related to MNEs can affect the trade-in-goods component of the current account. This might involve foreign subsidiaries of MNEs (in what is known as offshoring) or an unrelated foreign company (i.e. outsourcing). B.o.p. statistics are based on the concept of change in economic ownership. Which means, in contrast to international trade statistics that measure all goods crossing a country’s border, trade in goods recorded in b.o.p. statistics also includes contract manufacturing and merchanting. In contract manufacturing, an MNE hires a foreign company to produce a good. During the production process, the ownership of the inputs remains with the MNE and hence no trade flows are recorded in the b.o.p. (with the exception of an import by the MNE of manufacturing services from the foreign company that is producing the good). However, the b.o.p. does include the sale of the final products to third countries, which is consistent with the change in ownership principle. Merchanting is the process whereby a company purchases a good from an entity resident abroad, and subsequently sells it to a buyer in a third country without the good crossing the border of the country where the merchant is based.49 If such transactions involve foreign 47 Lane, P.R., “Risk Exposures in International and Sectoral Balance Sheet Data", World Economics, Vol.
16, Issue 4, 2015, pp. 55-76. 48 The financial account balance is defined in terms of net financial outflows, i.e. the net purchases of
foreign assets by domestic residents minus the net incurrence of liabilities by domestic residents vis-à-vis foreign residents.
49 The difference between revenues from the sale and purchase of the good (net of any expenses incurred to finance, insure, store and transport the good) is recorded as net exports of merchanting in the goods balance of the country where the company resides.
Ekonomski bilten ECB, številka 2 / 2020
68
entities belonging to the same group, their pricing has a decisive impact on the amount and location of profits booked, which is in line with the well-established concept of transfer pricing.50
MNE business operations affect trade in services, reflecting the rise of the knowledge economy and digitalisation. As IPPs can often be easily moved across borders within an MNE group, possibly involving SPEs, they affect exports and imports. 51 IPPs are hard to value at market prices and, therefore, MNEs may use them to avoid taxation. For example, one entity of an MNE might own the group’s IPP assets, while other entities in the same group pay licence fees and royalties for its use.
The primary income balance, which is dominated by investment income flows, is another component of the current account affected by MNE operations.52 Investment income reflects the receipts and payments generated by an economy’s external assets and liabilities (such as dividends and interest), and can be further decomposed into functional categories of the b.o.p. (FDI, portfolio investment, other investment and reserve assets).
MNE operations are particularly visible in FDI income.53 Income on FDI comes from its equity and debt components. Equity income can be further decomposed into dividends (profits distributed to the direct investor) and reinvested earnings (profits retained in the foreign affiliate). Crucially, the direct investor’s decision to reinvest earnings (i.e. to keep them in a foreign subsidiary) is recorded twice in offsetting ways in the b.o.p. – once as income on FDI, and once as a reinvestment of equal size in the financial account. In practice, MNEs can use complex corporate structures to optimise their tax burden – for example, by concentrating reinvested earnings in certain jurisdictions and by organising intragroup debt obligations. Apart from FDI, the cross-border ownership of MNEs may also affect portfolio investment in equity. In portfolio investment equity, only dividend payments are recorded in the income account, while non-distributed profits are not included.54
The MNE operations described in this article mainly affect the composition of a country’s current account balance, while leaving the level of the current account balance unchanged. For instance, let’s first assume that a company residing in “country A” manufactures a pharmaceutical product and exports it to
50 In many countries tax authorities apply what is known as the arms-length principle to transfer pricing (i.e.
the rules for pricing intra-group transactions). According to this principle, intra-group transactions need to be priced in the same way as transactions with unrelated firms.
51 Trade in IPPs is included in the other business services category of the b.o.p., while the royalties and fees for use of these assets are recorded as charges for the use of intellectual property. Non-produced intangible assets are recorded in the b.o.p.’s capital account.
52 Primary income also includes compensation of employees and other primary income. 53 An FDI relationship exists when a foreign direct investor holds equity that entitles it to 10% (or more) of
the voting power in the direct investment enterprise. Once the FDI relationship is established between two entities, all financial transactions between them are recorded as FDI.
54 The asymmetric treatment of reinvested earning in FDI and portfolio investment equity is seen, in some studies, as creating biases in the current account. See, for example, Thomas J. Jordan’s speech at the University of Basel from the 23 November 2017, which notes an upward bias for the Swiss current account surplus as the FDI profits (distributed and retained) earned by Swiss MNEs are included in the Swiss current account. As these MNEs are to a large extent owned by non-Swiss residents via portfolio equity investments only dividend payments “leave” Switzerland via the income account. While not recorded in the current account, the non-distributed profits should increase the market value of the Swiss MNEs and hence increase the portfolio equity liabilities in the i.i.p. of Switzerland.

Ekonomski bilten ECB, številka 2 / 2020
69
“country B”. This will generate a trade surplus in “country A” and a trade deficit in “country B”. Now, assume that the company resident in “country A” decides to move production offshore to a subsidiary, which is resident in “country C” (a financial centre economy) and subsequently the goods are sold to “country B”. This implies, all other things being equal, that the current account of “country A” records a profit – from the subsidiary in “country C” – equal in size to the net exports recorded before the decision to move production offshore. Thus, the value of the current account balance of “country A” is the same in either scenario, but the composition is altered in the second scenario because an investment income surplus replaces a trade surplus.
In contrast, MNE redomiciliation strategies – i.e. relocating their headquarters to another country – may have a significant impact on headline current account balances.55 Even if the redomiciliation of an MNE is not associated with additional economic activity in the economy of residency, the current account balance may be affected in several ways (e.g. due to attribution of net exports resulting from contract manufacturing or IPP related services trade). Primary income may be affected due to the differing treatment of reinvested earnings in FDI and portfolio equity. The country hosting the redomiciled global firm will record an improvement in the net FDI position and deterioration in the net portfolio equity position, to the extent that its shareholders are located outside the economy that hosts the new headquarters, which is typically the case for a small FDI hub. However, these two offsetting positions produce two different income streams. Reinvested earnings from foreign subsidiaries are recorded as income receipts and boost the recorded current account balance, whereas profits payments to foreign MNE shareholders are only recorded if they are distributed as dividends (in portfolio investment).
2.3 MNEs and cross-border financial and national accounts
Mirroring the current account, MNE operations also affect the financial account of the b.o.p. and external assets and liabilities. Changes to a country’s net i.i.p. can be broken down into net financial transactions as captured in the financial account (FA), revaluations due to changes in exchange rates and other asset prices (REV) and other volume changes (OVC).56
𝐼𝐼𝐼𝐼𝑃𝑃𝑡𝑡 − 𝐼𝐼𝐼𝐼𝑃𝑃𝑡𝑡−1 = 𝐹𝐹𝐶𝐶𝑡𝑡 + 𝑅𝑅𝐸𝐸𝑅𝑅𝑡𝑡 + 𝐸𝐸𝑅𝑅𝐶𝐶𝑡𝑡 (3)
MNEs have a particularly large impact on FDI, both in the i.i.p. and the financial account. All FDI transactions (such as withdrawals of equity and reinvestment of earnings) are recorded in the financial account and hence affect the i.i.p. as shown in equation (3). Redomiciliations, which imply cross-border movements of MNE balance sheets, may give rise to OVC as defined in equation (3) and can thereby substantially change a country’s i.i.p.
55 For a numerical example on the impact of redomiciliation on the current account, see Avdjiev et al.,
“Tracking the international footprints of global firms”, BIS Quarterly Review, March 2018. 56 Other volume changes include, for example, reclassifications, write-downs, breaks arising from changes
in sources and methods, and changes in the residency of companies.

Ekonomski bilten ECB, številka 2 / 2020
70
Finally, it should be noted that MNE activities not only impact cross-border statistics but also affect the broader national accounts. A case in point is Ireland, where investment income flows, related to redomiciled MNEs, the depreciation of IPPs and aircraft leasing, had a large impact on Irish GDP and GNI.57 As a result, Ireland’s Central Statistics Office publishes a number of modified economic indicators (such as GNI* and a modified current account CA*) that exclude these phenomena and thereby provide a more focused view of domestic economic developments.
3 How do multinational enterprise activities affect the euro area balance of payments?
MNE operations affect the external accounts of the euro area, though their impact varies markedly across the 19 euro area countries. The aggregate b.o.p. of the euro area masks the varied impact of MNE activities on the external statistics of each individual country. Euro area countries can be classified into two groups, which present marked differences in their external accounts: six economies that are specialised in providing financial services58 and another 13 economies that are not.
The size, composition and volatility of the current account and financial account balances of euro area financial centres are significantly affected by MNE transactions. Section 3.1 presents stylised facts on the euro area b.o.p. related to the activity of specialised subsidiaries, such as SPEs in financial centres, whose location is primarily determined by tax-related, financial and regulatory considerations. Section 3.2 then focuses on the impact that SPEs have on FDI.
3.1 Euro area current account
When comparing the composition and size of the current accounts of financial centres with those of other economies in the euro area, five key features stand out.
First, financial centres in the euro area share a similar current account composition: they exhibit large trade surpluses that are partly counterbalanced by income deficits. This is shown in Chart 3 and corroborated by the empirical evidence in Box 3 based on a larger sample of the top ten global financial centres. The trade surpluses of financial centres often reflect exports with large value added, such as those related to licences in the field of information and communications technology. The literature on global value chains (GVCs) has established that value added is mainly created in very upstream activities (e.g. research and development, design and financial services) or very downstream activities (e.g. merchanting, logistics, royalties from licences, branding and marketing) – financial centres appear to have
57 See Lane, P.R., “Notes on the treatment of global firms in national accounts”, Economic Letter Series,
Vol. 2017, No 1, Central Bank of Ireland, 2017. 58 This first group includes Cyprus, Luxembourg, Ireland, the Netherlands, Malta and Belgium. They are
defined as financial centres according to the size of their foreign liabilities to GDP, as described in Section 1 of this article.

Ekonomski bilten ECB, številka 2 / 2020
71
comparative advantages in several of these activities.59 If production is fragmented across borders, the allocation of value added across the firm’s network may result in financial centres appropriating a significant part of the value added on a global level. Income deficits can also reflect the practice of booking profits in financial centres.
Box 3 Financial centres and current account imbalances
Prepared by Maurizio Michael Habib
This box provides an empirical assessment of the size of current account imbalances in financial centres compared with other countries. As noted throughout this article, MNE activities widen the gross external positions and the current accounts of financial centres, while also affecting their composition. Moreover, financial centres tend to report current account surpluses. To a large extent, these observed patterns may be ascribed to the concentration of financial activities in a limited number of financial centres, which may not exclusively reflect MNE activities, but also those of banks, other financial intermediaries and individual investors resident in financial centres. It is, therefore, important to widen this analysis to the various subcomponents of financial centre current accounts, including the goods balance, the services balance and the investment income balance.
Empirical evidence confirms that the current account surpluses of financial centres, after controlling for other potential determinants of current account balances, are particularly large from a global perspective. Current account balances and their main subcomponents, across a panel of more than 60 economies since the early 2000s, are regressed on a number of traditional drivers, such as the net foreign asset position, GDP growth, terms of trade, the oil trade balance and per capita GDP. Table A reports the regressions results for the dummy variable identifying financial centres. Notably, this variable is positive and statistically significant in the first two columns of Table A. This confirms that, everything else being equal, financial centres tend to have larger current account surpluses and trade in goods surpluses – the latter is potentially the outcome of MNE merchanting and contract manufacturing activities. Financial centres post particularly large surpluses in the services balance (see column (3) of Table A), possibly related to financial activities that are not necessarily related to MNEs. In contrast, financial centres tend to report larger deficits in the investment income balance because the dummy in column (4) is negative and statistically significant, providing further support to the finding related to the income balance of euro area economies in Section 3.1. Finally, further analysis – not included here – suggests that the positive relationship between the status of financial centres and the current account (and the negative relationship between financial centres and investment income) has become stronger in recent years.
59 See Cheng, K., Rehman, S., Seneviratne, D., Zhang, S., “Reaping the benefits from Global Value
chains”, IMF, 2015; “Mapping Global Value Chains”, OECD, 2013; “Interconnected Economies: benefiting from Global Value Chains”, OECD, 2013.

Ekonomski bilten ECB, številka 2 / 2020
72
Table A Drivers of the current account and financial centres
Source: ECB staff calculations. Notes: The dependent variables are measured as a percentage of GDP using annual data from the period 2001-2018. The model for the current account in column (1) includes the net foreign asset position, GDP growth, terms of trade, the oil trade balance and per capita GDP as control variables. The model for trade in goods and services in columns (2) and (3) includes the same regressors as in (1), excluding the net foreign asset position. The model for the investment income balance in column (4) includes only the oil trade balance and the net foreign asset position as control variables. Pooled regressions estimated with Prais-Winsten heteroskedastic panels corrected standard errors (reported in parenthesis) and controlling for panel-specific autocorrelation of the residuals.
Second, the negative income balances recorded by euro area financial centres partly reflect the redistribution of profits to foreign shareholders. The sum of the income deficits in financial centres was 5% of their cumulated GDP in 2018, whereas the primary surplus in the other euro area economies stood at 1.6% of GDP. The global value added retained in financial centres is ultimately owned by foreign investors that receive an after tax profit which is recorded as income deficits. In practice, however, while aggregate income deficits are very common in euro area financial centres, not all arise from FDI income. They may also be driven by portfolio income, as in the case of Luxembourg and Cyprus. Heterogeneity in income balance composition reflects specific business models, i.e. different net direct investment and portfolio investment asset positions, as well as their position in the global capital network and in relation to other financial centres.
Third, the practice of moving value added to low-tax euro area jurisdictions may also inflate their trade surpluses, while producing the opposite effect in higher-tax economies. This is suggested by the different scale of the vertical axes in Chart 3. MNEs pursue several strategies aimed at avoiding taxes that, while vested differently, ultimately boil down to value added being shifted across borders; these strategies affect the trade balances of euro area countries.
Dependent variable
(1)
Current account
(2)
Trade in goods
(3)
Trade in services
(4)
Investment income
Financial centre dummy 5.29***
(1.27)
4.63***
(0.87)
6.13***
(1.67)
-1.93***
(0.83)
Observations 1,061 1,089 1,089 1,061
R-squared 0.36 0.57 0.26 0.34
Countries 61 61 61 61

Ekonomski bilten ECB, številka 2 / 2020
73
Chart 3 Current account balances of financial centres and other economies in the euro area
(as a percentage of GDP)
Source: ECB and Eurostat. Notes: Financial centres refer to Ireland, Belgium, Luxembourg, the Netherlands, Malta and Cyprus. The financial accounts of the two groups of countries are not netted out for intragroup flows. This chart is based on quarterly data. The last available observation is from the second quarter of 2019.
Available evidence shows that, as a result, the trade surplus of euro area financial centres stood at 13% of their combined GDP at the end of 2018. As shown in Chart 3, this contrasts with a surplus of less than 3% in the average of other euro area economies. Moreover, the surplus recorded by financial centres has tripled over the past decade, mirroring the growth in FDI recorded in the financial account of the b.o.p.
Fourth, contract manufacturing and merchanting conducted by entities resident in financial centres have generated a growing discrepancy between b.o.p. statistics and international trade statistics for euro area financial centres. Different concepts underlying the compilation of b.o.p. data with that of international trade statistics lead to some differences (see Section 2.2). In the euro area the gap between these two sources has been growing over time, in particular since 2015 (see Chart 4). Among euro area countries, financial centres account for the bulk of the growing discrepancy, whereas the discrepancy has remained stable for the other economies. This may be partly driven by MNE practices such as change of domicile and outsourcing of merchanting activities to specialised subsidiaries located in financial centres.
-20
-15
-10
-5
0
5
10
15
20
2015 2016 2017 2018 2019
Current account balanceGoods balanceServices balancePrimary income balanceSecondary income balance
a) Financial centres
-3
-2
-1
0
1
2
3
4
5
6
2015 2016 2017 2018 2019
b) Other euro area economies

Ekonomski bilten ECB, številka 2 / 2020
74
Chart 4 Euro area goods trade balance: the growing gap between b.o.p. and international trade statistics
(EUR millions)
Source: ECB and Eurostat, authors’ calculations. Notes: The blue area is the net exports of the euro area as recorded in national trade statistics. The yellow and the orange areas depict the difference between b.o.p. and trade statistics in financial centres and other euro area economies, respectively. The group of financial centres includes Ireland, Belgium, Luxembourg, the Netherlands, Malta and Cyprus. This chart is based on quarterly data. The last available observation is from the second quarter of 2019.
Fifth, the trade surplus of financial centres is mainly driven by value added that is produced elsewhere (i.e. foreign value added) and then re-exported. This contrasts with the group of other euro area economies, whose cumulated trade surplus primarily reflects domestic value added that is traded with final consumers. For a more detailed discussion of this feature, see Box 4.
Box 4 A representation of trade balances in terms of value added: financial centres versus other euro area economies
Prepared by Virginia Di Nino
The goods and services we buy are composed of inputs from various countries from around the world. As a result, the trade balance of each country can be decomposed in terms of (i) the value added that the exporting country itself has produced in every relevant transaction, and (ii) the value added produced by its partner economies in every relevant transaction. The former is called domestic value added (DVA). The latter is known as foreign value added (FVA). An additional useful distinction can be made between transactions directly involving the country that absorb the production (DIR) and transactions related to the intermediate stages of GVCs. This taxonomy helps better understand the
0
50,000
100,000
150,000
200,000
250,000
300,000
350,000
400,000
450,000
2010 2011 2012 2013 2014 2015 2016 2017 2018 2019
Euro area goods trade balance (trade statistics)
Other euro area countries (b.o.p. - trade statistics)Financial centres (b.o.p. - trade statistics)

Ekonomski bilten ECB, številka 2 / 2020
75
mechanisms generating the large surpluses of financial centres in the euro area as well as their contribution to the creation of global value added.60
Financial centres usually present large trade surpluses in value added derived from other countries, which cross the borders of these financial centres before reaching final consumers abroad (FVA-DIR). In other words, while financial centres import very little FVA that is absorbed domestically, they re-export large amounts of FVA directly to the final consumers in other countries, see Chart A – the green bars. This is not the case elsewhere. In particular, in the other euro area economies the trade surpluses reflect primarily domestic value added that is directly traded with the final consumers (DVA-DIR), as shown in Chart B – the blue bars.
Chart A Trade balance in value added for euro area financial centres
(as a share of GDP)
60 The evidence presented in this box is based on the World Input-Output Database (WIOD) that employs
b.o.p. statistics as an underlying source. The decomposition follows the methodology used in Borin, A. and Mancini, M., “Follow the value added: bilateral gross export accounting”, Temi di discussione (Economic working papers), No 1026, Bank of Italy, July 2015. The exercise focuses on four main components of the trade balance: i) the domestic value added absorbed by the direct importer (DVA direct); ii) the domestic value added exported and further re-exported as foreign value added in the GVC chain (DVA GVC); iii) foreign value added exported directly to the final consumer country (FVA direct); iv) foreign value added that is further exported by third countries in the GVC (FVA GVC), which only indirectly reaches the final absorbing economy. The trade balance of domestic value added exported abroad is a residual category, which is reflected and absorbed at home (DVA reflected).
-0.20
-0.15
-0.10
-0.05
0.00
0.05
0.10
0.15
0.20
0.25
0.30
2000 2001 2002 2003 2004 2005 2006 2007 2008 2009 2010 2011 2012 2013 2014
Domestic VA directDomestic VA GVCDomestic VA reflectedForeign VA directForeign VA GVCTrade balance

Ekonomski bilten ECB, številka 2 / 2020
76
Chart B Trade balance in value added for other euro area economies
(as a share of GDP)
Source: WIOD data and authors’ calculations. Notes: Financial centres include the Netherlands, Belgium, Ireland, Luxembourg, Malta and Cyprus.
Financial centres also typically present large deficits in the balance of domestic value added that is further re-exported (DVA-GVC). This reflects the fact that financial centres tend to occupy the very last stage(s) in the production chain as they are located more downstream – i.e. they are closer to the final consumers – than any other participants in the global production network.
While domestic value added exported to final consumers (DVA-DIR) is the dominant component in the trade balance of other euro area economies, it is interesting to observe that the same component measures however more than twice the size in financial centres (see blue bars in Charts A and B). Financial centres’ domestic contribution to the multi-stage production of goods and services is primarily in intangibles – the value of these is added at the very last stage and constitutes the difference between the final price and the factory price of a product.
If tax avoidance is one of the main factors shaping the trade balances in financial centres, then one should expect such balances to primarily reflect bilateral balances with higher tax, non-financial centres. Practices that manipulate trade prices mostly concern the bilateral trade relationships between financial and non-financial centres (i.e. low and higher taxation economies), thus resulting in selective trade surpluses. As a result, a more granular decomposition of the bilateral trade balances, expressed in terms of value added content, shows that financial centres hold large trade surpluses only in relation to higher taxation jurisdictions, especially euro area economies (whereas the positions in relation to other financial centres are more balanced).
In conclusion, the dissection of the trade balance in value added shows that financial centres are also conduits for real transactions. A tiny fraction of their total trade is for their own domestic consumption, whereas a significant share of their trade responds to different objectives, including escaping profit taxation.
-0.02
-0.01
0.00
0.01
0.02
0.03
0.04
0.05
0.06
2000 2001 2002 2003 2004 2005 2006 2007 2008 2009 2010 2011 2012 2013 2014
Domestic VA directDomestic VA GVCDomestic VA reflectedForeign VA directForeign VA GVCtrade balance

Ekonomski bilten ECB, številka 2 / 2020
77
3.2 Euro area foreign direct investment
FDI is a very significant component of the euro area’s financial account. In recent years it has gained prominence as a result of the striking expansion of gross transactions channelled by euro area financial centres (see Chart 5). The increase in gross FDI flows in turn reflects MNE activities, as discussed in this subsection.
The size of gross FDI flows going through financial centres is so large that they drive the aggregate developments of gross FDI in the euro area as a whole. FDI transiting through financial centres is, on average, between two and three times higher than that recorded by the other euro area economies. It is also three times more volatile. On a net basis, however, the FDI flows of the other euro area economies are more important in determining the aggregate net external position of the euro area (see Chart 5).
Chart 5 Financial account balances
Gross assets and liabilities (reverse scale) (percentage of euro area GDP)
Source: ECB and authors’ calculations. Note: Financial centres refer to Ireland, Belgium, Luxembourg, the Netherlands, Malta and Cyprus. Liabilities are reported in reverse scale on the negative values of the vertical axis and they are identified by the bars of the same colour as assets but in a lighter shade. The financial accounts of the two groups of countries are not netted out for intragroup flows. For the Netherlands data are available from 2003, for Malta from 2004, for Cyprus from 2008. Charts are based on quarterly data. The latest observations are for the second quarter of 2019.
As a result of MNE activity, gross FDI transactions in the euro area have become less stable and less predictable compared with when FDI mostly consisted of mergers and acquisitions and greenfield investment.61 Furthermore, the volatility of gross FDI flows in the euro area, once considered a stable source of external financing, rose above that of other financial flows in the post-crisis period (see Chart 5). Conversely, over the same period the volatility of 61 The coefficient of variation was computed separately based on groupings of countries (euro area
financial centres and other euro area economies) for the pre-crisis and post-2009 periods. An increase could be identified only in the volatility of transactions of SPE affiliates resident in financial centres. This finding is not driven by one specific financial centre but it emerges as a common pattern of FDI in this group of economies.
-25
-20
-15
-10
-5
0
5
10
15
20
25
2002 2004 2006 2008 2010 2012 2014 2016 2018
a) Financial centres
FDIPortfolioFinancial account
Rest
-25
-20
-15
-10
-5
0
5
10
15
20
25
2002 2004 2006 2008 2010 2012 2014 2016 2018
b) Other euro area economies

Ekonomski bilten ECB, številka 2 / 2020
78
gross FDI flows in the other euro area economies declined compared to pre-crisis values.
Another defining feature of FDI is the strong positive correlation between gross assets and liabilities, especially in financial centres. The very large degree of co-movement of FDI inflows and outflows is determined by capital passing through financial centres en route to other destinations (Chart 5).62 Complex international investment schemes have been engineered to take advantage of favourable corporate tax and legal conditions; this makes financial centres highly interconnected while also allowing them to preserve their own business models.
The bulk of FDI transactions in financial centres are carried out by financial subsidiaries or holding companies of MNEs, including SPEs. In fact, other financial institutions’ transactions (which include these entities) dominate the size and dynamics of FDI in financial centres, whereas NFCs drive gross asset and liabilities flows in the other euro area economies (see Chart 6). According to the dedicated IMF Task Force (see Box 2), SPEs are set up by MNEs specifically to access capital markets or sophisticated financial services; isolate owner(s) from financial risks; and/or reduce regulatory and tax burden; and/or safeguard confidentiality of their transactions and owner(s).63 Euro area financial centres offer many of these advantages. In particular, they have developed sophisticated financial instruments, such as securitised products. The SPEs located in euro area financial centres typically hold MNE equities, manage corporate MNE debt-issuance, and allocate financing across parent and subsidiaries.64
62 See Blanchard, O. and Acalin, J., “What Does Measured FDI Actually Measure?”, Peterson Institute for
International Economics Policy Brief 16-17, October 2016. 63 See “Final Report of the Task Force on Special Purpose Entities” IMF, 2018. 64 SPEs engineer different forms of corporate debt securitisations such as collateralised debt obligation
where debt is backed by other assets compensating the investor for the risk of default or by high-yield bonds (collateralised bond obligations) or through credit default swaps where investors are compensated in case of debt default. See Hira, A., Gaillard, N., Cohn, T. H., The failure of Financial Regulation: Why a Major Crisis Could Happen Again, Palgrave, 2019.
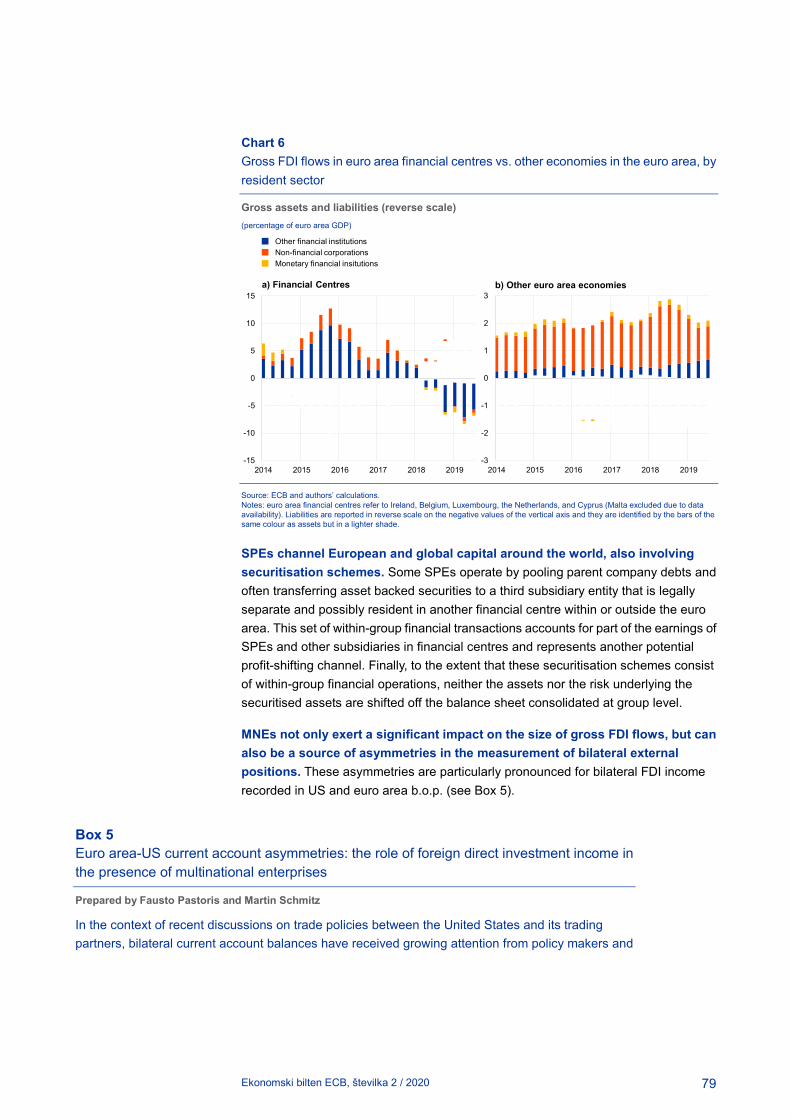
Ekonomski bilten ECB, številka 2 / 2020
79
Chart 6 Gross FDI flows in euro area financial centres vs. other economies in the euro area, by resident sector
Gross assets and liabilities (reverse scale) (percentage of euro area GDP)
Source: ECB and authors’ calculations. Notes: euro area financial centres refer to Ireland, Belgium, Luxembourg, the Netherlands, and Cyprus (Malta excluded due to data availability). Liabilities are reported in reverse scale on the negative values of the vertical axis and they are identified by the bars of the same colour as assets but in a lighter shade.
SPEs channel European and global capital around the world, also involving securitisation schemes. Some SPEs operate by pooling parent company debts and often transferring asset backed securities to a third subsidiary entity that is legally separate and possibly resident in another financial centre within or outside the euro area. This set of within-group financial transactions accounts for part of the earnings of SPEs and other subsidiaries in financial centres and represents another potential profit-shifting channel. Finally, to the extent that these securitisation schemes consist of within-group financial operations, neither the assets nor the risk underlying the securitised assets are shifted off the balance sheet consolidated at group level.
MNEs not only exert a significant impact on the size of gross FDI flows, but can also be a source of asymmetries in the measurement of bilateral external positions. These asymmetries are particularly pronounced for bilateral FDI income recorded in US and euro area b.o.p. (see Box 5).
Box 5 Euro area-US current account asymmetries: the role of foreign direct investment income in the presence of multinational enterprises
Prepared by Fausto Pastoris and Martin Schmitz
In the context of recent discussions on trade policies between the United States and its trading partners, bilateral current account balances have received growing attention from policy makers and
-15
-10
-5
0
5
10
15
2014 2015 2016 2017 2018 2019
Other financial institutionsNon-financial corporationsMonetary financial insitutions
a) Financial Centres
-3
-2
-1
0
1
2
3
2014 2015 2016 2017 2018 2019
b) Other euro area economies

Ekonomski bilten ECB, številka 2 / 2020
80
the media. However, the interpretability of bilateral current account statistics may be affected by the existence of bilateral asymmetries.65
In 2018 the euro area recorded a bilateral current account surplus of €131 billion vis-à-vis the United States, according to ECB data, while the euro area surplus amounted to only €40 billion in US Bureau of Economic Analysis (BEA) data (see panel (a) of Chart A).66 The euro area surplus was around €90 billion smaller according to BEA data, due to a €23 billion smaller area goods surplus and larger euro area deficits for services and primary income (by €17 billion and €55 billion, respectively).67 Panel (b) of Chart A reveals that the current account asymmetry has increased over time, largely due to the primary income balance, in particular in FDI.
The divergence in recording FDI income is particularly pronounced. In 2018 a paradoxical situation arose, in which both the euro area (according to ECB data) and the United States (according to BEA data) recorded positive income balances vis-à-vis each other (see panel (a) of Chart B). A large difference is observable for FDI income paid to US investors on their investments in the euro area, with the ECB recording a value around €85 billion lower than the corresponding figure reported by the BEA. In contrast, the income euro area residents earned on their FDI investment in the United States was relatively consistent in 2018 (diverging by around €18 billion).68 The large discrepancy in FDI income paid by the euro area to the United States arises primarily from data on US FDI investment in the Netherlands, Luxembourg and Ireland.
65 Bilateral asymmetries arise when reported exports of “country A” to “country B” are not mirrored by the
reported imports of “country B” from “country A”. 66 For this analysis the data reported by the BEA were converted from US dollar to euro, using the average
exchange rate over the respective time period. 67 The euro area’s secondary income deficit was €15 billion smaller according to BEA data, thereby slightly
reducing the overall current account balance discrepancy. 68 Bilateral FDI income data from the BEA are recorded on a directional basis and thus organised according
to whether the income derives from outward investment (US direct investment abroad) or inward investment (foreign direct investment in the United States). Bilateral FDI income data from the ECB are recorded on the basis of an asset/liability principle, classifying income as assets or liabilities. This difference in recording principles is not relevant for the income balance.

Ekonomski bilten ECB, številka 2 / 2020
81
Chart A Bilateral euro area-US current account balances
(panel (a): EUR billions; 2018; panel (b): EUR billions)
Source: ECB and BEA. Notes: Bilateral asymmetries are calculated as ECB data minus mirror BEA data – a positive value indicates that the euro area balance reported by the ECB is larger than the corresponding figure reported by the BEA.
-20
0
20
40
60
80
100
120
2013 2014 2015 2016 2017 2018
Current account Goods Services
Primary incomeSecondary Income
b) Bilateral asymmetries in US and euro area current account balance
-100
-50
0
50
100
150
200
Current account Goods Services Primary income Secondary Income
ECB dataUS BEA data
a) Bilateral euro area and US current account balances

Ekonomski bilten ECB, številka 2 / 2020
82
Chart B FDI between the euro area and the United States
(panel (a): EUR billions; panel (b): proportion to the total; 2018)
Source: ECB and BEA. Notes: Positive balance values indicate a surplus for the euro area in panel (a). “Other” includes mining, depository institutions, professional and technical services, other industries, and unallocated industries in panel (b). Euro area in panel (b) is based on BEA data available for Austria, Belgium, Finland, France, Germany, Greece, Ireland, Italy, Luxembourg, the Netherlands, Portugal and Spain.
US MNEs often resort to complex chains of ownership – involving multiple FDI relationships in several euro area countries – which complicate the estimation of FDI income. According to BEA data (see panel (b) of Chart B), more than 60% of US FDI in the euro area is invested in holding companies, while only around 10% directly reaches euro area manufacturing entities. Holding companies – which are often SPEs – may serve as the first links between US MNEs and their euro area subsidiaries. Crucially, the income of these holding companies also includes the profits earned from other entities in MNE ownership chains (known as indirectly owned affiliates). 69 Recording such income – in particular for retained earnings – is challenging for statisticians because it requires comprehensive access to MNE balance sheets and their ownership links. Differences in the information available on US MNEs may partly explain why FDI income paid to US investors is lower in European statistics compared to US statistics.
69 When a direct investment ownership chain with more than one hierarchical FDI link exists, direct
investment earnings should reflect income from direct and indirect enterprises. Income earned along the chain of ownership needs to be recorded in the directly-owned direct investment enterprise.
-100
-50
0
50
100
150
200
Balance Received from US Paid to US
ECB dataBEA data
a) Euro area-US FDI bilateral income flows
0% 10% 20% 30% 40% 50% 60% 70% 80% 90% 100%
ES
IT
BE
FR
DE
IE
LU
NL
Euro area
ManufacturingWholesale tradeInformation
FinanceHolding companiesOther
b) US FDI investment in the euro area by industry of euro area affiliate

Ekonomski bilten ECB, številka 2 / 2020
83
Differences in the identification of the immediate counterpart country may also contribute to the observed asymmetries in FDI income. The complexity of MNE corporate structures makes it difficult for statisticians to attribute linkages to the correct counterpart countries. There is some evidence pointing to differences between the United States and the euro area, as euro area countries attribute sizeable parts of FDI income paid to immediate counterparts in offshore financial centres (in line with international statistical standards). Subsequently, these income flows are likely to be passed through to the United States. 70 The BEA may partly attribute such income as directly received from the euro area (rather than from offshore centres).
Several work streams are active between b.o.p. compilers, monitoring and analysing the observed asymmetries of euro area countries vis-à-vis the United States – in particular in the context of FDI income flows.
4 Conclusions
This article analysed how the operations of large multinational enterprises (MNEs) are affecting the external accounts of the euro area and, in general, financial centres. First, the article presented how MNE operations are recorded in cross-border statistics, as well as the related measurement challenges. Second, this article showed the impact of MNEs on the external accounts of the euro area, which is most evident in the current account balances and in foreign direct investment of euro area financial centres, often involving special-purpose entities. Third, financial centre economies generally report current account surpluses that may be attributed, in part, to the activity of MNEs.
Multilateral initiatives to improve the transparency of MNE operations are necessary to ensure exchanges of information across borders both for tax and statistical purposes. Such initiatives should help national authorities to take action against tax avoidance. Moreover, close international cooperation between statistical compilers – including sharing of potentially confidential information – would help to ensure consistent cross-border recording of MNE activities, thereby improving the quality and consistency of macroeconomic statistics. In particular, such initiatives could help to ensure clarity by disentangling the transactions conducted by SPEs in the context of FDI in the b.o.p.
70 See for example explaining Ireland's FDI Asymmetry with the United States and Howell, K, et al., Current
Account Asymmetries in EU-US Statistics, Eurostat and BEA, March 2019.

Ekonomski bilten ECB, številka 2 / 2020
84
2 Short-term forecasting of euro area economic activity at the ECB
Prepared by Marta Bańbura and Lorena Saiz
1 Introduction
The real-time assessment of developments in economic activity is of central importance for the conduct of monetary policy. It facilitates the timely detection of changes in underlying economic dynamics in view of incoming data and contributes to a broader assessment of the economic outlook and associated risks. It is an integral part of the economic analysis in the European Central Bank’s (ECB) two-pillar approach to the assessment of the risks to price stability. Moreover, given the time lags in the transmission of monetary policy measures, a timely and reliable evaluation of economic conditions is a key element in the assessment of the monetary policy stance.
Official estimates of real GDP growth in the euro area are published with some delay, but current and near-term developments in real GDP can be assessed on the basis of high-frequency and timely indicators. Real GDP is the key variable summarising information on real economic activity. However, it is available only at a quarterly frequency and its first official estimate for the euro area, the preliminary flash estimate, is published only approximately 30 days after the end of the reference quarter. To fill this gap, econometric models have been developed at the ECB and elsewhere that can exploit a rich set of data to produce a real-time estimate of real GDP in the current and next quarter(s). Short-term forecasts typically rely on financial market data, business and consumer surveys or sectoral data (e.g. from industry, retail or external sectors). These predictors are often available at a monthly, weekly or daily frequency and with shorter publication delays.
There are a number of challenges to building quantitative tools for short-term forecasting of economic activity. First, these tools need to combine information from data collected at different frequencies. Second, they need to deal with the “ragged edge” of the data, which is due to the fact that different types of data are characterised by different publication delays. For example, industrial production in the euro area is published around six weeks after the end of the reference month, whereas opinion surveys and financial market data are often already available at the end of the reference period. Third, as there are many indicators that may be useful, the econometric approaches should be able to reliably estimate many parameters. Fourth, many indicators are subsequently revised and thus their first release might incorporate sizeable noise or measurement error. Fifth, data can be contaminated by outliers, caused by unusual events (e.g. strikes, atypical weather conditions), or changes in statistical properties over time, due to methodological or structural economic changes.
Further challenges for real-time forecasting became apparent in the course of the global financial crisis and in its aftermath. The vast majority of models,

Ekonomski bilten ECB, številka 2 / 2020
85
including those used at the ECB for short-term forecasting at the time71, failed to predict the timing and depth of the Great Recession. In addition, these models systematically over-predicted the strength of the subsequent recovery. Several reasons were put forward at the time as an explanation for this disappointing forecast performance, including changes in structural relationships between economic variables, extreme outcomes in certain indicators that were inconsistent with model assumptions, insufficient coverage of financial market data and a non-linearity in the relationship between the real economy and the financial sector. Apart from addressing these shortcomings, recommendations for modellers included developing better tools for risk assessment and establishing appropriate economic narratives.72
The suite of models for short-term forecasting of euro area real GDP growth currently used at the ECB is the result of a comprehensive review conducted in 2015. The models rely on a medium-size data set of approximately 30 monthly indicators. A multivariate econometric set-up and a relatively broad coverage of various aspects of the euro area economy provide a framework for the interpretation of incoming data and forecast revisions. The forecasts are prepared using automated procedures (i.e. they are judgement-free) and can be produced in a matter of minutes. In addition to point forecasts, the model suite can also produce predictive distributions (fan charts). The latter can be used to assess, in real time, the degree of uncertainty around, or the risks to, the prevailing outlook for the short term.
The model-based short-term forecasts of real GDP are an important input to the Eurosystem/ECB staff macroeconomic projections.73 By delivering quantitative estimates of real GDP growth ahead of the official data release and by providing an assessment of the macroeconomic “news” since the completion of the previous projection round, they are a useful starting point for updating the baseline short-term outlook for GDP growth. In addition, the predictive distributions provide model-based input for assessing the balance of risks surrounding the staff GDP projections.
The article is organised as follows. Section 2 explains the methodological framework of the suite of models for short-term forecasting of real GDP at the ECB. Section 3 presents an evaluation of the forecast performance of the models. Section 4 focuses on two interesting elements of the suite of models: news analysis and predictive distributions. Finally, Section 5 concludes with the main lessons learned and discusses the current challenges, further planned enhancements and new directions of work.
2 Methodological framework
Several types of models for short-term forecasting of real GDP have been proposed in the literature, including bridge equations, mixed-frequency dynamic factor models, mixed-frequency vector autoregressions and Mixed
71 See “Short-term forecasts of economic activity in the euro area”, Monthly Bulletin, ECB, April 2008. 72 See, for example, Kenny, G. and Morgan, J., “Some lessons from the financial crisis for the economic
analysis”, Occasional Paper Series, No 130, ECB, 2011. 73 See “A guide to the Eurosystem/ECB staff macroeconomic projection exercises”, ECB, July 2016.
Ekonomski bilten ECB, številka 2 / 2020
86
Data Sampling (MIDAS) models. Traditionally, “bridge equations”, linking GDP to a few key monthly indicators aggregated to a quarterly frequency, have been used. The latter are forecast using simple “auxiliary” models to complete the missing observations for the quarter. More recent approaches include mixed-frequency dynamic factor models and mixed-frequency vector autoregressions, which allow a single modelling framework to be used for the entire information set. Finally, MIDAS models allow data of different frequencies to be combined in a regression set-up by imposing a parsimonious lag structure. Different model types offer different advantages, in particular as regards robustness to structural breaks and extreme data outcomes or the possibility to interpret forecast revisions.74
The 2015 review of the ECB’s short-term forecasting models was motivated by the deterioration in the (relative) performance of the models in the course of the global financial crisis and in its aftermath. The suite of models used at the time encompassed (several versions) of bridge equations and large-scale mixed-frequency dynamic factor models. Both model types exhibited large forecast errors during the crisis and a positive bias (systematic over-prediction) thereafter, but the problems were more acute for the factor models. One of the reasons behind the positive bias was the insufficient coverage of the services sector and a declining contribution of the industry sector to value added in the euro area. Another reason was the difficulty to reliably estimate relationships between a large set of variables in view of their different behaviour during the financial crisis (in particular for survey vs. “hard”75 data). The forecast performance of the mixed-frequency factor models appears to have been more sensitive to such structural changes compared with the performance of the bridge equations.
The current suite of short-term forecast models is based on bridge equations, in view of their comparatively better post-financial crisis forecast performance. Two types of bridge equations are included: (i) equations based on “hard” data, linking GDP to industrial production (excluding construction) and value added in services, and (ii) equations based on “soft” data, linking GDP to Purchasing Managers’ Index (PMI) composite output and PMI construction.76 Both types embody the “supply” perspective for real GDP measurement77, given that the coverage of information is more complete and timelier and the relationship with GDP is more stable compared with the “demand” perspective. As a consequence, the supply perspective results in more accurate forecasts. The forecasts for (quarterly) value added in services are obtained via an auxiliary bridge equation.
The monthly predictors included in the bridge equations are in turn forecast using “auxiliary” models and incorporate information from other monthly
74 See Bańbura, M., Giannone, D., Modugno, M. and Reichlin, L., “Now-casting and the real-time data flow”,
in Elliott, G. and Timmermann, A. (ed.), Handbook of Economic Forecasting, Vol. 2A, North Holland, 2013, pp. 195–236, for a detailed review and list of references for the different modelling approaches.
75 “Soft” is typically used to label indicators that reflect market expectations, most notably surveys and financial market data. By contrast, “hard” indicators often measure certain GDP components directly (e.g. industrial production).
76 See de Bondt, G.J., “A PMI-based Real GDP Tracker for the Euro Area”, Journal of Business Cycle Research, Vol. 15, Issue 2, 2019, pp. 147–170.
77 See Hahn, E. and Skudelny, F., “Early estimates of euro area real GDP growth – a bottom-up approach from the production side”, Working Paper Series, No 975, ECB, December 2008.

Ekonomski bilten ECB, številka 2 / 2020
87
variables. Since bridge equations typically include just a few predictors, the only way to exploit a larger (and timelier) set of information in such a framework is through monthly auxiliary models to produce forecasts of the predictors.78 The auxiliary models for the bridge equations are monthly Bayesian vector autoregressions and dynamic factor models. Both types of models allow a large number of variables to be incorporated.
The data set comprises approximately 30 indicators. It includes industrial production and business surveys for different sectors, monthly indicators of retail trade, unemployment, external trade and financial market data. The data set can be considered a “medium” size and is significantly smaller than those underlying the mixed-frequency factor models used previously. Forecast evaluations conducted during the review have shown that a very granular sectoral disaggregation typical for large data sets does not result in improved forecast accuracy.79
Forecasts are obtained as an average of forecasts produced by individual models. Combining two types of bridge equations with five auxiliary models results in ten distinct models for GDP. For point forecasts, an average of the individual model predictions is taken. Pooling individual forecasts leads to gains in forecast accuracy, even with respect to the best-performing model version80, see below. Predictive distributions (densities) are produced via simulations and combined predictive density is calculated as an average of the individual model predictive densities. More technical details can be found in Box 1.
Box 1 The suite of models for short-term forecasting of real GDP in the euro area: some technical details
The models used belong to the family of bridge equations. A bridge equation is a linear regression model where the dependent variable is the low-frequency variable of interest (e.g. quarterly GDP) and the regressors are higher-frequency predictors (e.g. monthly industrial production) aggregated to the lower frequency. In the case of the models for short-term forecasting of real GDP in the euro area described in the main text, the equations are specified as follows:
𝑃𝑃𝑡𝑡𝑄𝑄 = 𝛼𝛼 + �𝛽𝛽𝑚𝑚𝑋𝑋𝑚𝑚,𝑡𝑡
𝑄𝑄𝑘𝑘
𝑚𝑚=1
+ 𝜀𝜀𝑡𝑡𝑄𝑄,
where 𝑃𝑃𝑡𝑡𝑄𝑄 is the dependent variable, in this case quarter-on-quarter real GDP growth, and 𝑋𝑋𝑚𝑚,𝑡𝑡
𝑄𝑄 are the predictor variables (up to 𝑘𝑘 per bridge equation). Two types of bridge equations are included. In the first bridge equation, the predictor variables are: quarterly growth of industrial production and quarterly growth of value added in services. In the second equation, the predictors are: quarterly
78 See Bulligan, G., Golinelli, R. and Parigi, G., “Forecasting monthly industrial production in real-time: from
single equations to factor-based models”, Empirical Economics, Vol. 39, Issue 2, 2010, pp. 303-336. 79 This is in line with the conclusions in, for example, Bańbura, M., Giannone, D. and Reichlin, L., “Large
Bayesian vector autoregressions”, Journal of Applied Econometrics, Vol. 25, Issue 1, 2010, pp. 71–92, and Bańbura, M., Giannone, D. and Reichlin, L., “Nowcasting”, in Clements, M.P. and Hendry, D.F. (ed.), The Oxford Handbook of Economic Forecasting, 2011.
80 See Kuzin, V., Marcellino, M. and Schumacher, C., “Pooling versus model selection for nowcasting GDP with many predictors: empirical evidence for six industrialized countries”, Journal of Applied Econometrics, Vol. 28, Issue 3, 2013, pp. 392-411.

Ekonomski bilten ECB, številka 2 / 2020
88
average of PMI composite output and quarterly difference of PMI construction output81. 𝜀𝜀𝑡𝑡𝑄𝑄 is the
regression residual, 𝛼𝛼 is the intercept and 𝛽𝛽𝑚𝑚 are the regression coefficients. For value added in services, an auxiliary bridge equation including expected demand for services from the surveys of the European Commission is used. The equations are estimated by standard regression techniques (ordinary least squares). The estimation sample starts in 1985 or later, depending on data availability in the particular equation (or “auxiliary” model, see below).
In order to obtain forecasts for GDP from the equations described above, it is necessary to obtain forecasts for the monthly predictors for the quarters of interest. For this purpose, “auxiliary” multivariate models at a monthly frequency are used: vector autoregressions (VARs) and dynamic factor models (DFMs).82 The former are estimated with Bayesian methods, using a specification in first differences with six lags and the Minnesota prior with the degree of shrinkage dependent on the size of the model.83 The latter are estimated by maximum likelihood, using the expectation maximisation algorithm.84 The specification includes one single common factor, which follows an autoregressive process of order two and an autoregressive process of order one for the idiosyncratic components. Both types of models can deal with large sets of variables. VARs of three sizes (including two, 22 or 28 variables) and DFMs of two sizes (with 22 and 28 variables) are included. In order to handle the ragged edge caused by different publication delays of the variables, the models are cast into a state space representation and the Kalman filter and smoother are used to obtain the forecasts of the monthly variables and the weights for the news (see Section 4).
The variables for the bridge equations and the monthly “auxiliary” models were selected on the basis of several criteria including correlation analysis, in-sample and out-of-sample forecast performance, stability and significance of regression coefficients as well as shrinkage methods such as LASSO regressions.85 The results confirmed previous findings in the literature that a very high level of disaggregation (100 series or more) is not needed to achieve the best forecast accuracy.
The computation of the models’ predictive distributions (densities) relies on the use of the Gibbs sampler and the simulation smoother (in order to handle the ragged edge).86 The density forecasts from individual models are combined by a linear opinion pool with equal weights attached to individual densities. Combinations of normal densities produce distributions which can accommodate non-standard features such as fat tails or skewness. As for the case of point forecasts, pooling density forecasts is also an insurance policy against uncertainty in model selection.87
81 See, for example, de Bondt, G.J., op. cit., for more details on the second equation. Note that the two
equations result in better forecast accuracy than an average of (a large number of) single variable bridge equations.
82 This results in higher forecast accuracy compared with using a univariate ARIMA model for each monthly predictor, in line with the findings in Rünstler, G. and Sédillot, F., “Short-term estimates of euro area real GDP by means of monthly data”, Working Paper Series, No 276, ECB, September 2003.
83 See Bańbura et al., “Large Bayesian vector autoregressions”, op. cit. 84 See Bańbura, M. and Modugno, M., “Maximum likelihood estimation of dynamic factor models on
datasets with arbitrary pattern of missing data”, Journal of Applied Econometrics, Vol. 29, Issue 1, 2014, pp. 133–160.
85 Note that the selection of indicators was not conducted in real time but in sample. However, as the data set was frozen at the beginning of 2015, the evaluation starting in 2015 is truly real-time. LASSO and similar techniques have been used to select variables for bridge equations in, for example, Bulligan, G., Marcellino, M. and Venditti, F., “Forecasting economic activity with targeted predictors”, International Journal of Forecasting, Vol. 31, Issue 1, 2015, pp. 188-206.
86 See Durbin, J. and Koopman, S.J., “A simple and efficient simulation smoother for state space time series analysis”, Biometrika, Vol. 89, Issue 3, 2002, pp. 603–615.
87 Geweke and Amisano showed that pooled forecast densities produce superior predictions, even if the set of models to be combined exclude the “true” model. See Geweke, J. and Amisano, G., “Optimal prediction pools”, Journal of Econometrics, Vol. 164, Issue 1, 2011, pp. 130-141.
Ekonomski bilten ECB, številka 2 / 2020
89
3 Forecast performance
A real-time evaluation is conducted of the forecasting accuracy of the models since their introduction and over a longer period starting in 2005. For this purpose, real-time data vintages going back to 2005 are constructed based on the information stored in the ECB’s Statistical Data Warehouse (SDW).88 For each quarter in the evaluation sample, 12 forecast horizons are considered. The first forecast is obtained five months ahead of the first official publication. Subsequent forecasts are produced in semi-monthly intervals, up to two weeks before the publication of the preliminary flash estimate.89 For instance, in the forecast cycle for the second quarter of the year, the first forecast would be produced at the end of January and the last one in the second week of July. The evaluation focuses on the bias and the root mean squared error of the forecasts. The forecasts are evaluated against the official flash estimates and the latest available vintage of quarter-on-quarter real GDP growth.
The forecast accuracy of the models is compared with that of the Eurosystem/ECB staff macroeconomic projections. For the purpose of the evaluation, a convention is adopted in line with which the latter are finalised in the middle of the second month of each quarter (corresponding to the forecast horizon of 1.5 and 4.5 months ahead for the current and the next quarter, respectively) and they remain unchanged in between.90
The accuracy of the models improves as new information arrives and the models fare relatively well compared with the Eurosystem/ECB staff macroeconomic projections. Chart 1 shows the root mean squared forecast error (RMSFE) and the bias for the model forecasts (light-coloured lines) as well as the projections (dark-coloured lines) compared with the official flash estimate (red lines) and with the latest vintage (blue lines) of GDP growth for the 12 forecast horizons considered. The evaluation period is 2015Q1 to 2019Q2.91 Overall, the accuracy of the model forecasts is somewhat lower than that of the projections. The precision of the model forecasts gradually improves with a decreasing forecast horizon and the forecasts appear particularly useful at very short horizons after the projections have been finalised. Both the forecasts and the projections are more accurate and less biased when they are compared with the flash estimate than when they are compared with the latest available vintage of GDP. 88 For a given date stamp and indicator identifier, a time series available at that date can be recovered from
the SDW. Thus real-time data vintages reflect both publication delays and data revisions (as opposed to pseudo real-time vintages that reflect only the former).
89 This reflects the frequency and the forecast horizon of the regular updates of short-term forecasts at the ECB. They are generally conducted twice per month, following the release of industrial production in the middle of each month, and of opinion surveys at the end of each month. The forecasts are always reported for the next two quarters to be published.
90 As a consequence, the accuracy of the projections reported in Chart 1 changes in the middle of the second month of each quarter as a new projection becomes available. The projections are customarily finalised between the middle and the end of the second month of each quarter.
91 Since no changes have been implemented to the models since 2015, this is a truly real-time out-of-sample evaluation.

Ekonomski bilten ECB, številka 2 / 2020
90
Chart 1 Accuracy of model GDP forecasts and Eurosystem/ECB staff GDP projections over 2015Q1-2019Q2
(percentage points)
Source: ECB calculations. Notes: For each quarter a sequence of 12 real-time forecast updates is evaluated. The forecast horizon (indicated on the horizontal axis) is defined as the distance (in months) between the end of the reference quarter and the date when the forecast was made. A convention is adopted in line with which Eurosystem/ECB staff macroeconomic projections are finalised around the middle of the second month of each quarter (1.5 or 4.5 months before the end of the reference quarter). Bias is defined as the average difference between the forecast and the outcome. Model forecasts and the projections are evaluated against the official flash estimate of GDP growth (released in the middle of the second month of the following quarter) as well as against the latest available vintage of real GDP growth.
The models also perform relatively well when evaluated over a longer period. The evaluation period considered above is relatively short and less volatile than, for example, the preceding period, which included the financial and sovereign debt crises. Focusing on the RMSFEs for 1.5-month ahead horizon with the flash estimate as the reference variable, Chart 2 presents the evolution of forecast accuracy since 2005 over an eight-quarter window. Several observations can be made. First, unsurprisingly, the financial crisis period was characterised by much larger forecast errors, both for models and for the Eurosystem/ECB staff macroeconomic projections. By contrast, the errors were not particularly large during the sovereign debt crisis. Second, the average model forecast is more accurate than the projections in some
0.00
0.05
0.10
0.15
0.20
0.25
0.30
5.0 4.5 4.0 3.5 3.0 2.5 2.0 1.5 1.0 0.5 0.0 -0.5Forecast horizon (in months)
a) Root mean squared forecast error
Model vs. flashModel vs. latest vintageProjections vs. flashProjections vs. latest vintage
-0.20
-0.15
-0.10
-0.05
0.00
0.05
0.10
5.0 4.5 4.0 3.5 3.0 2.5 2.0 1.5 1.0 0.5 0.0 -0.5Forecast horizon (in months)
b) Bias

Ekonomski bilten ECB, številka 2 / 2020
91
periods (notably during the financial crisis but not in the latest period).92 Finally, an average of forecasts from several models typically does as well as the best model in each month (which changes over time) and is thus a good hedge against model uncertainty.
Chart 2 Evolution of forecast accuracy since 2005
(percentage points, RMSFE over an eight-quarter rolling window)
Source: ECB calculations. Notes: The chart shows the RMSFEs over a rolling window of eight quarters. The forecasts are updated in the middle of the second month of the reference quarter (forecast horizon of 1.5 months), around the finalisation date of the Eurosystem/ECB staff macroeconomic projections. The reference variable is the official flash estimate of quarter-on-quarter real GDP growth. ‘Average’ refers to the rolling RMSFE of the average point forecasts (from ten different models). ‘Individual models’ indicates the range given by the minimum and maximum (rolling) RMSFE of the individual models. Shaded areas indicate recession periods (the Great Recession and the sovereign debt crisis) in the euro area as identified by the CEPR Business Cycle Dating Committee.
4 News analysis and a measure of risks
4.1 News analysis
The current framework allows linking revisions to the GDP growth forecast to model-based surprises or news content in releases of monthly predictors. This is also known as model-based news analysis and is an important element of data monitoring. The news (or surprise) for each indicator is defined as the difference between the released value of that indicator and its expected (forecast) value, i.e. the forecast error made by the model. The difference between two consecutive forecasts of GDP, that is the forecast revision, can be expressed as a weighted average of the news in the data released between the two forecast updates (plus the effect of historical data revisions and parameter re-estimation).93 The weights reflect the
92 It should be noted that although the estimation of and the forecasts from the models are performed using
real-time data, the specification and the choice of the variables in the new models were performed after the crisis and therefore have the benefit of hindsight for the evaluation period prior to 2015.
93 See Bańbura et al., “Now-casting and the real-time data flow”, op. cit. For a meaningful analysis, the news should be based on multivariate models, incorporating most relevant indicators and taking into account differences in their timeliness and strength of the signal. The news analysed here is model-based and conceptually similar but not the same as “market surprises” (which are the differences with respect to market expectations).
0.0
0.1
0.2
0.3
0.4
0.5
0.6
0.7
0.8
0.9
2007 2008 2009 2010 2011 2012 2013 2014 2015 2016 2017 2018 2019
Individual modelsAverageProjections

Ekonomski bilten ECB, številka 2 / 2020
92
average volatility of the news and its relevance for GDP. The sign of the news indicates whether the released number was better or worse than expected (“positive” or “negative” news).
Forecast revisions for individual quarters can be decomposed to identify the role of specific (groups of) indicators. Chart 3 illustrates this type of analysis taking the second quarter of 2019 as an example. The green line represents the evolution of the (average point) forecasts starting at the beginning of February up to mid-July, approximately two weeks before the release of the preliminary flash estimate of real GDP for that quarter. The bars indicate the model-based news or drivers of forecast revisions between the consecutive updates. A sizeable downgrade of the outlook at the end of March can be seen due to negative news in survey data. Subsequently, positive surprises on survey data lead to an upward revision of the outlook. From the end of May, the nowcast stabilises close to the outcome (preliminary flash estimate).
Chart 3 Model-based news and revisions to real GDP growth forecast for 2019Q2
(quarterly percentage changes and percentage point contributions)
Source: ECB calculations. Notes: The green line represents the average point forecasts (from ten different models) for real GDP growth in 2019Q2 from different forecast updates (indicated on the horizontal axis). The bars indicate the decomposition of forecast revisions between the consecutive updates into news stemming from different groups of data: ‘Industrial production’ – sectoral production indicators, ‘Other hard data’ – unemployment rate, external trade, retail trade, new car registrations, ‘Surveys’ – surveys of the European Commission and the Purchasing Managers’ surveys, ‘Financial and money’ – real money and financial and credit indicators. ‘Remainder’ collects the effects of data revisions and parameter re-estimation.
4.2 Density forecasts
The location and the shape of the models’ predictive distributions make it possible to assess the uncertainty around the point forecast as well as the direction and the degree of risks to forecasts from other sources such as the staff projections. For example, when the centre of the model predictive density (as represented by its mode or its median) is to the left of an alternative forecast, it signals downward risks to the latter and vice versa. Consequently, movements to the left or right of the predictive density will imply changes in the assessment of the direction of risks. By contrast, changes in the shape of the distribution (i.e. dispersion or concentration) will imply changes in the level of uncertainty. In real-time analysis, as
-0.2
-0.1
0.0
0.1
0.2
0.3
01/02 15/02 01/03 15/03 29/03 12/04 03/05 17/05 31/05 14/06 28/06 12/07 31/07
Industrial productionOther hard dataSurveysFinancial and money
RemainderNowcastPreliminary flash estimate

Ekonomski bilten ECB, številka 2 / 2020
93
more information is accrued over the forecast cycle, the predictive distribution usually becomes more concentrated, entailing less uncertainty surrounding the central forecast. It cannot be ruled out, however, that the release of one or several indicators could lead to a flatter distribution, due to diverging interpretations by the different models, and therefore to higher uncertainty.
As an example, predictive distributions indicate that, on the basis of these models, initially there were downward risks to the June 2019 Eurosystem staff GDP projection for 2019Q2 and the balance of risks became more neutral as more data became available. Chart 4 presents the models’ predictive densities for 2019Q2 obtained with the data available on 17 May 2019 (around the finalisation of the June 2019 staff projection) and on 12 July 2019. Initially, the models suggested downside risks to the projection since the probability of a lower outcome was higher than 50% (i.e. 60%). As more information became available by mid-July, the distribution moved to the right and became more concentrated. This means that the risks to the projection became more balanced (given that the probability of observing an outcome either above or below the projected value was around 50%) and smaller.
Chart 4 Predictive densities for real GDP growth in 2019Q2
(horizontal axis: quarterly percentage changes, vertical axis: density)
Source: ECB calculations. Notes: The blue and yellow lines represent the (combined) predictive densities for real GDP growth from the respective forecast updates. The combination involves densities from the ten different models via a linear prediction pool with equal weights. The green line corresponds to the outlook in the June 2019 Eurosystem staff macroeconomic projections, and the red line is the preliminary flash estimate.
5 Conclusions and new directions
Changes in economic relationships caused by the evolving economic environment are a challenge to forecasting models in general and to short-term forecasting tools in particular. Some notable examples of structural changes include climate change, inter-sectoral re-balancing, developments in productivity, effects of severe recessions and, more specifically for the euro area, changes in the automotive industry.
0.0
0.2
0.4
0.6
0.8
1.0
1.2
1.4
-1.0 -0.5 0.0 0.5 1.0 1.5
17 May 201912 July 2019OutcomeJune 2019 projection
Ekonomski bilten ECB, številka 2 / 2020
94
Several lessons on how to address those and other challenges can be drawn from the experience with model-based short-term forecasting of real economic activity at the ECB. First, it is important to have several models in the toolbox and to assess their performance regularly, as it may deteriorate over time. Second, a combination of forecasts from different models typically helps to make the forecast performance more robust to misspecification. Third, including information on all major sectors of the economy is important but it is not necessary to use data sets at a very high level of disaggregation. A medium-size set of relevant and timely indicators appears to be sufficient to capture the information on real activity developments in the near term. Finally, it is important to be able to interpret the revisions to the outlook and to communicate uncertainty surrounding the forecasts. Still, scope for further improvement along several dimensions remains.
One issue is the high reliance of short-term forecasting models on survey data. Surveys provide qualitative information (i.e. opinions or perceptions) from relatively small samples of firms or consumers. They are very relevant due to their short publication lag. However, their relationship with quantitative (hard) indicators can change over time, reflecting either sampling biases (e.g. survival bias, especially after the crisis) or the fact that survey respondents can change the benchmarks used for their assessments (e.g. value of sales growth which can be considered an improvement in the firm’s performance).94 As a result, the mapping of survey data levels into economic growth rates is not straightforward. For instance, at the beginning of 2018 survey data were at historically high levels95, while real GDP growth slowed down considerably in the euro area. Conversely, some of the surveys painted a rather bleak outlook for 2019, while hard data turned out somewhat more resilient.
Alternative models and indicators can be employed to further enhance the accuracy and robustness of the models currently employed. Examples include time-varying parameter models that can deal with relationships that change over time in a flexible way.96 The usefulness of alternative indicators and methods is also being investigated, in particular of machine learning algorithms and “big data”. The term “big data” is rather broad. In this context, it includes large and near-real-time data from the internet (e.g. internet search volumes97, data from social networks such as Twitter and Facebook, newspaper articles) or large-volume data from non-official sources (e.g. from trading platforms and payment systems). Big data allows a wider range of indicators to be used, which can provide new and unique insights helpful for forecasting. For instance, text-based sentiment indicators could be particularly useful given that they can be produced automatically at a high frequency and at lower costs than survey-based sentiment indicators, and they can be based on large samples of
94 See Gayer C. and Marc B., “A ’New Modesty’? Level Shifts in Survey Data and the Decreasing Trend of
’Normal’ Growth”, European Economy Discussion Paper, 083, European Commission, July 2018. 95 See the box entitled “The recent strength of survey-based indicators: what does it tell us about the depth
and breadth of real GDP growth?”, Economic Bulletin, Issue 8, ECB, 2017. 96 See, for example, Antolín-Díaz, J., Drechsel, T. and Petrella, I., “Tracking the Slowdown in Long-Run
GDP Growth”, The Review of Economics and Statistics, Vol. 99, Issue 2, 2017, pp. 343–356. 97 See, for example, Ferrara, L. and Simoni, A., “When are Google data useful to nowcast GDP? An
approach via pre-selection and shrinkage”, Working Papers, No 2019-04, Center for Research in Economics and Statistics, 2019.

Ekonomski bilten ECB, številka 2 / 2020
95
newspapers to avoid biases.98 At the same time, one has to keep in mind that considering a large set of explanatory variables entails risks of overfitting, not necessarily leading to improvements in out-of-sample forecast accuracy. Some of these challenges can be addressed by machine learning algorithms, which also have the advantage of potentially capturing complex non-linear relationships. These are some interesting directions for future work.
98 See, for example, Thorsrud, L.A., “Words are the New Numbers: A Newsy Coincident Index of the
Business Cycle”, Journal of Business & Economic Statistics, 2018.

Ekonomski bilten ECB, številka 2 / 2020
96
3 The state of play regarding the deepening agenda for Economic and Monetary Union
Prepared by Sander Tordoir, Jacopo Carmassi, Sebastian Hauptmeier and Malte Jahning99
This article provides an overview of progress with various aspects of the deepening of Economic and Monetary Union (EMU). The start of a new legislative period for the European Union (2019-24) provides a natural and opportune moment to take stock of progress towards completion of the architecture of EMU.
The EU’s last two legislative periods saw significant progress as regards the architecture of EMU in response to the global financial crisis more than a decade ago. A banking union was established, with shared supervision of Europe’s largest banks at supranational level and a common framework for addressing and resolving ailing banks. The European Stability Mechanism (ESM) was put in place to support euro area countries facing deep economic crises. And a number of adjustments were made to the shared rules governing national fiscal and economic policies.
However, there is no room for complacency: EMU needs to become even more resilient to adverse economic shocks. An increase in private risk sharing (whereby firms and households diversify their assets across borders through integrated capital and banking markets) can help to mitigate local recessions by allowing local shocks to be offset using income received from elsewhere. An increase in public risk sharing (e.g. through some form of common fiscal policy or shared backstops that safeguard financial stability in times of crisis) can also help to attenuate local and even euro area-wide recessions. Such private and public risk sharing are still more limited in the euro area than they are in other monetary unions, such as the United States. At the same time, the governance mechanisms that help to ensure resilient policies at national level and seek to prevent harmful spillover effects between euro area countries could be strengthened further.
Concrete decisions and further work on a number of aspects of EMU are scheduled for the near future. This includes work on the banking union and the capital markets union (CMU), both of which remain incomplete, leaving scope to further increase the stability and integration of Europe’s banking and capital markets. Other initiatives include reform of the ESM as part of work in the area of crisis management, as well as the establishment of a budgetary instrument for convergence and competitiveness (BICC), which aims to help euro area countries to invest and implement reforms with a view to improving the structure of their economies. In addition, the European Commission is also reviewing the fiscal and economic governance framework that coordinates national policies and is set to table a proposal for a European unemployment reinsurance scheme as a way of enhancing the euro area’s ability to withstand economic downturns.
99. Valuable contributions were also made by Giovanni Di Iasio, Joachim Eule, Donata Faccia, Alessandro
Giovannini, Anastasia Koutsomanoli-Filippaki, Rebecca Segall, Pär Torstensson and David Sondermann.

Ekonomski bilten ECB, številka 2 / 2020
97
The ECB has a clear interest in increasing the resilience of the euro area’s institutional architecture. Sound countercyclical fiscal policies, sufficient financial resilience and cross-border private and public risk sharing are all important to the ECB in order to allow for more effective transmission of monetary policy with fewer side effects, enhance the alignment of euro area business cycles, complement monetary policy and give European banking supervision greater traction.
Against that backdrop, this article provides an overview of various different elements of the deepening agenda for EMU and identifies a number of outstanding issues.
1 Introduction
Completing the institutional architecture of EMU will be an important challenge for the EU during the 2019-24 legislative period. A new European Parliament was elected in May 2019, and the new Commission President, Ursula von der Leyen, outlined her priorities in July 2019, before taking office on 1 December 2019 alongside the new College of Commissioners. Meanwhile, the EU’s heads of state or government set out ten priorities for the European Union for the period 2019-24 in a declaration in Sibiu on 9 May 2019.100
Responsibility for reforming the architecture of EMU is shared by all EU institutions and Member States. The Commission plays a key role by tabling proposals (including legislative drafts), which are adopted by the ECOFIN Council (the finance ministers of the EU27), typically in cooperation with the European Parliament. In policy terms, the Eurogroup (the finance ministers of euro area countries, who are sometimes joined in meetings by the finance ministers of non -euro area countries) is the main locus when it comes to giving strategic guidance and negotiating the deepening of the euro area’s architecture. Ultimately, political decisions on EMU are taken at Euro Summits, which bring together the heads of state or government of euro area countries. Different decision-making processes apply if policy areas are intergovernmental (e.g. within the framework of the ESM). The ECB participates in these EU and euro area fora and acts as an adviser on EMU reforms. Thus, reforms to EMU are a product of the interplay between these various actors and their competences in the legislative process.
The EU’s last two legislative periods saw significant progress on the architecture of EMU (as outlined in Figure 1). The introduction of the Single Supervisory Mechanism (SSM) and the Single Resolution Mechanism (SRM) delivered two of the three pillars of the banking union, with the third pillar – a European Deposit Insurance Scheme (EDIS) – left incomplete. This built on institutional innovations achieved during the crisis, such as the creation of the ESM, reforms to fiscal rules, and the establishment of the macroeconomic imbalance procedure (MIP) in order to address harmful macroeconomic imbalances. These were all key steps with a view to reducing financial and macroeconomic risks, improving risk sharing, and enhancing the transmission of monetary policy across the euro area. 100. See the Sibiu Declaration.

Ekonomski bilten ECB, številka 2 / 2020
98
Figure 1 Timeline of EMU architecture reforms since 2010
Source: ECB, based on https://www.consilium.europa.eu/en/policies/emu-deepening/emu-glossary. Notes: “MIP” refers to the macroeconomic imbalance procedure; “EFSI” denotes the European Fund for Strategic Investments; the “EFSF” is the European Financial Stability Facility; “ESM” refers to the European Stability Mechanism; “SRB” denotes the Single Resolution Board; the “CRR” is the Capital Requirements Regulation; the “CRD” is the Capital Requirements Directive; “BRRD” refers to the Bank Recovery and Resolution Directive; “SRMR” denotes the Single Resolution Mechanism Regulation; “EDIS” refers to the European Deposit Insurance Scheme; the “SGP” is the Stability and Growth Pact; the “EFB” is the European Fiscal Board; “BICC” refers to the budgetary instrument for convergence and competitiveness; the “six-pack” comprises six regulations aimed at strengthening the SGP and establishing the MIP; the “two-pack” comprises regulations aimed at strengthening the budgetary surveillance cycle in EMU; and the “fiscal compact” is an intergovernmental treaty on the anchoring of fiscal rules in national constitutions.
However, that deepening of EMU has lost its initial momentum. Private and public risk sharing are still more limited in the euro area than they are in other monetary unions (such as the United States). The banking union remains incomplete without the EDIS, and further progress is needed on the establishment of a genuine CMU. On the fiscal side, the euro area continues to lack a central fiscal capacity for the purposes of macroeconomic stabilisation. At the same time, mechanisms aimed at ensuring resilient policies at national level could be strengthened further. The Stability and Growth Pact (SGP) is widely regarded as requiring simplification in order to make the EU’s fiscal rules more effective and countercyclical and improve ownership at national level, while the implementation rate for structural reforms under the European Semester and the effectiveness of the MIP both remain poor. A deeper and more complete EMU (including an enhanced CMU) would, in the context of the pursuit of sound economic policies101 in the euro area, also support the international role of the euro.102
The deepening of EMU is just one of a number of challenges facing the Commission, the Council and the European Parliament. Official statements by the
101. See Masuch, K., Anderton, R., Setzer, R. and Benalal, N. (eds.), “Structural policies in the euro area”,
Occasional Paper Series, No 210, ECB, 2018. 102. See ECB, “The international role of the euro”, June 2019, and the European Commission’s
communication of 5 December 2018 entitled “Towards a stronger international role of the euro”.
Start of Juncker
Commission
Econ
omic
unio
nFi
nanc
ial
unio
nFi
scal
un
ion
Cris
is
man
agem
ent
Start of Von der LeyenCommission
2010 2011 2012 2014 2015 2016 2017 2018 2019
Start of Barroso
Commission
EFSF created
Introduction of European
Semester
MIP introduced
Publication of Four Presidents’
Report
SGP made more flexible
Publication of Five Presidents’
Report
SRB operational
Six-pack enters into
force Agreement on fiscal compact
Two-pack enters into force
2013
Review of six-pack and two-pack
SSM operational
Launch of EFSI
European Semester
streamlined
CMU agenda launched
EFB operational
Reform Support
Programme proposed
Investment stabilisation function and
InvestEUproposed
BICC proposed
Agreement in principle on ESM reform
Commission communication on international role of the euro
Most national productivity boards operational
ESM operational
Single rulebook adopted
Direct recapitalisation
instrument adopted
Adoption of amendments to the CRR, CRD, BRRD and SRMR
EDIS proposed
Ekonomski bilten ECB, številka 2 / 2020
99
new Commission indicate that significant emphasis will also be placed on the environment, migration and digitalisation, in addition to demographic issues and global tensions.103 This reflects the changing priorities of European citizens, as reported in the autumn 2019 Standard Eurobarometer.104 The Sibiu Declaration, in which Europe’s heads of state or government set out the EU’s strategic agenda for the period 2019-24,105 contained a reference to the deepening of EMU under the general heading “Developing our economic base: the European model for the future”. Charles Michel, the new Council President, will be tasked with following up on that declaration and has indicated that enhancing EMU is particularly relevant in the context of strengthening the international role of the euro.106 Alongside issues such as investment, employment and inequality, the European Parliament has called for further progress on all aspects of the deepening of EMU and has asked the Commission to table proposals in this regard.107
Further decisions and follow-up work on a number of different aspects of the deepening of EMU are scheduled for the near future. The Euro Summit of 13 December 2019 took stock of ongoing work in relation to the banking union, with the High-Level Working Group on a European Deposit Insurance Scheme being tasked, under the aegis of the Eurogroup, with drawing up proposals with a view to establishing a roadmap towards completion of the banking union. It also took note of the planned reform of the ESM (on which high -level agreement had been reached at the Eurogroup’s December 2019 meeting) and the main features of the BICC. For the remainder of 2020, the work programmes of the various EU fora foresee that the ESM reform package will be ratified by national parliaments, the BICC will be legislated for by the European Parliament and the Council, and the High-Level Forum established by the Commission will put forward proposals for new CMU priorities. Moreover, work towards the establishment of a comprehensive banking union package is likely to continue, a review of the fiscal and economic governance framework is to be undertaken by the Commission, technical discussions on a fiscal capacity for the euro area will continue, and a new proposal for a European unemployment reinsurance scheme may potentially be made. The next section will provide more details on these various work streams.
103. For details of the Commission’s political priorities for the period 2019-24, see
https://ec.europa.eu/info/strategy/priorities-2019-2024_en 104. In particular, 34% of euro area respondents (unchanged from the previous survey six months earlier)
regarded immigration as a pressing issue for the EU, while a cumulative 38% (up 3 percentage points) regarded climate change and the environment as priorities at EU level. In contrast, only 18% of euro area respondents (unchanged from the previous survey) regarded the economic situation as a priority, with 15% (down 3 percentage points) regarding Member States’ public finances as a key issue.
105. See https://www.consilium.europa.eu/media/39291/en_leaders-agenda-note-on-strategic-agenda-2019-2024-0519.pdf
106. See the remarks made by Charles Michel after the European Council meeting on 13 December 2019: https://www.consilium.europa.eu/nl/press/press-releases/2019/12/13/remarks-by-president-charles-michel-after-the-european-council-meetings-on-13-december-2019
107 See, for example, https://www.europarl.europa.eu/doceo/document/TA-8-2016-0312_EN.html
Ekonomski bilten ECB, številka 2 / 2020
100
2 State of play as regards the various elements of EMU architecture
The structure and approach advocated by the Four and Five Presidents’ Reports in 2012 and 2015 respectively provide a useful framework for analysing the current state of play.108 Those reports, which were written by the Presidents of the European Commission, the European Council, the Eurogroup, the European Central Bank and – in the case of the Five Presidents’ Report – the European Parliament, set out a comprehensive roadmap. Both reports structured their architectural proposals around four unions (financial, fiscal, economic and political) and argued that there was important interplay between those unions. For example, advances in the banking union would reduce any negative feedback loops between struggling banks and the fiscal health of sovereigns, thereby reducing the need for public money and public risk sharing.109 At the same time, private and public risk sharing were not just seen as substitutes; they were regarded as complementary. The Four and Five Presidents’ Reports also combined proposals aimed at achieving risk reduction and convergence with proposals encouraging more risk sharing – recognising that risk sharing, if designed appropriately, reinforces risk reduction. Finally, those reports proposed an approach to the deepening of EMU, linking risk sharing and risk reduction in a comprehensive roadmap with a timeline and clear milestones. That vision was based largely on a resilience narrative – a desire to make the euro area more resilient and better able to withstand any new crisis.110 While that kind of holistic perspective continues to exist in the background and can serve as a useful benchmark, it is important to understand that, in practice, discussions in the various EU fora tend to now follow more of a dossier-by-dossier approach. Consequently, the sections below review the various individual dossiers in turn, but group them together in a manner similar to that applied in the Four and Five Presidents’ Reports.
2.1 Banking union
The financial crisis highlighted the need to make structural improvements to Europe’s institutional framework in order to safeguard financial stability and create a level playing field across the euro area. The Four Presidents’ Report of June 2012 proposed the establishment of an integrated financial framework, building on the single rulebook, with a single European banking supervisor and a common deposit insurance and resolution framework. That report argued that a single banking supervisor was needed to ensure uniform application of prudential rules and ensure that banks in all Member States were supervised with the same degree of effectiveness.
108. See the Four Presidents’ Report and the Five Presidents’ Report. 109. See the article entitled “Risk sharing in the euro area”, Economic Bulletin, Issue 3, ECB, 2018. 110. The recent “7+7 report” by seven French economists and seven German economists made similar
arguments. See Bénassy-Quéré et al., “Reconciling risk sharing with market discipline: A constructive approach to euro area reform”, CEPR Policy Insights, No 91, 2018.

Ekonomski bilten ECB, številka 2 / 2020
101
The Four Presidents’ Report also included proposals on bank resolution and deposit insurance. That report proposed the establishment of a European resolution scheme (to be funded primarily via contributions from banks) which could ensure the harmonised application of resolution measures to banks overseen by European supervision, with the goal of ensuring the orderly winding-down of non -viable institutions and protecting taxpayers’ money. Finally, on the subject of deposit insurance, the report proposed the introduction of a European dimension to national deposit guarantee schemes for banks under European supervision, with the objective of increasing the credibility of existing arrangements and ensuring that depositors have sufficient protection.
The Five Presidents’ Report, which was published in June 2015, reiterated the key messages of the Four Presidents’ Report as regards the banking union, but also included a new and more detailed proposal for an EDIS. It called for the establishment of an EDIS as the third pillar of the banking union in order to increase resilience against future crises, since the current set-up with national deposit guarantee schemes was considered to be vulnerable to large local shocks, particularly where both the sovereign in question and the national banking sector were perceived to be fragile. That report argued that a European scheme was also more likely to be fiscally neutral over time than national schemes, since risks would be spread more widely and contributions to the European deposit insurance fund (ex ante and risk-based) would be raised across a much larger pool of financial institutions. While the report acknowledged that setting up a fully fledged EDIS would take time, it argued in favour of taking a number of concrete steps as a starting point, building on the existing framework – for example, by designing the EDIS as a reinsurance system for national deposit guarantee schemes.
As originally proposed by the Four and Five Presidents’ Reports, the banking union should comprise three pillars (as illustrated in Table 1): (i) common supervision under the SSM; (ii) common resolution arrangements under the SRM; and (iii) common deposit insurance under an EDIS (which has yet to be established). The banking union is underpinned by a single rulebook, which builds on key contributions by the various European supervisory authorities (ESAs), with the European Banking Authority (EBA) having specific responsibility for the banking sector. The SSM is tasked with ensuring the safety and soundness of the European banking system, fostering financial integration and stability, and ensuring consistent supervision. Those objectives are achieved by adopting a uniform approach to day -to-day supervision, by implementing harmonised supervisory actions and corrective measures, and by ensuring the consistent application of regulations and supervisory policies. The SRM and the Bank Recovery and Resolution Directive (BRRD) have strengthened the euro area’s crisis management framework, with the aim of reducing the cost of future bank failures for taxpayers and the real economy and tackling the bank-sovereign nexus. As regards the third pillar, the European Commission presented a proposal for an EDIS in November 2015. That proposal envisaged a gradual process, starting with reinsurance (whereby the European deposit insurance fund would intervene only after national schemes had been exhausted, and only within certain limits) and ending with a fully fledged European deposit insurance scheme (whereby the European fund would intervene immediately, with full coverage of all
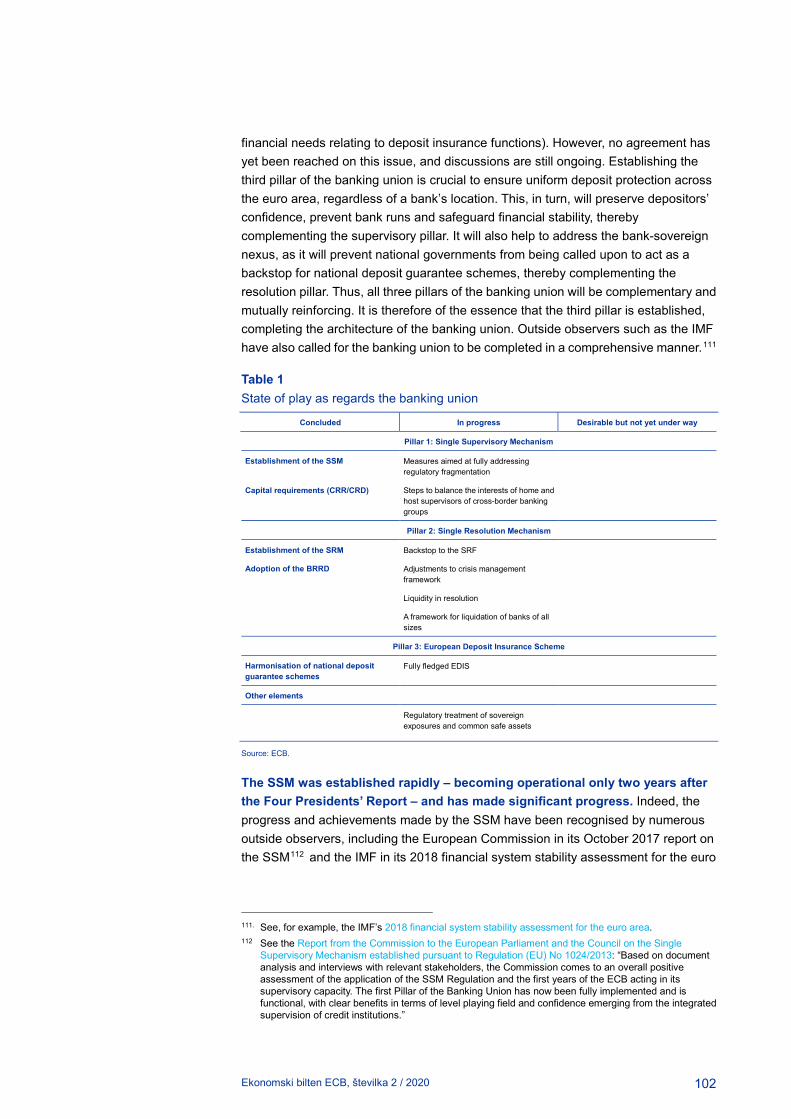
Ekonomski bilten ECB, številka 2 / 2020
102
financial needs relating to deposit insurance functions). However, no agreement has yet been reached on this issue, and discussions are still ongoing. Establishing the third pillar of the banking union is crucial to ensure uniform deposit protection across the euro area, regardless of a bank’s location. This, in turn, will preserve depositors’ confidence, prevent bank runs and safeguard financial stability, thereby complementing the supervisory pillar. It will also help to address the bank-sovereign nexus, as it will prevent national governments from being called upon to act as a backstop for national deposit guarantee schemes, thereby complementing the resolution pillar. Thus, all three pillars of the banking union will be complementary and mutually reinforcing. It is therefore of the essence that the third pillar is established, completing the architecture of the banking union. Outside observers such as the IMF have also called for the banking union to be completed in a comprehensive manner.111
Table 1 State of play as regards the banking union
Concluded In progress Desirable but not yet under way
Pillar 1: Single Supervisory Mechanism
Establishment of the SSM Measures aimed at fully addressing regulatory fragmentation
Capital requirements (CRR/CRD) Steps to balance the interests of home and host supervisors of cross-border banking groups
Pillar 2: Single Resolution Mechanism
Establishment of the SRM Backstop to the SRF
Adoption of the BRRD Adjustments to crisis management framework
Liquidity in resolution
A framework for liquidation of banks of all sizes
Pillar 3: European Deposit Insurance Scheme
Harmonisation of national deposit guarantee schemes
Fully fledged EDIS
Other elements
Regulatory treatment of sovereign exposures and common safe assets
Source: ECB.
The SSM was established rapidly – becoming operational only two years after the Four Presidents’ Report – and has made significant progress. Indeed, the progress and achievements made by the SSM have been recognised by numerous outside observers, including the European Commission in its October 2017 report on the SSM112 and the IMF in its 2018 financial system stability assessment for the euro
111. See, for example, the IMF’s 2018 financial system stability assessment for the euro area. 112 See the Report from the Commission to the European Parliament and the Council on the Single
Supervisory Mechanism established pursuant to Regulation (EU) No 1024/2013: “Based on document analysis and interviews with relevant stakeholders, the Commission comes to an overall positive assessment of the application of the SSM Regulation and the first years of the ECB acting in its supervisory capacity. The first Pillar of the Banking Union has now been fully implemented and is functional, with clear benefits in terms of level playing field and confidence emerging from the integrated supervision of credit institutions.”

Ekonomski bilten ECB, številka 2 / 2020
103
area.113 Those achievements include the harmonisation of supervisory practices, as well as significant improvements to a number of risk metrics, such as capital buffers, liquidity reserves and non-performing loans.
The establishment of the second pillar of the banking union was also rapid and represents a key milestone in the process of strengthening Europe’s bank resolution framework. The SRM, with the Single Resolution Board (SRB) at its heart and the Single Resolution Fund (SRF) providing resolution financing, has been operational since 2016. The SRF pools contributions received from credit institutions in the banking union and has a target capacity of at least 1% of the total covered deposits of all authorised credit institutions in participating Member States, which must be reached by the end of 2023. Under the supervision of resolution authorities, banks are in the process of building up loss-absorption capacity as required by the minimum requirements for own funds and eligible liabilities (MREL). MREL liabilities include regulatory capital, but they also include other liabilities (e.g. senior unsecured bonds) which are deemed able to absorb losses and contribute to recapitalisation needs in the event of resolution. At the Euro Summit in June 2018, it was agreed that the ESM would provide a common backstop to the SRF in the form of a revolving credit line, starting in 2024. That backstop will have the same firepower as the SRF (i.e. 1% of covered deposits), thus doubling the resources that are available to support and facilitate bank resolution. Moreover, it was agreed at the Euro Summit in December 2018 that the backstop could be introduced before 2024 if sufficient risk reduction had been achieved in banks’ balance sheets. Work on making the backstop operational is ongoing.
Despite the progress made so far, the banking union remains incomplete. Outstanding issues include regulatory fragmentation, gaps in the crisis management framework (e.g. the lack of a harmonised insolvency regime), the absence of a common deposit insurance scheme, and the lack of a common framework for the provision of liquidity in resolution. A number of these elements are linked, and in June 2019 the High-Level Working Group on a European Deposit Insurance Scheme (which consists of members of the Eurogroup Working Group) was tasked with carrying out further technical work and identifying a transitional path with a view to addressing unresolved issues and moving towards a steady state banking union (see Table 1 for an overview of the various elements). At the Eurogroup meeting on 4 December 2019, the Chair of the High-Level Working Group put forward several proposals:114
• An EDIS should be established, initially covering only liquidity needs, but eventually encompassing also loss coverage in line with progress on risk reduction. In the initial phase, a hybrid approach could be adopted, providing liquidity support within certain limits and relying on existing national deposit
113. Op. cit. in footnote 13: “Banking supervision in the euro area has improved significantly following the
creation of the Single Supervisory Mechanism (SSM). A detailed assessment against the Basel Core Principles finds that the SSM has established its operational independence and effectiveness, intensifying supervision while harmonizing at a high level. The SSM has also implemented sophisticated risk analysis in the process of setting capital targets for individual institutions.”
114. For more detailed information on those proposals, see the letter that the Chair of the High-Level Working Group sent to the Eurogroup: https://www.consilium.europa.eu/media/41644/2019-12-03-letter-from-the-hlwg-chair-to-the-peg.pdf

Ekonomski bilten ECB, številka 2 / 2020
104
guarantee schemes, with a central fund gradually being established. In a subsequent phase, the EDIS could also increasingly cover losses.
• The regulatory treatment of sovereign exposures (RTSE) should be reformed gradually. Initially, supervisory (Pillar 2) and transparency (Pillar 3) requirements could be strengthened further. Following further analysis and an impact assessment, risk-based contributions to the EDIS could also take account of sovereign exposures, and that regulatory treatment could also include the gradual phasing-in of concentration charges for sovereign exposures. That gradual phasing-in of measures would take due account of the possible impact on national debt markets and financial stability. Further analysis of a “European safe portfolio” (i.e. safe assets and the role they play in the banking sector) should also be conducted.
• Proposals were also made in respect of the crisis management framework and cross-border integration. These involved, among other things, harmonising elements of insolvency law, formalising support arrangements within EU banking groups (i.e. establishing a formal mechanism for subsidiaries’ support by their parents), phasing out options and national discretions that had ceased to be justified, reviewing the governance of the SRB and facilitating cross -border banking. These measures should ensure that bank failures can be tackled effectively and without bailouts, preserving a level playing field and ensuring financial stability. It was also suggested that financial integration should be strengthened by rolling back prudential and non-prudential obstacles to cross-border banking between Member States.
There was broad recognition at that Eurogroup meeting that the High-Level Working Group’s report contained important proposals for the strengthening of EMU. The High-Level Working Group and the Eurogroup Working Group have been asked to continue working on all elements. Further work will also be carried out by the institutions and the relevant Council working parties.
Work will also continue in the relevant European fora on the provision of liquidity to banks in resolution. When failing banks go into resolution, viable parts can be resolved and restructured, re-entering the marketplace either as a stand -alone entity or as part of a larger banking group. During this transition phase, they may temporarily lack access to the market liquidity that they need in order to successfully reinitiate their operations. This is why other jurisdictions (such as the United Kingdom and the United States) have established public systems that provide liquidity to banks in resolution. Although they vary in terms of their precise design, these systems generally rely on central bank liquidity, underpinned by fiscal guarantees. No such functionality exists at euro area level, implying a de facto fallback onto national solutions.
National solutions, however, do not reflect the reality that large euro area banks are now supervised at European level, creating a mismatch between liability and control. Moreover, national solutions risk fuelling the bank-sovereign nexus, as fiscal authorities may have to backstop banks’ liquidity needs using national fiscal guarantees. Work is under way with a view to finding an adequate solution to this issue
Ekonomski bilten ECB, številka 2 / 2020
105
within the banking union, and various different options are on the table. As banks in resolution may sometimes have substantial liquidity needs, it is essential, in order to facilitate resolution and preserve confidence, that sufficient firepower is available – if necessary, beyond what is available via the SRF and the backstop to the SRF. However, when assessing potential solutions involving the Eurosystem, it is important to note, in this regard, that the Eurosystem can only provide liquidity against adequate collateral.
The Council and the European Parliament are expected to continue working on legislative initiatives relating to the banking union and banking regulation more broadly. This will include proposals made in the previous legislative period which have not yet come to fruition (such as a number of regulations/directives relating to collateral and the recovery and resolution of central counterparty clearing), as well as new initiatives and reviews of existing legislation (including the implementation of Basel III and aspects of the single rulebook relating to capital requirements and resolution).115
2.2 Capital markets union
The Five Presidents’ Report also called for further development of the CMU. The idea here is that well-functioning capital markets can strengthen cross-border risk sharing through deeper integration of bond and equity markets. An increase in private risk sharing and greater integration of markets can also provide a buffer against systemic shocks in the financial sector. In addition, companies – including small and medium-sized enterprises (SMEs) – will have access to a more diverse range of finance, in addition to bank credit.
The goals of the CMU project, as defined in the Commission’s 2015 action plan,116 are manifold, with the overarching aim being to create “stronger capital markets” in the EU. The CMU project originally stemmed, in essence, from the observation that, relative to other monetary unions, the euro area had less well developed and less integrated capital markets, which were preventing it from enjoying a number of economic benefits. A fully fledged CMU (which, in combination with the banking union, could lay the foundations for a financial union) would “help mobilise capital in Europe and channel it to all companies”, as well as “deepen financial integration” through “more cross-border risk sharing, more liquid markets and diversified sources of funding”.117 In its response to the Commission’s 2015 green paper,118 the Eurosystem noted that “CMU has the potential to complement the banking union, strengthen Economic and Monetary Union (EMU) and deepen the Single Market”. Outside observers such as the IMF make similar arguments.119
115. For updates on the progress of legislative initiatives, see https://www.europarl.europa.eu/legislative-train 116. See https://eur-lex.europa.eu/legal-content/EN/TXT/PDF/?uri=CELEX:52015DC0468&from=EN 117. Ibid. 118. See “Building a Capital Markets Union – Eurosystem contribution to the European Commission’s Green
Paper”, April 2015. 119. See Bhatia et al., “A Capital Market Union for Europe”, Staff Discussion Notes, No 19/07, IMF, 2019.
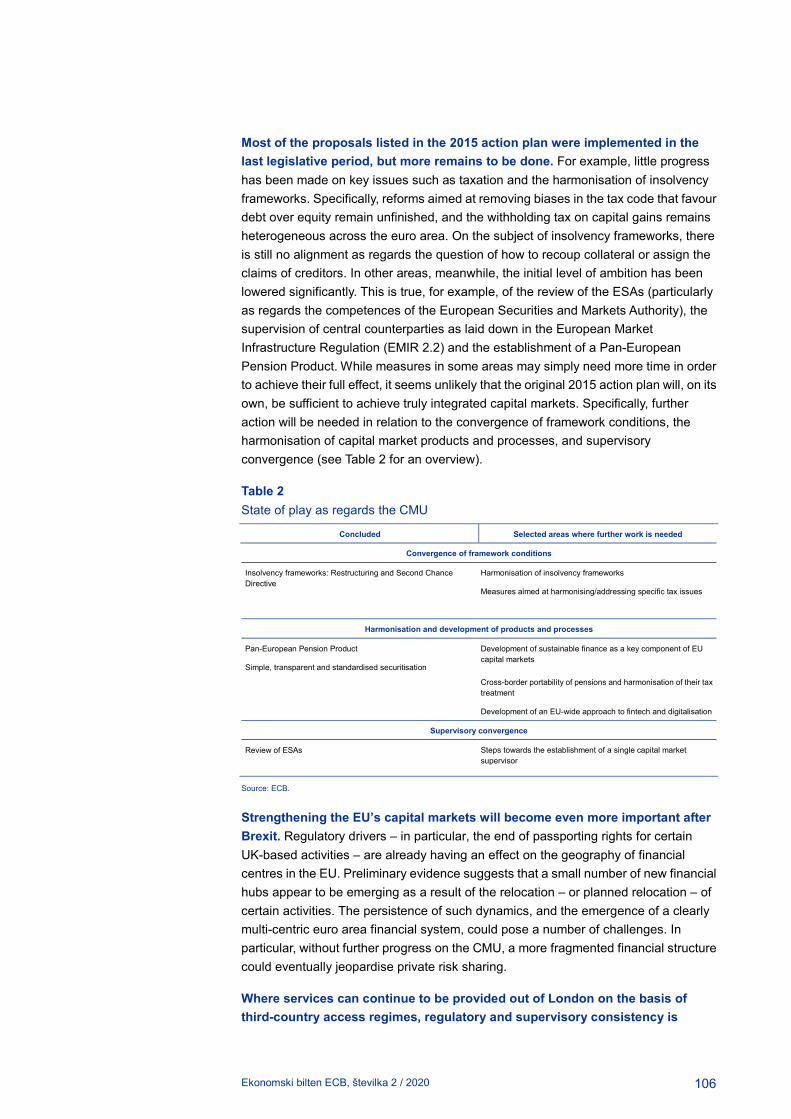
Ekonomski bilten ECB, številka 2 / 2020
106
Most of the proposals listed in the 2015 action plan were implemented in the last legislative period, but more remains to be done. For example, little progress has been made on key issues such as taxation and the harmonisation of insolvency frameworks. Specifically, reforms aimed at removing biases in the tax code that favour debt over equity remain unfinished, and the withholding tax on capital gains remains heterogeneous across the euro area. On the subject of insolvency frameworks, there is still no alignment as regards the question of how to recoup collateral or assign the claims of creditors. In other areas, meanwhile, the initial level of ambition has been lowered significantly. This is true, for example, of the review of the ESAs (particularly as regards the competences of the European Securities and Markets Authority), the supervision of central counterparties as laid down in the European Market Infrastructure Regulation (EMIR 2.2) and the establishment of a Pan-European Pension Product. While measures in some areas may simply need more time in order to achieve their full effect, it seems unlikely that the original 2015 action plan will, on its own, be sufficient to achieve truly integrated capital markets. Specifically, further action will be needed in relation to the convergence of framework conditions, the harmonisation of capital market products and processes, and supervisory convergence (see Table 2 for an overview).
Table 2 State of play as regards the CMU
Concluded Selected areas where further work is needed
Convergence of framework conditions
Insolvency frameworks: Restructuring and Second Chance Directive
Harmonisation of insolvency frameworks
Measures aimed at harmonising/addressing specific tax issues
Harmonisation and development of products and processes
Pan-European Pension Product Development of sustainable finance as a key component of EU capital markets
Simple, transparent and standardised securitisation
Cross-border portability of pensions and harmonisation of their tax treatment
Development of an EU-wide approach to fintech and digitalisation
Supervisory convergence
Review of ESAs Steps towards the establishment of a single capital market supervisor
Source: ECB.
Strengthening the EU’s capital markets will become even more important after Brexit. Regulatory drivers – in particular, the end of passporting rights for certain UK-based activities – are already having an effect on the geography of financial centres in the EU. Preliminary evidence suggests that a small number of new financial hubs appear to be emerging as a result of the relocation – or planned relocation – of certain activities. The persistence of such dynamics, and the emergence of a clearly multi-centric euro area financial system, could pose a number of challenges. In particular, without further progress on the CMU, a more fragmented financial structure could eventually jeopardise private risk sharing.
Where services can continue to be provided out of London on the basis of third-country access regimes, regulatory and supervisory consistency is

Ekonomski bilten ECB, številka 2 / 2020
107
needed. A fragmented framework for third-country access, relying on a patchwork of existing national regimes, could give rise to regulatory arbitrage, with firms potentially seeking to circumvent host supervision and EU regulatory requirements. Appropriate oversight will be needed, with EU regulators and supervisors being given adequate tools, especially considering that existing third-country regimes were not designed to manage substantial cross-border provision of services.
Measures aimed at developing capital markets would help to strengthen the EU’s domestic capacity in areas where reliance on London is more pronounced. A substantial reduction in the provision of cross-border services by the City of London would strengthen the case for developing domestic capacity. CMU initiatives have been launched in order to support the development of certain market segments, such as securitisation and crowdfunding. The CMU project also seeks to increase the use of equity financing through its role in supporting investment and private risk sharing. Thus, in a post-Brexit world, initiatives fostering the development of genuine capital markets will be even more important.
The Commission has initiated further work on the CMU with a view to presenting legislative proposals in 2020. The High-Level Forum established by the Commission has been tasked with putting forward proposals for the next CMU action plan by the end of May 2020. The High-Level Forum is exploring three questions: (i) how to create an ecosystem that allows greater cross-border raising of capital, with a particular focus on innovative SMEs; (ii) how to establish pan -European capital market architecture, with a particular focus on the question of how new financial technologies can support this process;120 and (iii) how investment choices and access to capital market services can foster greater participation by retail investors.
The Council is also looking at issues in this area. In October 2019, a high-level working group established by a number of Member States published proposals aimed at relaunching the CMU. These included recommendations aimed at generating long-term savings opportunities, developing equity markets, enhancing cross-border financial flows, and developing debt, credit and forex financing tools. The conclusions of the December 2019 ECOFIN meeting call for a roadmap to be drawn up for the deepening of the CMU on the basis of six objectives: (i) enhanced access to finance for EU firms (especially SMEs); (ii) the removal of structural and legal barriers to increased cross-border capital flows; (iii) the provision of incentives encouraging well-informed retail savers to invest, and the removal of obstacles standing in their way; (iv) support for transition to sustainable economies; (v) the embracing of technological progress and digitalisation; and (vi) strengthening of the global competitiveness of EU capital markets.121 Those conclusions invite the Commission to assess and explore detailed measures and actions that could help to achieve these objectives.
While there is broad acknowledgement of the importance of the CMU, the challenge will be to transform that ambition into concrete and ambitious 120. The ECB is participating in this work stream as an observer. 121. See
https://www.consilium.europa.eu/en/press/press-releases/2019/12/05/capital-markets-union-council-sets-objectives-for-the-deepening-of-the-project
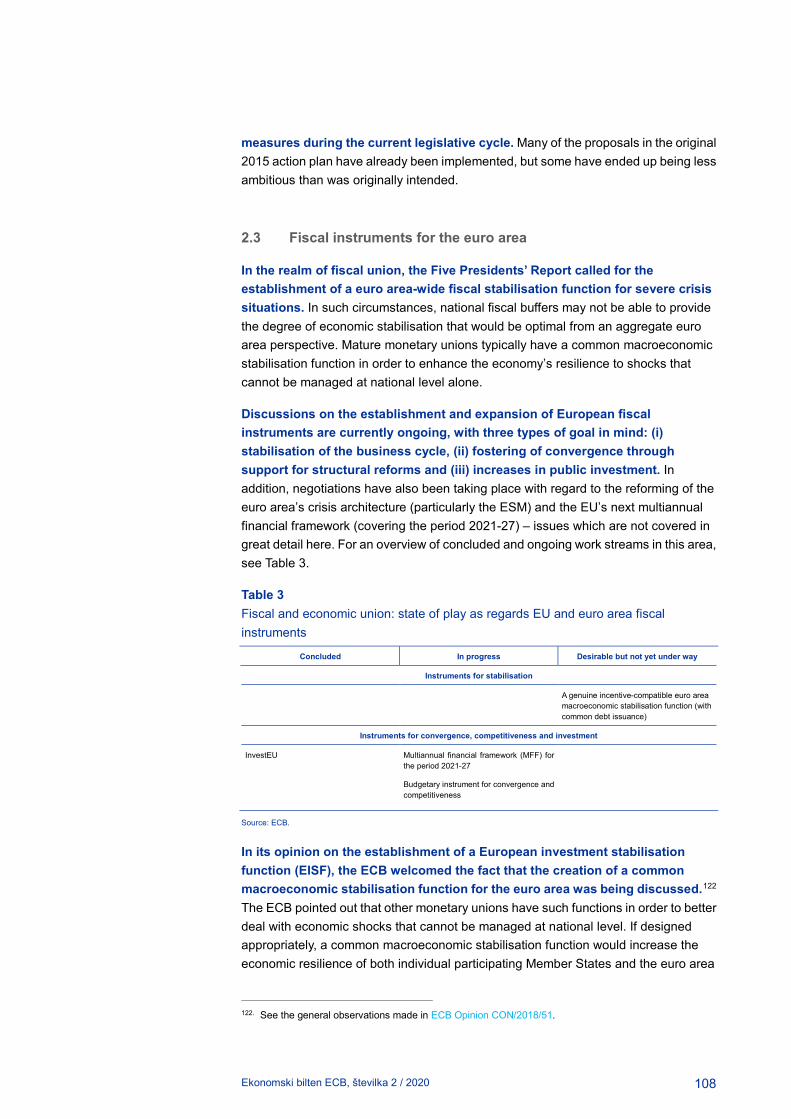
Ekonomski bilten ECB, številka 2 / 2020
108
measures during the current legislative cycle. Many of the proposals in the original 2015 action plan have already been implemented, but some have ended up being less ambitious than was originally intended.
2.3 Fiscal instruments for the euro area
In the realm of fiscal union, the Five Presidents’ Report called for the establishment of a euro area-wide fiscal stabilisation function for severe crisis situations. In such circumstances, national fiscal buffers may not be able to provide the degree of economic stabilisation that would be optimal from an aggregate euro area perspective. Mature monetary unions typically have a common macroeconomic stabilisation function in order to enhance the economy’s resilience to shocks that cannot be managed at national level alone.
Discussions on the establishment and expansion of European fiscal instruments are currently ongoing, with three types of goal in mind: (i) stabilisation of the business cycle, (ii) fostering of convergence through support for structural reforms and (iii) increases in public investment. In addition, negotiations have also been taking place with regard to the reforming of the euro area’s crisis architecture (particularly the ESM) and the EU’s next multiannual financial framework (covering the period 2021-27) – issues which are not covered in great detail here. For an overview of concluded and ongoing work streams in this area, see Table 3.
Table 3 Fiscal and economic union: state of play as regards EU and euro area fiscal instruments
Concluded In progress Desirable but not yet under way
Instruments for stabilisation
A genuine incentive-compatible euro area macroeconomic stabilisation function (with common debt issuance)
Instruments for convergence, competitiveness and investment
InvestEU Multiannual financial framework (MFF) for the period 2021-27
Budgetary instrument for convergence and competitiveness
Source: ECB.
In its opinion on the establishment of a European investment stabilisation function (EISF), the ECB welcomed the fact that the creation of a common macroeconomic stabilisation function for the euro area was being discussed.122 The ECB pointed out that other monetary unions have such functions in order to better deal with economic shocks that cannot be managed at national level. If designed appropriately, a common macroeconomic stabilisation function would increase the economic resilience of both individual participating Member States and the euro area
122. See the general observations made in ECB Opinion CON/2018/51.

Ekonomski bilten ECB, številka 2 / 2020
109
as a whole, thereby also supporting the single monetary policy, particularly in the presence of deep euro area-wide recessions.
Thus far, little progress has been made on the establishment of a genuine stabilisation function. In addition to the Commission’s 2018 proposal for an EISF,123 prominent proposals ranging from “rainy day funds” to investment protection schemes and unemployment (re)insurance schemes have been made by international institutions, academics and a number of Member States.124 Those proposals have been discussed in EU fora, which are continuing to work on them, but only at a technical level. Meanwhile, Commission President Ursula von der Leyen has indicated that she intends to propose a European unemployment benefit reinsurance scheme. At this stage, however, there is no concrete information on the possible design of such a scheme.125
Rather than a stabilisation function, it has been agreed, as a compromise, that a budgetary instrument for convergence and competitiveness will be created in order to provide EU funds to Member States for structural reforms and investment. In its agreement of 10 October 2019, the Eurogroup set out the main features of the BICC, including key governance principles and financing modalities, as well as core parameters for the allocation of funds.126 Funds will be allocated to each Member State on the basis of its population and the inverse of its gross national income (GNI) per capita, with a “juste retour” floor of 70%. (In other words, Member States can never receive less than 70% of the funds that they have paid in.) As regards national co-financing rates, the agreement foresees a rate of 25%, while a modulation procedure envisages that this rate can be cut in half in the presence of severe economic circumstances.127 The main outstanding issues relating to the BICC concern its size and financing. As regards the amount of funding to be provided from the EU budget, the Eurogroup and the Commission had proposed a sum of €17 billion, but in December the Finnish EU Presidency proposed a substantially lower amount of €12.9 billion as part of the negotiation of the multiannual financial framework. On the subject of financing, the Eurogroup Working Group has been tasked with carrying out further discussions in 2020 on an intergovernmental agreement (IGA) that could funnel additional resources into the BICC. This has resulted in a dedicated report providing further information on the rationale for the IGA and its content, modalities
123. The Commission has also made proposals on convergence and public investment in the form of a plan
for a Reform Support Programme and a proposal to turn the European Fund for Strategic Investments (the “Juncker Plan”) into InvestEU (see http://europa.eu/rapid/press-release_IP-18-3972_en.htm).
124. See, for example, the IMF’s proposal on a central fiscal capacity for the euro area and the proposal made by 14 French and German economists on reconciling risk sharing with market discipline.
125. See “A Union that strives for more: My agenda for Europe – Political Guidelines for the next European Commission 2019-24”. For a technical assessment of the various different design options for a European unemployment insurance scheme, see Koester, G. and Sondermann, D., “A euro area macroeconomic stabilisation function: assessing options in view of their redistribution and stabilisation properties”, Occasional Paper Series, No 216, ECB, 2018.
126. See the Eurogroup term sheet on the budgetary instrument for convergence and competitiveness. 127. A national co-financing rate of 25% means that a quarter of the costs of a particular project are borne by
the receiving Member State, while the remaining 75% are financed via the EU budget. The degree of co-financing required to receive EU funds may temporarily be reduced by half in the presence of severe economic circumstances, as defined in the Stability and Growth Pact. Such cyclical modulation can occur in the event of a negative annual GDP volume growth rate or if a country experiences an accumulated loss of output (see Article 2 of Council Regulation (EC) No 1467/97).
Ekonomski bilten ECB, številka 2 / 2020
110
and scope.128 A final decision – including a decision on the IGA – will be taken by Europe’s leaders in the context of the MFF negotiations. Given that it is currently expected to be fairly limited in terms of capacity, the BICC will probably not have a material impact on the convergence, competitiveness or stabilisation of the euro area. Equipping the BICC with additional resources via an IGA will therefore be essential in order to increase its effectiveness.
At the same time, over the last few years, a number of budgetary instruments aimed at supporting investment have been developed and scaled up at EU28 – rather than euro area – level. In 2014, the European Commission launched its Investment Plan for Europe (the “Juncker Plan”) as a collective fiscal instrument at EU level in order to reverse the downward trend in investment and help sustain the economic recovery. By October 2019, the Investment Plan for Europe had triggered €439.4 billion in additional investment across the EU. Indeed, according to the Commission, investment under this programme had increased EU GDP by 0.9% by 2019 and will increase it by a cumulative total of 1.8% by 2022. The European Investment Bank (EIB) is another budgetary instrument that exists at EU level. In 2012, the EIB’s capital was increased further (bringing its subscribed capital to €232.4 billion) with the aim of contributing to economic growth in Europe. That increase in capital has allowed the EIB to provide about €60 billion in additional lending over a three-year period, thereby further increasing the macroeconomic impact of its operations.
Looking ahead, there are several proposals aimed at increasing the EU’s support for investment which may have a beneficial macroeconomic impact at euro area level, albeit they do not seek to achieve countercyclical effects and are limited in size. In the Commission’s proposal for the 2021-27 multiannual financial framework, the largest relative increase in the EU budget can be seen in the area of support for investment. The InvestEU programme proposed for the next MFF is expected to place the European Fund for Strategic Investments and 13 other EU financial instruments under a single roof, mobilising at least €650 billion in additional investment.129 Moreover, the Sustainable Investment Plan announced by the new Commission is expected to trigger €1 trillion in climate-related investment between 2020 and 2030. The Commission tabled a proposal on this issue on 8 January 2020.
The establishment of a central fiscal capacity could involve the issuance of some form of safe asset at euro area level. In this context, the General Board of the European Systemic Risk Board (ESRB) set up a High-Level Task Force on Safe Assets, which investigated the practical considerations relating to sovereign bond -backed securities (SBBSs).130 At present, however, no specific proposals on euro area safe assets are being discussed in EU fora at political level.
A discussion on reorienting EU policies – including the EU budget – towards the provision of public goods such as environmental protection, digitalisation 128 See the Eurogroup report on a possible intergovernmental agreement for the budgetary instrument for
convergence and competitiveness. 129. See the European Commission’s press release of 6 June 2018. 130. See the first volume of the report produced by the High-Level Task Force on Safe Assets for the main
findings in this regard.
Ekonomski bilten ECB, številka 2 / 2020
111
and security is gaining traction. The Commission has made climate change its central priority for the next five years, and the French and German governments recently commissioned a study looking at the potential of European public goods across a wide range of policy areas in the context of the changing geopolitical conditions facing the EU.131 Even if they have no impact on policies at EU level, these discussions could still lead to greater coordination between the national policies of individual countries.
2.4 Governance of national fiscal and economic policies
In the realm of fiscal and economic union, the Five Presidents’ Report called for stronger coordination of national policies under both the Stability and Growth Pact and the MIP. On the subject of fiscal policies, that report emphasised the need for responsible budgetary policies at Member State level. A review of the six-pack and two-pack – a related consultation process was launched by the Commission on 5 February132 – was identified as an opportunity to increase clarity, transparency, compliance and legitimacy, while preserving the stability -oriented nature of the fiscal rules. Better compliance with fiscal rules was to be achieved via the establishment of the European Fiscal Board (EFB), which would coordinate and complement national fiscal councils and provide an independent assessment of Member States’ compliance with the rules of the Stability and Growth Pact. As regards economic policies, the Five Presidents’ Report emphasised the need for further economic convergence in order to achieve consistently resilient economic structures throughout the euro area. A network of competitiveness authorities (“national productivity boards”) was envisaged for the euro area in order to track performance in the field of competitiveness, prevent economic divergence and increase ownership of the necessary reforms at national level. Moreover, the Five Presidents’ Report also called for stronger surveillance under the MIP to encourage structural reforms and better capture imbalances at the level of the euro area as a whole. Meanwhile, the European Semester was to place greater emphasis on the coordination of economic policies.
An effective coordination system for national economic policies is essential for the smooth functioning of EMU. This is of vital importance in order to support the single monetary policy and bolster economic convergence both within and across countries.
The fiscal and economic governance framework in EMU has been reformed over the years, drawing on lessons learned both before and during the crisis. The six-pack reform of 2011 and the two-pack reform of 2013 sought to place greater emphasis on debt133 and expenditure control, strengthening enforcement, improving the monitoring of macroeconomic imbalances and establishing independent fiscal institutions at national level. Since then, EU fiscal rules have been subject to 131. See the Bruegel study by Jean Pisani-Ferry and Clemens Fuest that was prepared for the French and
German finance ministers. 132. See the Commission’s communication on its economic governance review, which was published on 5
February 2020. 133. See the article entitled “Government debt reduction strategies in the euro area”, Economic Bulletin, Issue
3, ECB, 2016.

Ekonomski bilten ECB, številka 2 / 2020
112
continuous refinement and interpretative innovation, which has resulted in greater complexity and increased the scope for discretion. The EFB and national productivity boards have also been established. The Five Presidents’ Report, which called for the creation of the EFB, anticipated that it would act as an advisory body, coordinating and complementing national fiscal councils and providing a public and independent assessment of the implementation of the EU’s fiscal governance framework.134 Meanwhile, the Five Presidents’ Report’s call for a network of competitiveness authorities in the euro area to prevent economic divergence and increase ownership of the necessary reforms at national level resulted in the Council recommending the establishment of national productivity boards.135 Table 4 provides an overview of developments in this area.
Table 4 Fiscal and economic union: state of play as regards the governance of national policies
Concluded In progress Desirable but not yet under way
Fiscal rules
Two-pack and six-pack reforms to improve Stability and Growth Pact
Review of two-pack and six-pack: more simple and effective rules to ensure countercyclicality and sustainability
European and national fiscal boards
Structural reforms and macroeconomic imbalance procedure
European Semester with greater emphasis on euro area priorities
Reform support via budgetary instrument for convergence and competitiveness
Full use of MIP, including corrective arm
Structural Reform Support Service Reform of six-pack: improvement of the MIP
New instruments to strengthen reforms
National productivity boards Completion of the Single Market
Source: ECB.
However, the reform of the Stability and Growth Pact has had mixed results. Overall, the debt and deficit levels of the euro area as a whole are below those seen in other major advanced economies. There are no ongoing excessive deficit procedures (EDPs) at present, and many euro area countries have now reached their medium-term budgetary objectives (MTOs).136 At the same time, some countries have made insufficient progress in terms of reducing government debt and deficits.137 There are currently limited fiscal buffers available to support growth if downside risks to the current economic outlook materialise, particularly in high-debt countries. In addition to criticism of their limited effect as a disciplining device, the EFB and others have also pointed out that the rules have become too complex and overly reliant on unobservable variables such as output gaps. Moreover, the Stability and Growth Pact does not contain rules or instruments aimed at steering the aggregate euro area fiscal
134. See the box entitled “The creation of a European Fiscal Board”, Economic Bulletin, Issue 7, ECB, 2015. 135. See the Council recommendation of 20 September 2016. 136. See the article entitled “Fiscal rules in the euro area and lessons from other monetary unions”, Economic
Bulletin, Issue 3, ECB, 2019. 137. See Kamps, C. and Leiner-Killinger, N., “Taking stock of the functioning of the EU fiscal rules and options
for reform”, Occasional Paper Series, No 231, ECB, 2019; and Kamps, C. and Hauptmeier, S., “Debt rule design in theory and practice – the SGP’s debt benchmark revisited”, Working Paper Series, ECB, forthcoming.

Ekonomski bilten ECB, številka 2 / 2020
113
stance, and little effort has been made to improve the quality of public finances, irrespective of the fiscal stance.138
As regards structural policies, continued weak implementation of country -specific recommendations (CSRs) by Member States – including those with excessive imbalances – remains a challenge for the European Semester.139 Indeed, in February 2019 the Commission concluded that none of the 2018 CSRs for euro area countries had been “fully” implemented.140 Meanwhile, “substantial” progress was only observed for around 5% of CSRs. This was similar to the situation seen in previous years. As such, the streamlining of the European Semester (by reducing the number of CSRs) and the enhancement of the dialogue between the Commission and Member States have not yielded the intended improvements. Moreover, countries with excessive imbalances do not seem to have taken further decisive policy action to step up the implementation of their CSRs. Finally, the macroeconomic imbalance procedure has not yet been applied in full, as the Commission has never exercised its right to initiate an excessive imbalance procedure (EIP).141
The Commission is now in the process of reviewing both the six-pack and the two-pack, with that review due to be concluded in 2020.142 That review, which was launched on 5 February, will take account of four key weaknesses in the fiscal framework: (i) the high levels of debt in some Member States; (ii) the procyclical nature of fiscal policies; (iii) the complexity of rules and the lack of ownership; and (iv) the fact that insufficient attention is paid to investment. The Commission has also launched a consultation process, inviting stakeholders (including the ECB) to provide their views on the question of how the economic governance framework has functioned so far and how best to enhance its effectiveness. That consultation process will run until the summer, and the Commission will then take all responses into consideration when it reflects internally on possible next steps in the second half of the year.
A number of possible ways of rectifying the EU’s fiscal governance framework have been put forward by stakeholders. In 2017, for instance, the Commission proposed amending the Treaty on Stability, Coordination and Governance (the “fiscal compact”) and integrating it into the EU’s legal framework.143 Meanwhile, the IMF,144 the EFB145 and ECB staff146 have all advocated reforming the Stability and Growth 138. See the article entitled “The euro area fiscal stance”, Economic Bulletin, Issue 4, ECB, 2016; and
Bańkowski, K. and Ferdinandusse, M., “Euro area fiscal stance”, Occasional Paper Series, No 182, ECB, 2017.
139. See Pierluigi, B. and Sondermann, D., “Macroeconomic imbalances in the euro area: where do we stand?”, Occasional Paper Series, No 211, ECB, 2018.
140. See the box entitled “Country-specific recommendations for economic policies under the 2019 European Semester”, Economic Bulletin, Issue 5, ECB, 2019.
141. See Sondermann, D. and Zorell, N., “A macroeconomic vulnerability model for the euro area”, Working Paper Series, No 2306, ECB, 2019, for a discussion of the MIP scoreboard indicators in the context of an early warning approach.
142. See the Commission’s tentative schedule as of 3 December 2019. 143. See ECB Opinion CON/2018/25 of 11 May 2018 on a proposal for a Council directive laying down
provisions for strengthening fiscal responsibility and the medium-term budgetary orientation in the Member States.
144. See Andrle, M. et al., “Reforming Fiscal Governance in the European Union”, Staff Discussion Notes, No 15/09, IMF, May 2015.
145. See EFB, “Assessment of EU fiscal rules with a focus on the six and two-pack legislation”, August 2019.

Ekonomski bilten ECB, številka 2 / 2020
114
Pact on the basis of a single long-run debt target and a single operational instrument (such as an expenditure rule). The EFB has called for a wide-ranging review aimed at simplifying the rules, combined with progress towards the establishment of a stabilisation capacity.147 Most observers also see a link between further risk sharing and market discipline.
On the subject of reforming the European Semester and the MIP, no major proposals have been tabled, other than the BICC. The Commission has, however, indicated that it intends to integrate the UN Sustainable Development Goals into the European Semester, as well as possibly replacing the EU2020 Agenda (which serves as an anchor for the European Semester) with the UN’s 2030 Agenda for Sustainable Development.
At the same time, in the context of growing concerns about global competition, digitalisation and climate change, the Single Market is set to feature more prominently in the Commission’s agenda going forward. Ambitious policy agendas in these three areas have the potential to open up new sources of growth and play an important role in accelerating convergence within EMU, which historically grew out of the Single Market. Services, for example, remain underdeveloped and could help to bring about more integrated and resilient product markets.148 149 The Commission has also launched a Green New Deal, which is expected to mobilise additional investment in order to finance the transition process.
2.5 Crisis management
The establishment of a fiscal backstop for the euro area in the form of the European Stability Mechanism was of fundamental importance for the resilience of EMU. In response to the euro area sovereign debt crisis, euro area countries established the European Financial Stability Facility (EFSF) in 2010. This was followed in 2012 by the establishment of the ESM as a permanent euro area crisis management body outside the EU’s legal framework. Together, the EFSF and the ESM have disbursed €295 billion in financial assistance since 2010.
Over the last two years, euro area countries have been negotiating a reform of the ESM in order to increase its operational capacity. In December 2019, the Eurogroup agreed in principle on four broad reforms, which will be reflected in a revised ESM Treaty. First, the ESM will act as a backstop for the Single Resolution Fund. Second, the ESM will play a more prominent role in the design and monitoring of
146. See Kamps, C. and Leiner-Killinger, N., “Taking stock of the functioning of the EU fiscal rules and options for reform”, Occasional Paper Series, No 231, ECB, 2019; and Hauptmeier, S. and Kamps, C., “Debt rule design in theory and practice – the SGP’s debt benchmark revisited”, Working Paper Series, ECB, forthcoming.
147. The EFB has, however, noted that Member States do not regard the current practices as sufficiently destabilising to make such a review a high priority.
148. See the Commission’s assessment of the implementation of the Services Directive. 149. See ECB Opinion CON/2018/25 of 11 May 2018 on a proposal for a Council directive laying down
provisions for strengthening fiscal responsibility and the medium-term budgetary orientation in the Member States.

Ekonomski bilten ECB, številka 2 / 2020
115
conditionality requirements in macroeconomic adjustment programmes, as well as external programmes. Third, the conditions for accessing the ESM’s precautionary support will be set out more clearly. And fourth, the framework for assessing the sustainability of debt will be refined further, and single-limb collective action clauses (CACs) will be introduced as of 2022. The revised ESM Treaty should be signed in the coming months, once all remaining legal issues have been resolved.150
2.6 Other institutional issues (“political union”)
The Five Presidents’ Report stressed that institutional innovations need to be accompanied by greater economic integration. Specifically, greater responsibility at EU and euro area level needs to go hand in hand with “greater democratic accountability, legitimacy and institutional strengthening”.151
As regards these broader institutional reforms, a number of initiatives proposed in the Five Presidents’ Report have yet to materialise (see Table 5 for an overview). These initiatives include, for example, more unified external representation of the euro area and the establishment of a euro area treasury. Meanwhile, others have called for clearer separation between the prosecution and adjudicatory roles within the Commission, in order to strengthen its ability to act as the guardian of the Treaty in enforcing the Stability and Growth Pact. Moreover, the ESM and the fiscal compact have not yet been integrated into EU law. While the Commission put forward proposals in these areas, both co-legislators eventually decided not to follow up on them. In a similar vein, the policy proposal presented by the Commission in 2017 with a view to establishing a euro area treasury152 met with strong scepticism in the Council, and the Commission never made a formal legislative proposal. These institutional reforms could potentially become more relevant when it comes to the institutional arrangements for any future fiscal capacity.
150. The euro area’s crisis management framework will be discussed in greater depth in a forthcoming issue
of the Economic Bulletin, which will include a more detailed assessment of these ESM reforms. 151. See the Five Presidents’ Report. 152. See the Commission’s “Reflection Paper on the Deepening of the Economic and Monetary Union”, May
2017.

Ekonomski bilten ECB, številka 2 / 2020
116
Table 5 State of play as regards other institutional issues
Concluded In progress Desirable but not yet under way
Interplay with national policies
Intensified dialogue with European and national parliaments, as well as governments, through the European Semester
Further institutional negotiations and coherence of EU legal order
Unified international role representing the euro area
Euro area treasury/European High Representative for the Economy and Finance
Integration of the ESM and the fiscal compact into EU law
Source: ECB, based on Five Presidents’ Report.
Treaty change could potentially take place under this Commission, opening up avenues for broader institutional reforms. The Commission envisages a Conference on the Future of Europe, starting in 2020 and running for two years, which could result in the revision of EU Treaties. While the remit of such a conference will be decided in cooperation with the European Parliament and the Council, the Commissioner-designate in charge of this dossier has signalled an intention to focus mainly on the issue of democratic participation, which could include giving the European Parliament the right of legislative initiative.153 In response to the Commission’s tabling of this suggestion, France and Germany published a joint paper on 25 November 2019 outlining their views on the remit and process for such an intergovernmental conference.154
3 Conclusions
The new European legislature will be able to build on the significant steps that were taken to improve EMU architecture in the previous decade. The establishment of the European Stability Mechanism, the reforming of fiscal rules and the establishment of the macroeconomic imbalance procedure all helped to address fault lines exposed by the crisis. The subsequent introduction of the Single Supervisory Mechanism and the Single Resolution Mechanism then delivered two of the three pillars of the banking union.
Nevertheless, the agenda that was proposed in the Five Presidents’ Report has yet to be fully implemented, with outstanding measures in the financial, fiscal, economic and political domains. There is no room for complacency when it comes to making EMU better able to withstand adverse shocks. Private and public debt remain elevated in many countries, private and public risk sharing are still more limited
153. See Commissioner-designate Dubravka Šuica's hearing before the European Parliament's Committee
on Constitutional Affairs. 154. See https://www.politico.eu/wp-content/uploads/2019/11/Conference-on-the-Future-of-Europe.pdf

Ekonomski bilten ECB, številka 2 / 2020
117
in the euro area than they are in other monetary unions, and mechanisms aimed at ensuring resilient policies at national level could be strengthened further.
The first priority is the need to complete the banking union. An unfinished banking union will prevent the euro area and its citizens from reaping the full benefits when it comes to market integration and the uniform protection of depositors. There is, however, some momentum in this regard, which should be seized upon in order to pursue a package of measures in parallel:
• Establish a European Deposit Insurance Scheme: The establishment of a fully fledged EDIS should be the key priority, as it is the main element that is missing in terms of completing the banking union. In the short to medium term, a common deposit insurance scheme could be set up on the basis of a hybrid model, relying on existing national schemes and a central fund, with loss coverage gradually increasing over the next five years. However, the end goal should be an EDIS with full loss and liquidity coverage, in order to ensure uniform protection of covered deposits.
• Harmonise national bank insolvency procedures at European level: Bank insolvency frameworks continue to vary across countries, potentially giving rise to very significant differences in terms of outcomes. Taking the US Federal Deposit Insurance Corporation (FDIC) as a model, a harmonised liquidation framework should be established, and the Single Resolution Board should be given the tools needed to oversee the orderly liquidation of banks (especially in the case of small and medium-sized banks which are not subject to resolution).
• Remove impediments to the free flow of capital and liquidity: In order to protect domestic bank balance sheets against adverse shocks, capital and liquidity should be allowed to flow freely within EMU (including within cross -border banking groups). Striking a balance between the interests of financial integration and financial stability will be crucial in order to remove those impediments within the euro area.
• Recognise that the regulatory treatment of sovereign exposures and the development of a common euro area safe asset can be two additional mutually supportive aspects of the deepening of EMU: Work on a sound and prudent design for each concept should continue independently. The introduction of RTSE needs to take into account financial stability considerations and reinforces the case for ensuring sufficient availability of safe assets for the liquidity and risk management of financial institutions. At the same time, the creation of a common euro area safe asset, if so decided by Member States, should be pursued in a way that does not undermine incentives for sound national fiscal policies. That common safe asset will also be conducive to the smooth conduct of monetary policy. Together with RTSE, it will also contribute to the safety and soundness of banks, as well as contributing indirectly to the strengthening of the international role of the euro.
• Close the gap in terms of the provision of liquidity to banks in resolution: A European-level guarantee promising access to Eurosystem liquidity for banks in

Ekonomski bilten ECB, številka 2 / 2020
118
resolution would bring the euro area into line with other major jurisdictions such as the United Kingdom and the United States.
• Improve Europe’s anti-money laundering (AML) framework: The existing AML Directive should be turned into a regulation, establishing an effective European toolkit combating money laundering. An EU body outside the ECB should be given responsibility for AML tasks and could be equipped with direct supervisory powers.
A second priority is the development of a European capital market, which is vital in order to improve private risk sharing and is an area that remains underdeveloped. The European Commission and its High-Level Forum looking at the CMU are expected to make proposals on this issue in early 2020. Those proposals will need to show renewed ambition in order to drive the CMU project forward, particularly as regards the following:
• Fostering supervisory convergence: A genuine CMU will need to have a single capital market supervisor at European level, with a level playing field not only in terms of regulation, but also as regards supervisory practices and their application across the EU.
• Harmonising products and standards: Capital market products and standards should be harmonised, with a Pan-European Pension Product and common standards for securitisation, fintech and green bonds, for example.
• Convergence of framework conditions: In order to create a landscape conducive to vibrant capital markets, the EU requires greater convergence of framework conditions with a bearing on the CMU, such as tax and insolvency frameworks.
A third priority is the need to improve the euro area’s fiscal architecture, which has not entirely delivered as intended. The current fiscal rules do not do enough to ensure the achievement of sound and sustainable fiscal positions in economic good times. The resulting lack of fiscal space in bad times may then entail a need for procyclical fiscal tightening, which may render the macroeconomic policy mix inappropriate at the euro area level. Going forward, there is therefore a need for the following:
• Reforms to fiscal rules to make them simpler, more effective and less procyclical: There is a fairly broadly based consensus in both academia and policy institutions that it would be beneficial to move towards a framework with a single indicator (e.g. an expenditure rule) with links to a debt anchor. The ongoing review of the two-pack and the six-pack represents an opportunity to reassess the effectiveness of the SGP framework.
• Creation of a central fiscal capacity for the euro area for the purposes of macroeconomic stabilisation: The existing rules are not conducive to the establishment of a euro area-wide fiscal policy stance that could complement monetary policy, particularly at the effective lower bound. A central budgetary
Ekonomski bilten ECB, številka 2 / 2020
119
function of this kind would help to increase the euro area’s resilience when facing severe economic crises.
A fourth priority is the need to improve the resilience of national economic structures. The implementation of structural reforms to increase the resilience of labour and product markets, as well as institutions, has waned in recent years. Two different avenues can be leveraged in order to address this:
• Use the macroeconomic imbalance procedure more effectively: Existing means of coordinating economic policy – including the excessive imbalance procedure – should be applied more effectively.
• Deepen the Single Market: Europe is increasingly shifting from the production of goods to the provision of services – an area where the Single Market is not as well developed (partly as a result of shortcomings in terms of the implementation of the Services Directive). Consequently, there are still many national regulations governing the delivery of different types of service in the various Member States. With that in mind, the Commission should place renewed emphasis on initiatives aimed at deepening the Single Market, reaping the benefits of its proven track record of boosting economic growth. In parallel, it could explore the possibility of broadening the scope of the Single Market in areas where reform efforts have lost momentum (e.g. as regards conditions for doing business).
Progress in these outstanding areas will support the effectiveness of the single monetary policy and banking supervision and help to preserve financial stability. Sound countercyclical fiscal policies, completion of the banking union, sufficient financial resilience and cross-border private and public risk sharing are all important to the ECB in order to allow for more effective transmission of monetary policy with fewer side effects, enhance the alignment of euro area business cycles, complement monetary policy, give European banking supervision greater traction and safeguard financial stability.

S1ECB Ekonomski bilten, številka 2 / 2020 - Statistični podatki
Statistični podatki
Kazalo
1 Gibanja zunaj euroobmočja S2
2 Finančna gibanja S3
3 Gospodarska aktivnost S8
4 Cene in stroški S14
5 Denarna statistika S18
6 Državne finance S23
Dodatne informacije
Statistični podatki ECB so dostopni na spletni povezavi Statistical Data Warehouse (SDW): http://sdw.ecb.europa.eu/
Podatki v razdelku ekonomskega biltena z naslovom »Statistični podatki« so dostopni tudi na spletnem mestu SDW: http://sdw.ecb.europa.eu/reports.do?node=1000004813
Podrobnejše statistično poročilo je na spletnem metu SDW: http://sdw.ecb.europa.eu/reports.do?node=1000004045
Metodologije so opredeljene v razdelku »Splošne opombe« statističnega poročila: http://sdw.ecb.europa.eu/reports.do?node=10000023
Podrobnosti o izračunih so v razdelku »Tehnične opombe« statističnega poročila: http://sdw.ecb.europa.eu/reports.do?node=10000022
Strokovni izrazi in kratice so pojasnjeni v statističnem glosarju ECB: http://www.ecb.europa.eu/home/glossary/html/glossa.en.html
Konvencionalni znaki v tabelah
- podatki ne obstajajo/podatki se ne uporabljajo
. podatki še niso na voljo
... nič ali zanemarljivo
(p) začasno

S2ECB Ekonomski bilten, številka 2 / 2020 - Statistični podatki
1 Gibanja zunaj euroobmočja
1.2 Glavne trgovinske partnerice, indeks vodij nabave PMI in svetovna trgovinska menjava
Ankete med gospodarstveniki (difuzijski indeksi; desezonirano) Uvoz blaga1)
Sestavljeni indeks vodij nabave PMI Svetovni indeks vodij nabave PMI2)
Svet2) ZDA Združeno kraljestvo
Japonska Kitajska Zaznamek: Euroobmočje
Predelovalne dejavnosti
Storitve Nova izvozna naročila
Svet Industrijs-ke države
Nastajajoča tržna gos-podarstva
1 2 3 4 5 6 7 8 9 10 11 122017 53,2 54,3 54,7 52,5 51,8 56,4 53,8 53,8 52,8 5,8 3,1 7,62018 53,4 55,0 53,3 52,1 52,3 54,6 53,1 53,8 50,8 4,4 3,1 5,32019 51,7 52,5 50,2 50,5 51,8 51,3 50,3 52,2 48,8 -0,5 0,3 -1,02019 I 52,8 54,8 50,6 50,6 51,5 51,5 50,9 53,4 49,6 -0,8 -0,1 -1,3
II 51,5 51,8 50,5 50,8 51,6 51,8 50,4 51,8 49,4 -0,6 -1,2 -0,2III 51,4 51,4 50,1 51,3 51,4 51,2 50,4 51,7 48,5 1,4 1,6 1,2IV 51,3 51,9 49,5 49,2 52,6 50,7 51,3 51,4 49,6 -0,7 -3,1 0,9
2019 sep. 51,2 51,0 49,3 51,5 51,9 50,1 50,9 51,3 48,6 1,4 1,6 1,2okt. 50,8 50,9 50,0 49,1 52,0 50,6 51,1 50,7 49,6 1,3 0,3 1,9nov. 51,6 52,0 49,3 49,8 53,2 50,6 51,7 51,6 49,5 0,1 -1,7 1,3dec. 51,6 52,7 49,3 48,6 52,6 50,9 51,2 51,8 49,5 -0,7 -3,1 0,9
2020 jan. 52,4 53,3 53,3 50,1 51,9 51,3 51,3 52,8 49,5 . . .feb. 45,0 49,6 53,0 47,0 27,5 51,6 42,6 45,8 44,5 . . .
Viri: Markit (stolpci 1–9); CPB Netherlands Bureau for Economic Policy Analysis in izračuni ECB (stolpci 10–12).1) »Svet« in »»industrijske države« brez euroobmočja. Letni in četrtletni podatki kot sprememba v odstotkih v primerjavi s predhodnim obdobjem; mesečni podatki kot sprememba
v odstotkih v primerjavi s trimesečnim povprečjem. Vsi podatki so desezonirani.2) Brez euroobmočja.
1.1 Glavne trgovinske partnerice, BDP in CPI (indeks cen življenjskih potrebščin)
BDP1) (spremembe v odstotkih glede na predhodno obdobje)
CPI (letne spremembe v odstotkih)
G 20 ZDA Združeno kraljestvo
Japonska Kitajska Zaznamek: Euroobmočje
Države OECD ZDA Združeno kraljestvo
(HICP)
Japonska Kitajska Zaznamek: Euroobmočje2)
(HCPI)Skupaj Brez živil in
energentov1 2 3 4 5 6 7 8 9 10 11 12 13
2017 3,9 2,4 1,9 2,2 6,8 2,5 2,3 1,9 2,1 2,7 0,5 1,6 1,52018 3,7 2,9 1,3 0,3 6,6 1,9 2,6 2,1 2,4 2,5 1,0 2,1 1,82019 . . 1,4 0,7 6,1 1,2 2,0 2,2 1,8 1,8 0,5 2,9 1,22019 I 0,8 0,8 0,6 0,5 1,4 0,5 2,2 2,2 1,6 1,9 0,3 1,8 1,4
II 0,7 0,5 -0,1 0,6 1,6 0,1 2,3 2,2 1,8 2,0 0,8 2,6 1,4III 0,7 0,5 0,5 0,0 1,4 0,3 1,9 2,2 1,8 1,8 0,3 2,9 1,0IV . 0,5 0,0 -1,8 1,5 0,1 1,8 2,1 2,0 1,4 0,5 4,3 1,0
2019 sep. - - - - - - 1,6 2,1 1,7 1,7 0,2 3,0 0,8okt. - - - - - - 1,6 2,0 1,8 1,5 0,2 3,8 0,7nov. - - - - - - 1,8 2,1 2,1 1,5 0,5 4,5 1,0dec. - - - - - - 2,1 2,1 2,3 1,3 0,8 4,5 1,3
2020 jan. - - - - - - 2,3 2,1 2,5 1,8 0,7 5,4 1,4feb.3) - - - - - - . . . . . . 1,2
Viri: Eurostat (stolpci 3, 6, 10, 13); BIS (stolpci 9, 11, 12); OECD (stolpci 1, 2, 4, 5, 7, 8).1) Četrtletni podatki so desezonirani; letni podatki niso desezonirani.2) Podatki se nanašajo na spreminjajočo se sestavo euroobmočja.3) Podatek za euroobmočje je ocena na podlagi začasnih nacionalnih podatkov in prvih informacij o cenah energentov.
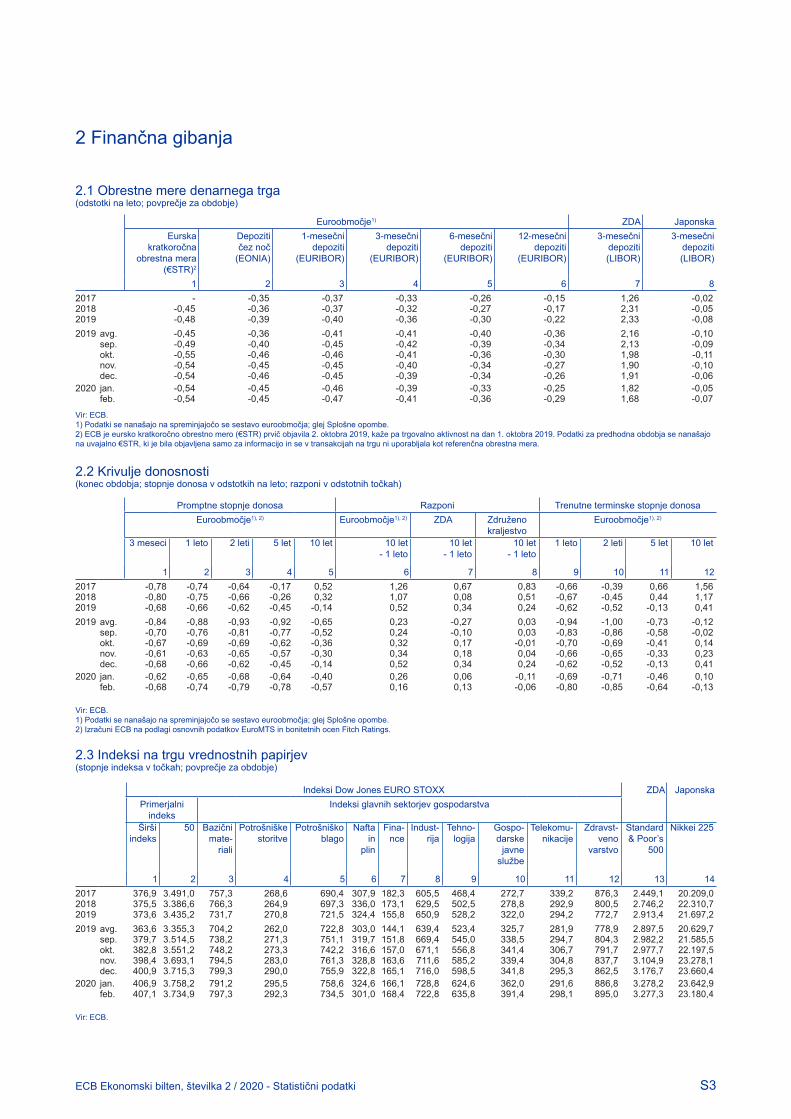
S3ECB Ekonomski bilten, številka 2 / 2020 - Statistični podatki
2 Finančna gibanja
2.1 Obrestne mere denarnega trga(odstotki na leto; povprečje za obdobje)
Vir: ECB.1) Podatki se nanašajo na spreminjajočo se sestavo euroobmočja; glej Splošne opombe.2) ECB je eursko kratkoročno obrestno mero (€STR) prvič objavila 2. oktobra 2019, kaže pa trgovalno aktivnost na dan 1. oktobra 2019. Podatki za predhodna obdobja se nanašajo na uvajalno €STR, ki je bila objavljena samo za informacijo in se v transakcijah na trgu ni uporabljala kot referenčna obrestna mera.
Euroobmočje1) ZDA JaponskaEurska
kratkoročna obrestna mera
(€STR)2
Depoziti čez noč
(EONIA)
1-mesečni depoziti
(EURIBOR)
3-mesečni depoziti
(EURIBOR)
6-mesečni depoziti
(EURIBOR)
12-mesečni depoziti
(EURIBOR)
3-mesečni depoziti (LIBOR)
3-mesečni depoziti (LIBOR)
1 2 3 4 5 6 7 82017 - -0,35 -0,37 -0,33 -0,26 -0,15 1,26 -0,022018 -0,45 -0,36 -0,37 -0,32 -0,27 -0,17 2,31 -0,052019 -0,48 -0,39 -0,40 -0,36 -0,30 -0,22 2,33 -0,082019 avg. -0,45 -0,36 -0,41 -0,41 -0,40 -0,36 2,16 -0,10
sep. -0,49 -0,40 -0,45 -0,42 -0,39 -0,34 2,13 -0,09okt. -0,55 -0,46 -0,46 -0,41 -0,36 -0,30 1,98 -0,11nov. -0,54 -0,45 -0,45 -0,40 -0,34 -0,27 1,90 -0,10dec. -0,54 -0,46 -0,45 -0,39 -0,34 -0,26 1,91 -0,06
2020 jan. -0,54 -0,45 -0,46 -0,39 -0,33 -0,25 1,82 -0,05feb. -0,54 -0,45 -0,47 -0,41 -0,36 -0,29 1,68 -0,07
2.2 Krivulje donosnosti(konec obdobja; stopnje donosa v odstotkih na leto; razponi v odstotnih točkah)
Vir: ECB.1) Podatki se nanašajo na spreminjajočo se sestavo euroobmočja; glej Splošne opombe.2) Izračuni ECB na podlagi osnovnih podatkov EuroMTS in bonitetnih ocen Fitch Ratings.
Promptne stopnje donosa Razponi Trenutne terminske stopnje donosaEuroobmočje1), 2) Euroobmočje1), 2) ZDA Združeno
kraljestvoEuroobmočje1), 2)
3 meseci 1 leto 2 leti 5 let 10 let 10 let- 1 leto
10 let- 1 leto
10 let- 1 leto
1 leto 2 leti 5 let 10 let
1 2 3 4 5 6 7 8 9 10 11 122017 -0,78 -0,74 -0,64 -0,17 0,52 1,26 0,67 0,83 -0,66 -0,39 0,66 1,562018 -0,80 -0,75 -0,66 -0,26 0,32 1,07 0,08 0,51 -0,67 -0,45 0,44 1,172019 -0,68 -0,66 -0,62 -0,45 -0,14 0,52 0,34 0,24 -0,62 -0,52 -0,13 0,412019 avg. -0,84 -0,88 -0,93 -0,92 -0,65 0,23 -0,27 0,03 -0,94 -1,00 -0,73 -0,12
sep. -0,70 -0,76 -0,81 -0,77 -0,52 0,24 -0,10 0,03 -0,83 -0,86 -0,58 -0,02okt. -0,67 -0,69 -0,69 -0,62 -0,36 0,32 0,17 -0,01 -0,70 -0,69 -0,41 0,14nov. -0,61 -0,63 -0,65 -0,57 -0,30 0,34 0,18 0,04 -0,66 -0,65 -0,33 0,23dec. -0,68 -0,66 -0,62 -0,45 -0,14 0,52 0,34 0,24 -0,62 -0,52 -0,13 0,41
2020 jan. -0,62 -0,65 -0,68 -0,64 -0,40 0,26 0,06 -0,11 -0,69 -0,71 -0,46 0,10feb. -0,68 -0,74 -0,79 -0,78 -0,57 0,16 0,13 -0,06 -0,80 -0,85 -0,64 -0,13
2.3 Indeksi na trgu vrednostnih papirjev(stopnje indeksa v točkah; povprečje za obdobje)
Vir: ECB.
Indeksi Dow Jones EURO STOXX ZDA Japonska Primerjalni
indeksIndeksi glavnih sektorjev gospodarstva
Širši indeks
50 Bazični mate-
riali
Potrošniške storitve
Potrošniško blago
Nafta in
plin
Fina-nce
Indust-rija
Tehno-logija
Gospo-darske
javne službe
Telekomu-nikacije
Zdravst-veno
varstvo
Standard & Poor’s
500
Nikkei 225
1 2 3 4 5 6 7 8 9 10 11 12 13 142017 376,9 3.491,0 757,3 268,6 690,4 307,9 182,3 605,5 468,4 272,7 339,2 876,3 2.449,1 20.209,02018 375,5 3.386,6 766,3 264,9 697,3 336,0 173,1 629,5 502,5 278,8 292,9 800,5 2.746,2 22.310,72019 373,6 3.435,2 731,7 270,8 721,5 324,4 155,8 650,9 528,2 322,0 294,2 772,7 2.913,4 21.697,22019 avg. 363,6 3.355,3 704,2 262,0 722,8 303,0 144,1 639,4 523,4 325,7 281,9 778,9 2.897,5 20.629,7
sep. 379,7 3.514,5 738,2 271,3 751,1 319,7 151,8 669,4 545,0 338,5 294,7 804,3 2.982,2 21.585,5okt. 382,8 3.551,2 748,2 273,3 742,2 316,6 157,0 671,1 556,8 341,4 306,7 791,7 2.977,7 22.197,5nov. 398,4 3.693,1 794,5 283,0 761,3 328,8 163,6 711,6 585,2 339,4 304,8 837,7 3.104,9 23.278,1dec. 400,9 3.715,3 799,3 290,0 755,9 322,8 165,1 716,0 598,5 341,8 295,3 862,5 3.176,7 23.660,4
2020 jan. 406,9 3.758,2 791,2 295,5 758,6 324,6 166,1 728,8 624,6 362,0 291,6 886,8 3.278,2 23.642,9feb. 407,1 3.734,9 797,3 292,3 734,5 301,0 168,4 722,8 635,8 391,4 298,1 895,0 3.277,3 23.180,4

S4ECB Ekonomski bilten, številka 2 / 2020 - Statistični podatki
2 Finančna gibanja
Vloge Revolving posojila
in okvirna posojila
Druga posojila (po obsegu in začetni fiksni obrestni meri) Sestavljeni indeks
stroškov izposojanja
Čez noč Vezane do 250.000 EUR nad 250.000 EUR do 1 mili-jona EUR
nad 1 milijon EUR
do 2 let nad 2 leti
spre-menljiva obrestna mera oz. fiksna do
3 mesecev
nad 3 mesece
in do 1 leta
nad 1 leto
spre-menljiva obrestna mera oz. fiksna do
3 mesecev
nad 3 mesece
in do 1 leta
nad 1 leto
spre-menljiva obrestna mera oz. fiksna do
3 mesecev
nad 3 mesece
in do 1 leta
nad 1 leto
1 2 3 4 5 6 7 8 9 10 11 12 13 142019 feb. 0,03 0,03 0,52 2,21 2,15 2,41 2,33 1,65 1,64 1,69 1,13 1,39 1,56 1,64
mar. 0,03 0,07 0,62 2,17 2,17 2,38 2,30 1,66 1,58 1,68 1,19 1,36 1,57 1,65apr. 0,03 0,06 0,54 2,19 2,19 2,36 2,26 1,67 1,60 1,64 1,16 1,33 1,44 1,62maj 0,03 0,04 0,46 2,14 2,18 2,38 2,29 1,66 1,59 1,63 1,09 1,17 1,50 1,57jun. 0,03 0,03 0,57 2,17 2,13 2,33 2,25 1,63 1,55 1,56 1,09 1,28 1,39 1,55jul. 0,03 0,04 0,56 2,11 2,07 2,50 2,20 1,66 1,57 1,54 1,16 1,32 1,39 1,56avg. 0,03 -0,04 0,54 2,08 2,07 2,36 2,19 1,64 1,59 1,53 1,06 1,32 1,40 1,52sep. 0,03 -0,05 0,88 2,16 2,03 2,25 2,15 1,61 1,51 1,44 1,10 1,26 1,29 1,54okt. 0,02 -0,03 0,44 2,08 2,01 2,41 2,11 1,61 1,54 1,40 1,14 1,40 1,27 1,56nov. 0,02 -0,04 0,39 2,06 2,02 2,36 2,13 1,59 1,55 1,41 1,14 1,34 1,29 1,55dec. 0,01 0,00 0,42 2,09 2,00 2,28 2,08 1,58 1,54 1,39 1,26 1,21 1,37 1,55
2020 jan.(p) 0,01 -0,06 0,33 2,09 2,17 2,32 2,11 1,63 1,57 1,45 1,11 1,23 1,28 1,55
2.5 Obrestne mere DFI za posojila in vloge nefinančnih družb (novi posli)1), 2)
(odstotki na leto; kot povprečje obdobja, razen če ni navedeno drugače)
Vir: ECB.1) Podatki se nanašajo na spreminjajočo se sestavo euroobmočja.2) Skladno z ESR 2010 se holdingi nefinančnih skupin od decembra 2014 ne uvrščajo več v sektor nefinančnih družb, temveč v sektor finančnih družb.
Vloge Revolving posojila
in okvirna posojila
Ob-restova-
ni dolg po
kreditni kartici
Potrošniška posojila Posojila samostoj-nim pod-
jetnikom in neinkor-
poriranim partnerst-
vom
Stanovanjska posojilaČez noč
Na odpoklic
z dobo odpok-
lica do 3
mesecev
Vezane Po začetni fiksni obrestni
meri
Letni odstotek
stroškov3)
Po začetni fiksni obrestni meri Letni odstotek
stroškov3)
Ses-tavljeni indeks
stroškov izposo-
janja
do 2 let
nad 2 leti
spre-menljiva
obrest-na mera oz. fiks-
na do 1 leta
nad 1 leto
spre-menljiva obrestna mera oz.
fiksna do 1 leta
nad 1 leto in do 5 let
nad 5 let
in do 10 let
nad 10 let
1 2 3 4 5 6 7 8 9 10 11 12 13 14 15 162019 feb. 0,03 0,43 0,32 0,70 5,97 16,61 5,28 5,71 6,27 2,41 1,58 1,85 1,87 1,84 2,09 1,80
mar. 0,03 0,41 0,30 0,76 5,90 16,65 5,41 5,61 6,17 2,36 1,59 1,82 1,83 1,81 2,06 1,78apr. 0,03 0,41 0,32 0,75 5,88 16,66 5,56 5,63 6,19 2,36 1,59 1,78 1,77 1,77 2,02 1,75maj 0,03 0,44 0,31 0,79 5,81 16,67 5,61 5,76 6,34 2,33 1,57 1,80 1,73 1,74 1,99 1,72jun. 0,03 0,44 0,32 0,82 5,81 16,63 5,42 5,67 6,24 2,31 1,55 1,74 1,67 1,65 1,95 1,67jul. 0,03 0,43 0,31 0,80 5,75 16,58 5,74 5,73 6,30 2,34 1,55 1,72 1,59 1,57 1,90 1,61avg. 0,03 0,43 0,28 0,78 5,75 16,60 6,15 5,75 6,35 2,25 1,51 1,69 1,54 1,50 1,84 1,56sep. 0,03 0,43 0,27 0,78 5,82 16,61 5,65 5,61 6,17 2,22 1,46 1,65 1,49 1,43 1,77 1,48okt. 0,03 0,42 0,24 0,83 5,70 16,63 5,89 5,55 6,19 2,26 1,45 1,59 1,44 1,39 1,74 1,44nov. 0,03 0,42 0,23 0,73 5,61 16,64 5,36 5,53 6,25 2,21 1,43 1,59 1,61 1,48 1,80 1,47dec. 0,03 0,42 0,22 0,80 5,58 16,70 5,44 5,28 5,89 2,09 1,46 1,58 1,43 1,39 1,75 1,41
2020 jan.(p) 0,02 0,42 0,27 0,73 5,62 16,70 5,63 5,69 6,25 2,21 1,46 1,52 1,43 1,42 1,73 1,44
2.4 Obrestne mere DFI za posojila in vloge gospodinjstev (novi posli)1), 2)
(odstotki na leto; kot povprečje obdobja, razen če ni navedeno drugače)
Vir: ECB.1) Podatki se nanašajo na spreminjajočo se sestavo euroobmočja.2) Vključno z nepridobitnimi institucijami, ki opravljajo storitve za gospodinjstva.3) Letna odstotna stopnja stroškov.

S5ECB Ekonomski bilten, številka 2 / 2020 - Statistični podatki
2 Finančna gibanja
2.6 Vrednostni papirji razen delnic, ki so jih izdali rezidenti euroobmočja, s členitvijo po sektorju izdajatelja in prvotni dospelosti(v milijardah EUR; transakcije v mesecu in stanja na koncu obdobja; nominalna vrednost)
Stanja Bruto izdaje1)
Skupaj DFI (vključno z Eurosistemom)
Družbe, ki niso DFI Širše opredeljena država
Skupaj DFI (vključno z Eurosistemom)
Družbe, ki niso DFI Širše opredeljena država
Finančne družbe, ki niso
DFI
Nefinančne družbe
Enote central-ne ravni
države
Ostala država
Finančne družbe, ki
niso DFI
Nefinančnedružbe
Enote central-ne ravni
države
Ostala država
FVC FVC1 2 3 4 5 6 7 8 9 10 11 12 13 14
Kratkoročne2017 1.240 519 155 . 70 438 57 367 167 54 . 37 79 312018 1.217 504 170 . 72 424 47 389 171 66 . 41 76 352019 1.274 550 172 . 84 406 61 414 177 80 . 47 73 382019 avg. 1.371 587 184 . 112 424 63 414 180 85 . 39 71 38
sep. 1.392 597 185 . 105 439 66 412 156 88 . 48 81 41okt. 1.352 579 174 . 106 424 69 421 184 65 . 52 75 45nov. 1.337 570 173 . 102 425 66 374 148 77 . 44 75 30dec. 1.274 550 172 . 84 406 61 318 112 89 . 37 45 35
2020 jan. 1.358 595 169 . 99 422 73 495 206 75 . 56 100 57Dolgoročne
2017 15.353 3.560 3.060 . 1.223 6.866 643 247 66 73 . 18 83 72018 15.744 3.688 3.161 . 1.247 7.022 627 228 64 68 . 15 75 62019 16.319 3.820 3.401 . 1.320 7.152 626 247 69 74 . 20 78 72019 avg. 16.195 3.784 3.278 . 1.293 7.200 639 128 24 50 . 8 41 6
sep. 16.270 3.805 3.312 . 1.319 7.200 634 284 82 91 . 34 74 4okt. 16.223 3.802 3.328 . 1.316 7.153 623 274 61 97 . 24 85 6nov. 16.369 3.833 3.406 . 1.329 7.172 628 275 63 109 . 26 71 6dec. 16.319 3.820 3.401 . 1.320 7.152 626 162 58 65 . 14 24 2
2020 jan. 16.404 3.857 3.408 . 1.324 7.190 625 321 118 68 . 16 110 10Vir: ECB.1) Za namene primerjave se letni podatki nanašajo na mesečno povprečje v danem letu.
2.7 Stopnje rasti in stanja vrednostnih papirjev razen delnic in delnic, ki kotirajo na borzi(v milijardah EUR; spremembe v odstotkih)
Vir: ECB.
Vrednostni papirji razen delnic Delnice, ki kotirajo na borziSkupaj DFI (vključno z
Eurosistemom)Družbe, ki niso DFI Širše opredeljena država Skupaj DFI Finančne
družbe, ki niso DFI
Nefinančne družbeFinančne družbe, ki
niso DFINefinančne
družbeEnote centralne
ravni državeOstala država
FVC1 2 3 4 5 6 7 8 9 10 11
Stanje2017 16.593,4 4.079,9 3.214,9 . 1.293,1 7.304,7 700,8 7.963,3 612,5 1.258,3 6.092,62018 16.961,2 4.192,8 3.330,5 . 1.318,7 7.445,8 673,4 7.033,1 465,0 1.108,9 5.459,22019 17.592,9 4.369,8 3.573,5 . 1.404,9 7.558,3 686,4 8.604,3 546,0 1.410,7 6.647,62019 avg. 17.566,2 4.371,4 3.462,5 . 1.405,7 7.624,6 702,0 7.849,5 462,4 1.204,6 6.182,4
sep. 17.662,3 4.401,9 3.496,9 . 1.424,2 7.639,5 699,8 8.190,9 496,1 1.356,9 6.337,9okt. 17.574,4 4.380,9 3.501,7 . 1.421,6 7.577,4 692,8 8.265,6 508,2 1.369,0 6.388,3nov. 17.705,2 4.402,8 3.579,5 . 1.431,2 7.597,7 693,9 8.511,9 524,1 1.401,7 6.586,2dec. 17.592,9 4.369,8 3.573,5 . 1.404,9 7.558,3 686,4 8.604,3 546,0 1.410,7 6.647,6
2020 jan. 17.761,7 4.451,8 3.577,1 . 1.423,7 7.611,9 697,3 8.486,9 525,3 1.391,4 6.570,2Stopnja rasti
2017 1,3 -0,5 0,1 . 6,0 2,2 0,4 1,0 6,1 2,8 0,22018 1,9 1,7 3,0 . 3,3 1,9 -4,3 0,7 0,3 2,4 0,42019 3,1 3,8 5,1 . 5,6 1,5 1,8 0,0 0,5 -0,1 0,02019 avg. 3,2 4,9 3,1 . 5,3 2,2 1,6 -0,1 0,4 -0,1 -0,1
sep. 3,1 4,3 3,6 . 5,0 1,8 3,1 -0,1 0,4 -0,1 -0,1okt. 2,9 3,9 4,0 . 5,2 1,5 1,3 -0,1 0,4 -0,1 -0,2nov. 3,0 3,9 4,8 . 6,3 1,3 1,6 -0,1 0,4 0,0 -0,2dec. 3,1 3,8 5,1 . 5,6 1,5 1,8 0,0 0,5 -0,1 0,0
2020 jan. 3,1 4,1 5,1 . 5,7 1,4 2,0 0,0 0,5 -0,1 0,0

S6ECB Ekonomski bilten, številka 2 / 2020 - Statistični podatki
2 Finančna gibanja
2.8 Efektivni devizni tečaji1)
(povprečja obdobij; indeks: 1999 I = 100)
Vir: ECB.1) Opredelitev skupin trgovskih partneric in druge informacije najdete v Splošnih opombah statističnega poročila.
Efektivni devizni tečaj-19 Efektivni devizni tečaj-38Nominalni Realni CPI Realni PPI Deflator
realnega BDPRealni ULCM Realni ULCT Nominalni Realni CPI
1 2 3 4 5 6 7 82017 96,6 91,4 91,9 86,2 79,9 90,3 112,0 90,02018 98,9 93,4 93,4 87,5 80,3 91,3 117,9 93,82019 97,3 91,2 91,8 . . . 116,7 91,52019 I 97,4 91,7 92,1 86,0 79,2 89,2 116,7 92,1
II 97,3 91,4 91,7 85,9 78,6 88,9 116,8 91,8III 97,7 91,4 91,8 86,2 79,7 89,1 116,9 91,5IV 97,0 90,4 91,4 . . . 116,2 90,5
2019 sep. 97,4 91,1 91,7 - - - 116,7 91,2okt. 97,4 90,9 91,7 - - - 116,6 90,9nov. 96,7 90,2 91,1 - - - 116,0 90,3dec. 96,7 90,1 91,4 - - - 116,0 90,2
2020 jan. 96,2 89,3 90,9 - - - 115,5 89,4feb. 95,6 88,7 90,2 - - - 114,9 88,8
% sprememba glede na predhodni mesec2020 feb. -0,6 -0,7 -0,7 - - - -0,5 -0,7
% sprememba glede na predhodno leto2020 feb. -1,8 -3,3 -2,1 - - - -1,5 -3,5
2.9 Dvostranski devizni tečaji(povprečja obdobij; enote nacionalne valute za enoto eura)
Vir: ECB.
Kitajski juan ren-
minbi
Hrvaška kuna
Češka krona
Danska krona
Madžarski forint
Japonski jen
Poljski zlot Britan-ski funt
Romunski leu
Švedska krona
Švicarski frank
Ameriški dolar
1 2 3 4 5 6 7 8 9 10 11 122017 7,629 7,464 26,326 7,439 309,193 126,711 4,257 0,877 4,5688 9,635 1,112 1,1302018 7,808 7,418 25,647 7,453 318,890 130,396 4,261 0,885 4,6540 10,258 1,155 1,1812019 7,735 7,418 25,670 7,466 325,297 122,006 4,298 0,878 4,7453 10,589 1,112 1,1192019 I 7,663 7,422 25,683 7,464 317,907 125,083 4,302 0,873 4,7358 10,419 1,132 1,136
II 7,672 7,418 25,686 7,467 322,973 123,471 4,282 0,875 4,7480 10,619 1,126 1,124III 7,800 7,394 25,734 7,463 328,099 119,323 4,318 0,902 4,7314 10,662 1,096 1,112IV 7,801 7,439 25,577 7,471 331,933 120,323 4,287 0,861 4,7666 10,652 1,096 1,107
2019 sep. 7,832 7,401 25,868 7,463 332,448 118,242 4,353 0,891 4,7381 10,697 1,090 1,100okt. 7,845 7,436 25,689 7,469 331,462 119,511 4,301 0,875 4,7538 10,802 1,098 1,105nov. 7,757 7,440 25,531 7,472 333,617 120,338 4,285 0,858 4,7698 10,650 1,098 1,105dec. 7,797 7,442 25,497 7,472 330,706 121,241 4,273 0,847 4,7779 10,483 1,093 1,111
2020 jan. 7,683 7,443 25,216 7,473 334,380 121,363 4,251 0,849 4,7788 10,554 1,076 1,110feb. 7,630 7,454 25,051 7,471 337,171 120,026 4,277 0,841 4,7837 10,568 1,065 1,091
% sprememba glede na predhodni mesec2020 feb. -0,7 0,2 -0,7 0,0 0,8 -1,1 0,6 -1,0 0,1 0,1 -1,1 -1,8
% sprememba glede na predhodno leto2020 feb. -0,2 0,5 -2,6 0,1 6,1 -4,2 -0,9 -3,6 0,7 0,7 -6,3 -3,9

S7ECB Ekonomski bilten, številka 2 / 2020 - Statistični podatki
2 Finančna gibanja
2.10 Plačilna bilanca euroobmočja, finančni račun(v milijardah EUR, razen če ni navedeno drugače; stanje ob koncu obdobja; transakcije v obdobju)
Vir: ECB.1) Izvedeni finančni instrumenti (neto) so zajeti v terjatvah.
Skupaj1) Neposredne naložbe Portfeljske naložbe Izvedeni finančni
instrumenti (neto)
Ostale naložbe Rezerve Zaznamek: Bruto zunanji
dolgTerjatve Obveznosti Neto Terjatve Obveznosti Terjatve Obveznosti Terjatve Obveznosti
1 2 3 4 5 6 7 8 9 10 11 12Saldo (stanje mednarodnih naložb)
2018 IV 25.405,3 25.871,5 -466,1 10.895,0 8.975,7 8.475,1 10.542,1 -87,9 5.404,0 6.353,6 719,1 14.209,52019 I 26.666,3 26.969,6 -303,3 11.184,9 9.113,4 9.126,6 11.318,5 -91,5 5.705,2 6.537,6 741,1 14.674,3
II 26.804,9 27.085,3 -280,4 11.037,1 9.054,3 9.226,8 11.461,7 -75,4 5.845,6 6.569,3 770,8 14.770,8
III 27.834,1 27.960,6 -126,5 11.405,6 9.344,7 9.612,9 11.906,0 -89,0 6.077,6 6.709,9 827,0 15.089,2
Saldo kot odstotek BDP2019 III 235,5 236,5 -1,1 96,5 79,0 81,3 100,7 -0,8 51,4 56,8 7,0 127,6
Transakcije2019 I 353,3 292,4 60,9 92,0 31,5 58,2 141,4 3,0 197,2 119,6 2,9 -
II 187,0 170,8 16,2 -90,3 12,8 51,2 78,7 34,1 189,3 79,4 2,7 -III 442,2 337,4 104,8 162,5 150,6 146,7 153,0 3,2 128,1 33,8 1,7 -IV -316,3 -479,0 162,7 -85,6 -92,2 86,9 -20,7 -2,7 -314,1 -366,1 -0,7 -
2019 jul. 351,5 320,1 31,4 135,3 138,7 52,5 69,4 11,1 145,5 112,1 7,1 -avg. 17,3 -21,8 39,1 -47,9 -63,0 37,2 17,2 -2,3 29,6 24,0 0,7 -sep. 73,4 39,1 34,3 75,1 75,0 57,0 66,4 -5,6 -46,9 -102,3 -6,2 -okt. 21,4 -42,8 64,2 -11,9 -76,3 43,8 7,0 4,2 -15,6 26,6 1,0 -nov. 27,5 -22,6 50,2 9,8 31,7 29,9 16,7 -1,3 -8,5 -71,0 -2,3 -dec. -365,2 -413,6 48,3 -83,5 -47,5 13,3 -44,3 -5,6 -290,0 -321,8 0,5 -
Skupne 12-mesečne transakcije2019 dec. 666,3 321,6 344,7 78,6 102,7 343,0 352,3 37,6 200,6 -133,4 6,6 -
Skupne 12-mesečne transakcije v odstotkih BDP2019 dec. 5,6 2,7 2,9 0,7 0,9 2,9 3,0 0,3 1,7 -1,1 0,1 -
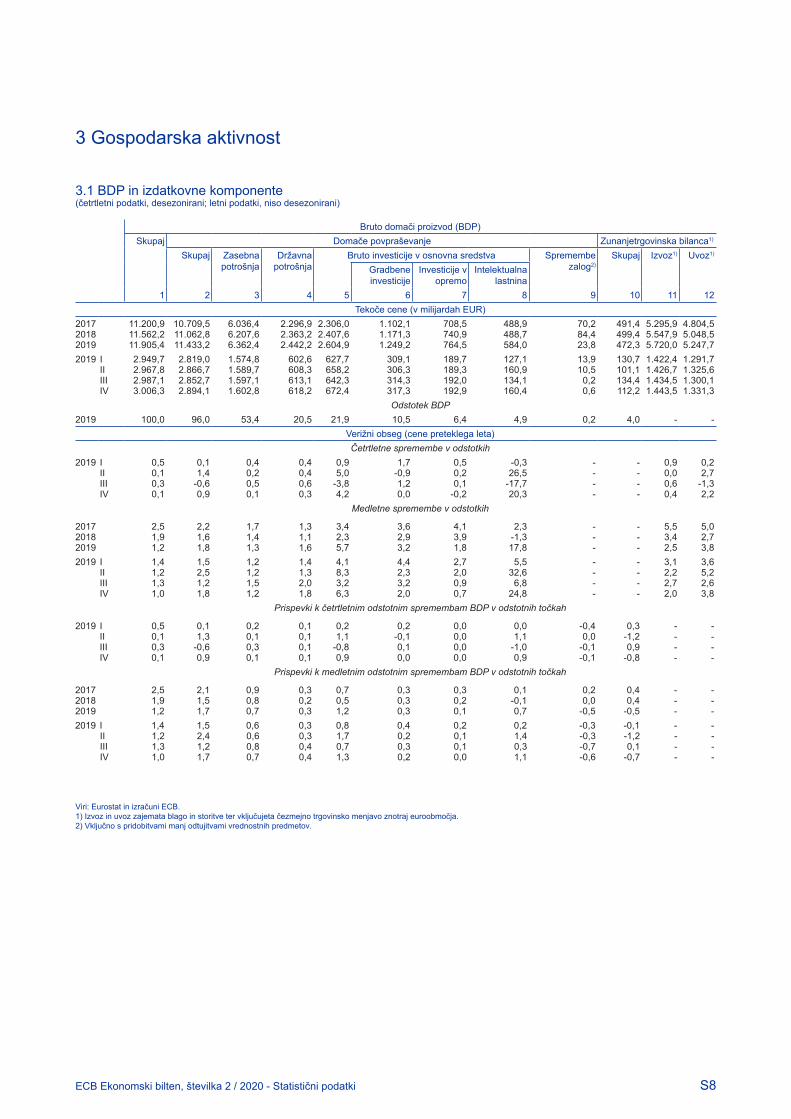
S8ECB Ekonomski bilten, številka 2 / 2020 - Statistični podatki
3 Gospodarska aktivnost
3.1 BDP in izdatkovne komponente(četrtletni podatki, desezonirani; letni podatki, niso desezonirani)
Bruto domači proizvod (BDP)Skupaj Domače povpraševanje Zunanjetrgovinska bilanca1)
Skupaj Zasebna potrošnja
Državna potrošnja
Bruto investicije v osnovna sredstva Spremembe zalog2)
Skupaj Izvoz1) Uvoz1)
Gradbene investicije
Investicije v opremo
Intelektualna lastnina
1 2 3 4 5 6 7 8 9 10 11 12Tekoče cene (v milijardah EUR)
2017 11.200,9 10.709,5 6.036,4 2.296,9 2.306,0 1.102,1 708,5 488,9 70,2 491,4 5.295,9 4.804,52018 11.562,2 11.062,8 6.207,6 2.363,2 2.407,6 1.171,3 740,9 488,7 84,4 499,4 5.547,9 5.048,52019 11.905,4 11.433,2 6.362,4 2.442,2 2.604,9 1.249,2 764,5 584,0 23,8 472,3 5.720,0 5.247,72019 I 2.949,7 2.819,0 1.574,8 602,6 627,7 309,1 189,7 127,1 13,9 130,7 1.422,4 1.291,7
II 2.967,8 2.866,7 1.589,7 608,3 658,2 306,3 189,3 160,9 10,5 101,1 1.426,7 1.325,6III 2.987,1 2.852,7 1.597,1 613,1 642,3 314,3 192,0 134,1 0,2 134,4 1.434,5 1.300,1IV 3.006,3 2.894,1 1.602,8 618,2 672,4 317,3 192,9 160,4 0,6 112,2 1.443,5 1.331,3
Odstotek BDP2019 100,0 96,0 53,4 20,5 21,9 10,5 6,4 4,9 0,2 4,0 - -
Verižni obseg (cene preteklega leta)Četrtletne spremembe v odstotkih
2019 I 0,5 0,1 0,4 0,4 0,9 1,7 0,5 -0,3 - - 0,9 0,2II 0,1 1,4 0,2 0,4 5,0 -0,9 0,2 26,5 - - 0,0 2,7III 0,3 -0,6 0,5 0,6 -3,8 1,2 0,1 -17,7 - - 0,6 -1,3IV 0,1 0,9 0,1 0,3 4,2 0,0 -0,2 20,3 - - 0,4 2,2
Medletne spremembe v odstotkih
2017 2,5 2,2 1,7 1,3 3,4 3,6 4,1 2,3 - - 5,5 5,02018 1,9 1,6 1,4 1,1 2,3 2,9 3,9 -1,3 - - 3,4 2,72019 1,2 1,8 1,3 1,6 5,7 3,2 1,8 17,8 - - 2,5 3,82019 I 1,4 1,5 1,2 1,4 4,1 4,4 2,7 5,5 - - 3,1 3,6
II 1,2 2,5 1,2 1,3 8,3 2,3 2,0 32,6 - - 2,2 5,2III 1,3 1,2 1,5 2,0 3,2 3,2 0,9 6,8 - - 2,7 2,6IV 1,0 1,8 1,2 1,8 6,3 2,0 0,7 24,8 - - 2,0 3,8
Prispevki k četrtletnim odstotnim spremembam BDP v odstotnih točkah
2019 I 0,5 0,1 0,2 0,1 0,2 0,2 0,0 0,0 -0,4 0,3 - -II 0,1 1,3 0,1 0,1 1,1 -0,1 0,0 1,1 0,0 -1,2 - -III 0,3 -0,6 0,3 0,1 -0,8 0,1 0,0 -1,0 -0,1 0,9 - -IV 0,1 0,9 0,1 0,1 0,9 0,0 0,0 0,9 -0,1 -0,8 - -
Prispevki k medletnim odstotnim spremembam BDP v odstotnih točkah
2017 2,5 2,1 0,9 0,3 0,7 0,3 0,3 0,1 0,2 0,4 - -2018 1,9 1,5 0,8 0,2 0,5 0,3 0,2 -0,1 0,0 0,4 - -2019 1,2 1,7 0,7 0,3 1,2 0,3 0,1 0,7 -0,5 -0,5 - -2019 I 1,4 1,5 0,6 0,3 0,8 0,4 0,2 0,2 -0,3 -0,1 - -
II 1,2 2,4 0,6 0,3 1,7 0,2 0,1 1,4 -0,3 -1,2 - -III 1,3 1,2 0,8 0,4 0,7 0,3 0,1 0,3 -0,7 0,1 - -IV 1,0 1,7 0,7 0,4 1,3 0,2 0,0 1,1 -0,6 -0,7 - -
Viri: Eurostat in izračuni ECB.1) Izvoz in uvoz zajemata blago in storitve ter vključujeta čezmejno trgovinsko menjavo znotraj euroobmočja.2) Vključno s pridobitvami manj odtujitvami vrednostnih predmetov.

S9ECB Ekonomski bilten, številka 2 / 2020 - Statistični podatki
3 Gospodarska aktivnost
3.2 Dodana vrednost po gospodarskih dejavnostih(četrtletni podatki, desezonirani; letni podatki, niso desezonirani)
Bruto dodana vrednost (osnovne cene) Davki brez
subvencij za
proizvode
Skupaj Kme-tijstvo,
gozdar-stvo in ribolov
Predeloval-ne dejavnos-
ti, oskrba z elektriko in javne gos-podarske
službe
Grad -beništvo
Trgovina, promet,
skladiščenje in gostinstvo
Informa-cijske in komuni-kacijske
dejavnosti
Finančne in zavaroval-
niške dejavnosti
Poslovanje z nepremični-
nami
Stro-kovne,
poslovne in pod-porne
storitve
Javna uprava, izobraževanje,
zdravstvo in socialno
varstvo
Umetnost, zabava
in druge storitve
1 2 3 4 5 6 7 8 9 10 11 12Tekoče cene (v milijardah EUR)
2017 10.040,0 176,3 1.991,5 503,1 1.909,9 468,8 465,9 1.132,7 1.143,5 1.897,7 350,5 1.160,92018 10.357,6 178,1 2.040,8 537,9 1.968,7 488,6 472,0 1.166,8 1.194,5 1.954,9 355,2 1.204,62019 10.663,3 180,4 2.049,1 579,9 2.031,3 513,6 481,2 1.205,3 1.240,6 2.018,8 363,1 1.242,22019 I 2.643,1 45,0 515,0 142,7 503,1 125,8 118,8 297,8 306,0 498,8 90,0 306,7
II 2.659,5 45,5 512,5 144,0 506,6 128,0 120,0 300,0 309,5 502,4 90,9 308,2III 2.673,3 45,2 511,8 146,0 509,7 128,7 121,0 302,3 311,5 506,0 91,1 313,8IV 2.693,2 44,9 513,3 147,7 512,9 131,2 121,3 305,2 313,9 511,8 91,1 313,1
Odstotek dodane vrednosti2019 100,0 1,7 19,2 5,4 19,0 4,8 4,5 11,3 11,6 18,9 3,4 -
Verižni obseg (cene preteklega leta)Četrtletne spremembe v odstotkih
2019 I 0,5 -0,3 -0,1 1,4 1,0 1,2 0,9 0,5 0,0 0,2 0,6 0,3II 0,1 -0,6 -0,5 -0,3 0,1 0,7 0,9 0,4 0,4 0,2 0,3 0,4III 0,3 0,1 -0,4 0,6 0,3 1,5 0,6 0,4 0,3 0,3 0,1 0,8IV 0,1 0,3 -0,7 -0,2 0,3 1,1 0,2 0,4 0,3 0,4 -0,5 -0,1
Medletne spremembe v odstotkih
2017 2,6 0,7 3,3 2,6 2,9 5,4 1,1 0,6 4,4 1,6 1,5 2,42018 2,0 1,4 1,8 3,3 2,1 4,5 1,4 1,6 3,3 1,0 0,4 1,62019 1,2 -0,5 -1,1 3,0 1,8 4,2 2,1 1,7 1,7 1,1 1,1 1,52019 I 1,4 -0,5 -0,4 4,6 2,0 4,5 1,6 1,5 1,9 1,1 1,0 1,1
II 1,2 -1,0 -1,0 3,1 1,6 4,0 2,1 1,7 1,8 1,1 1,5 1,2III 1,2 -0,1 -1,2 3,1 1,9 3,8 2,1 1,7 1,9 1,1 1,3 2,0IV 1,0 -0,5 -1,7 1,5 1,8 4,5 2,6 1,8 1,1 1,1 0,5 1,5
Prispevki k četrtletnim odstotnim spremembam BDP v odstotnih točkah
2019 I 0,5 0,0 0,0 0,1 0,2 0,1 0,0 0,1 0,0 0,0 0,0 -II 0,1 0,0 -0,1 0,0 0,0 0,0 0,0 0,0 0,1 0,0 0,0 -III 0,3 0,0 -0,1 0,0 0,1 0,1 0,0 0,0 0,0 0,1 0,0 -IV 0,1 0,0 -0,1 0,0 0,1 0,1 0,0 0,0 0,0 0,1 0,0 -
Prispevki k medletnim odstotnim spremembam dodane vrednosti v odstotnih točkah
2017 2,6 0,0 0,7 0,1 0,5 0,2 0,1 0,1 0,5 0,3 0,1 -2018 2,0 0,0 0,4 0,2 0,4 0,2 0,1 0,2 0,4 0,2 0,0 -2019 1,2 0,0 -0,2 0,2 0,3 0,2 0,1 0,2 0,2 0,2 0,0 -2019 I 1,4 0,0 -0,1 0,2 0,4 0,2 0,1 0,2 0,2 0,2 0,0 -
II 1,2 0,0 -0,2 0,2 0,3 0,2 0,1 0,2 0,2 0,2 0,0 -III 1,2 0,0 -0,2 0,2 0,4 0,2 0,1 0,2 0,2 0,2 0,0 -IV 1,0 0,0 -0,3 0,1 0,3 0,2 0,1 0,2 0,1 0,2 0,0 -
Viri: Eurostat in izračuni ECB.

S10ECB Ekonomski bilten, številka 2 / 2020 - Statistični podatki
3 Gospodarska aktivnost
3.3 Zaposlenost1)
(četrtletni podatki, desezonirani; letni podatki, niso desezonirani)
Viri: Eurostat in izračuni ECB.1) Podatki o zaposlenosti temeljijo na ESR 2010.
Skupaj Po statusu zaposlitve
Po gospodarski dejavnosti
Zaposlen Samo-zaposlen
Kmetijstvo, gozdarstvo
in ribolov
Prede-lovalne
dejavnosti, oskrba z
elektriko in javne gos-podarske
službe
Grad-beništvo
Trgovina, promet,
skladiščenje in gostin-
stvo
Informa-cijske in komuni-kacijske
dejavnosti
Finančne in
zavaroval-niške
dejavnosti
Poslo-vanje z nepre-
mičninami
Stro-kovne,
poslovne in podpor-nestoritve
Javna uprava, izobraževanje,
zdravstvo in socialno
varstvo
Umetnost, zabava
in druge storitve
1 2 3 4 5 6 7 8 9 10 11 12 13Število zaposlenih
v odstotkih2017 100,0 85,6 14,4 3,2 14,6 6,0 24,9 2,8 2,5 1,0 13,8 24,3 6,92018 100,0 85,8 14,2 3,1 14,6 6,0 24,9 2,9 2,4 1,0 14,0 24,2 6,82019 100,0 86,0 14,0 3,0 14,6 6,1 24,9 2,9 2,4 1,0 14,0 24,3 6,8
Medletne spremembe v odstotkih2017 1,6 2,0 -0,7 -0,5 1,1 1,4 1,8 3,4 -1,5 1,8 3,7 1,1 1,02018 1,5 1,8 -0,2 -0,3 1,5 2,4 1,4 3,4 -0,9 1,7 2,8 1,2 0,42019 1,2 1,5 -0,2 -1,8 0,8 2,4 1,2 3,8 -0,3 1,3 1,4 1,4 0,72019 I 1,4 1,6 0,3 -0,4 1,3 3,3 1,3 4,2 -0,4 2,5 1,8 1,4 0,2
II 1,3 1,5 -0,1 -3,0 1,0 2,6 1,3 4,2 -0,6 1,7 1,2 1,5 0,7III 1,1 1,4 -0,4 -2,0 0,7 2,2 1,0 3,7 -0,2 0,8 1,3 1,5 0,9IV 1,1 1,4 -0,5 -1,7 0,5 1,6 1,2 3,0 0,2 0,1 1,2 1,4 1,0
Opravljene delovne urev odstotkih
2017 100,0 80,7 19,3 4,3 15,1 6,7 25,8 3,0 2,5 1,0 13,6 21,8 6,22018 100,0 81,0 19,0 4,2 15,0 6,8 25,7 3,0 2,5 1,0 13,8 21,8 6,12019 100,0 81,3 18,7 4,1 14,9 6,8 25,7 3,1 2,4 1,0 13,8 21,9 6,1
Medletne spremembe v odstotkih2017 1,2 1,7 -1,1 -1,1 0,8 1,3 1,3 3,2 -2,0 1,5 3,5 0,5 0,42018 1,4 1,8 -0,3 0,5 1,2 2,7 1,1 3,2 -1,2 2,4 2,8 1,3 0,42019 1,1 1,5 -0,4 -1,4 0,5 2,2 1,0 2,7 -0,1 1,3 1,2 1,8 0,62019 I 1,7 2,0 0,4 0,3 1,3 4,0 1,6 3,4 -0,1 1,7 1,8 1,9 0,6
II 1,0 1,3 -0,6 -3,0 0,4 2,7 0,9 2,8 -0,4 0,9 1,1 1,7 0,3III 0,9 1,3 -0,9 -2,0 0,4 1,6 0,6 2,5 0,0 1,5 0,8 1,8 0,6IV 0,8 1,2 -0,7 -1,1 -0,1 0,6 0,8 2,0 0,0 0,9 0,9 1,7 1,0
Opravljene delovne ure na zaposlenegaMedletne spremembe v odstotkih
2017 -0,4 -0,3 -0,4 -0,6 -0,3 -0,1 -0,5 -0,1 -0,5 -0,3 -0,2 -0,6 -0,52018 -0,1 0,1 -0,1 0,8 -0,2 0,3 -0,3 -0,3 -0,2 0,7 0,0 0,0 0,02019 -0,1 0,0 -0,3 0,4 -0,4 -0,2 -0,3 -1,0 0,2 0,0 -0,2 0,4 -0,12019 I 0,3 0,4 0,1 0,8 0,0 0,7 0,3 -0,7 0,4 -0,8 0,0 0,5 0,3
II -0,3 -0,1 -0,6 -0,1 -0,6 0,0 -0,5 -1,3 0,2 -0,8 -0,1 0,2 -0,4III -0,3 -0,1 -0,5 -0,1 -0,3 -0,6 -0,5 -1,2 0,3 0,8 -0,5 0,4 -0,3IV -0,3 -0,2 -0,2 0,6 -0,6 -1,0 -0,4 -1,0 -0,2 0,7 -0,3 0,3 0,0
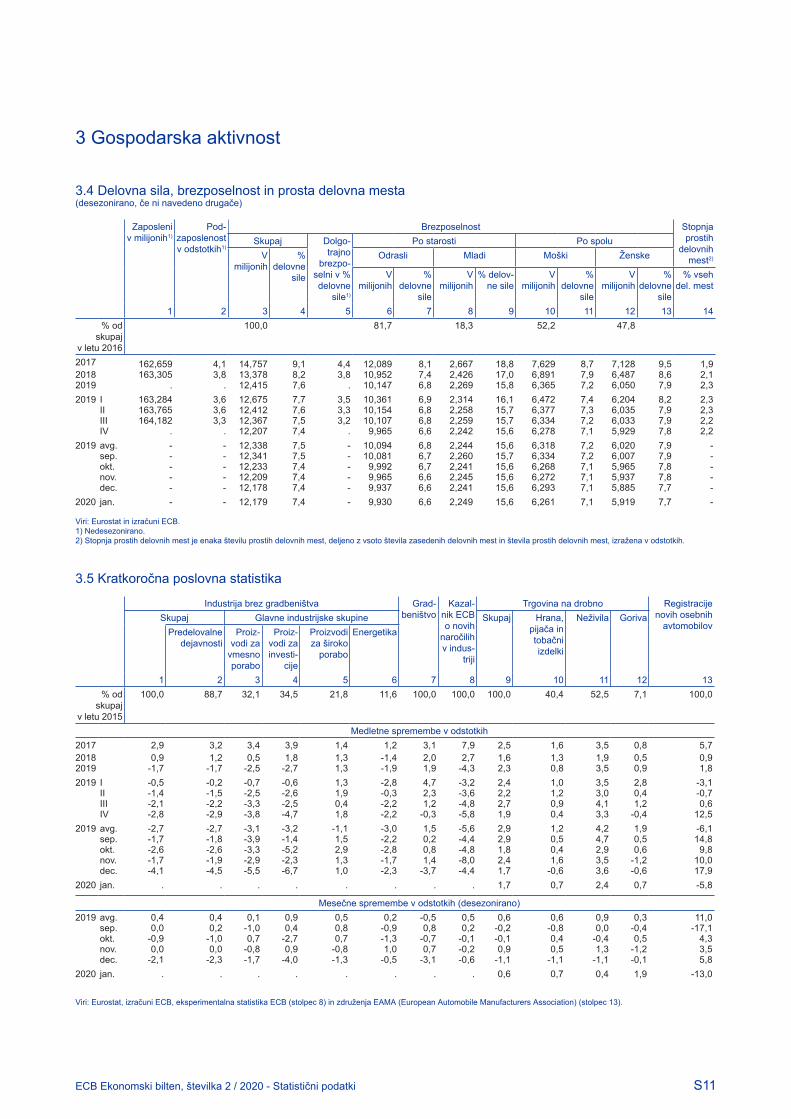
S11ECB Ekonomski bilten, številka 2 / 2020 - Statistični podatki
3 Gospodarska aktivnost
3.4 Delovna sila, brezposelnost in prosta delovna mesta(desezonirano, če ni navedeno drugače)
Zaposleni v milijonih1)
Pod-zaposlenost v odstotkih1)
Brezposelnost Stopnja prostih
delovnih mest2)
Skupaj Dolgo-trajno
brezpo-selni v % delovne
sile1)
Po starosti Po spoluV
milijonih%
delovne sile
Odrasli Mladi Moški Ženske
V milijonih
% delovne
sile
V milijonih
% delov-ne sile
V milijonih
% delovne
sile
V milijonih
% delovne
sile
% vseh del. mest
1 2 3 4 5 6 7 8 9 10 11 12 13 14% od
skupajv letu 2016
100,0 81,7 18,3 52,2 47,8
2017 162,659 4,1 14,757 9,1 4,4 12,089 8,1 2,667 18,8 7,629 8,7 7,128 9,5 1,92018 163,305 3,8 13,378 8,2 3,8 10,952 7,4 2,426 17,0 6,891 7,9 6,487 8,6 2,12019 . . 12,415 7,6 . 10,147 6,8 2,269 15,8 6,365 7,2 6,050 7,9 2,32019 I 163,284 3,6 12,675 7,7 3,5 10,361 6,9 2,314 16,1 6,472 7,4 6,204 8,2 2,3
II 163,765 3,6 12,412 7,6 3,3 10,154 6,8 2,258 15,7 6,377 7,3 6,035 7,9 2,3III 164,182 3,3 12,367 7,5 3,2 10,107 6,8 2,259 15,7 6,334 7,2 6,033 7,9 2,2IV . . 12,207 7,4 . 9,965 6,6 2,242 15,6 6,278 7,1 5,929 7,8 2,2
2019 avg. - - 12,338 7,5 - 10,094 6,8 2,244 15,6 6,318 7,2 6,020 7,9 -sep. - - 12,341 7,5 - 10,081 6,7 2,260 15,7 6,334 7,2 6,007 7,9 -okt. - - 12,233 7,4 - 9,992 6,7 2,241 15,6 6,268 7,1 5,965 7,8 -nov. - - 12,209 7,4 - 9,965 6,6 2,245 15,6 6,272 7,1 5,937 7,8 -dec. - - 12,178 7,4 - 9,937 6,6 2,241 15,6 6,293 7,1 5,885 7,7 -
2020 jan. - - 12,179 7,4 - 9,930 6,6 2,249 15,6 6,261 7,1 5,919 7,7 -
Viri: Eurostat in izračuni ECB.1) Nedesezonirano.2) Stopnja prostih delovnih mest je enaka številu prostih delovnih mest, deljeno z vsoto števila zasedenih delovnih mest in števila prostih delovnih mest, izražena v odstotkih.
3.5 Kratkoročna poslovna statistika
Industrija brez gradbeništva Grad-beništvo
Kazal-nik ECB o novih
naročilih v indus-
triji
Trgovina na drobno Registracije novih osebnih
avtomobilovSkupaj Glavne industrijske skupine Skupaj Hrana,
pijača in tobačni izdelki
Neživila GorivaPredelovalne
dejavnostiProiz-
vodi za vmesno porabo
Proiz-vodi za investi-
cije
Proizvodi za široko
porabo
Energetika
1 2 3 4 5 6 7 8 9 10 11 12 13% od
skupajv letu 2015
100,0 88,7 32,1 34,5 21,8 11,6 100,0 100,0 100,0 40,4 52,5 7,1 100,0
Medletne spremembe v odstotkih2017 2,9 3,2 3,4 3,9 1,4 1,2 3,1 7,9 2,5 1,6 3,5 0,8 5,72018 0,9 1,2 0,5 1,8 1,3 -1,4 2,0 2,7 1,6 1,3 1,9 0,5 0,92019 -1,7 -1,7 -2,5 -2,7 1,3 -1,9 1,9 -4,3 2,3 0,8 3,5 0,9 1,82019 I -0,5 -0,2 -0,7 -0,6 1,3 -2,8 4,7 -3,2 2,4 1,0 3,5 2,8 -3,1
II -1,4 -1,5 -2,5 -2,6 1,9 -0,3 2,3 -3,6 2,2 1,2 3,0 0,4 -0,7III -2,1 -2,2 -3,3 -2,5 0,4 -2,2 1,2 -4,8 2,7 0,9 4,1 1,2 0,6IV -2,8 -2,9 -3,8 -4,7 1,8 -2,2 -0,3 -5,8 1,9 0,4 3,3 -0,4 12,5
2019 avg. -2,7 -2,7 -3,1 -3,2 -1,1 -3,0 1,5 -5,6 2,9 1,2 4,2 1,9 -6,1sep. -1,7 -1,8 -3,9 -1,4 1,5 -2,2 0,2 -4,4 2,9 0,5 4,7 0,5 14,8okt. -2,6 -2,6 -3,3 -5,2 2,9 -2,8 0,8 -4,8 1,8 0,4 2,9 0,6 9,8nov. -1,7 -1,9 -2,9 -2,3 1,3 -1,7 1,4 -8,0 2,4 1,6 3,5 -1,2 10,0dec. -4,1 -4,5 -5,5 -6,7 1,0 -2,3 -3,7 -4,4 1,7 -0,6 3,6 -0,6 17,9
2020 jan. . . . . . . . . 1,7 0,7 2,4 0,7 -5,8
Mesečne spremembe v odstotkih (desezonirano)2019 avg. 0,4 0,4 0,1 0,9 0,5 0,2 -0,5 0,5 0,6 0,6 0,9 0,3 11,0
sep. 0,0 0,2 -1,0 0,4 0,8 -0,9 0,8 0,2 -0,2 -0,8 0,0 -0,4 -17,1okt. -0,9 -1,0 0,7 -2,7 0,7 -1,3 -0,7 -0,1 -0,1 0,4 -0,4 0,5 4,3nov. 0,0 0,0 -0,8 0,9 -0,8 1,0 0,7 -0,2 0,9 0,5 1,3 -1,2 3,5dec. -2,1 -2,3 -1,7 -4,0 -1,3 -0,5 -3,1 -0,6 -1,1 -1,1 -1,1 -0,1 5,8
2020 jan. . . . . . . . . 0,6 0,7 0,4 1,9 -13,0
Viri: Eurostat, izračuni ECB, eksperimentalna statistika ECB (stolpec 8) in združenja EAMA (European Automobile Manufacturers Association) (stolpec 13).

S12ECB Ekonomski bilten, številka 2 / 2020 - Statistični podatki
3 Gospodarska aktivnost
3.6 Mnenjske ankete(desezonirano)
Ankete Evropske komisije o poslovnih tendencah in mnenju potrošnikov (stanja v odstotkih, razen če ni navedeno drugače)
Ankete med gospodarstveniki (difuzijski indeksi)
Kazalnik gospodar-ske klime
(dolgoročno povprečje =
100)
Predelovalne dejavnosti Kazalnik zaupanja
potrošnikov
Kazalnik zaupanja v gradb-eništvu
Kazalnik zau-
panja v trgovini
na drob-no
Storitvene dejavnosti Indeks vo-dij nabave
(PMI) za predeloval-
ne dejav-nosti
Proiz-vodnja v predelo-
valnih de-javnostih
Poslo-vanje v
sektorju storitvenih dejavnosti
Skupni indeks
za proiz-
vodnjo
Kazalnik zaupanja
v industriji
Izkoriščenost zmogljivosti
(v %)
Kazalnik zaupanja v storitvenih
dejavnostih
Izkoriščenost zmogljivosti
(v %)
1 2 3 4 5 6 7 8 9 10 11 121999-2015 98,7 -5,2 80,6 -11,7 -15,4 -8,6 7,3 - 51,2 52,5 53,0 52,82017 110,4 5,7 83,1 -5,4 -3,0 2,3 14,7 89,9 57,4 58,5 55,6 56,42018 111,5 6,7 83,7 -4,9 7,0 1,3 15,2 90,4 54,9 54,7 54,5 54,62019 103,1 -5,1 81,9 -7,1 6,4 -0,4 10,7 90,5 47,4 47,8 52,7 51,32019 I 105,8 -0,3 83,1 -7,0 8,5 -1,0 11,6 90,7 49,1 49,0 52,4 51,5
II 103,8 -4,0 82,2 -7,0 7,2 -0,6 11,7 90,6 47,7 48,5 53,1 51,8III 102,0 -7,1 81,4 -6,8 5,1 0,0 9,7 90,4 46,4 47,0 52,8 51,2IV 100,6 -9,2 81,0 -7,7 4,9 -0,1 9,8 90,3 46,4 46,7 52,3 50,7
2019 sep. 101,1 -8,7 - -6,6 4,3 0,2 9,5 - 45,7 46,1 51,6 50,1okt. 100,2 -9,3 81,0 -7,6 5,2 -0,9 9,0 90,2 45,9 46,6 52,2 50,6nov. 100,7 -8,9 - -7,2 3,9 -0,2 9,2 - 46,9 47,4 51,9 50,6dec. 100,9 -9,3 - -8,1 5,7 0,7 11,3 - 46,3 46,1 52,8 50,9
2020 jan. 102,6 -7,0 80,9 -8,1 5,8 -0,1 11,0 90,3 47,9 48,0 52,5 51,3feb. 103,5 -6,1 - -6,6 5,3 -0,2 11,2 - 49,2 48,7 52,6 51,6
Viri: Evropska komisija (generalni direktorat za gospodarstvo in finance) (stolpci 1–8) in Markit (stolpci 9–12).
3.7 Povzetek kontov gospodinjstev in nefinančnih družb(tekoče cene, razen če je navedeno drugače; ni desezonirano)
Viri: ECB in Eurostat.1) Na podlagi kumulirane vsote prihrankov in razpoložljivega bruto dohodka štirih četrtletij (prilagojeno za spremembo neto kapitala gospodinjstev v rezervah pokojninskih skladov).2) Finančno premoženje (po obveznostih) in nefinančno premoženje. Nefinančno premoženje predstavlja predvsem premoženje v nepremičninah (stanovanjske nepremičnine in zemljišča). Sem spada tudi nefinančno premoženje podjetij, ki niso gospodarske pravne osebe in se uvrščajo v sektor gospodinjstev.3) Delež dobička se izračuna na podlagi neto prihodka podjetij, ki je bolj ali manj enak tekočim dobičkom v poslovnem računovodstvu.4) Na podlagi stanja posojil, dolžniških vrednostnih papirjev, komercialnih kreditov in obveznosti, ki izhajajo iz pokojninskih shem.
Gospodinjstva Nefinančne družbeStopnja
varčevanja (bruto)
Stopnja zadolže-
nosti
Realni raz-položljivi dohodek
Finančne naložbe
Nefinančne naložbe (bruto)
Neto premože-
nje2)
Premo-ženje v
nepremič-ninah
Delež dobička3)
Stopnja varče-vanja (neto)
Stopnja zadolže-
nosti4)
Finančne naložbe
Nefinanč-ne nalož-be (bruto)
Finan-ciranje
kot odstotek bruto razpoložljivega
dohodka1)
medletne spremembe v odstotkih kot odstotek neto dodane vrednosti
kot od-stotek BDP
medletne spremembe v odstotkih
1 2 3 4 5 6 7 8 9 10 11 12 132016 12,3 94,0 2,0 1,9 5,5 3,4 3,0 35,1 7,4 79,7 4,3 5,5 2,52017 12,0 93,9 1,4 2,2 5,4 4,6 4,7 34,4 7,1 77,2 4,6 7,8 3,02018 12,3 93,6 1,8 2,1 7,1 2,4 4,5 33,8 6,0 76,6 2,3 5,4 1,72018 IV 12,3 93,6 1,6 2,1 8,8 2,4 4,5 33,8 6,0 76,6 2,3 20,7 1,72019 I 12,6 93,4 2,0 2,2 7,6 3,7 4,3 33,7 6,1 76,7 2,3 7,7 1,7
II 12,8 93,5 2,1 2,4 4,4 4,2 4,2 33,5 5,8 77,3 1,8 16,6 1,5III 13,0 93,6 2,3 2,4 4,9 5,0 4,1 33,3 5,8 78,1 2,0 0,2 1,5

S13ECB Ekonomski bilten, številka 2 / 2020 - Statistični podatki
3 Gospodarska aktivnost
3.8 Plačilna bilanca euroobmočja, tekoči račun in kapitalski račun(v milijardah EUR; desezonirano, če ni navedeno drugače; transakcije)
Tekoči račun Kapitalski račun1)
Skupaj Blago Storitve Primarni dohodek Sekundarni dohodekPrejemki Izdatki Saldo Prejemki Izdatki Prejemki Izdatki Prejemki Izdatki Prejemki Izdatki Prejemki Izdatki
1 2 3 4 5 6 7 8 9 10 11 12 132019 I 1.066,8 974,6 92,2 603,8 520,0 235,9 210,4 198,2 175,6 28,9 68,5 10,7 14,9
II 1.060,5 990,1 70,4 597,7 520,0 242,0 233,6 194,1 173,6 26,7 62,8 8,9 24,0III 1.085,1 984,4 100,7 607,1 518,4 249,9 218,1 200,8 178,2 27,3 69,7 9,2 7,3IV 1.064,2 965,2 99,1 607,4 517,7 244,7 217,6 185,7 170,1 26,4 59,8 16,7 11,2
2019 jul. 362,3 334,0 28,3 202,1 172,7 82,7 76,9 68,4 61,1 9,1 23,2 3,6 2,6avg. 361,3 321,1 40,2 201,5 171,1 83,5 72,8 67,2 53,9 9,1 23,2 3,0 2,1sep. 361,5 329,4 32,2 203,5 174,5 83,6 68,4 65,2 63,2 9,2 23,3 2,6 2,6okt. 360,2 326,2 34,1 205,0 173,2 82,2 71,3 63,5 58,8 9,6 22,9 3,2 2,3nov. 351,6 319,2 32,4 198,3 171,5 82,0 71,5 63,0 57,4 8,4 18,7 3,2 2,5dec. 352,3 319,8 32,6 204,2 173,0 80,6 74,7 59,1 53,8 8,5 18,2 10,2 6,4
Skupne 12-mesečne.transakcije
2019 dec. 4.276,6 3.914,2 362,4 2.416,1 2.076,2 972,5 879,7 778,7 697,5 109,3 260,9 45,5 57,4
Skupne 12-mesečne transakcije v odstotkih BDP
2019 dec. 35,9 32,9 3,0 20,3 17,4 8,2 7,4 6,5 5,9 0,9 2,2 0,4 0,5
1) Ni desezonirano.
3.9 Zunanja trgovina euroobmočja (blagovna menjava)1), vrednosti in obseg po skupinah proizvodov2)
(desezonirano, če ni navedeno drugače)
Viri: ECB in Eurostat.1) Razlike med postavko blaga v plačilni bilanci ECB (tabela 3.8) in Eurostatovo statistiko o blagovni menjavi (tabela 3.9) so predvsem posledica različnih razmejitev.2) Skladno z razvrstitvijo po glavnih industrijskih skupinah.
Skupaj (nedesezonirano)
Izvoz (f.o.b) Uvoz (c.i.f)
Izvoz Uvoz Skupaj Zaznamek: Skupaj Zaznamek:Blago za vmesno porabo
Investi-cijsko blago
Potrošno blago
Industrijski proizvodi
Blago za vmesno porabo
Investi-cijsko blago
Potrošno blago
Industrijski proizvodi
Nafta
1 2 3 4 5 6 7 8 9 10 11 12 13Vrednosti (v milijardah EUR; stolpca 1 in 2: letne spremembe v odstotkih)
2019 I 3,7 5,4 586,5 283,1 121,2 172,6 493,6 533,3 306,9 86,2 133,4 383,5 64,1II 2,1 2,5 582,2 275,7 120,3 175,9 486,6 530,6 302,3 85,3 134,6 381,3 65,5III 3,1 0,6 584,4 278,7 117,5 176,9 488,6 529,2 297,5 87,3 136,8 386,6 60,1IV 2,1 -2,1 591,8 . . . 495,3 526,6 . . . 382,8 .
2019 jul. 6,0 2,8 193,5 92,8 39,1 58,3 161,9 176,8 100,9 29,2 44,7 128,9 20,3avg. -2,1 -3,6 195,2 93,2 39,2 59,1 163,5 175,2 98,4 28,8 45,0 128,3 20,1sep. 5,3 2,3 195,7 92,7 39,2 59,5 163,1 177,2 98,2 29,3 47,0 129,5 19,7okt. 4,4 -2,6 200,1 92,8 43,6 60,7 168,0 176,3 97,4 29,9 46,5 129,2 19,2nov. -2,7 -4,3 194,9 91,6 40,3 59,1 163,8 175,8 97,7 28,6 46,3 128,6 20,2dec. 4,8 1,1 196,7 . . . 163,5 174,5 . . . 125,0 .
Indeksi obsega (2000 = 100; stolpec 1 in 2: letne spremembe v odstotkih)2019 I -0,3 1,7 108,0 111,6 107,5 105,0 108,1 110,1 110,3 108,8 112,4 111,7 105,0
II -1,5 -0,2 106,5 108,4 105,9 105,5 106,2 109,1 107,5 108,8 113,3 111,4 97,2III 0,9 1,5 106,7 109,5 103,0 105,7 106,1 109,5 108,2 110,6 112,8 111,6 96,5IV . . . . . . . . . . . . .
2019 jun. -8,0 -4,5 106,6 109,0 105,4 105,1 107,0 109,1 106,7 109,0 113,6 112,3 98,2jul. 3,6 3,3 106,2 109,4 103,5 105,0 105,9 109,9 109,4 112,0 112,0 112,6 95,1avg. -4,3 -2,6 106,7 109,9 102,7 105,7 106,4 109,2 108,3 109,6 111,1 110,9 99,1sep. 3,3 3,8 107,0 109,3 102,9 106,3 106,1 109,3 106,9 110,2 115,3 111,3 95,5okt. 2,3 -1,3 109,3 109,6 113,3 108,6 109,2 108,3 106,3 109,7 113,6 110,7 92,8nov. -4,3 -3,8 106,5 108,4 105,1 105,1 106,4 107,8 106,5 103,6 113,4 109,9 97,5

S14ECB Ekonomski bilten, številka 2 / 2020 - Statistični podatki
4 Cene in stroški
4.1 Harmonizirani indeks cen življenjskih potrebščin1)
(letne spremembe v odstotkih, razen če ni drugače navedeno)
Viri: Eurostat in izračuni ECB.1) Podatki se nanašajo na spreminjajočo se sestavo euroobmočja.2) ECB je začela maja 2016 objavljati izboljšano desezonirano serijo podatkov o HICP za euroobmočje, potem ko je bil način desezoniranja revidiran, kot je opisano v okvirju 1,
Economic Bulletin, številka 3, ECB, 2016 (https://www.ecb.europa.eu/pub/pdf/ecbu/eb201603.en.pdf).3) Podatek za euroobmočje je ocena na podlagi začasnih nacionalnih podatkov in prvih informacij o cenah energentov.
Skupaj Skupaj
(desezonirano; sprememba v odstotkih glede na prejšnje obdobje)2)Zaznamek:
Nadzorovane cene
Indeks: 2015 =100
Skupaj Blago Storitve Skupaj Predelana hrana
Nepredelana hrana
Industrijs-ko blago
razen ener-gentov
Energenti (ni des.)
Storitve Skupaj HICP brez
nadzorova-nih cen
Nadzorovane ceneSkupaj
brez neprede-
lane hrane in ener-gentov
1 2 3 4 5 6 7 8 9 10 11 12 13% od
skupaj v letu 2019
100,0 100,0 70,9 55,5 44,5 100,0 14,5 4,5 26,4 10,1 44,5 87,0 13,0
2017 101,8 1,5 1,0 1,6 1,4 - - - - - - 1,6 1,02018 103,6 1,8 1,0 2,0 1,5 - - - - - - 1,7 2,12019 104,8 1,2 1,0 1,0 1,5 - - - - - - 1,1 1,92019 I 103,5 1,4 1,0 1,5 1,4 0,0 0,5 0,0 0,1 -2,4 0,3 1,2 2,6
II 105,3 1,4 1,1 1,3 1,5 0,5 0,5 -0,2 0,1 1,6 0,7 1,3 2,4III 105,1 1,0 0,9 0,7 1,3 0,2 0,5 1,4 0,1 -1,5 0,3 0,9 1,6IV 105,3 1,0 1,2 0,4 1,7 0,3 0,4 0,3 0,1 0,2 0,4 1,0 1,2
2019 sep. 105,3 0,8 1,0 0,3 1,5 0,1 0,0 -0,3 0,0 0,0 0,1 0,7 1,6okt. 105,4 0,7 1,1 0,1 1,5 0,1 0,1 -0,2 0,0 0,4 0,2 0,7 1,1nov. 105,1 1,0 1,3 0,3 1,9 0,1 0,2 0,5 0,1 0,0 0,1 0,9 1,2dec. 105,4 1,3 1,3 1,0 1,8 0,1 0,1 0,4 0,1 0,1 0,2 1,3 1,3
2020 jan. 104,4 1,4 1,1 1,2 1,5 0,1 0,2 0,3 0,0 0,8 -0,1 1,5 0,8feb.3) 104,6 1,2 1,2 . 1,6 0,0 0,2 1,0 0,1 -1,6 0,2 . .
Blago StoritveHrana (vključno z alkoholnimi pijačami in tobačnimi izdelki)
Industrijsko blago Stanovanjske storitve
Prevoz Komunikacija Rekreacija in osebne storitve
Razno
Skupaj Predelana hrana
Nepredelana hrana
Skupaj Industrijsko blago razen energentov
Energenti Najemnine
14 15 16 17 18 19 20 21 22 23 24 25% od
skupaj v letu 2019
19,0 14,5 4,5 36,5 26,4 10,1 11,0 6,5 7,2 2,6 15,3 8,4
2017 1,8 1,5 2,4 1,5 0,3 4,9 1,3 1,2 2,1 -1,1 2,1 0,82018 2,2 2,1 2,3 1,9 0,3 6,4 1,2 1,2 1,5 -0,1 2,0 1,42019 1,8 1,9 1,4 0,5 0,3 1,1 1,4 1,3 2,0 -0,7 1,7 1,52019 I 2,0 1,9 1,9 1,3 0,3 3,9 1,2 1,2 1,3 -0,6 1,7 1,5
II 1,5 1,8 0,6 1,2 0,3 3,6 1,3 1,3 2,1 -1,2 2,0 1,5III 1,8 1,9 1,6 0,0 0,3 -0,7 1,5 1,5 2,2 -0,8 1,1 1,5IV 1,8 1,9 1,6 -0,3 0,4 -2,1 1,5 1,5 2,4 -0,2 2,0 1,5
2019 sep. 1,6 1,8 0,7 -0,3 0,2 -1,8 1,5 1,5 2,1 -0,6 1,5 1,6okt. 1,5 1,8 0,7 -0,7 0,3 -3,1 1,5 1,5 2,4 -0,4 1,5 1,6nov. 1,9 2,0 1,8 -0,6 0,4 -3,2 1,5 1,5 2,4 -0,1 2,4 1,5dec. 2,0 2,0 2,1 0,4 0,5 0,2 1,6 1,5 2,5 -0,1 2,1 1,5
2020 jan. 2,1 2,0 2,3 0,8 0,3 1,9 1,6 1,5 2,0 -0,2 1,5 1,5feb.3) 2,2 2,1 2,7 . 0,5 -0,3 . . . . . .

S15ECB Ekonomski bilten, številka 2 / 2020 - Statistični podatki
4 Cene in stroški
4.2 Cene v industriji in gradbeništvu ter cene stanovanj(letne spremembe v odstotkih, razen če ni navedeno drugače)
Viri: Eurostat, izračuni ECB in izračuni ECB na podlagi podatkov IPD in nacionalnih virov (stolpec 13).1) Na domačem trgu.2) Lastne cene v stanovanjski gradnji.3) Poskusni podatki na podlagi neharmoniziranih virov (podrobnosti so na voljo na https://www.ecb.europa.eu/stats/ecb_statistics/governance_and_quality_framework/html/experi-mental-data.en.html).
Cene industrijskih proizvodov pri proizvajalcih razen gradbeništva1) Gradbe-ništvo2)
Cene stano-vanj3)
Eksperimen-talni kazalnik
cen poslovnih nepremičnin3)
Skupaj(Indeks:2015 =
100)
Skupaj Industrija brez gradbeništva in energentov Ener-genti Prede-
lovalne dejav-
nosti
Skupaj Proizvodi za vmesno
porabo
Proizvodi za investicije
Proizvodi za široko porabo
Skupaj Živila, pijača, tobačni izdelki
Neživila
1 2 3 4 5 6 7 8 9 10 11 12 13% od
skupaj v letu 2015
100,0 100,0 77,3 72,1 28,9 20,7 22,5 16,5 5,9 27,9
2017 100,8 3,0 3,0 2,1 3,2 0,9 1,9 2,9 0,2 5,6 2,0 4,3 4,82018 104,0 3,2 2,4 1,5 2,6 1,0 0,4 0,2 0,6 8,1 2,5 4,8 4,22019 104,7 0,7 0,6 0,7 0,1 1,5 1,0 1,1 0,8 -0,1 . . .2019 I 105,4 3,0 1,3 1,1 1,3 1,5 0,4 -0,1 1,0 7,7 2,5 4,0 4,4
II 104,8 1,6 1,0 0,9 0,7 1,5 1,0 0,9 0,9 3,0 2,2 4,1 6,6III 104,2 -0,6 0,0 0,5 -0,4 1,5 1,0 1,2 0,8 -4,3 1,2 3,6 .IV 104,4 -1,3 0,0 0,4 -1,2 1,4 1,7 2,3 0,7 -5,9 . . .
2019 avg. 104,0 -0,8 -0,2 0,5 -0,4 1,5 1,0 1,3 0,8 -4,9 - - -sep. 104,2 -1,1 -0,3 0,4 -0,7 1,5 1,2 1,4 0,8 -6,1 - - -okt. 104,2 -1,9 -0,7 0,4 -1,0 1,4 1,5 1,8 0,7 -7,7 - - -nov. 104,4 -1,4 -0,3 0,3 -1,4 1,4 1,7 2,2 0,7 -6,0 - - -dec. 104,5 -0,6 0,9 0,5 -1,1 1,5 2,0 2,9 0,7 -3,8 - - -
2020 jan. 104,9 -0,5 1,2 0,6 -1,0 1,3 2,1 3,0 0,7 -3,6 - - -
4.3 Cene primarnih surovin in deflatorji BDP(letne spremembe v odstotkih, razen če ni navedeno drugače)
Viri: Eurostat, izračuni ECB in Bloomberg (stolpec 9).1) Deflatorji za izvoz in uvoz se nanašajo na blago in storitve ter vključujejo tudi čezmejno trgovino v euroobmočju.2) Tehtano z uvozom: nanaša se na povprečno strukturo uvoza v obdobju 2009-2011; tehtano s porabo: nanaša se na povprečno strukturo domačega povpraševanja v obdobju 2009-2011.
Deflatorji BDP Cena nafte
(EUR za sod)
Cene primarnih surovin brez energentov (v EUR)Skupaj (dese-
zonirani indeks:2010 =
100)
Skupaj Domače povpraševanje Izvoz1) Uvoz1) Tehtano z uvozom2) Tehtano s porabo2)
Skupaj Zasebna potrošnja
Državna potrošnja
Bruto investicije v osnovna
sredstva
Skupaj Živila Neživila Skupaj Živila Neživila
1 2 3 4 5 6 7 8 9 10 11 12 13 14 15% od
skupaj100,0 45,4 54,6 100,0 50,4 49,6
2017 101,8 1,0 1,4 1,3 1,4 1,7 1,9 2,8 48,1 5,8 -3,5 16,6 6,7 -1,6 17,82018 103,1 1,3 1,7 1,4 1,7 2,0 1,4 2,3 60,4 -0,6 -5,8 4,3 -0,1 -5,3 5,72019 104,9 1,7 1,5 1,2 1,7 2,3 0,6 0,1 57,2 1,7 3,7 -0,1 2,6 7,5 -2,32019 I 104,2 1,6 1,8 1,2 1,8 2,7 1,1 1,5 55,6 3,1 3,4 2,8 3,9 5,1 2,7
II 104,7 1,7 1,7 1,6 1,7 2,1 1,0 0,9 61,0 -1,8 -0,7 -2,8 -0,1 4,7 -4,9III 105,1 1,7 1,3 1,1 1,6 2,2 0,1 -1,1 55,7 1,8 3,7 0,2 1,7 6,5 -3,1IV 105,6 1,8 1,3 1,0 1,6 2,3 0,2 -0,9 56,5 3,7 8,7 -0,6 5,1 13,7 -3,6
2019 sep. - - - - - - - - 56,6 4,1 6,9 1,7 3,5 9,0 -2,0okt. - - - - - - - - 53,7 1,1 5,1 -2,4 1,9 9,4 -5,4nov. - - - - - - - - 56,8 3,8 9,9 -1,6 6,5 17,2 -4,2dec. - - - - - - - - 59,3 6,4 11,2 2,2 6,8 14,4 -1,1
2020 jan. - - - - - - - - 57,3 7,2 11,3 3,5 6,9 12,9 0,7feb. - - - - - - - - 50,5 2,4 8,7 -3,0 2,2 9,2 -4,9

S16ECB Ekonomski bilten, številka 2 / 2020 - Statistični podatki
4 Cene in stroški
4.4 Mnenjske ankete o cenah(desezonirano)
Viri: Evropska komisija (generalni direktorat za gospodarstvo in finance) in Markit.
Ankete Evropske komisije o poslovnih tendencah in mnenju potrošnikov (stanja v odstotkih)
Ankete med gospodarstveniki (difuzijski indeks)
Pričakovana prodajna cena(za naslednje tri mesece)
Gibanja cen življenjskih
potrebščin v zadnjih 12 mesecih
Cena vložka Zaračunana cena
Predelovalne dejavnosti
Trgovina na drobno
Storitve Gradbeništvo Predelovalne dejavnosti
Storitve Predelovalne dejavnosti
Storitve
1 2 3 4 5 6 7 8 91999-2015 4,3 - - -4,5 32,3 56,7 56,3 - 49,72017 9,3 5,2 7,1 2,8 12,9 64,6 56,3 55,1 51,62018 11,6 7,5 9,5 12,5 20,6 65,4 57,9 56,1 52,72019 4,3 7,2 9,0 7,4 18,3 48,8 57,1 50,4 52,42019 I 9,1 8,2 10,5 12,2 20,7 53,9 57,7 53,0 53,1
II 4,8 7,2 9,2 6,6 19,8 50,6 57,1 51,2 52,3III 1,9 6,6 8,4 4,9 17,9 46,4 56,5 48,9 52,0IV 1,4 6,9 7,9 5,9 14,7 44,2 56,9 48,6 52,0
2019 sep. 1,6 7,0 7,7 5,3 17,0 46,3 55,9 48,6 51,7okt. 1,4 6,6 8,0 5,2 16,0 43,7 57,3 48,7 52,1nov. 0,8 6,4 7,3 6,1 14,0 43,9 56,8 48,3 52,1dec. 2,1 7,9 8,4 6,4 14,1 45,0 56,7 48,9 51,8
2020 jan. 2,9 8,6 10,4 6,8 14,9 45,6 57,6 48,6 51,8feb. 3,8 7,3 9,1 6,0 14,3 47,1 56,8 48,1 52,1
4.5 Indeksi stroškov dela(letne spremembe v odstotkih, razen če ni navedeno drugače)
Viri: Eurostat in izračuni ECB.1) Poskusni podatki na podlagi neharmoniziranih virov (podrobnosti so na voljo na https://www.ecb.europa.eu/stats/ecb_statistics/governance_and_quality_framework/html/experi-mental-data.en.html).
Skupaj (Indeks:
2016 = 100)
Skupaj Po komponentah Po gospodarskih dejavnostih Zaznamek: kazalnik
dogovorjenih plač1)Plače Socialni prispevki
delodajalcevGospodarske
dejavnosti(proizvodnja in
tržne dejavnosti)
Netržne dejavnosti
1 2 3 4 5 6 7% od
skupaj v letu 2018
100,0 100,0 75,3 24,7 69,0 31,0
2017 101,8 1,8 1,7 1,9 1,8 1,7 1,52018 104,2 2,3 2,3 2,6 2,5 2,1 2,02019 . . . . . . 2,22019 I 99,9 2,7 2,9 2,2 2,6 3,0 2,3
II 110,9 2,8 2,8 2,8 2,7 3,2 2,0III 103,5 2,7 2,6 2,6 2,6 2,6 2,6IV . . . . . . 2,0

S17ECB Ekonomski bilten, številka 2 / 2020 - Statistični podatki
4 Cene in stroški
4.6 Stroški dela na enoto proizvoda, sredstva za zaposlene in produktivnost dela(letne spremembe v odstotkih, če ni navedeno drugače; četrtletni podatki, desezonirani; letni podatki niso desezonirani)
Viri: Eurostat in izračuni ECB.
Skupaj (Indeks:
2010=100)
Skupaj Po gospodarskih dejavnostihKme-
tijstvo, gozdar-stvo in ribolov
Predelovalne dejavnosti,
oskrba z elek-triko in javne gospodarske
službe
Gradbe-ništvo
Trgovina, promet,
skladiščenje in
gostinstvo
Informa-cijske in komuni-kacijske
dejavnosti
Finančne in zavaro-
val niške dejavnosti
Poslo-vanje z
nepremični-nami
Strokovne, poslovne
in podpor-ne storitve
Javna uprava, izobraževanje,
zdravstvo in socialno
varstvo
Umetnost, zabava
in druge storitve
1 2 3 4 5 6 7 8 9 10 11 12Stroški dela na enoto proizvoda
2017 106,2 0,7 -0,2 -0,6 0,8 0,4 0,0 -1,4 3,4 1,7 1,4 1,12018 108,1 1,8 0,0 1,7 1,0 1,7 1,6 -0,7 3,4 2,2 2,3 2,52019 110,3 2,0 0,3 3,4 1,4 1,7 1,1 -1,0 2,6 1,5 2,6 2,22019 I 109,4 2,3 1,4 3,6 1,2 2,0 1,6 -0,7 5,0 1,8 2,6 1,7
II 110,0 2,1 -0,4 3,2 1,7 2,0 1,5 -1,0 3,2 1,7 2,6 2,4III 110,6 1,9 -0,9 4,0 1,1 1,4 1,5 -1,2 2,2 1,3 2,6 1,7IV 110,9 1,7 1,2 2,9 1,6 1,2 -0,2 -1,0 0,1 1,4 2,7 2,8
Sredstva za zaposlene2017 111,3 1,7 1,1 1,5 1,9 1,5 2,0 1,2 2,2 2,5 1,8 1,62018 113,8 2,2 1,7 2,0 1,9 2,3 2,6 1,6 3,2 2,7 2,0 2,52019 116,1 2,0 1,6 1,5 2,0 2,2 1,6 1,4 3,0 1,9 2,3 2,52019 I 115,3 2,3 1,3 1,9 2,4 2,7 2,0 1,3 4,0 1,9 2,3 2,5
II 115,9 2,0 1,6 1,1 2,2 2,3 1,3 1,7 3,1 2,3 2,1 3,1III 116,7 2,1 1,0 2,0 2,0 2,3 1,7 1,1 3,2 1,9 2,2 2,1IV 116,8 1,7 2,5 0,7 1,4 1,7 1,3 1,3 1,7 1,4 2,5 2,3
Produktivnost dela na zaposlenega2017 104,8 0,9 1,3 2,1 1,1 1,0 2,0 2,7 -1,1 0,7 0,4 0,52018 105,2 0,4 1,7 0,3 0,9 0,7 1,0 2,3 -0,1 0,5 -0,3 0,02019 105,3 0,0 1,3 -1,9 0,6 0,6 0,4 2,4 0,4 0,3 -0,3 0,32019 I 105,5 0,0 -0,1 -1,6 1,2 0,6 0,3 2,0 -1,0 0,0 -0,3 0,8
II 105,3 -0,1 2,0 -2,0 0,5 0,3 -0,1 2,7 -0,1 0,6 -0,4 0,7III 105,5 0,2 2,0 -1,9 0,9 0,9 0,2 2,3 0,9 0,6 -0,4 0,3IV 105,3 -0,1 1,2 -2,1 -0,1 0,5 1,5 2,4 1,6 -0,1 -0,3 -0,5
Sredstva za delovno uro2017 113,3 2,0 1,3 1,8 2,0 1,8 2,0 1,8 2,1 2,3 2,4 2,12018 115,8 2,1 1,2 2,1 1,4 2,4 2,7 1,9 2,5 2,8 2,0 2,22019 118,1 2,0 1,2 1,9 2,3 2,2 2,6 1,0 2,7 2,0 1,8 2,72019 I 116,7 1,8 -0,6 1,9 1,6 2,2 2,5 0,8 4,2 1,9 1,7 2,2
II 117,4 2,2 2,1 1,7 2,4 2,4 2,5 1,3 3,3 2,5 1,8 3,6III 118,2 2,2 1,2 2,4 2,6 2,6 2,7 0,6 2,1 2,2 1,8 2,5IV 118,4 1,9 1,7 1,3 2,5 1,9 2,7 1,3 1,3 1,6 2,1 2,4
Produktivnost dela na uro2017 107,2 1,4 1,8 2,5 1,2 1,6 2,1 3,2 -0,9 0,9 1,0 1,02018 107,7 0,5 0,9 0,5 0,6 1,0 1,3 2,5 -0,8 0,5 -0,3 0,02019 107,8 0,1 0,9 -1,6 0,8 0,8 1,5 2,2 0,3 0,5 -0,7 0,52019 I 107,4 -0,3 -0,9 -1,6 0,5 0,4 1,1 1,6 -0,2 0,0 -0,9 0,5
II 107,5 0,2 2,1 -1,5 0,5 0,8 1,2 2,5 0,8 0,7 -0,7 1,1III 107,6 0,4 2,0 -1,6 1,4 1,3 1,3 2,0 0,2 1,1 -0,7 0,7IV 107,6 0,2 0,6 -1,5 0,9 0,9 2,5 2,6 0,9 0,2 -0,5 -0,5
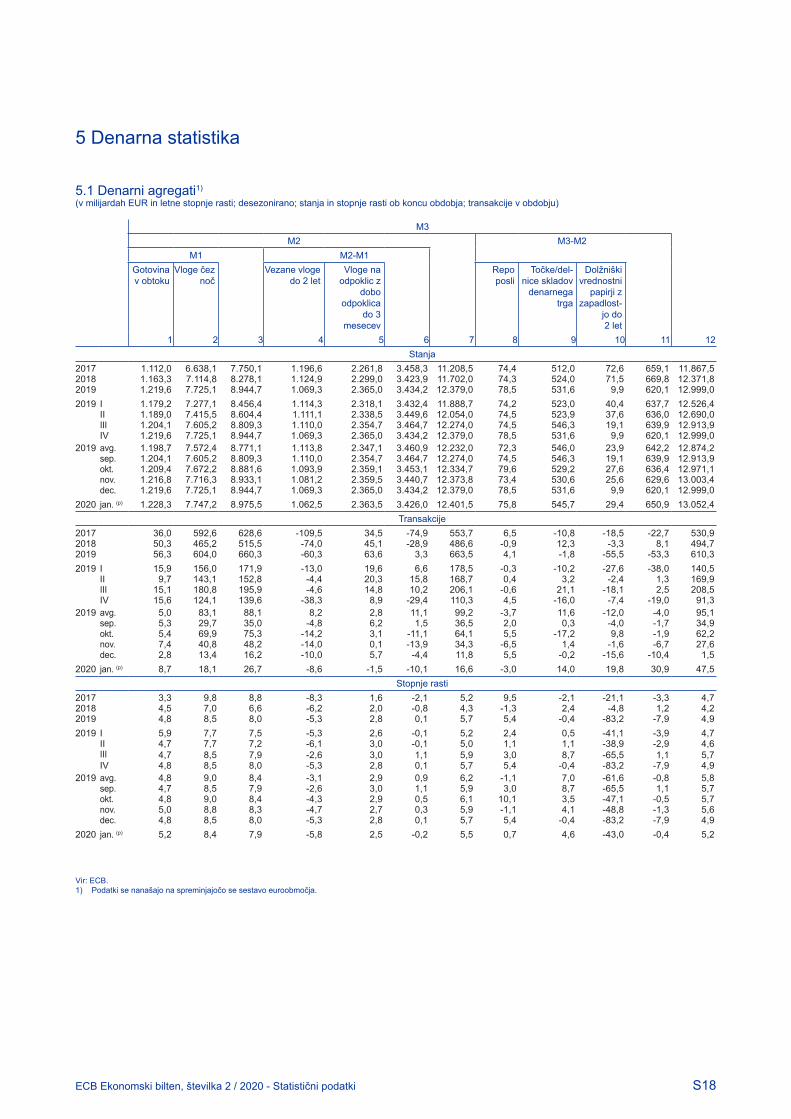
S18ECB Ekonomski bilten, številka 2 / 2020 - Statistični podatki
5 Denarna statistika
5.1 Denarni agregati1)
(v milijardah EUR in letne stopnje rasti; desezonirano; stanja in stopnje rasti ob koncu obdobja; transakcije v obdobju)
Vir: ECB.1) Podatki se nanašajo na spreminjajočo se sestavo euroobmočja.
M3M2 M3-M2
M1 M2-M1Gotovina v obtoku
Vloge čez noč
Vezane vloge do 2 let
Vloge na odpoklic z
dobo odpoklica
do 3 mesecev
Repo posli
Točke/del-nice skladov
denarnega trga
Dolžniški vrednostni
papirji z zapadlost-
jo do 2 let
1 2 3 4 5 6 7 8 9 10 11 12Stanja
2017 1.112,0 6.638,1 7.750,1 1.196,6 2.261,8 3.458,3 11.208,5 74,4 512,0 72,6 659,1 11.867,52018 1.163,3 7.114,8 8.278,1 1.124,9 2.299,0 3.423,9 11.702,0 74,3 524,0 71,5 669,8 12.371,82019 1.219,6 7.725,1 8.944,7 1.069,3 2.365,0 3.434,2 12.379,0 78,5 531,6 9,9 620,1 12.999,02019 I 1.179,2 7.277,1 8.456,4 1.114,3 2.318,1 3.432,4 11.888,7 74,2 523,0 40,4 637,7 12.526,4
II 1.189,0 7.415,5 8.604,4 1.111,1 2.338,5 3.449,6 12.054,0 74,5 523,9 37,6 636,0 12.690,0III 1.204,1 7.605,2 8.809,3 1.110,0 2.354,7 3.464,7 12.274,0 74,5 546,3 19,1 639,9 12.913,9IV 1.219,6 7.725,1 8.944,7 1.069,3 2.365,0 3.434,2 12.379,0 78,5 531,6 9,9 620,1 12.999,0
2019 avg. 1.198,7 7.572,4 8.771,1 1.113,8 2.347,1 3.460,9 12.232,0 72,3 546,0 23,9 642,2 12.874,2sep. 1.204,1 7.605,2 8.809,3 1.110,0 2.354,7 3.464,7 12.274,0 74,5 546,3 19,1 639,9 12.913,9okt. 1.209,4 7.672,2 8.881,6 1.093,9 2.359,1 3.453,1 12.334,7 79,6 529,2 27,6 636,4 12.971,1nov. 1.216,8 7.716,3 8.933,1 1.081,2 2.359,5 3.440,7 12.373,8 73,4 530,6 25,6 629,6 13.003,4dec. 1.219,6 7.725,1 8.944,7 1.069,3 2.365,0 3.434,2 12.379,0 78,5 531,6 9,9 620,1 12.999,0
2020 jan. (p) 1.228,3 7.747,2 8.975,5 1.062,5 2.363,5 3.426,0 12.401,5 75,8 545,7 29,4 650,9 13.052,4Transakcije
2017 36,0 592,6 628,6 -109,5 34,5 -74,9 553,7 6,5 -10,8 -18,5 -22,7 530,92018 50,3 465,2 515,5 -74,0 45,1 -28,9 486,6 -0,9 12,3 -3,3 8,1 494,72019 56,3 604,0 660,3 -60,3 63,6 3,3 663,5 4,1 -1,8 -55,5 -53,3 610,32019 I 15,9 156,0 171,9 -13,0 19,6 6,6 178,5 -0,3 -10,2 -27,6 -38,0 140,5
II 9,7 143,1 152,8 -4,4 20,3 15,8 168,7 0,4 3,2 -2,4 1,3 169,9III 15,1 180,8 195,9 -4,6 14,8 10,2 206,1 -0,6 21,1 -18,1 2,5 208,5IV 15,6 124,1 139,6 -38,3 8,9 -29,4 110,3 4,5 -16,0 -7,4 -19,0 91,3
2019 avg. 5,0 83,1 88,1 8,2 2,8 11,1 99,2 -3,7 11,6 -12,0 -4,0 95,1sep. 5,3 29,7 35,0 -4,8 6,2 1,5 36,5 2,0 0,3 -4,0 -1,7 34,9okt. 5,4 69,9 75,3 -14,2 3,1 -11,1 64,1 5,5 -17,2 9,8 -1,9 62,2nov. 7,4 40,8 48,2 -14,0 0,1 -13,9 34,3 -6,5 1,4 -1,6 -6,7 27,6dec. 2,8 13,4 16,2 -10,0 5,7 -4,4 11,8 5,5 -0,2 -15,6 -10,4 1,5
2020 jan. (p) 8,7 18,1 26,7 -8,6 -1,5 -10,1 16,6 -3,0 14,0 19,8 30,9 47,5Stopnje rasti
2017 3,3 9,8 8,8 -8,3 1,6 -2,1 5,2 9,5 -2,1 -21,1 -3,3 4,72018 4,5 7,0 6,6 -6,2 2,0 -0,8 4,3 -1,3 2,4 -4,8 1,2 4,22019 4,8 8,5 8,0 -5,3 2,8 0,1 5,7 5,4 -0,4 -83,2 -7,9 4,92019 I 5,9 7,7 7,5 -5,3 2,6 -0,1 5,2 2,4 0,5 -41,1 -3,9 4,7
II 4,7 7,7 7,2 -6,1 3,0 -0,1 5,0 1,1 1,1 -38,9 -2,9 4,6III 4,7 8,5 7,9 -2,6 3,0 1,1 5,9 3,0 8,7 -65,5 1,1 5,7IV 4,8 8,5 8,0 -5,3 2,8 0,1 5,7 5,4 -0,4 -83,2 -7,9 4,9
2019 avg. 4,8 9,0 8,4 -3,1 2,9 0,9 6,2 -1,1 7,0 -61,6 -0,8 5,8sep. 4,7 8,5 7,9 -2,6 3,0 1,1 5,9 3,0 8,7 -65,5 1,1 5,7okt. 4,8 9,0 8,4 -4,3 2,9 0,5 6,1 10,1 3,5 -47,1 -0,5 5,7nov. 5,0 8,8 8,3 -4,7 2,7 0,3 5,9 -1,1 4,1 -48,8 -1,3 5,6dec. 4,8 8,5 8,0 -5,3 2,8 0,1 5,7 5,4 -0,4 -83,2 -7,9 4,9
2020 jan. (p) 5,2 8,4 7,9 -5,8 2,5 -0,2 5,5 0,7 4,6 -43,0 -0,4 5,2

S19ECB Ekonomski bilten, številka 2 / 2020 - Statistični podatki
5 Denarna statistika
5.2 Vloge v denarnem agregatu M31)
(v milijardah EUR in letne stopnje rasti; desezonirano; stanja in stopnje rasti ob koncu obdobja; transakcije v obdobju)
Vir: ECB.1) Podatki se nanašajo na spreminjajočo se sestavo euroobmočja.2) V skladu z ESR 2010 so se holdinške družbe nefinančnih skupin decembra 2014 prerazvrstile iz sektorja nefinančnih družb v sektor finančnih družb. Ti subjekti so vključeni v
statistične podatke bilanc stanja DFI skupaj s finančnimi družbami, ki niso DFI ter zavarovalnice in pokojninski skladi.3) Vključno z nepridobitnimi ustanovami, ki delujejo za gospodinjstva. 4) Sektor države brez centralne države.
Nefinančne družbe2) Gospodinjstva3) Drugi finančni
posredniki2)Zavaro-
valnice in pokojninski
skladi
Ostala država4)
Skupaj Čez noč
Vezane vloge
do 2 let
Vloge na odpoklic
z dobo odpoklica
do 3 mesecev
Repo posli
Skupaj Čez noč
Vezane vloge
do 2 let
Vloge na odpoklic
z dobo odpoklica
do 3 mese-
cev
Repo posli
1 2 3 4 5 6 7 8 9 10 11 12 13Stanja
2017 2.240,3 1.797,4 285,0 149,1 8,8 6.317,6 3.702,8 562,1 2.051,9 0,8 991,1 206,6 415,32018 2.331,4 1.898,7 277,3 147,8 7,6 6.644,9 4.035,9 517,6 2.090,1 1,4 998,2 202,9 435,52019 2.476,1 2.062,7 256,8 150,1 6,5 7.041,8 4.395,5 492,5 2.152,9 0,9 1.036,9 215,2 467,82019 I 2.380,2 1.956,0 270,0 148,1 6,1 6.752,8 4.126,3 514,8 2.110,4 1,4 977,7 212,8 460,2
II 2.406,1 1.983,7 265,3 150,0 7,1 6.846,9 4.207,9 509,7 2.127,6 1,7 1.009,5 216,6 460,4III 2.450,6 2.031,0 262,2 151,4 5,9 6.964,9 4.318,1 504,5 2.141,3 1,0 1.042,2 221,3 465,5IV 2.476,1 2.062,7 256,8 150,1 6,5 7.041,8 4.395,5 492,5 2.152,9 0,9 1.036,9 215,2 467,8
2019 avg. 2.462,2 2.040,3 264,4 151,0 6,6 6.927,5 4.283,2 507,2 2.135,4 1,7 1.022,8 231,5 461,5sep. 2.450,6 2.031,0 262,2 151,4 5,9 6.964,9 4.318,1 504,5 2.141,3 1,0 1.042,2 221,3 465,5okt. 2.472,4 2.052,6 260,0 151,9 7,9 6.994,8 4.349,4 500,5 2.143,3 1,7 1.048,2 223,0 466,4nov. 2.481,6 2.073,1 251,5 151,4 5,6 7.026,7 4.382,6 497,1 2.145,2 1,7 1.022,2 227,6 472,4dec. 2.476,1 2.062,7 256,8 150,1 6,5 7.041,8 4.395,5 492,5 2.152,9 0,9 1.036,9 215,2 467,8
2020 jan. (p) 2.475,1 2.064,0 256,3 150,7 4,1 7.062,2 4.421,7 487,2 2.152,5 0,9 1.024,3 218,1 469,3Transakcije
2017 180,7 182,4 -1,9 -0,8 0,9 254,7 304,7 -82,1 33,6 -1,5 54,9 7,2 26,72018 93,1 105,4 -9,7 -1,1 -1,4 326,5 324,8 -45,0 46,1 0,5 0,5 -3,9 19,12019 146,0 163,5 -18,8 1,8 -0,5 395,2 358,3 -25,7 63,2 -0,5 29,0 10,9 30,22019 I 46,9 54,4 -7,4 0,7 -0,9 106,7 89,7 -3,2 20,3 0,0 -24,5 9,2 24,0
II 29,5 30,5 -4,3 2,2 1,1 94,1 82,1 -5,1 16,7 0,3 31,7 4,0 0,0III 40,4 43,6 -2,9 1,0 -1,3 116,9 109,6 -6,0 13,9 -0,6 25,0 3,9 4,4IV 29,3 35,0 -4,2 -2,2 0,7 77,5 76,9 -11,5 12,3 -0,2 -3,2 -6,2 1,8
2019 avg. 31,1 30,5 -0,1 0,6 0,1 33,4 32,6 -1,6 2,5 -0,1 11,8 10,6 3,6sep. -13,2 -10,4 -2,3 0,1 -0,7 37,0 34,5 -2,9 6,1 -0,7 16,8 -10,7 3,3okt. 24,2 24,0 -1,5 -0,4 2,1 30,1 30,4 -3,7 2,7 0,7 8,0 1,6 0,4nov. 7,6 19,4 -8,9 -0,5 -2,4 31,1 33,0 -3,6 1,7 0,0 -28,5 4,2 6,0dec. -2,5 -8,4 6,2 -1,4 1,0 16,3 13,5 -4,2 7,9 -0,8 17,4 -12,0 -4,6
2020 jan. (p) -3,3 -0,3 -1,2 0,6 -2,4 19,3 25,6 -5,8 -0,5 0,0 -15,2 2,6 1,5Stopnje rasti
2017 8,6 11,2 -0,7 -0,5 11,5 4,2 9,0 -12,7 1,7 -65,1 5,8 3,6 6,92018 4,2 5,9 -3,5 -0,7 -16,5 5,2 8,8 -8,0 2,3 67,7 0,0 -1,9 4,62019 6,3 8,6 -6,8 1,2 -6,8 5,9 8,9 -5,0 3,0 -36,8 2,9 5,4 6,92019 I 5,9 7,6 -2,3 0,2 -17,1 5,7 8,9 -5,6 2,9 -17,2 -2,2 0,6 10,3
II 5,8 7,6 -4,6 2,3 12,2 5,8 8,6 -4,9 3,1 72,0 -1,0 -1,3 7,6III 6,3 8,0 -2,6 2,6 -11,8 6,3 9,3 -4,1 3,2 -10,1 3,6 4,3 6,7IV 6,3 8,6 -6,8 1,2 -6,8 5,9 8,9 -5,0 3,0 -36,8 2,9 5,4 6,9
2019 avg. 7,8 9,6 -2,0 2,4 3,1 6,2 9,2 -4,0 3,0 6,1 3,2 8,9 6,2sep. 6,3 8,0 -2,6 2,6 -11,8 6,3 9,3 -4,1 3,2 -10,1 3,6 4,3 6,7okt. 7,2 9,0 -3,8 2,3 31,9 6,2 9,2 -4,1 3,1 30,9 4,2 6,6 5,9nov. 7,0 9,7 -8,3 2,1 -24,6 6,3 9,4 -4,2 2,9 30,5 1,2 8,8 6,0dec. 6,3 8,6 -6,8 1,2 -6,8 5,9 8,9 -5,0 3,0 -36,8 2,9 5,4 6,9
2020 jan. (p) 6,1 8,3 -5,4 1,3 -41,1 5,7 8,7 -6,1 2,7 -42,5 3,3 5,2 5,7

S20ECB Ekonomski bilten, številka 2 / 2020 - Statistični podatki
5 Denarna statistika
5.3 Krediti rezidentom euroobmočja1)
(v milijardah EUR in letne stopnje rasti; desezonirano; stanja in stopnje rasti ob koncu obdobja; transakcije v obdobju)
Vir: ECB.1) Podatki se nanašajo na spreminjajočo se sestavo euroobmočja. 2) Prilagojeno za prodajo in listinjenje posojil (zaradi tega se v statistični bilanci stanja denarnih finančnih institucij odpravi pripoznanje posojil) ter za pozicije, ki izhajajo iz storitev
navideznega združevanja denarnih sredstev v denarnih finančnih institucijah 3) V skladu z ESR 2010 so se holdinške družbe nefinančnih skupin decembra 2014 prerazvrstile iz sektorja nefinančnih družb v sektor finančnih družb. Ti subjekti so vključeni v
statistične podatke bilanc stanja DFI skupaj s finančnimi družbami, ki niso DFI ter zavarovalnice in pokojninski skladi.4) Vključno z nepridobitnimi ustanovami, ki delujejo za gospodinjstva.
Posojila državi Posojila drugim finančnim posrednikom v euroobmočjuSkupaj Posojila Dolžniški
vrednostni papirji
Skupaj Posojila Dolžniški vrednostni
papirji
Lastniški kapital in
delnice investicijs-
kih skladov (brez skladov
denarnega trga)
Skupaj Nefinančnim družbam3)
Gospodinj-stvom4)
Drugim finančnim pos-
rednikom, razen zavarovalnicam in pokojninskim
skladom3)
Zavaroval-nicam in
pokojninskim skladom
Prila-gojena
posojila2)
1 2 3 4 5 6 7 8 9 10 11 12Stanja
2017 4.617,2 1.032,3 3.571,0 13.114,0 10.870,5 11.165,0 4.323,5 5.600,2 838,0 108,7 1.440,4 803,22018 4.676,7 1.006,2 3.659,0 13.415,9 11.122,4 11.481,3 4.404,7 5.742,0 848,9 126,8 1.517,9 775,62019 4.652,5 984,5 3.656,3 13.865,5 11.452,1 11.836,9 4.472,6 5.930,9 896,0 152,6 1.560,5 852,92019 I 4.662,4 1.001,5 3.649,4 13.527,0 11.201,0 11.556,6 4.426,2 5.787,7 856,3 130,7 1.527,2 798,8
II 4.640,2 1.000,7 3.627,8 13.640,4 11.290,6 11.665,4 4.462,4 5.825,8 870,3 132,1 1.546,7 803,2III 4.696,5 999,8 3.685,1 13.775,6 11.394,4 11.762,6 4.488,5 5.876,3 883,4 146,2 1.569,8 811,5IV 4.652,5 984,5 3.656,3 13.865,5 11.452,1 11.836,9 4.472,6 5.930,9 896,0 152,6 1.560,5 852,9
2019 avg. 4.707,6 1.003,8 3.692,1 13.737,0 11.388,3 11.748,3 4.505,0 5.864,6 878,3 140,4 1.545,2 803,5sep. 4.696,5 999,8 3.685,1 13.775,6 11.394,4 11.762,6 4.488,5 5.876,3 883,4 146,2 1.569,8 811,5okt. 4.665,1 1.001,9 3.651,5 13.817,4 11.423,3 11.786,6 4.502,4 5.895,0 887,1 138,9 1.560,4 833,7nov. 4.639,1 1.000,9 3.626,4 13.853,3 11.439,1 11.806,4 4.492,2 5.912,9 888,2 145,8 1.569,9 844,3dec. 4.652,5 984,5 3.656,3 13.865,5 11.452,1 11.836,9 4.472,6 5.930,9 896,0 152,6 1.560,5 852,9
2020 jan. (p) 4.670,3 994,0 3.664,5 13.913,3 11.511,1 11.873,1 4.482,8 5.962,6 912,3 153,5 1.547,6 854,6Transakcije
2017 287,5 -43,7 330,6 363,2 274,2 316,0 84,9 173,2 19,7 -3,5 63,6 25,42018 90,3 -28,4 118,8 374,8 307,4 382,0 124,4 166,3 -1,1 17,8 88,1 -20,72019 -88,3 -23,5 -65,2 453,3 378,9 428,1 114,2 200,3 43,2 21,2 30,5 43,82019 I -30,9 -5,4 -25,6 109,5 92,3 90,7 33,5 49,1 7,4 2,3 0,3 16,9
II -49,5 -1,6 -48,2 123,8 105,6 126,3 50,8 38,8 17,5 -1,5 17,4 0,8III -2,6 -0,9 -1,7 128,8 102,3 105,3 27,3 52,1 9,1 13,9 19,9 6,6IV -5,2 -15,6 10,2 91,2 78,7 105,8 2,7 60,4 9,2 6,5 -7,0 19,5
2019 avg. 5,5 3,2 2,3 50,9 51,7 44,3 20,9 21,3 3,6 5,9 1,5 -2,3sep. -13,8 -3,8 -10,0 38,1 6,3 18,9 -16,0 13,0 3,5 5,7 25,4 6,4okt. -17,5 2,4 -19,9 33,5 36,7 35,7 18,0 20,4 5,5 -7,2 -8,6 5,4nov. -9,6 -0,9 -8,9 33,9 15,6 22,3 -4,0 18,6 -5,9 6,9 9,2 9,1dec. 21,8 -17,1 38,9 23,9 26,4 47,8 -11,3 21,4 9,5 6,9 -7,6 5,0
2020 jan. (p) -9,3 9,3 -18,6 45,1 57,6 35,6 11,5 30,3 15,0 0,8 -14,5 2,0Stopnje rasti
2017 6,6 -4,1 10,2 2,8 2,6 2,9 2,0 3,2 2,4 -3,2 4,6 3,22018 2,0 -2,8 3,4 2,9 2,8 3,4 2,9 3,0 -0,1 16,4 6,1 -2,62019 -1,9 -2,3 -1,8 3,4 3,4 3,7 2,6 3,5 5,1 16,2 2,0 5,62019 I 1,8 -2,4 3,0 2,8 2,7 3,3 2,6 3,1 -1,2 14,7 4,0 1,8
II -0,2 -2,0 0,3 3,0 3,2 3,5 3,3 3,2 1,7 5,9 3,1 1,3III -1,1 -0,5 -1,3 3,2 3,2 3,6 2,9 3,2 3,5 14,4 3,2 2,6IV -1,9 -2,3 -1,8 3,4 3,4 3,7 2,6 3,5 5,1 16,2 2,0 5,6
2019 avg. -0,6 -0,4 -0,7 3,1 3,5 3,8 3,5 3,3 3,1 12,9 1,1 2,1sep. -1,1 -0,5 -1,3 3,2 3,2 3,6 2,9 3,2 3,5 14,4 3,2 2,6okt. -1,4 -0,1 -1,7 3,2 3,3 3,7 3,1 3,3 3,8 11,0 2,0 3,4nov. -1,4 -0,3 -1,7 3,2 3,2 3,6 2,6 3,3 3,6 16,2 2,9 4,2dec. -1,9 -2,3 -1,8 3,4 3,4 3,7 2,6 3,5 5,1 16,2 2,0 5,6
2020 jan. (p) -1,9 -1,3 -2,1 3,4 3,5 3,8 2,6 3,7 4,9 16,7 1,1 5,8
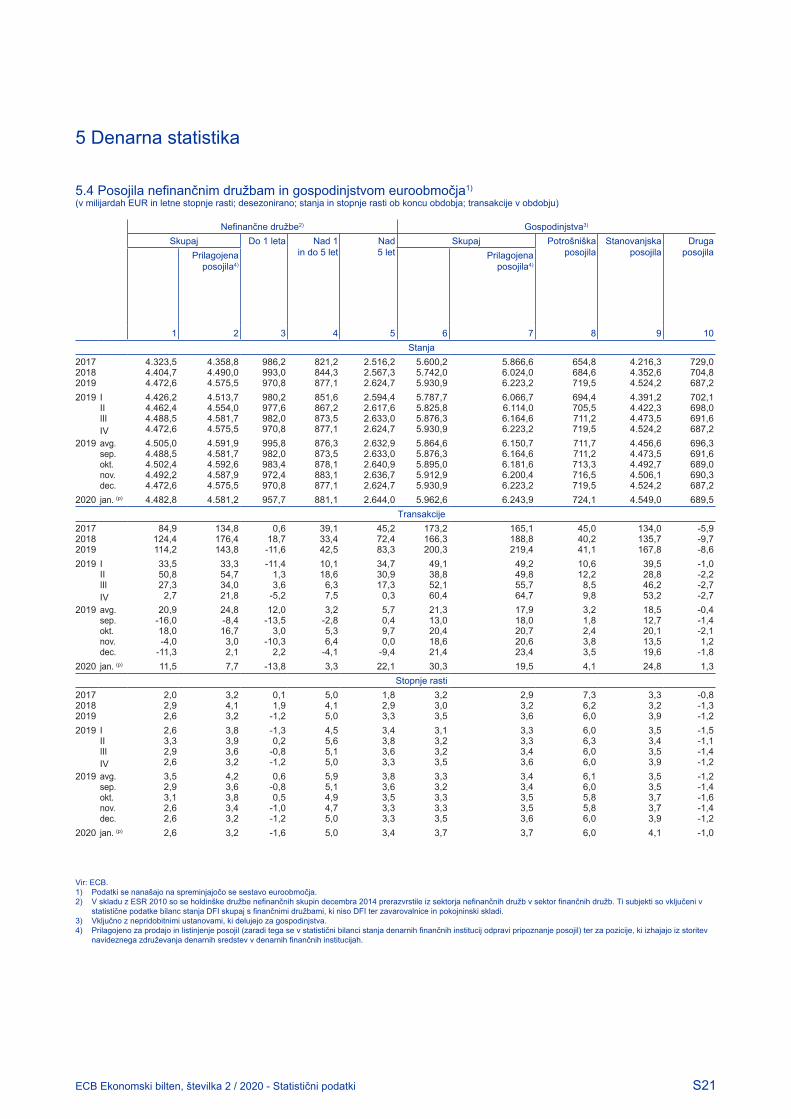
S21ECB Ekonomski bilten, številka 2 / 2020 - Statistični podatki
5 Denarna statistika
5.4 Posojila nefinančnim družbam in gospodinjstvom euroobmočja1)
(v milijardah EUR in letne stopnje rasti; desezonirano; stanja in stopnje rasti ob koncu obdobja; transakcije v obdobju)
Vir: ECB.1) Podatki se nanašajo na spreminjajočo se sestavo euroobmočja. 2) V skladu z ESR 2010 so se holdinške družbe nefinančnih skupin decembra 2014 prerazvrstile iz sektorja nefinančnih družb v sektor finančnih družb. Ti subjekti so vključeni v
statistične podatke bilanc stanja DFI skupaj s finančnimi družbami, ki niso DFI ter zavarovalnice in pokojninski skladi.3) Vključno z nepridobitnimi ustanovami, ki delujejo za gospodinjstva.4) Prilagojeno za prodajo in listinjenje posojil (zaradi tega se v statistični bilanci stanja denarnih finančnih institucij odpravi pripoznanje posojil) ter za pozicije, ki izhajajo iz storitev
navideznega združevanja denarnih sredstev v denarnih finančnih institucijah.
Nefinančne družbe2) Gospodinjstva3)
Skupaj Do 1 leta Nad 1in do 5 let
Nad 5 let
Skupaj Potrošniška posojila
Stanovanjska posojila
Druga posojilaPrilagojena
posojila4)Prilagojena
posojila4)
1 2 3 4 5 6 7 8 9 10Stanja
2017 4.323,5 4.358,8 986,2 821,2 2.516,2 5.600,2 5.866,6 654,8 4.216,3 729,02018 4.404,7 4.490,0 993,0 844,3 2.567,3 5.742,0 6.024,0 684,6 4.352,6 704,82019 4.472,6 4.575,5 970,8 877,1 2.624,7 5.930,9 6.223,2 719,5 4.524,2 687,22019 I 4.426,2 4.513,7 980,2 851,6 2.594,4 5.787,7 6.066,7 694,4 4.391,2 702,1
II 4.462,4 4.554,0 977,6 867,2 2.617,6 5.825,8 6.114,0 705,5 4.422,3 698,0III 4.488,5 4.581,7 982,0 873,5 2.633,0 5.876,3 6.164,6 711,2 4.473,5 691,6IV 4.472,6 4.575,5 970,8 877,1 2.624,7 5.930,9 6.223,2 719,5 4.524,2 687,2
2019 avg. 4.505,0 4.591,9 995,8 876,3 2.632,9 5.864,6 6.150,7 711,7 4.456,6 696,3sep. 4.488,5 4.581,7 982,0 873,5 2.633,0 5.876,3 6.164,6 711,2 4.473,5 691,6okt. 4.502,4 4.592,6 983,4 878,1 2.640,9 5.895,0 6.181,6 713,3 4.492,7 689,0nov. 4.492,2 4.587,9 972,4 883,1 2.636,7 5.912,9 6.200,4 716,5 4.506,1 690,3dec. 4.472,6 4.575,5 970,8 877,1 2.624,7 5.930,9 6.223,2 719,5 4.524,2 687,2
2020 jan. (p) 4.482,8 4.581,2 957,7 881,1 2.644,0 5.962,6 6.243,9 724,1 4.549,0 689,5Transakcije
2017 84,9 134,8 0,6 39,1 45,2 173,2 165,1 45,0 134,0 -5,92018 124,4 176,4 18,7 33,4 72,4 166,3 188,8 40,2 135,7 -9,72019 114,2 143,8 -11,6 42,5 83,3 200,3 219,4 41,1 167,8 -8,62019 I 33,5 33,3 -11,4 10,1 34,7 49,1 49,2 10,6 39,5 -1,0
II 50,8 54,7 1,3 18,6 30,9 38,8 49,8 12,2 28,8 -2,2III 27,3 34,0 3,6 6,3 17,3 52,1 55,7 8,5 46,2 -2,7IV 2,7 21,8 -5,2 7,5 0,3 60,4 64,7 9,8 53,2 -2,7
2019 avg. 20,9 24,8 12,0 3,2 5,7 21,3 17,9 3,2 18,5 -0,4sep. -16,0 -8,4 -13,5 -2,8 0,4 13,0 18,0 1,8 12,7 -1,4okt. 18,0 16,7 3,0 5,3 9,7 20,4 20,7 2,4 20,1 -2,1nov. -4,0 3,0 -10,3 6,4 0,0 18,6 20,6 3,8 13,5 1,2dec. -11,3 2,1 2,2 -4,1 -9,4 21,4 23,4 3,5 19,6 -1,8
2020 jan. (p) 11,5 7,7 -13,8 3,3 22,1 30,3 19,5 4,1 24,8 1,3Stopnje rasti
2017 2,0 3,2 0,1 5,0 1,8 3,2 2,9 7,3 3,3 -0,82018 2,9 4,1 1,9 4,1 2,9 3,0 3,2 6,2 3,2 -1,32019 2,6 3,2 -1,2 5,0 3,3 3,5 3,6 6,0 3,9 -1,22019 I 2,6 3,8 -1,3 4,5 3,4 3,1 3,3 6,0 3,5 -1,5
II 3,3 3,9 0,2 5,6 3,8 3,2 3,3 6,3 3,4 -1,1III 2,9 3,6 -0,8 5,1 3,6 3,2 3,4 6,0 3,5 -1,4IV 2,6 3,2 -1,2 5,0 3,3 3,5 3,6 6,0 3,9 -1,2
2019 avg. 3,5 4,2 0,6 5,9 3,8 3,3 3,4 6,1 3,5 -1,2sep. 2,9 3,6 -0,8 5,1 3,6 3,2 3,4 6,0 3,5 -1,4okt. 3,1 3,8 0,5 4,9 3,5 3,3 3,5 5,8 3,7 -1,6nov. 2,6 3,4 -1,0 4,7 3,3 3,3 3,5 5,8 3,7 -1,4dec. 2,6 3,2 -1,2 5,0 3,3 3,5 3,6 6,0 3,9 -1,2
2020 jan. (p) 2,6 3,2 -1,6 5,0 3,4 3,7 3,7 6,0 4,1 -1,0

S22ECB Ekonomski bilten, številka 2 / 2020 - Statistični podatki
5 Denarna statistika
5.5 Protipostavke M3 (brez posojil drugim finančnim posrednikom v euroobmočju)1)
(v milijardah EUR in letne stopnje rasti, če ni navedeno drugače; desezonirano; stanja in stopnje rasti ob koncu obdobja; transakcije v obdobju)
Vir: ECB. 1) Podatki se nanašajo na spreminjajočo se sestavo euroobmočja. 2) Vključuje vloge centralne ravni držav v sektorju DFI in vrednostne papirje centralne ravni držav, ki jih je izdal sektor DFI. 3) Ni desezonirano.
Obveznosti DFI Sredstva DFIEnote
centralne ravni države2)
Dolgoročne finančne obveznosti do drugih finančnih posrednikov v euroobmočju
Neto tuja aktiva Razno
Skupaj Vezane vloge nad 2 leti
Vloge na od-poklic z dobo
odpoklica nad 3 mesece
Dolžniški vrednostni
papirji z zapadlostjo
nad 2 leti
Kapital in rezerve
Skupaj
Repo posli s centralnimi
nasprotnimi strankami3)
Obratne repo transakcije s
centralnimi nasprotnimi strankami3)
1 2 3 4 5 6 7 8 9 10Stanja
2017 342,7 6.771,1 1.967,5 59,8 2.017,5 2.726,2 925,9 324,1 143,5 92,52018 379,3 6.818,7 1.940,7 56,1 2.099,1 2.722,8 1.024,5 452,6 187,0 194,92019 350,3 7.060,6 1.944,2 51,3 2.156,0 2.909,1 1.481,9 410,0 178,9 187,22019 I 370,0 6.907,5 1.937,5 55,9 2.146,3 2.767,8 1.188,6 425,9 199,0 212,3
II 373,7 6.985,0 1.956,9 57,5 2.135,4 2.835,2 1.320,7 447,4 191,5 207,8III 388,0 7.100,2 1.947,3 57,2 2.162,2 2.933,6 1.489,2 440,8 184,2 198,1IV 350,3 7.060,6 1.944,2 51,3 2.156,0 2.909,1 1.481,9 410,0 178,9 187,2
2019 avg. 403,4 7.060,7 1.917,2 57,3 2.148,4 2.937,7 1.470,7 423,1 212,6 231,5sep. 388,0 7.100,2 1.947,3 57,2 2.162,2 2.933,6 1.489,2 440,8 184,2 198,1okt. 380,5 7.075,9 1.948,6 53,1 2.151,3 2.922,8 1.491,5 453,4 221,4 236,2nov. 369,1 7.077,7 1.951,0 52,6 2.162,6 2.911,5 1.500,9 456,9 211,8 224,8dec. 350,3 7.060,6 1.944,2 51,3 2.156,0 2.909,1 1.481,9 410,0 178,9 187,2
2020 jan. (p) 372,8 7.114,8 1.946,0 50,0 2.165,8 2.953,0 1.544,3 412,1 171,1 182,3Transakcije
2017 39,0 -73,4 -83,5 -6,6 -71,1 87,8 -97,8 -56,4 -61,2 -28,52018 40,5 56,3 -37,8 -4,9 16,0 83,0 87,7 38,7 16,2 23,62019 -28,2 107,8 -6,1 -3,0 27,5 89,5 341,1 -16,3 -2,7 -2,52019 I -9,1 45,5 -11,4 -0,2 37,6 19,5 127,5 -29,2 2,7 5,5
II 3,8 46,0 22,0 1,6 -0,6 22,9 101,3 44,1 -7,1 -4,5III 14,6 11,9 -15,4 -1,0 4,8 23,6 95,7 13,1 6,9 7,4IV -37,5 4,4 -1,4 -3,3 -14,3 23,4 16,6 -44,3 -5,3 -10,9
2019 avg. 29,0 -20,8 -17,1 -0,4 -7,7 4,4 19,1 27,7 6,1 7,4sep. -15,1 37,9 28,1 -0,9 3,6 7,0 20,3 13,0 -14,1 -16,3okt. -7,3 -8,8 3,0 -1,5 -19,0 8,7 24,9 5,2 37,3 38,1nov. -11,3 17,4 1,2 -0,6 1,7 15,1 10,7 -1,1 -9,7 -11,3dec. -18,9 -4,2 -5,6 -1,3 3,0 -0,4 -18,9 -48,4 -32,8 -37,7
2020 jan. (p) 22,6 -6,9 -3,1 -1,3 2,6 -5,1 22,4 4,9 -7,8 -4,9Stopnje rasti
2017 12,6 -1,1 -4,0 -9,6 -3,4 3,4 - - -29,8 -23,52018 11,8 0,8 -1,9 -8,1 0,8 3,1 - - 8,1 7,72019 -7,4 1,6 -0,3 -5,4 1,3 3,2 - - -1,5 -1,52019 I 8,9 1,4 -1,7 -6,4 2,5 3,1 - - 17,8 21,2
II 12,6 2,3 -0,4 -1,3 3,1 3,7 - - 5,1 6,7III -3,2 1,9 -0,3 -0,7 2,2 3,3 - - 6,9 11,0IV -7,4 1,6 -0,3 -5,4 1,3 3,2 - - -1,5 -1,5
2019 avg. 5,6 1,8 -2,2 0,4 3,4 3,5 - - 11,9 15,6sep. -3,2 1,9 -0,3 -0,7 2,2 3,3 - - 6,9 11,0okt. -2,9 1,6 -0,1 -2,8 1,1 3,2 - - 36,4 38,9nov. -4,4 1,8 0,2 -2,6 1,2 3,4 - - 11,1 12,8dec. -7,4 1,6 -0,3 -5,4 1,3 3,2 - - -1,5 -1,5
2020 jan. (p) -1,2 1,2 -0,2 -7,1 0,6 2,7 - - -11,5 -10,3

S23ECB Ekonomski bilten, številka 2 / 2020 - Statistični podatki
6 Državne finance
6.1 Primanjkljaj/presežek(odstotek BDP; tokovi v obdobju enega leta)
Viri: ECB (letni podatki) in Eurostat (četrtletni podatki).
6.2 Prihodki in odhodki(odstotek BDP; tokovi v obdobju enega leta)
Viri: ECB (letni podatki) in Eurostat (četrtletni podatki).
Prihodki OdhodkiSkupaj Tekoči prihodki Kapitalski
prihodkiSkupaj Tekoči odhodki Investicijski
odhodki
2
Neposrednidavki
Posrednidavki
Neto socialni
prispevki
8
Sredstva za zaposlene
Vmesna poraba
Obresti Socialni prejemki
7 131 3 4 5 6 9 10 11 122015 46,4 45,8 12,5 13,0 15,2 0,6 48,4 44,5 10,1 5,3 2,3 22,7 3,92016 46,2 45,7 12,6 13,0 15,3 0,5 47,7 44,1 10,0 5,3 2,1 22,7 3,62017 46,2 45,8 12,8 13,0 15,2 0,4 47,2 43,4 9,9 5,3 1,9 22,5 3,82018 46,5 46,0 13,0 13,0 15,2 0,5 47,0 43,3 9,9 5,3 1,8 22,3 3,72018 IV 46,5 46,0 13,0 13,0 15,2 0,5 47,0 43,3 9,9 5,3 1,8 22,3 3,72019 I 46,4 46,0 12,9 13,1 15,2 0,5 47,0 43,3 9,9 5,3 1,8 22,4 3,7
II 46,4 46,0 12,9 13,0 15,2 0,4 47,1 43,4 9,9 5,3 1,8 22,5 3,7III 46,4 45,9 12,9 13,1 15,1 0,4 47,1 43,4 9,9 5,3 1,7 22,5 3,7
6.3 Javni dolg(odstotek BDP; stanje ob koncu obravnavanega obdobja)
Viri: ECB (letni podatki) in Eurostat (četrtletni podatki).
Skupaj Finančni instrument Imetnik Izvirna dospelost Preostala dospelost ValuteGotovinain vloge
Posojila Dolžniškivrednostni
papirji
Domači upniki Drugi upniki
Do1 leta
Nad1 leto
Do1 leta
Nad 1 in do 5 let
Nad5 let
Euro ali valute sodelujočih držav
članic
DrugevaluteDFI
1 2 3 4 5 6 7 8 9 10 11 12 13 142015 90,8 3,4 16,5 71,0 45,0 27,6 45,8 9,7 81,2 18,3 31,1 41,4 88,8 2,12016 90,0 3,3 15,7 71,0 47,5 30,8 42,5 9,4 80,6 17,9 29,8 42,3 87,9 2,12017 87,8 3,2 14,5 70,1 48,2 32,2 39,5 8,6 79,1 16,4 29,0 42,3 86,0 1,82018 85,9 3,1 13,8 69,0 48,0 32,4 37,8 8,0 77,8 16,1 28,3 41,4 84,5 1,42018 IV 85,9 3,1 13,8 69,0 . . . . . . . . . .2019 I 86,5 3,1 13,6 69,8 . . . . . . . . . .
II 86,4 3,1 13,5 69,8 . . . . . . . . . .III 86,1 3,2 13,3 69,5 . . . . . . . . . .
Primanjkljaj (–)/presežek (+) Zaznamek: primarni primanjkljaj (–)/
presežek (+)Skupaj Centralna država Federalna država Lokalna država Skladi socialne varnosti
1 2 3 4 5 62015 -2,0 -1,9 -0,2 0,2 -0,1 0,32016 -1,4 -1,7 0,0 0,2 0,1 0,72017 -0,9 -1,3 0,1 0,2 0,1 1,02018 -0,5 -1,1 0,1 0,2 0,3 1,32018 IV -0,5 . . . . 1,32019 I -0,6 . . . . 1,2
II -0,7 . . . . 1,1III -0,8 . . . . 1,0

S24ECB Ekonomski bilten, številka 2 / 2020 - Statistični podatki
6 Državne finance
6.4 Sprememba dolga in odločilni dejavniki1)
(odstotek BDP; tokovi v obdobju enega leta)
Viri: ECB (letni podatki) in Eurostat (četrtletni podatki).1) Posojanje med državami v kontekstu finančne krize je konsolidirano, razen pri četrtletnih podatkih o prilagoditvi med primanjkljajem in dolgom. 2) Izračunano kot razlika v razmerju med javnim dolgom in BDP med koncem referenčnega obdobja in letom pred tem.
Spremembadolga 2)
Primanjkljaj (-)/presežek
(+)
Prilagoditev primanjkljaja-dolga Obrestnidiferencial
Zaznamek: Potrebe po
zadolževanjuSkupaj Transakcije z glavnimi finančnimi instrumenti Učinki prevredno-
tenja in drugespremembe
v obsegu
RaznoSkupaj Gotovina
in vloge
Posojila Dolžniškivrednostni
papirji
Lastniški kapital in delnice
investicijskih skladov
1 2 3 4 5 6 7 8 9 10 11 122015 -1,9 -0,3 -0,8 -0,5 0,2 -0,3 -0,3 -0,1 0,0 -0,3 -0,8 1,22016 -0,8 -0,7 0,2 0,1 0,3 -0,1 0,0 0,1 0,0 0,0 -0,3 1,62017 -2,3 -1,0 -0,1 0,3 0,5 0,0 -0,2 0,1 -0,1 -0,3 -1,1 0,92018 -1,9 -1,3 0,4 0,3 0,4 -0,1 0,0 0,2 0,0 0,1 -0,9 0,82018 IV -1,9 -1,3 0,4 0,5 0,4 -0,1 0,0 0,2 0,0 -0,1 -0,9 0,82019 I -1,3 -1,2 0,7 0,6 0,6 -0,1 0,0 0,2 0,1 0,0 -0,8 1,2
II -0,9 -1,1 0,8 0,8 0,7 -0,1 0,0 0,2 0,1 0,0 -0,6 1,5III -1,1 -1,0 0,6 0,4 0,2 -0,1 0,0 0,2 0,0 0,3 -0,8 1,4
6.5 Državni dolžniški vrednostni papirji1)
(servisiranje dolga kot odstotek BDP; povprečna preostala zapadlost v letih; povprečna nominalna donosnost v odstotkih na leto)
Vir: ECB.1) Po nominalni vrednosti in nekonsolidirano znotraj sektorja širše opredeljene države. 2) Ne vključuje prihodnjih plačil iz dolžniških vrednostnih papirjev, ki še niso zapadli, ter predčasnih odkupov. 3) Preostala zapadlost ob koncu obdobja. 4) Stanje ob koncu obdobja; transakcije kot 12-mesečno povprečje
Servisiranje dolga do enega leta 2) Povprečna preostala
zapadlost 3)
Povprečna nominalna donosnost4)
Skupaj Glavnica Obresti Stanje TransakcijeDo
3 mesecev
4
Do 3 mesecev
Skupaj Variabilna obrestna
mera
Brezkuponski Fiksna obrestna mera Izdaje Odkupi
10
Do 1 leta
1 2 3 5 6 7 8 9 11 12 132017 12,9 11,2 4,2 1,7 0,4 7,1 2,4 1,1 -0,2 2,8 2,3 0,3 1,12018 12,6 11,1 3,7 1,5 0,4 7,3 2,3 1,1 -0,1 2,7 2,5 0,4 0,92019 12,6 11,2 3,8 1,4 0,4 7,5 2,1 1,3 -0,1 2,4 2,1 0,3 1,12018 IV 12,6 11,1 3,7 1,5 0,4 7,3 2,3 1,1 -0,1 2,7 2,5 0,4 0,92019 I 12,7 11,2 3,8 1,5 0,4 7,4 2,3 1,1 0,0 2,6 2,5 0,5 1,0
II 12,9 11,4 3,7 1,5 0,4 7,4 2,3 1,3 0,0 2,6 2,3 0,5 0,9III 13,1 11,6 3,9 1,5 0,4 7,4 2,2 1,3 -0,1 2,5 2,1 0,3 1,0
2019 avg. 12,9 11,4 4,2 1,5 0,4 7,4 2,2 1,3 -0,1 2,6 2,3 0,4 1,1sep. 13,1 11,6 3,9 1,5 0,4 7,4 2,2 1,3 -0,1 2,5 2,1 0,3 1,0okt. 12,8 11,3 3,5 1,5 0,4 7,5 2,2 1,3 -0,1 2,5 2,1 0,3 1,2nov. 12,9 11,5 3,5 1,4 0,4 7,5 2,1 1,3 -0,1 2,4 2,0 0,3 1,2dec. 12,6 11,2 3,8 1,4 0,4 7,5 2,1 1,3 -0,1 2,4 2,1 0,3 1,1
2020 jan. 12,6 11,2 4,2 1,4 0,4 7,5 2,1 1,3 -0,1 2,4 2,1 0,2 1,1

S25ECB Ekonomski bilten, številka 2 / 2020 - Statistični podatki
Belgija Nemčija Estonija Irska Grčija Španija Francija Italija Ciper1 2 3 4 5 6 7 8 9
Javnofinančni primanjkljaj (-)/presežek (+)2015 -2,4 0,9 0,1 -1,9 -5,6 -5,2 -3,6 -2,6 -1,02016 -2,4 1,2 -0,5 -0,7 0,5 -4,3 -3,5 -2,4 0,12017 -0,7 1,2 -0,8 -0,3 0,7 -3,0 -2,8 -2,4 1,72018 -0,7 1,9 -0,6 0,1 1,0 -2,5 -2,5 -2,2 -4,42018 IV -0,8 1,9 -0,6 0,1 1,0 -2,5 -2,5 -2,2 -4,42019 I -1,1 1,8 -0,7 0,1 0,3 -2,6 -2,9 -2,2 -3,8
II -1,5 1,7 -0,6 0,7 0,5 -2,9 -3,2 -2,1 -3,6III -1,7 1,6 -0,4 1,0 0,8 -2,8 -3,3 -2,1 3,7
Javni dolg2015 105,2 72,1 10,0 76,7 175,9 99,3 95,6 135,3 107,52016 104,9 69,2 10,2 73,9 178,5 99,2 98,0 134,8 103,42017 101,8 65,3 9,3 67,8 176,2 98,6 98,4 134,1 93,92018 100,0 61,9 8,4 63,6 181,2 97,6 98,4 134,8 100,62018 IV 102,1 61,9 8,4 63,6 181,2 97,6 98,4 134,8 100,62019 I 103,1 61,7 8,0 65,4 182,0 98,9 99,7 136,5 103,1
II 102,5 61,1 9,3 63,9 179,6 98,9 99,6 138,0 107,0III 102,3 61,2 9,2 62,6 178,2 97,9 100,5 137,3 97,8
Latvija Litva Luksemburg Malta Nizozemska Avstrija Portugalska Slovenija Slovaška Finska10 11 12 13 14 15 16 17 18 19
Javnofinančni primanjkljaj (-)/presežek (+)2015 -1,4 -0,3 1,4 -1,0 -2,0 -1,0 -4,4 -2,8 -2,7 -2,42016 0,1 0,2 1,8 0,9 0,0 -1,5 -1,9 -1,9 -2,5 -1,72017 -0,5 0,5 1,4 3,4 1,3 -0,7 -3,0 0,0 -1,0 -0,72018 -0,7 0,6 2,7 1,9 1,5 0,2 -0,4 0,8 -1,1 -0,82018 IV -0,7 0,6 2,7 1,9 1,5 0,2 -0,4 0,8 -1,1 -0,82019 I -0,7 0,2 3,1 1,7 1,7 0,2 -0,1 0,6 -1,1 -1,1
II -1,0 0,0 3,3 1,2 1,8 -0,1 0,1 0,6 -1,0 -1,4III -0,7 -0,3 2,4 0,8 1,7 0,0 0,1 0,9 -1,2 -2,2
Javni dolg2015 36,7 42,7 22,0 57,8 64,6 84,9 131,2 82,6 51,9 63,02016 40,2 39,9 20,1 55,5 61,9 82,9 131,5 78,7 52,0 62,62017 38,6 39,3 22,3 50,3 56,9 78,3 126,0 74,1 51,3 60,92018 36,4 34,1 21,0 45,8 52,4 74,0 122,2 70,4 49,4 59,02018 IV 36,4 34,1 21,0 45,8 52,4 75,7 122,2 70,4 49,1 59,02019 I 37,7 34,0 20,8 46,2 50,9 74,0 123,7 68,1 49,3 58,9
II 36,7 36,1 20,4 45,4 50,9 72,7 121,1 67,7 48,6 60,9III 36,4 35,9 20,2 43,1 49,3 71,8 120,5 68,1 48,4 59,4
6 Državne finance
6.6 Fiskalna gibanja v državah euroobmočja(kot odstotek BDP; tokovi v obdobju enega leta; stanje ob koncu obravnavanega obdobja)
Vir: Eurostat.

© Evropska centralna banka, 2020
Naslov 60640 Frankfurt na Majni, Nemčija Telefon +49 69 1344 0 Spletna stran www.ecb.europa.eu
Vse pravice so pridržane. Razmnoževanje v izobraževalne in nekomercialne namene je dovoljeno ob navedbi vira.
Za pripravo tega biltena je odgovoren Izvršilni odbor ECB. Prevode pripravljajo in objavljajo nacionalne centralne banke.
Presečni dan za statistične podatke v tej izdaji je 11. marec 2020.
Za specifično terminologijo in kratice glej glosar ECB.
ISSN 2363-3557 (pdf) EU kataloška številka QB-BP-20-101-SL-N (pdf)