texas "big state, big challenges" by nhtsa
TRANSCRIPT

National Highway Traffic Safety Administration
TEXAS “BIG State BIG Challenges”
Frank Marrero Regional Program Manager
Safer Drivers. Safer Cars. Safer Roads.
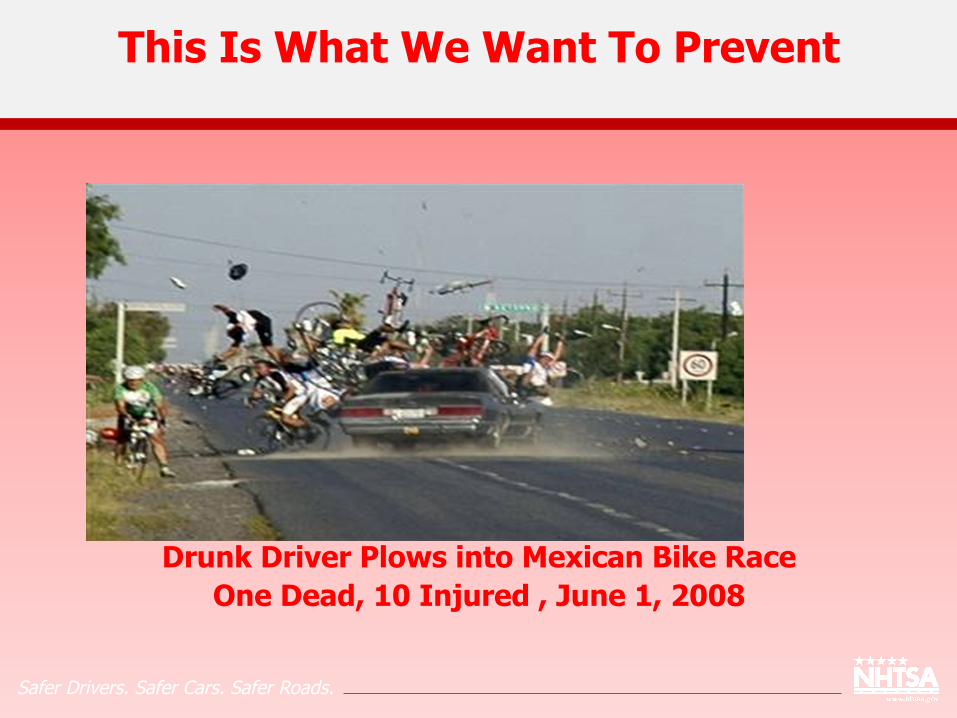
Drunk Driver Plows into Mexican Bike Race One Dead, 10 Injured , June 1, 2008
This Is What We Want To Prevent

Safer Drivers. Safer Cars. Safer Roads.
Safer Drivers. Safer Cars. Safer Roads.
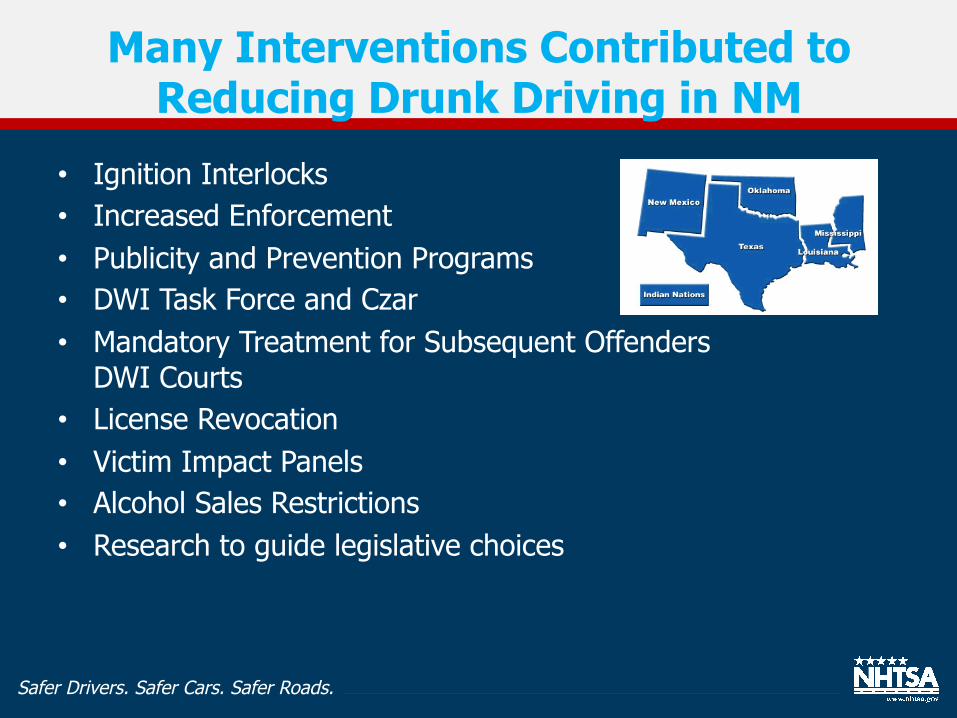
• Ignition Interlocks • Increased Enforcement • Publicity and Prevention Programs • DWI Task Force and Czar • Mandatory Treatment for Subsequent Offenders
DWI Courts • License Revocation • Victim Impact Panels • Alcohol Sales Restrictions • Research to guide legislative choices
Many Interventions Contributed to Reducing Drunk Driving in NM
Safer Drivers. Safer Cars. Safer Roads.
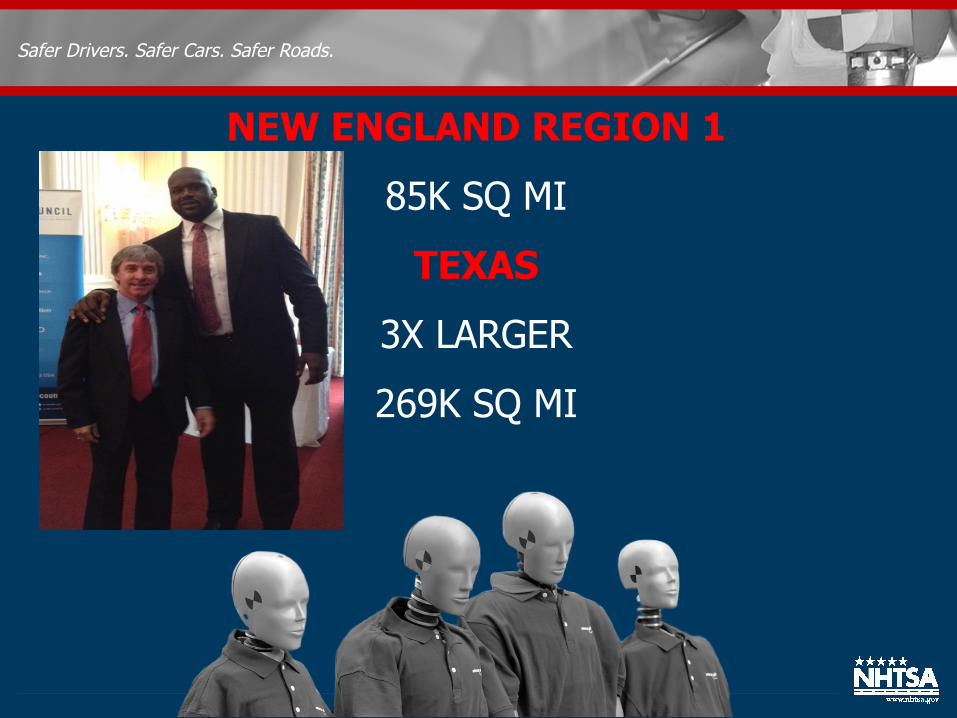
NEW ENGLAND REGION 1
85K SQ MI
TEXAS
3X LARGER
269K SQ MI
Safer Drivers. Safer Cars. Safer Roads.
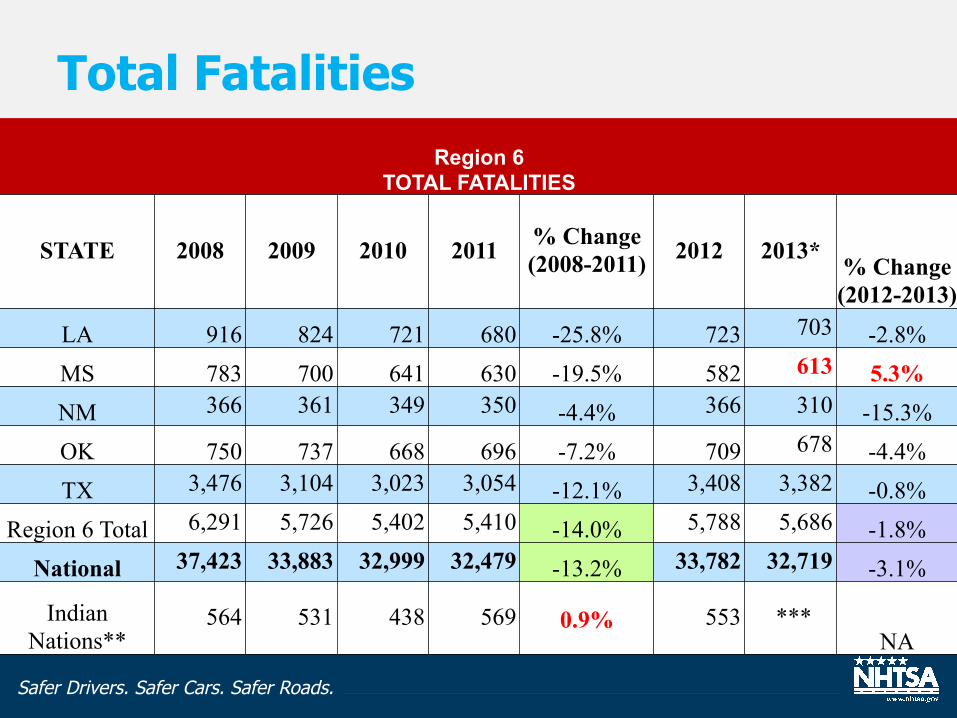
Region 6 TOTAL FATALITIES
STATE 2008 2009 2010 2011 % Change (2008-2011) 2012 2013*
% Change (2012-2013)
LA 916 824 721 680 -25.8% 723 703 -2.8% MS 783 700 641 630 -19.5% 582 613 5.3% NM 366 361 349 350 -4.4% 366 310 -15.3% OK 750 737 668 696 -7.2% 709 678 -4.4% TX 3,476 3,104 3,023 3,054 -12.1% 3,408 3,382 -0.8%
Region 6 Total 6,291 5,726 5,402 5,410 -14.0% 5,788 5,686 -1.8% National 37,423 33,883 32,999 32,479 -13.2% 33,782 32,719 -3.1%
Indian Nations**
564 531 438 569 0.9% 553 *** NA
Total Fatalities

Safer Drivers. Safer Cars. Safer Roads.
Region 6 ALCOHOL IMPAIRED FATALITIES (BAC= .08+)
STATE 2008 2009 2010 2011 % Change (2008-2011) 2012 2013* % Change
(2012-2013)
LA 339 290 226 219 -35.4% 235 234 -0.4% MS 251 233 174 159 -36.7% 191 210 9.9% NM 105 112 119 104 -1.0% 97 93 -4.1% OK 242 229 218 222 -8.3% 209 170 -18.7% TX 1,310 1,253 1,270 1,216 -7.2% 1,290 1,337 3.6%
Region 6 Total 2,247 2,117 2,007 1,920 -14.6% 2,022 2,044 1.1% National 11,711 10,759 10,136 9,865 -15.8% 10,336 10,076 -2.5%
Indian Nations**
242 248 199 246 1.7% 256 *** NA
Alcohol Impaired Fatalities
Safer Drivers. Safer Cars. Safer Roads.
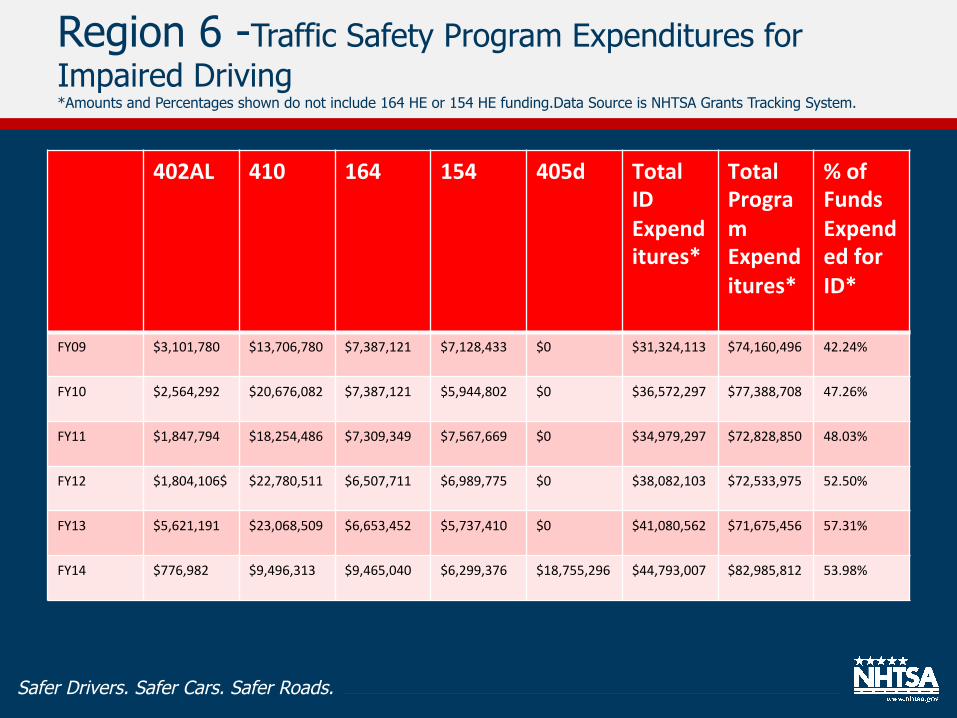
Region 6 -Traffic Safety Program Expenditures for Impaired Driving *Amounts and Percentages shown do not include 164 HE or 154 HE funding.Data Source is NHTSA Grants Tracking System.
402AL
410
164
154
405d
TotalIDExpenditures*
TotalProgramExpenditures*
%ofFundsExpendedforID*
FY09 $3,101,780
$13,706,780
$7,387,121
$7,128,433
$0
$31,324,113
$74,160,496
42.24%
FY10 $2,564,292
$20,676,082
$7,387,121
$5,944,802
$0
$36,572,297
$77,388,708
47.26%
FY11 $1,847,794
$18,254,486
$7,309,349
$7,567,669
$0
$34,979,297
$72,828,850
48.03%
FY12 $1,804,106$ $22,780,511
$6,507,711
$6,989,775
$0
$38,082,103
$72,533,975
52.50%
FY13 $5,621,191
$23,068,509
$6,653,452
$5,737,410
$0
$41,080,562
$71,675,456
57.31%
FY14 $776,982
$9,496,313
$9,465,040
$6,299,376
$18,755,296
$44,793,007
$82,985,812
53.98%
Safer Drivers. Safer Cars. Safer Roads.
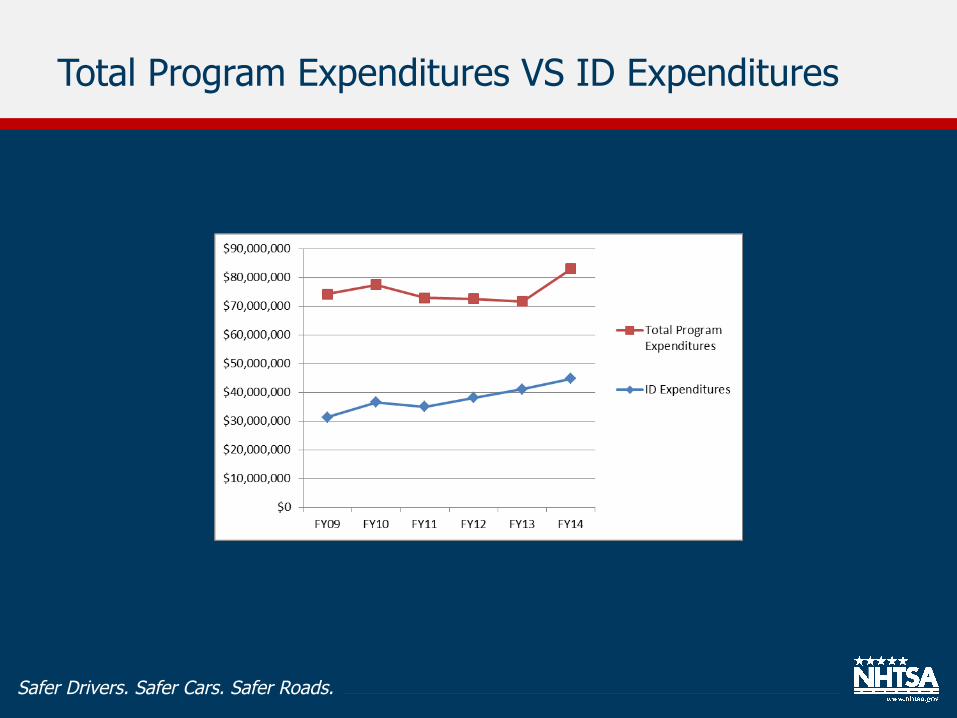
Total Program Expenditures VS ID Expenditures
Safer Drivers. Safer Cars. Safer Roads.
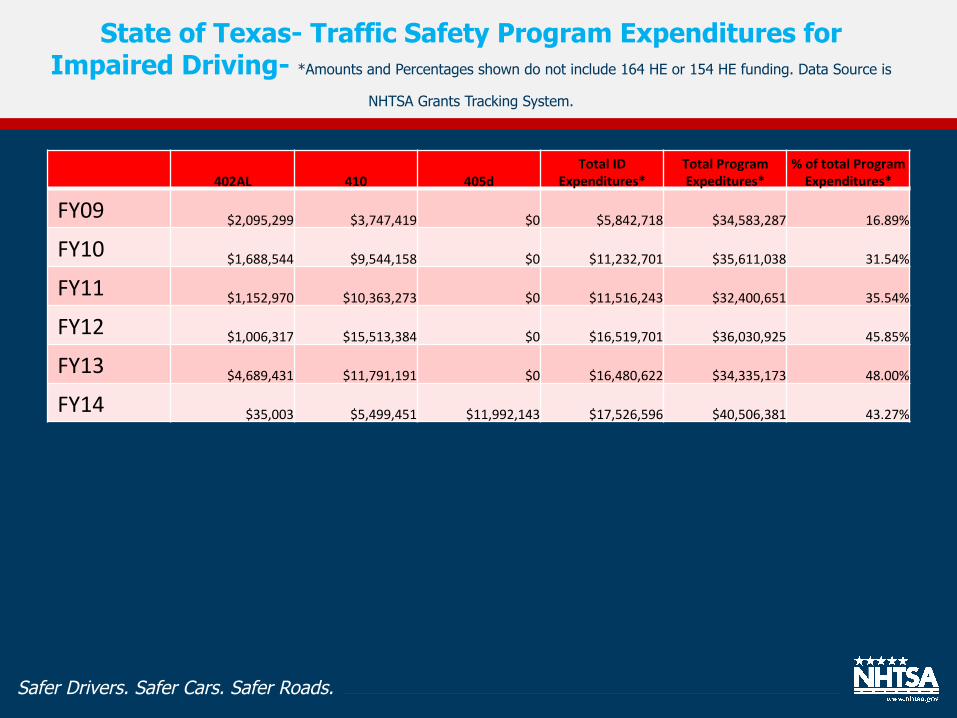
402AL 410 405dTotalID
Expenditures*TotalProgramExpeditures*
%oftotalProgramExpenditures*
FY09 $2,095,299 $3,747,419 $0 $5,842,718 $34,583,287 16.89%
FY10 $1,688,544 $9,544,158 $0 $11,232,701 $35,611,038 31.54%
FY11 $1,152,970 $10,363,273 $0 $11,516,243 $32,400,651 35.54%
FY12 $1,006,317 $15,513,384 $0 $16,519,701 $36,030,925 45.85%
FY13 $4,689,431 $11,791,191 $0 $16,480,622 $34,335,173 48.00%
FY14 $35,003 $5,499,451 $11,992,143 $17,526,596 $40,506,381 43.27%
State of Texas- Traffic Safety Program Expenditures for Impaired Driving- *Amounts and Percentages shown do not include 164 HE or 154 HE funding. Data Source is
NHTSA Grants Tracking System.
Safer Drivers. Safer Cars. Safer Roads.
• Identify Goals • Use Carrots and Sticks • Eliminate Hoops • Close Loopholes • Triage Sanctions • Research
WE NEED TO CONTINUE
Safer Drivers. Safer Cars. Safer Roads.
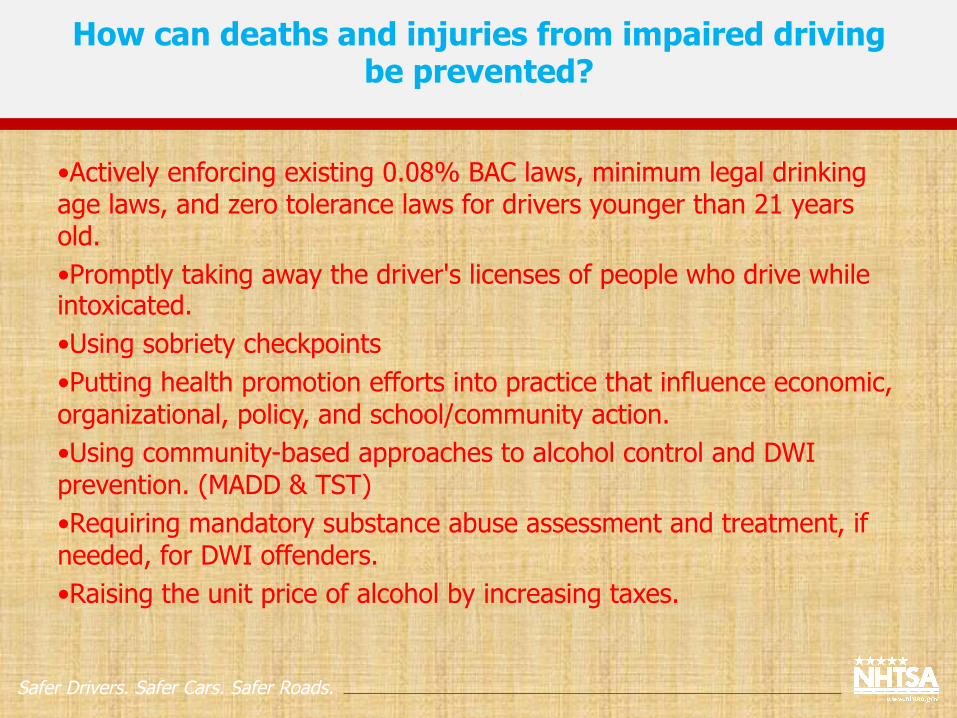
•Actively enforcing existing 0.08% BAC laws, minimum legal drinking age laws, and zero tolerance laws for drivers younger than 21 years old. •Promptly taking away the driver's licenses of people who drive while intoxicated. •Using sobriety checkpoints •Putting health promotion efforts into practice that influence economic, organizational, policy, and school/community action. •Using community-based approaches to alcohol control and DWI prevention. (MADD & TST) •Requiring mandatory substance abuse assessment and treatment, if needed, for DWI offenders. •Raising the unit price of alcohol by increasing taxes.
How can deaths and injuries from impaired driving be prevented?
Safer Drivers. Safer Cars. Safer Roads.
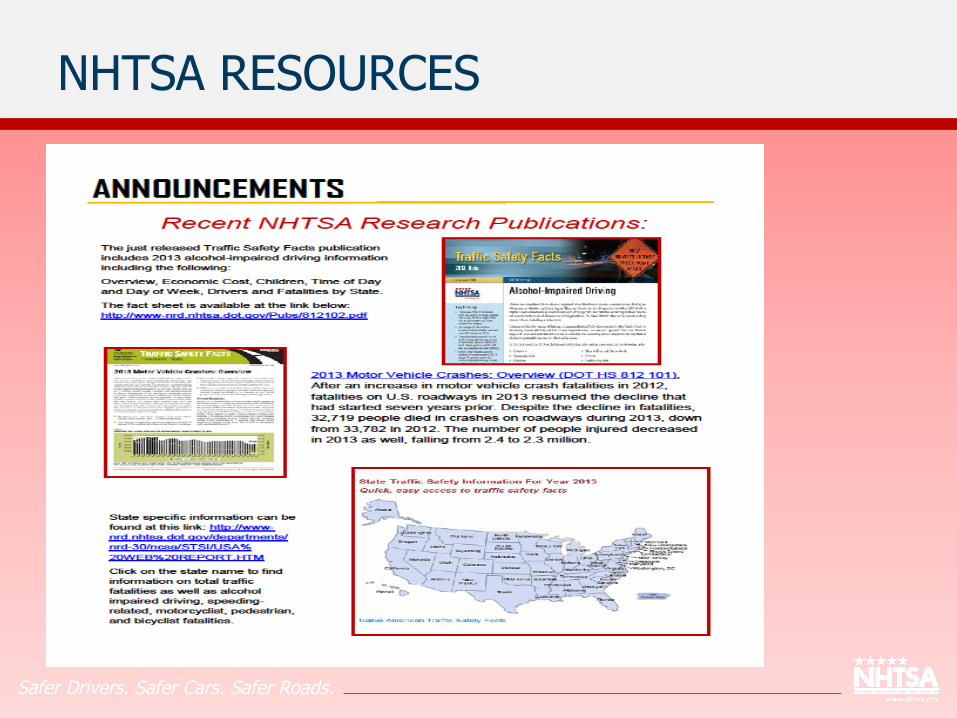
NHTSA RESOURCES

Safer Drivers. Safer Cars. Safer Roads.
NHTSA ACTIVITIES
Safer Drivers. Safer Cars. Safer Roads.
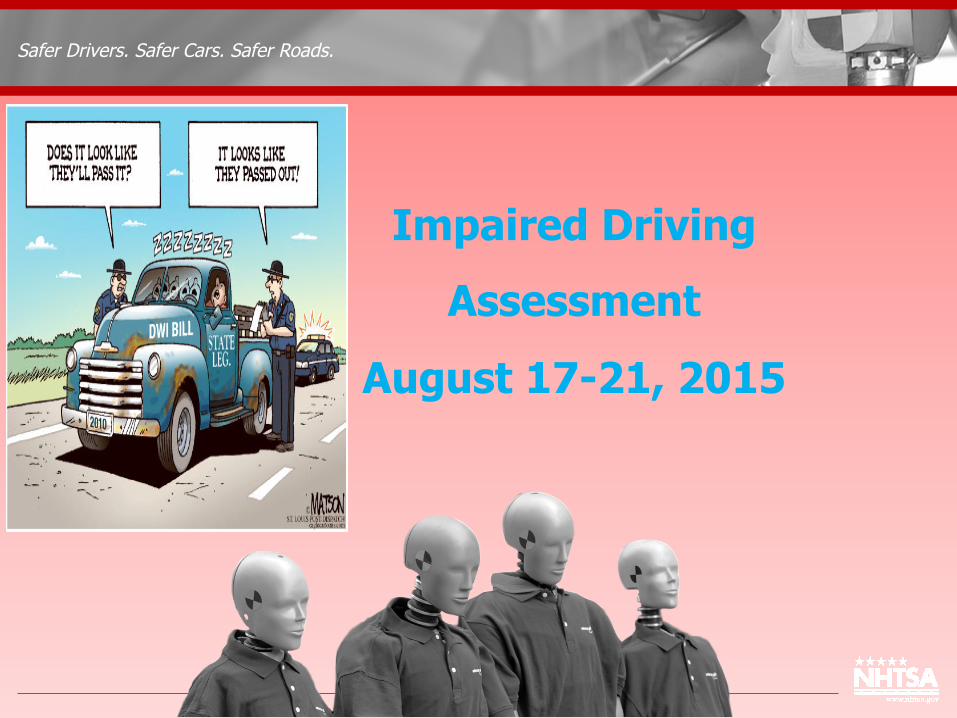
Impaired Driving
Assessment
August 17-21, 2015

Safer Drivers. Safer Cars. Safer Roads.
Can We Strive for Zero Fatalities?

Safer Drivers. Safer Cars. Safer Roads.
ThankYouForYourAEenFon!