texas demographic characteristics and trends: diabetes · comal estimated change of the total...
TRANSCRIPT
American Diabetes Association
March 24, 2015
San Antonio, Texas
Texas Demographic Characteristics and Trends: Diabetes
Year* PopulationNumericChange
AnnualPercentChange
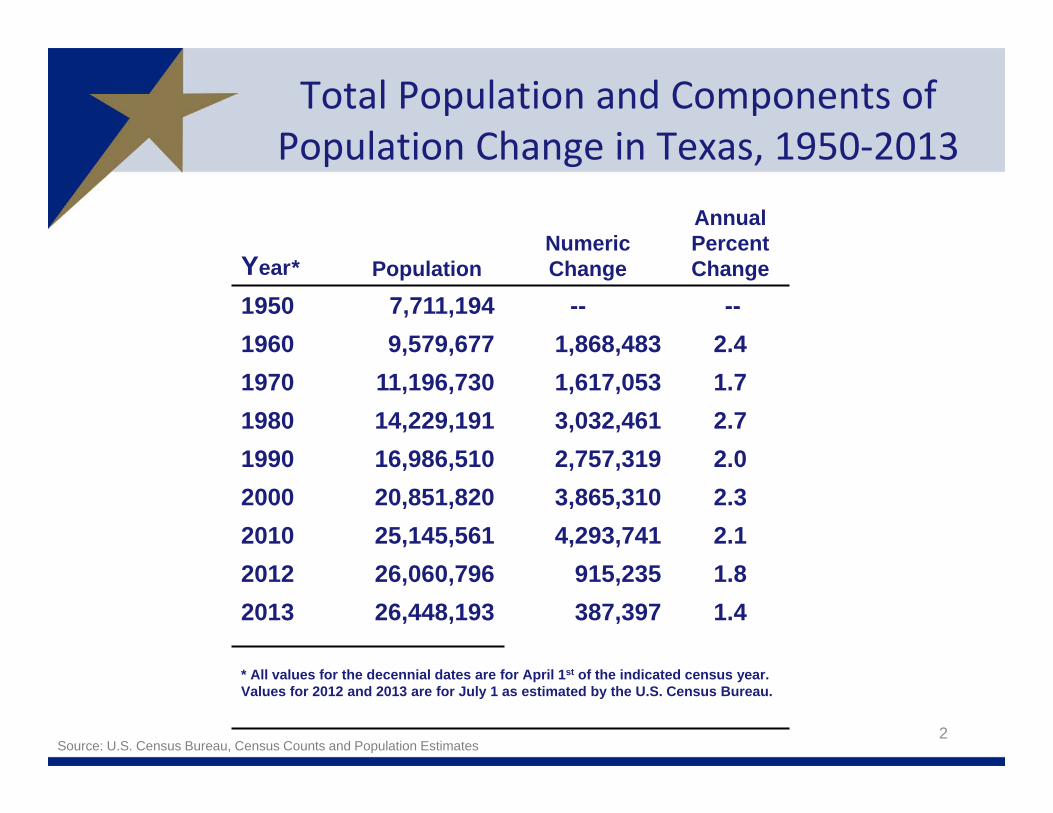
1950 7,711,194 -- --1960 9,579,677 1,868,483 2.41970 11,196,730 1,617,053 1.71980 14,229,191 3,032,461 2.71990 16,986,510 2,757,319 2.02000 20,851,820 3,865,310 2.32010 25,145,561 4,293,741 2.12012 26,060,796 915,235 1.82013 26,448,193 387,397 1.4
* All values for the decennial dates are for April 1st of the indicated census year. Values for 2012 and 2013 are for July 1 as estimated by the U.S. Census Bureau.
Total Population and Components of Population Change in Texas, 1950‐2013
2Source: U.S. Census Bureau, Census Counts and Population Estimates
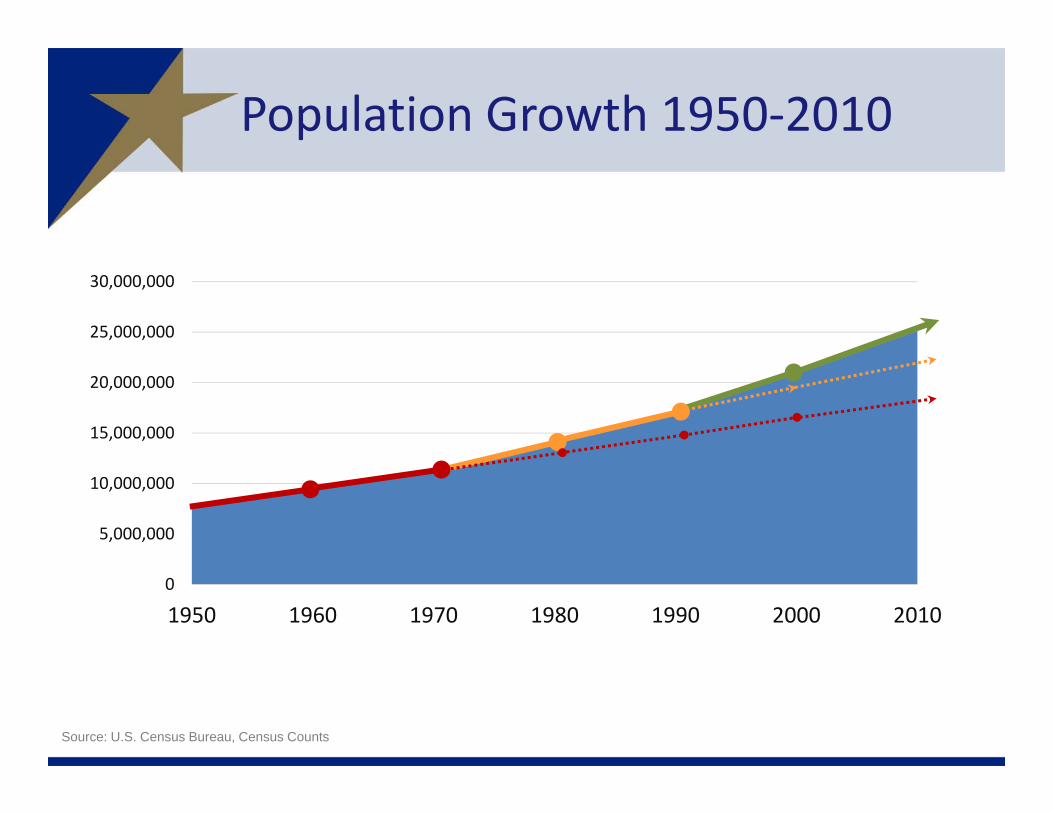
Population Growth 1950‐2010
0
5,000,000
10,000,000
15,000,000
20,000,000
25,000,000
30,000,000
1950 1960 1970 1980 1990 2000 2010
Source: U.S. Census Bureau, Census Counts
Dallas
Howard
FoardFloyd
Brewster
FranklinHunt
Newton
Starr
Kinney
Collingsworth
TomGreen
Coleman
Brazoria
Leon
Duval
Lamb
Morris
Smith
Jackson
Medina
Wheeler
Dallam
Callahan
Lamar
Coryell
Gaines
Kendall
Nacogdoches
Milam
Hays
Willacy
Johnson
Reagan
Webb
Shackelford
Bowie
Scurry
Kenedy
Somervell
Oldham
Taylor
King
Borden
Walker
Stephens
DeafSmith
Roberts
Tyler
ValVerde
Brown
Parker
Harris
Zapata
RedRiver
Karnes
PaloPinto
GlasscockShelby
Wood
Crosby
Refugio
Burnet
Sterling
Montgomery
SanAugustine
Rains
Nueces
Jack
Swisher
Camp
Brazos
Orange
Colorado
Pecos
Cochran
Parmer
FreestoneWinkler
Wichita
Gray
Schleicher
Hardeman
TravisGillespie
Yoakum
Fayette
Uvalde
Grimes
VanZandt
Throckmorton
Falls
Grayson
Ellis
Hall
Dickens
Trinity
Reeves
Marion
Terrell
Lynn
La Salle
Jasper
Jones
Castro
Victoria
Kleberg
Briscoe
Clay
Matagorda
Brooks
Runnels
Carson
Liberty
Lee
Hale
Bexar
Garza
Montague
Upton
Hamilton
FisherDawson
Dimmit
Limestone
Hutchinson
Llano
Presidio
Eastland
Sabine
Wharton
Rusk
Tarrant
Lavaca
Childress
Hidalgo
Kaufman
Moore
Menard
Edwards
SanPatricio
Terry
Crockett
Houston
Waller
Coke
Ward
Titus
Lampasas
Haskell
Martin
Atascosa
HemphillHartley
Young
BurlesonHardin
Gonzales
McMullen
Erath
Galveston
McLennan
Madison
McCulloch
Donley
Kent
Real
Sutton
Midland
Hudspeth
Zavala
Harrison
ComancheMitchell Navarro
Crane
Lubbock
Wise
Washington
JeffDavis
El Paso
Gregg
Williamson
Lipscomb
Mason
Henderson
Hansford
Chambers
Hill
Potter
JimWells
DeltaStonewall
Ector
Cameron
Maverick
Collin
Baylor
Panola
Guadalupe
Bastrop
Austin
Andrews
Anderson
Blanco
DeWitt
Bandera
Bell
Aransas
Archer
Armstrong
Bee
Bailey
Jefferson
Frio
Fannin
Goliad
Loving
Cass
FortBend
Bosque
Hockley
SanSaba
Kerr
Mills
Cooke
Wilbarger
Irion
Caldwell
JimHogg
Culberson
Upshur
Cherokee
Denton
Concho
Randall
Kimble
Knox
Polk
Hood
SanJacinto
Robertson
Wilson
Nolan
Cottle
Calhoun
Rockwall
LiveOak
Motley
Sherman Ochiltree
Comal
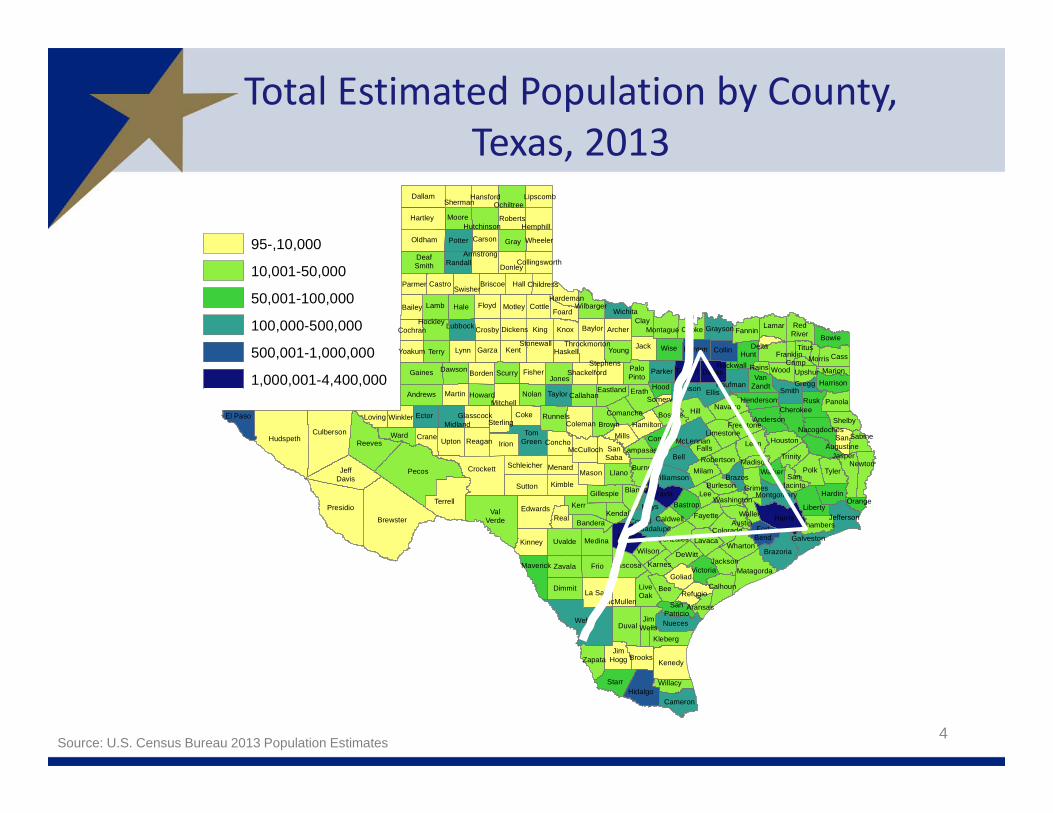
Total Estimated Population by County, Texas, 2013
4Source: U.S. Census Bureau 2013 Population Estimates
95-,10,000
10,001-50,000
50,001-100,000
100,000-500,000
500,001-1,000,000
1,000,001-4,400,000
Dallas
Howard
FoardFloyd
Brewster
FranklinHunt
Newton
Starr
Kinney
Collingsworth
TomGreen
Coleman
Brazoria
Leon
Duval
Lamb
Morris
Smith
Jackson
Medina
Wheeler
Dallam
Callahan
Lamar
Coryell
Gaines
Kendall
Nacogdoches
Milam
Hays
Willacy
Johnson
Reagan
Webb
Shackelford
Bowie
Scurry
Kenedy
Somervell
Oldham
Taylor
King
Borden
Walker
Stephens
DeafSmith
Roberts
Tyler
ValVerde
Brown
Parker
Harris
Zapata
RedRiver
Karnes
PaloPinto
GlasscockShelby
Wood
Crosby
Refugio
Burnet
Sterling
Montgomery
SanAugustine
Rains
Nueces
Jack
Swisher
Camp
Brazos
Orange
Colorado
Pecos
Cochran
Parmer
FreestoneWinkler
Wichita
Gray
Schleicher
Hardeman
TravisGillespie
Yoakum
Fayette
Uvalde
Grimes
VanZandt
Throckmorton
Falls
Grayson
Ellis
Hall
Dickens
Trinity
Reeves
Marion
Terrell
Lynn
La Salle
Jasper
Jones
Castro
Victoria
Kleberg
Briscoe
Clay
Matagorda
Brooks
Runnels
Carson
Liberty
Lee
Hale
Bexar
Garza
Montague
Upton
Hamilton
FisherDawson
Dimmit
Limestone
Hutchinson
Llano
Presidio
Eastland
Sabine
Wharton
Rusk
Tarrant
Lavaca
Childress
Hidalgo
Kaufman
Moore
Menard
Edwards
SanPatricio
Terry
Crockett
Houston
Waller
Coke
Ward
Titus
Lampasas
Haskell
Martin
Atascosa
HemphillHartley
Young
BurlesonHardin
Gonzales
McMullen
Erath
Galveston
McLennan
Madison
McCulloch
Donley
Kent
Real
Sutton
Midland
Hudspeth
Zavala
Harrison
ComancheMitchell Navarro
Crane
Lubbock
Wise
Washington
JeffDavis
El Paso
Gregg
Williamson
Lipscomb
Mason
Henderson
Hansford
Chambers
Hill
Potter
JimWells
DeltaStonewall
Ector
Cameron
Maverick
Collin
Baylor
Panola
Guadalupe
Bastrop
Austin
Andrews
Anderson
Blanco
DeWitt
Bandera
Bell
Aransas
Archer
Armstrong
Bee
Bailey
Jefferson
Frio
Fannin
Goliad
Loving
Cass
FortBend
Bosque
Hockley
SanSaba
Kerr
Mills
Cooke
Wilbarger
Irion
Caldwell
JimHogg
Culberson
Upshur
Cherokee
Denton
Concho
Randall
Kimble
Knox
Polk
Hood
SanJacinto
Robertson
Wilson
Nolan
Cottle
Calhoun
Rockwall
LiveOak
Motley
Sherman Ochiltree
Comal
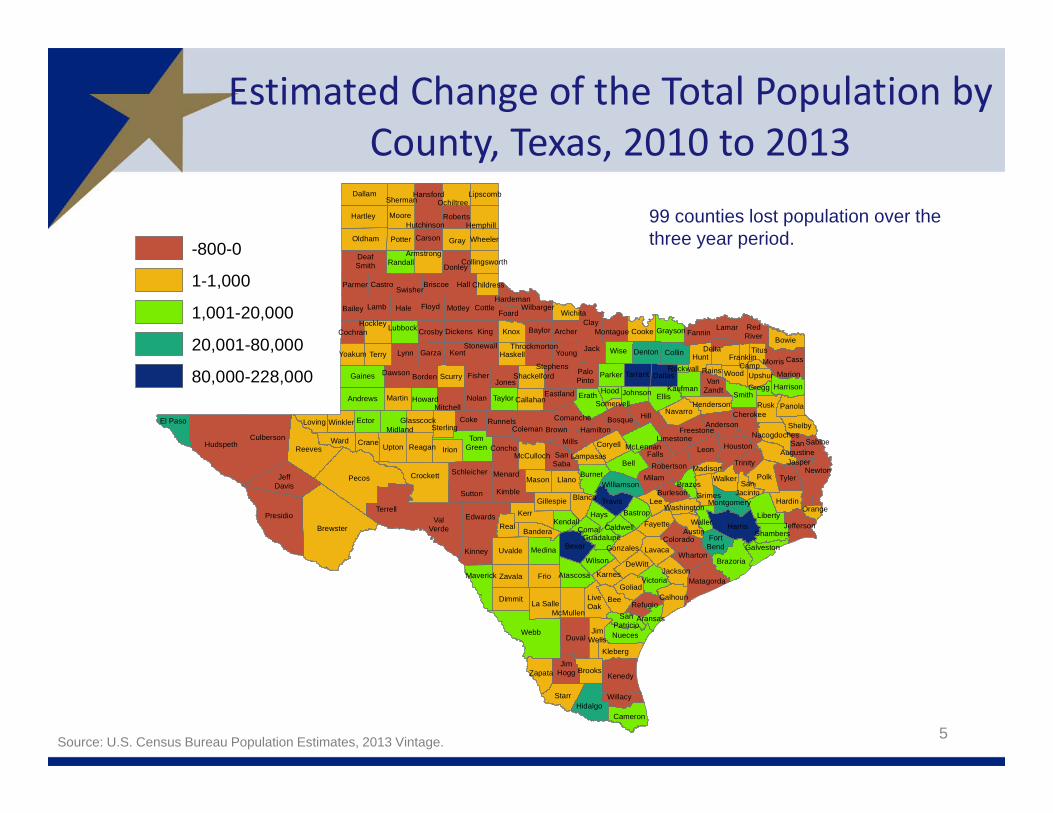
Estimated Change of the Total Population by County, Texas, 2010 to 2013
5Source: U.S. Census Bureau Population Estimates, 2013 Vintage.
99 counties lost population over the three year period.-800-0
1-1,000
1,001-20,000
20,001-80,000
80,000-228,000
Dallas
Howard
FoardFloyd
Brewster
FranklinHunt
Newton
Starr
Kinney
Collingsworth
TomGreen
Coleman
Brazoria
Leon
Duval
Lamb
Morris
Smith
Jackson
Medina
Wheeler
Dallam
Callahan
Lamar
Coryell
Gaines
Kendall
Nacogdoches
Milam
Hays
Willacy
Johnson
Reagan
Webb
Shackelford
Bowie
Scurry
Kenedy
Somervell
Oldham
Taylor
King
Borden
Walker
Stephens
DeafSmith
Roberts
Tyler
ValVerde
Brown
Parker
Harris
Zapata
RedRiver
Karnes
PaloPinto
GlasscockShelby
Wood
Crosby
Refugio
Burnet
Sterling
Montgomery
SanAugustine
Rains
Nueces
Jack
Swisher
Camp
Brazos
Orange
Colorado
Pecos
Cochran
Parmer
FreestoneWinkler
Wichita
Gray
Schleicher
Hardeman
TravisGillespie
Yoakum
Fayette
Uvalde
Grimes
VanZandt
Throckmorton
Falls
Grayson
Ellis
Hall
Dickens
Trinity
Reeves
Marion
Terrell
Lynn
La Salle
Jasper
Jones
Castro
Victoria
Kleberg
Briscoe
Clay
Matagorda
Brooks
Runnels
Carson
Liberty
Lee
Hale
Bexar
Garza
Montague
Upton
Hamilton
FisherDawson
Dimmit
Limestone
Hutchinson
Llano
Presidio
Eastland
Sabine
Wharton
Rusk
Tarrant
Lavaca
Childress
Hidalgo
Kaufman
Moore
Menard
Edwards
SanPatricio
Terry
Crockett
Houston
Waller
Coke
Ward
Titus
Lampasas
Haskell
Martin
Atascosa
HemphillHartley
Young
BurlesonHardin
Gonzales
McMullen
Erath
Galveston
McLennan
Madison
McCulloch
Donley
Kent
Real
Sutton
Midland
Hudspeth
Zavala
Harrison
ComancheMitchell Navarro
Crane
Lubbock
Wise
Washington
JeffDavis
El Paso
Gregg
Williamson
Lipscomb
Mason
Henderson
Hansford
Chambers
Hill
Potter
JimWells
DeltaStonewall
Ector
Cameron
Maverick
Collin
Baylor
Panola
Guadalupe
Bastrop
Austin
Andrews
Anderson
Blanco
DeWitt
Bandera
Bell
Aransas
Archer
Armstrong
Bee
Bailey
Jefferson
Frio
Fannin
Goliad
Loving
Cass
FortBend
Bosque
Hockley
SanSaba
Kerr
Mills
Cooke
Wilbarger
Irion
Caldwell
JimHogg
Culberson
Upshur
Cherokee
Denton
Concho
Randall
Kimble
Knox
Polk
Hood
SanJacinto
Robertson
Wilson
Nolan
Cottle
Calhoun
Rockwall
LiveOak
Motley
Sherman Ochiltree
Comal
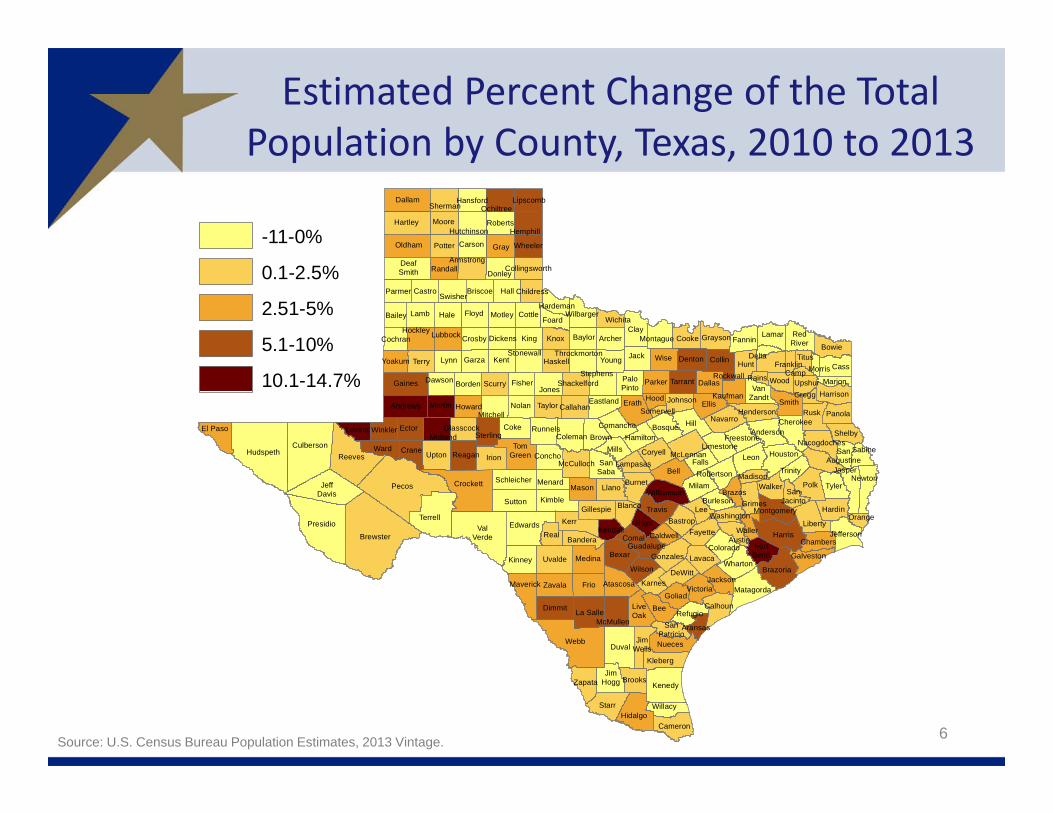
Estimated Percent Change of the Total Population by County, Texas, 2010 to 2013
6Source: U.S. Census Bureau Population Estimates, 2013 Vintage.
-11-0%
0.1-2.5%
2.51-5%
5.1-10%
10.1-14.7%
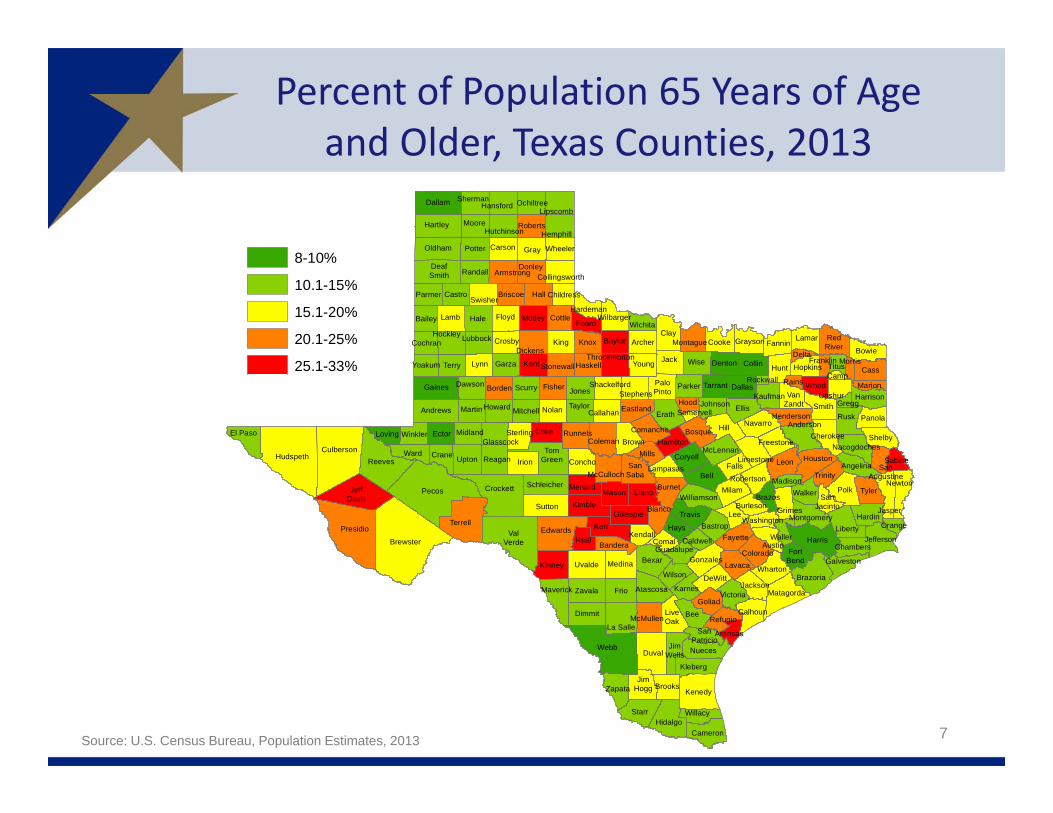
Percent of Population 65 Years of Age and Older, Texas Counties, 2013
7Source: U.S. Census Bureau, Population Estimates, 2013
Menard
Hale
Armstrong
Calhoun
Clay
Orange
Gonzales
Fannin
Kerr
Refugio
JimHogg
Dimmit
Nolan
Brazos
Jefferson
Bell
Bandera
Hidalgo
Schleicher
GraysonCrosby
Delta
Zavala
Rockwall
Eastland
DeWitt
Angelina
McLennan
Lamar
Leon
Stonewall
McMullen
Sutton
FortBend
Parker
Kinney
Fayette
Briscoe
Harrison
Reagan
Coleman
Ochiltree
Crane
Washington
Lynn
Mills
Oldham
Sabine
Hopkins
Houston
Bexar
Upton
Erath
Randall
Rusk
Coryell
Comal
Aransas
Jack
Hemphill
Shackelford
SanJacinto
Kendall
Wharton
Floyd
Karnes
Kaufman
Duval
Johnson
Franklin
EdwardsWaller
Maverick
Kleberg
Gaines
Martin
Bowie
Andrews
Potter
Garza
Caldwell
Parmer
TitusTerry
Foard
Real
Carson
Knox
Hays
Medina
MotleyWichita
Midland
Victoria
Tyler
Falls
Presidio
Willacy
Lubbock
Henderson
Walker
Galveston
Harris
Dawson
Pecos
Nacogdoches
Guadalupe
Tarrant
Jackson
Swisher
SterlingWinkler
Frio
Lipscomb
Collingsworth
Colorado
Wise
Glasscock ShelbyComanche
Burnet
Gray
Hudspeth
Cass
Ellis
Cooke
Williamson
Cochran
VanZandt
Donley
Jones
Grimes
Irion
Navarro
Brooks
Dallam
Hunt
Mitchell
Wood
Childress
JeffDavis
Montague
Brown
Haskell
Fisher
Concho
Coke
Polk
Cottle
Young
Lee
Cherokee
Hall
Hood
ArcherBaylor
SanAugustineMadison
Milam
Reeves
Nueces
Camp
FreestoneRunnels
Terrell
DeafSmith
Marion
Liberty
Jasper
Hansford
Chambers
Hardin
Collin
Brazoria
Throckmorton
Bastrop
Scurry
Ector
Limestone
Denton
RedRiver
Matagorda
Hardeman
PaloPinto
LiveOak
Sherman
Uvalde
Bailey
Culberson
Atascosa
Wilson
Starr
Dallas
Kimble
McCulloch
Crockett
Hill
Kent
El Paso Loving
Dickens
La Salle
Lamb
Austin
Hutchinson
ValVerde
Smith
Robertson
Gillespie
King
TomGreen
Yoakum
Somervell
Kenedy
Borden
SanSaba
Burleson
Bee
Trinity
Castro
Brewster
Gregg
Ward
Wilbarger
Hamilton
Stephens
Lavaca
Bosque
Goliad
Roberts
Callahan
Rains
Morris
Lampasas
Upshur
Wheeler
SanPatricio
Moore
Webb
Blanco
Newton
Hockley
PanolaAnderson
Cameron
Montgomery
LlanoMason
Taylor
Hartley
JimWells
Zapata
Travis
Howard
8-10%
10.1-15%
15.1-20%
20.1-25%
25.1-33%
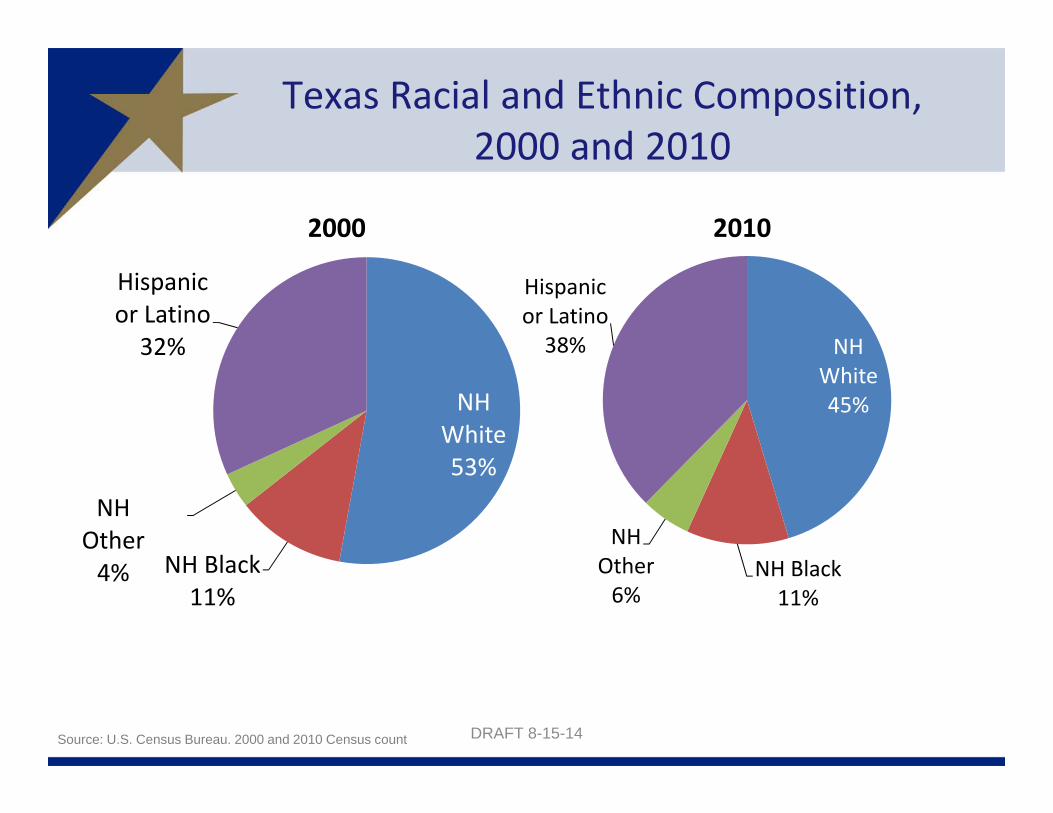
Texas Racial and Ethnic Composition, 2000 and 2010
NH White53%
NH Black11%
NH Other4%
Hispanic or Latino32%
2000
NH White45%
NH Black11%
NH Other6%
Hispanic or Latino38%
2010
Source: U.S. Census Bureau. 2000 and 2010 Census count DRAFT 8-15-14
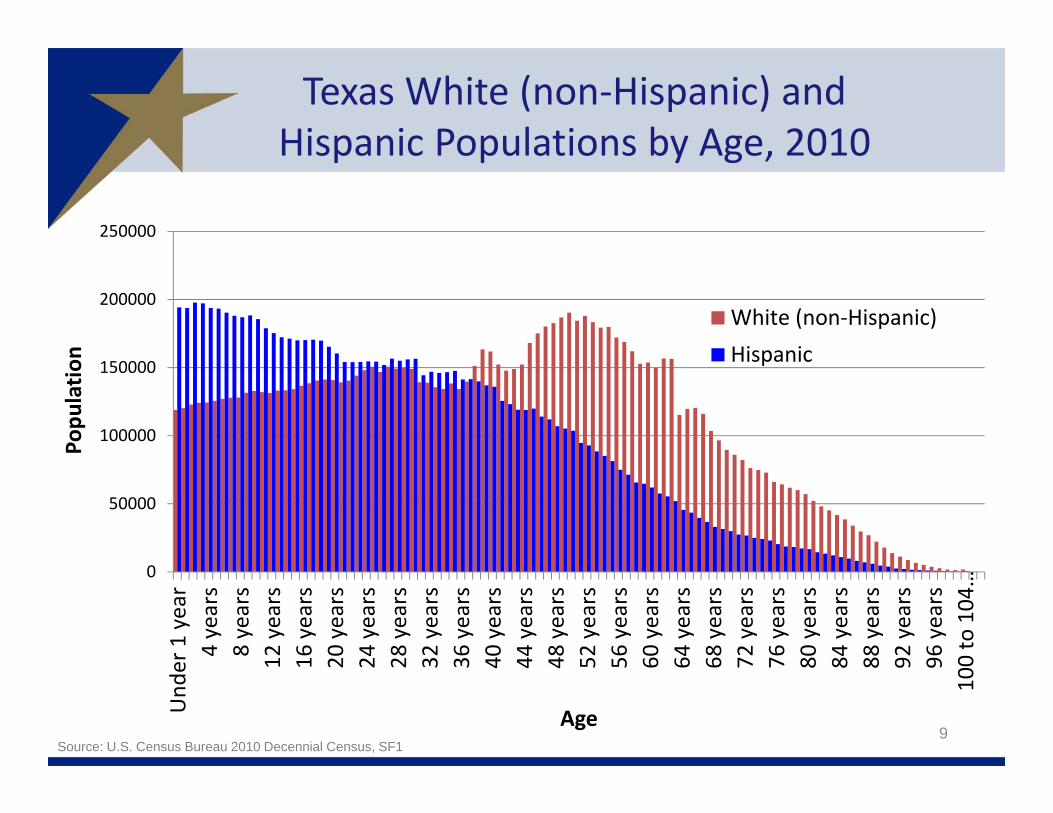
Texas White (non‐Hispanic) and Hispanic Populations by Age, 2010
0
50000
100000
150000
200000
250000
Und
er 1 year
4 years
8 years
12 years
16 years
20 years
24 years
28 years
32 years
36 years
40 years
44 years
48 years
52 years
56 years
60 years
64 years
68 years
72 years
76 years
80 years
84 years
88 years
92 years
96 years
100 to 104…
Popu
latio
n
Age
White (non‐Hispanic)Hispanic
9Source: U.S. Census Bureau 2010 Decennial Census, SF1
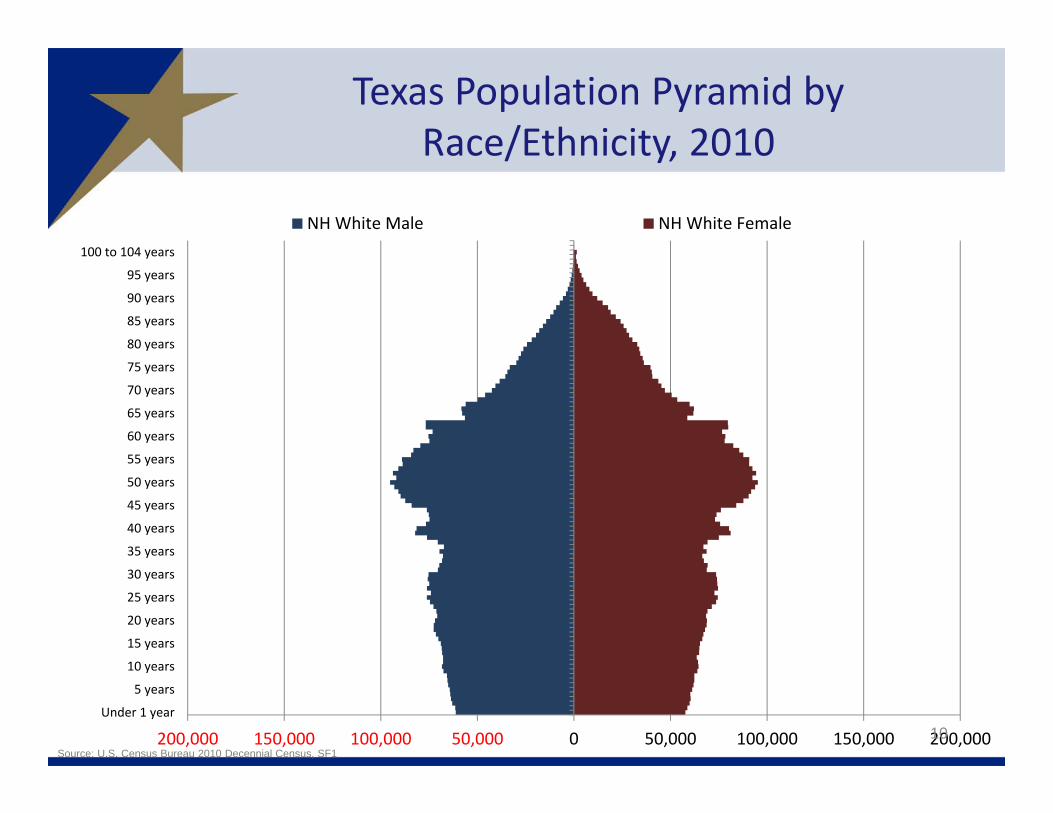
Texas Population Pyramid by Race/Ethnicity, 2010
200,000 150,000 100,000 50,000 0 50,000 100,000 150,000 200,000Under 1 year
5 years
10 years
15 years
20 years
25 years
30 years
35 years
40 years
45 years
50 years
55 years
60 years
65 years
70 years
75 years
80 years
85 years
90 years
95 years
100 to 104 years
NH White Male NH White Female
10Source: U.S. Census Bureau 2010 Decennial Census, SF1
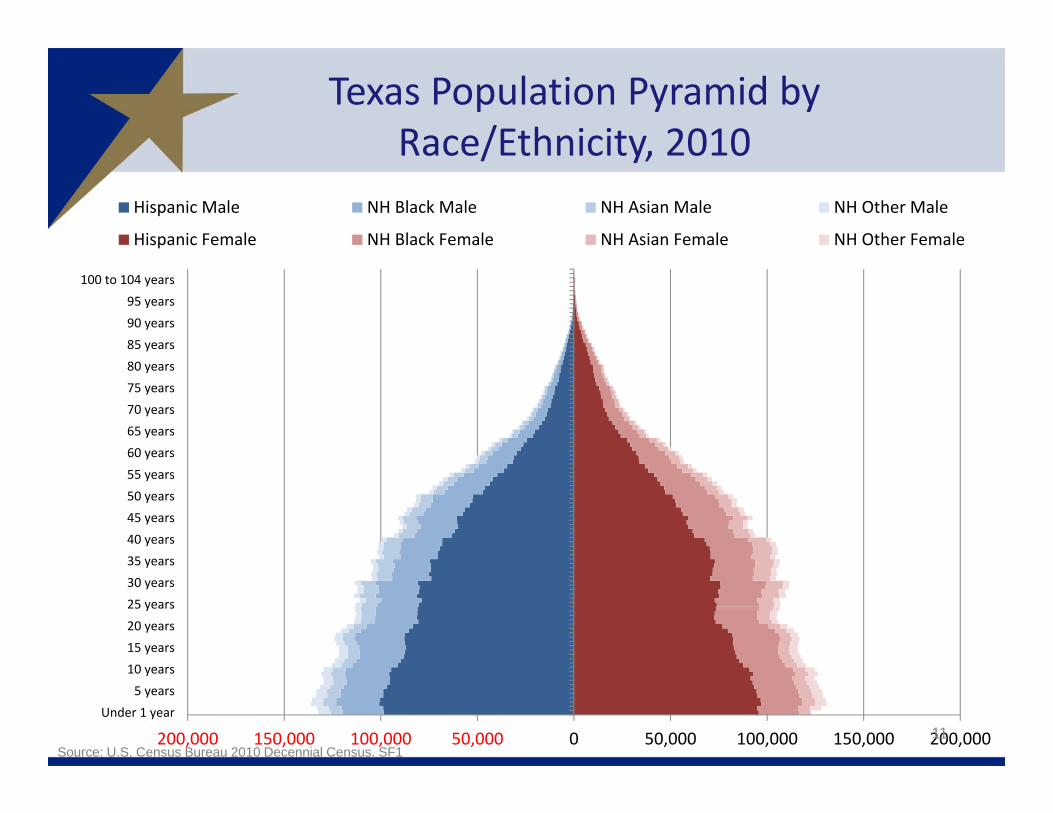
Texas Population Pyramid by Race/Ethnicity, 2010
200,000 150,000 100,000 50,000 0 50,000 100,000 150,000 200,000Under 1 year
5 years10 years15 years20 years25 years30 years35 years40 years45 years50 years55 years60 years65 years70 years75 years80 years85 years90 years95 years
100 to 104 years
Hispanic Male NH Black Male NH Asian Male NH Other Male
Hispanic Female NH Black Female NH Asian Female NH Other Female
11Source: U.S. Census Bureau 2010 Decennial Census, SF1
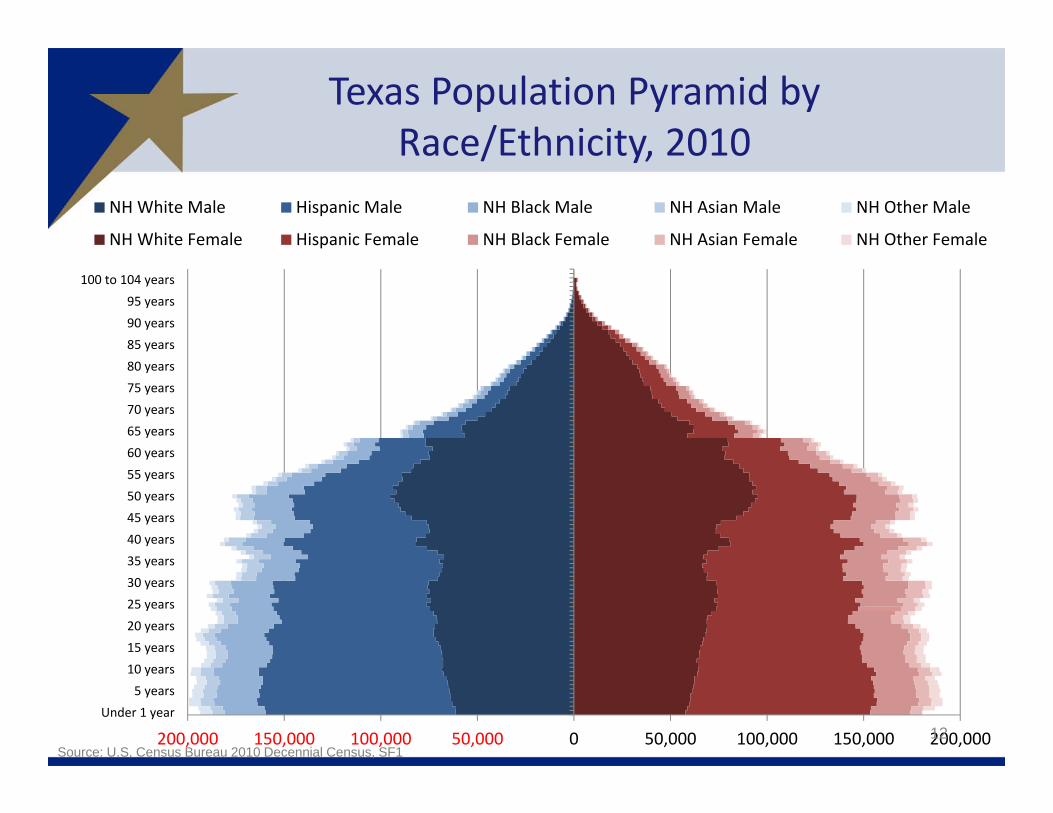
Texas Population Pyramid by Race/Ethnicity, 2010
200,000 150,000 100,000 50,000 0 50,000 100,000 150,000 200,000Under 1 year
5 years10 years15 years20 years25 years30 years35 years40 years45 years50 years55 years60 years65 years70 years75 years80 years85 years90 years95 years
100 to 104 years
NH White Male Hispanic Male NH Black Male NH Asian Male NH Other Male
NH White Female Hispanic Female NH Black Female NH Asian Female NH Other Female
12Source: U.S. Census Bureau 2010 Decennial Census, SF1
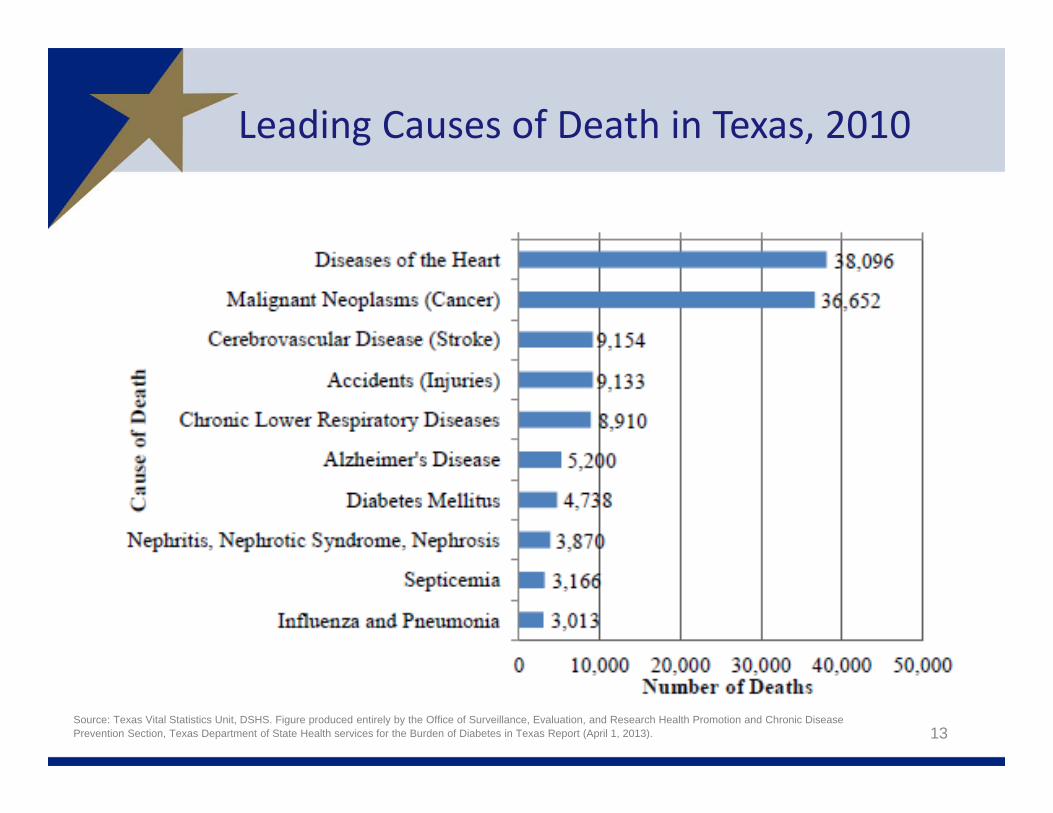
Leading Causes of Death in Texas, 2010
13Source: Texas Vital Statistics Unit, DSHS. Figure produced entirely by the Office of Surveillance, Evaluation, and Research Health Promotion and Chronic Disease Prevention Section, Texas Department of State Health services for the Burden of Diabetes in Texas Report (April 1, 2013).
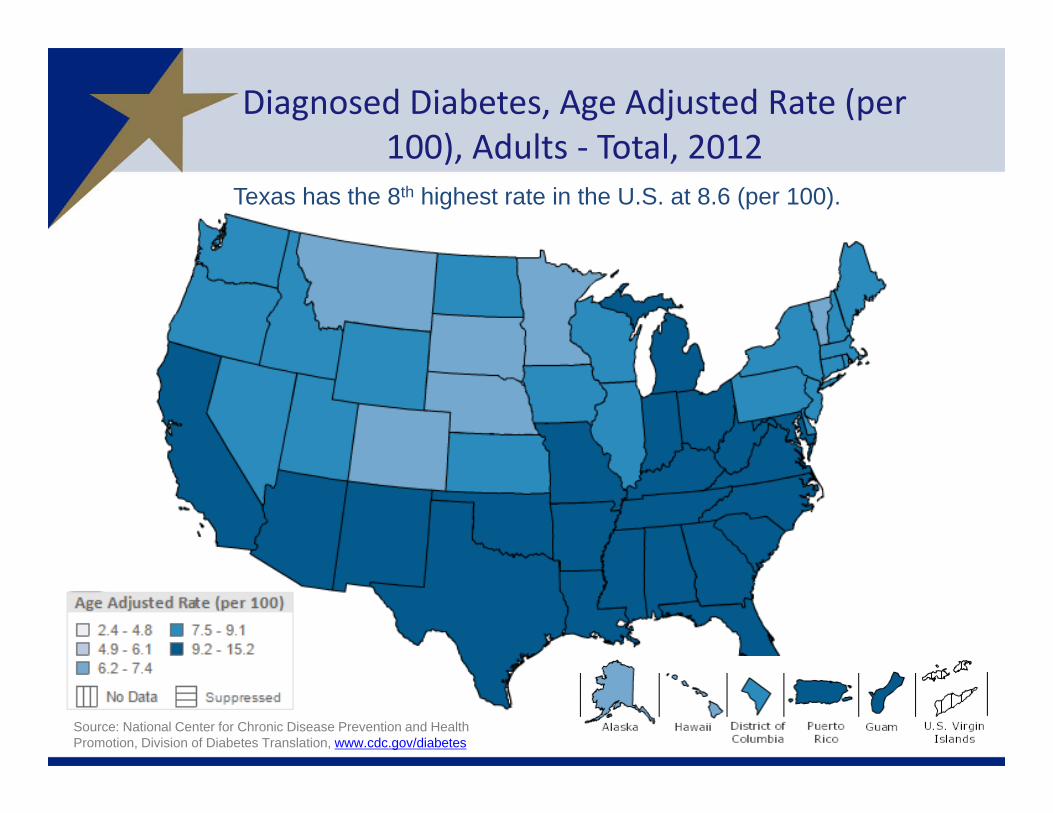
Diagnosed Diabetes, Age Adjusted Rate (per 100), Adults ‐ Total, 2012
14Source: National Center for Chronic Disease Prevention and Health Promotion, Division of Diabetes Translation, www.cdc.gov/diabetes
Texas has the 8th highest rate in the U.S. at 8.6 (per 100).
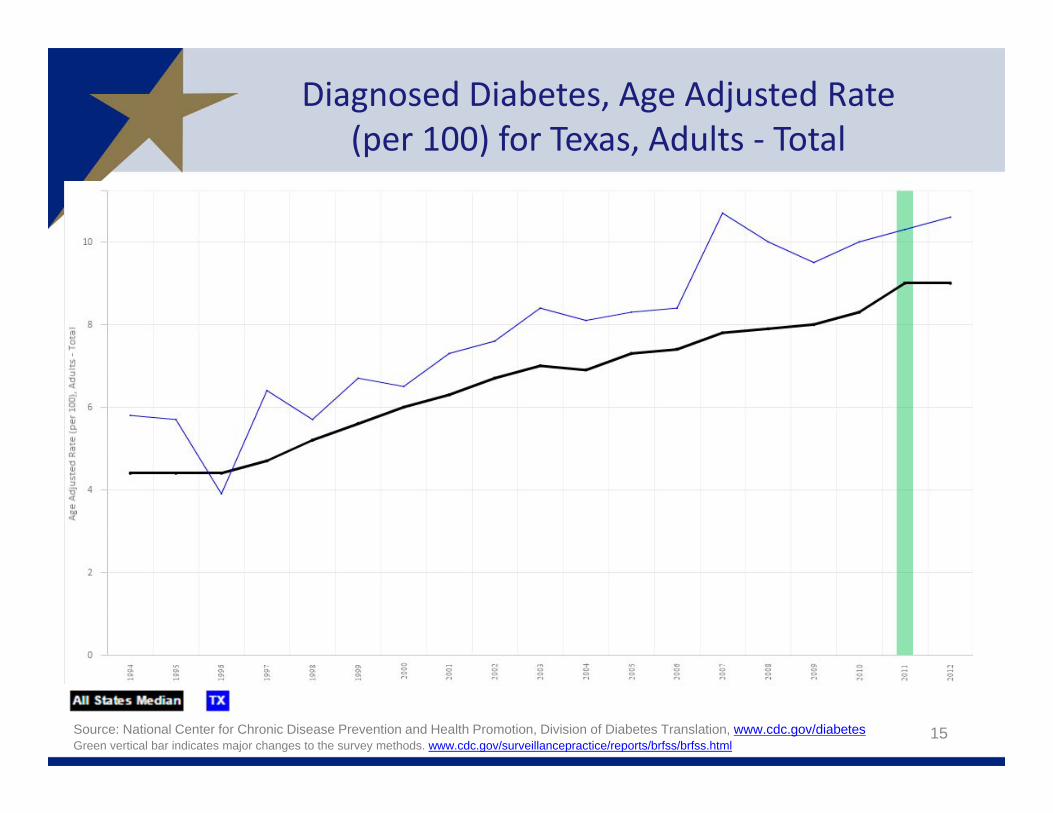
Diagnosed Diabetes, Age Adjusted Rate (per 100) for Texas, Adults ‐ Total
15Source: National Center for Chronic Disease Prevention and Health Promotion, Division of Diabetes Translation, www.cdc.gov/diabetesGreen vertical bar indicates major changes to the survey methods. www.cdc.gov/surveillancepractice/reports/brfss/brfss.html
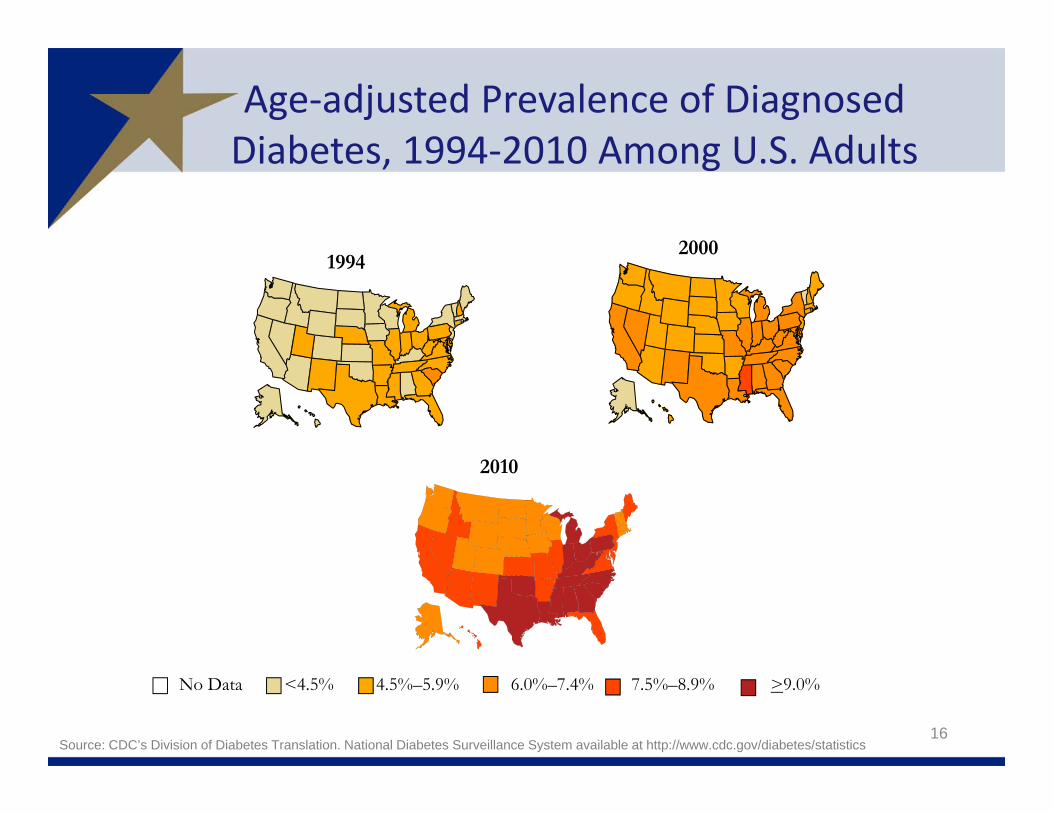
Age‐adjusted Prevalence of Diagnosed Diabetes, 1994‐2010 Among U.S. Adults
16
Aged 18 Years or Older
19942000
2010
No Data <4.5% 4.5%–5.9% 6.0%–7.4% 7.5%–8.9% >9.0%
Source: CDC’s Division of Diabetes Translation. National Diabetes Surveillance System available at http://www.cdc.gov/diabetes/statistics
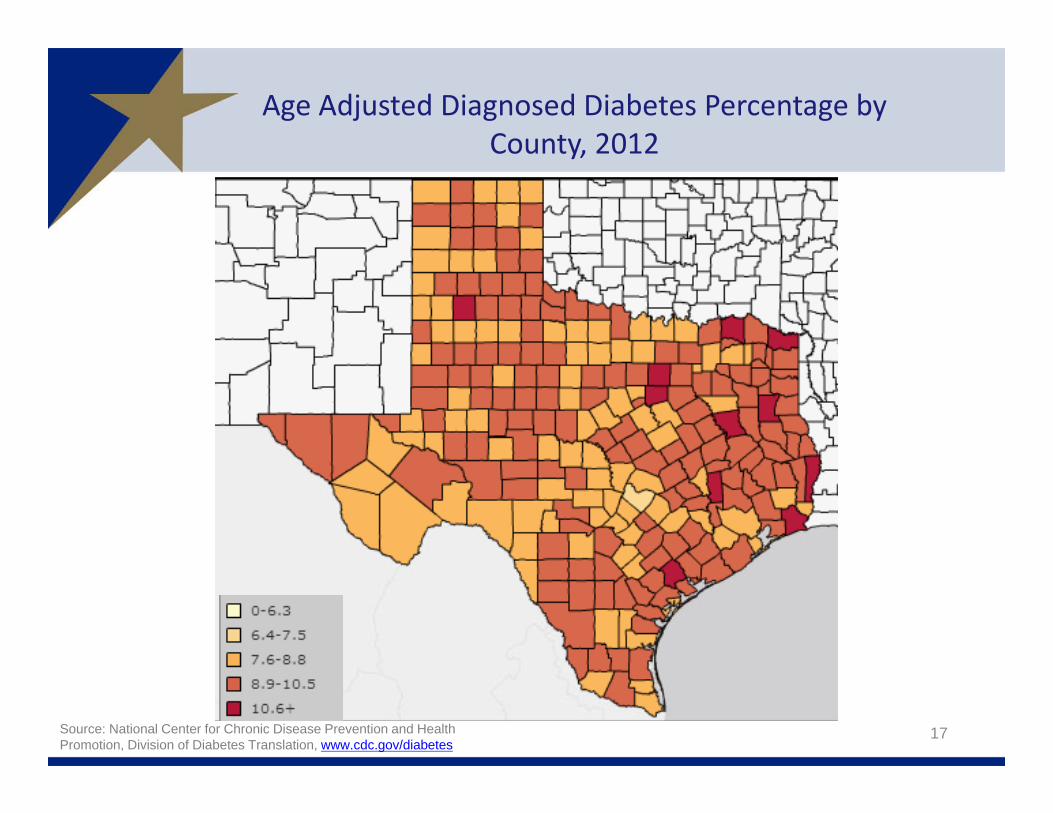
Age Adjusted Diagnosed Diabetes Percentage by County, 2012
17Source: National Center for Chronic Disease Prevention and Health Promotion, Division of Diabetes Translation, www.cdc.gov/diabetes
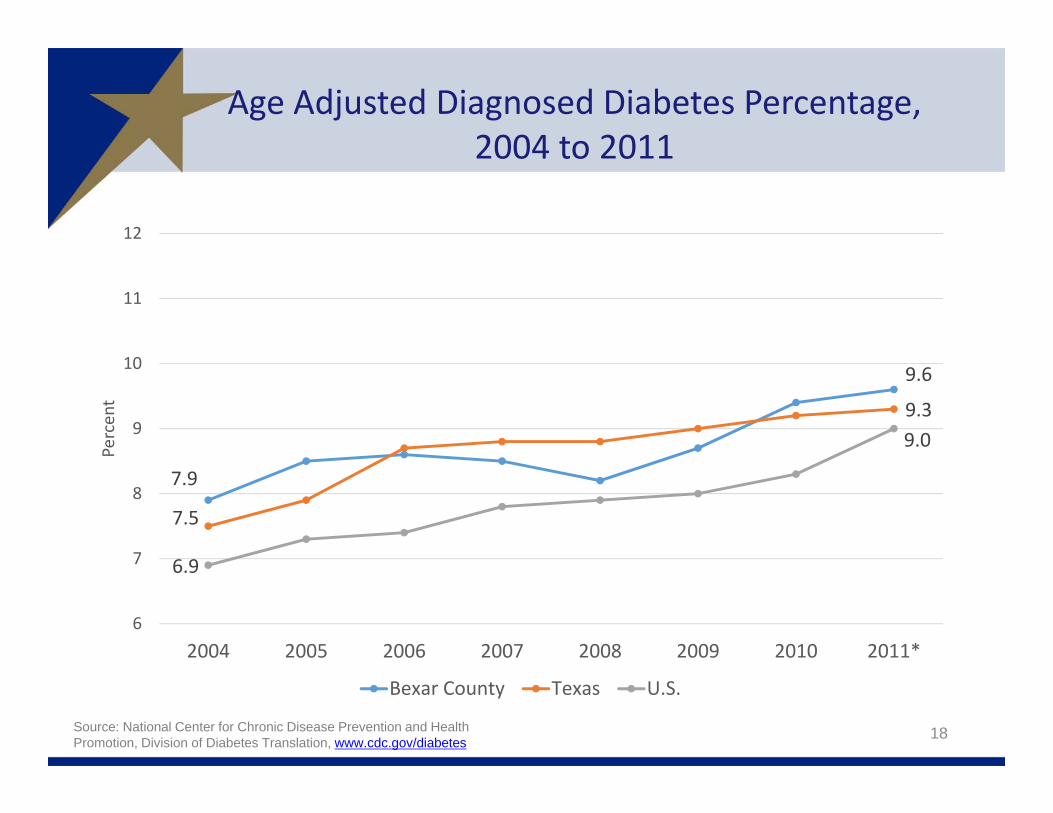
Age Adjusted Diagnosed Diabetes Percentage, 2004 to 2011
18
7.9
9.6
7.5
9.3
6.9
9.0
6
7
8
9
10
11
12
2004 2005 2006 2007 2008 2009 2010 2011*
Percent
Bexar County Texas U.S.
Source: National Center for Chronic Disease Prevention and Health Promotion, Division of Diabetes Translation, www.cdc.gov/diabetes
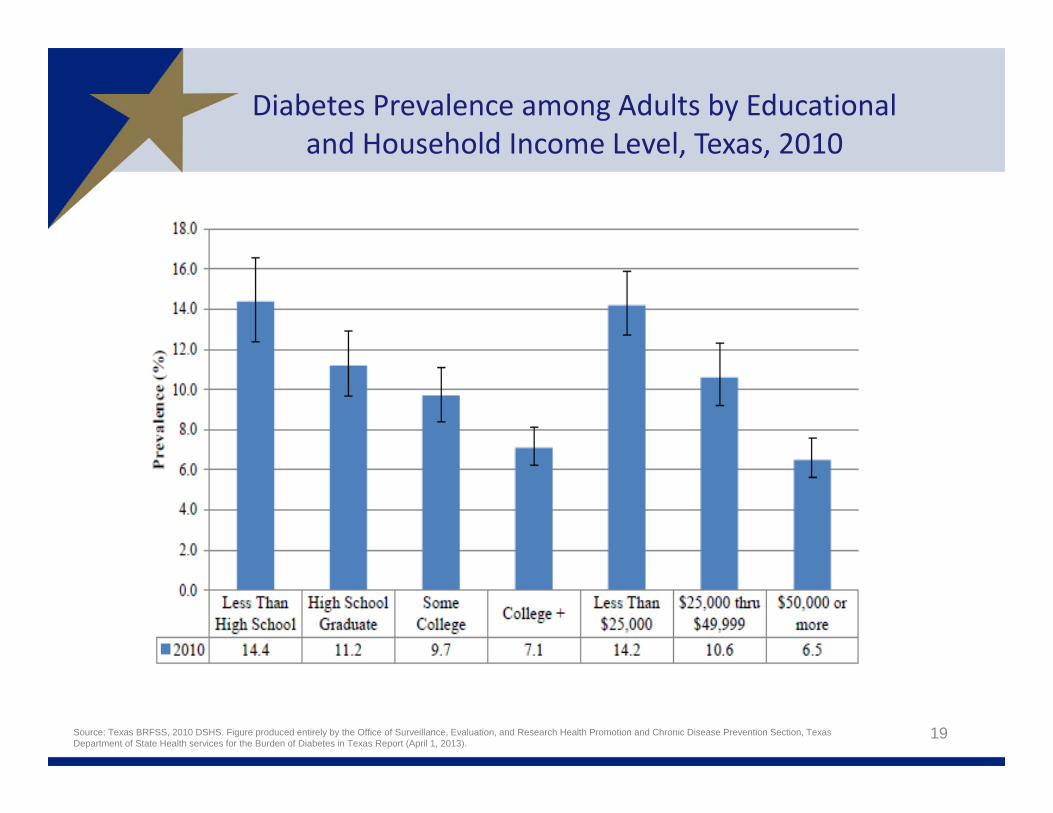
Diabetes Prevalence among Adults by Educational and Household Income Level, Texas, 2010
19Source: Texas BRFSS, 2010 DSHS. Figure produced entirely by the Office of Surveillance, Evaluation, and Research Health Promotion and Chronic Disease Prevention Section, Texas Department of State Health services for the Burden of Diabetes in Texas Report (April 1, 2013).
20
25
30
35
40
45
50
55
Millions
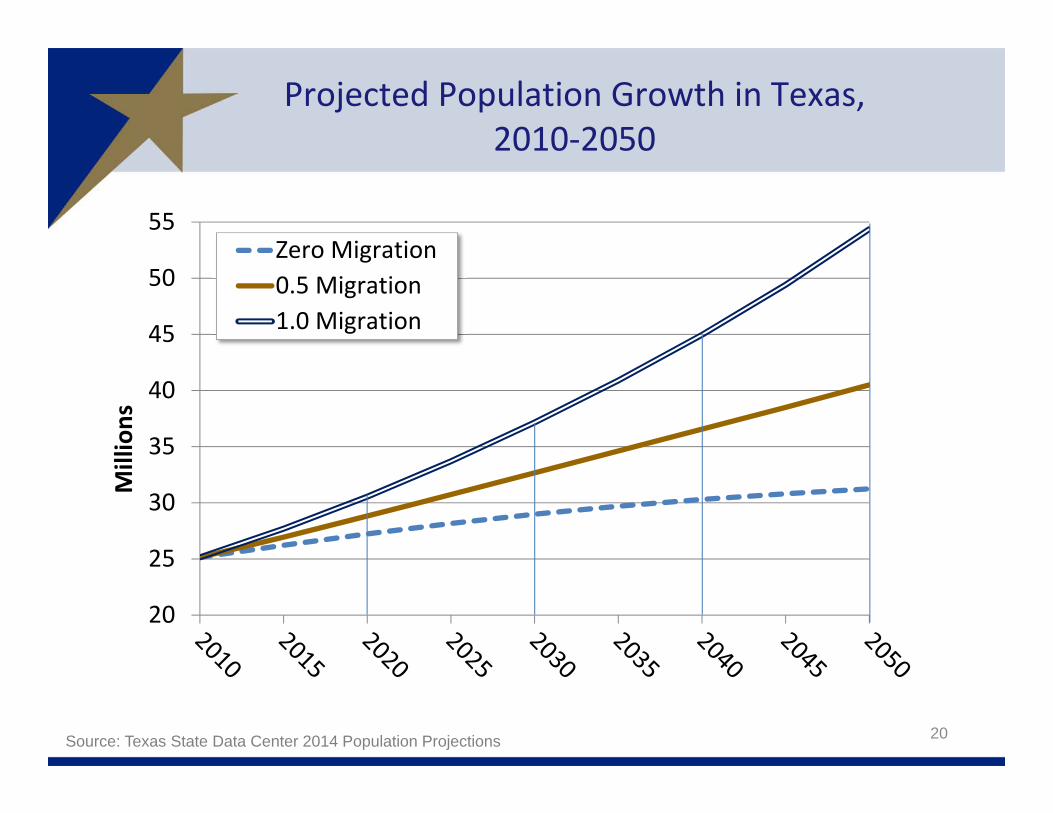
Zero Migration0.5 Migration1.0 Migration
Projected Population Growth in Texas, 2010‐2050
20Source: Texas State Data Center 2014 Population Projections
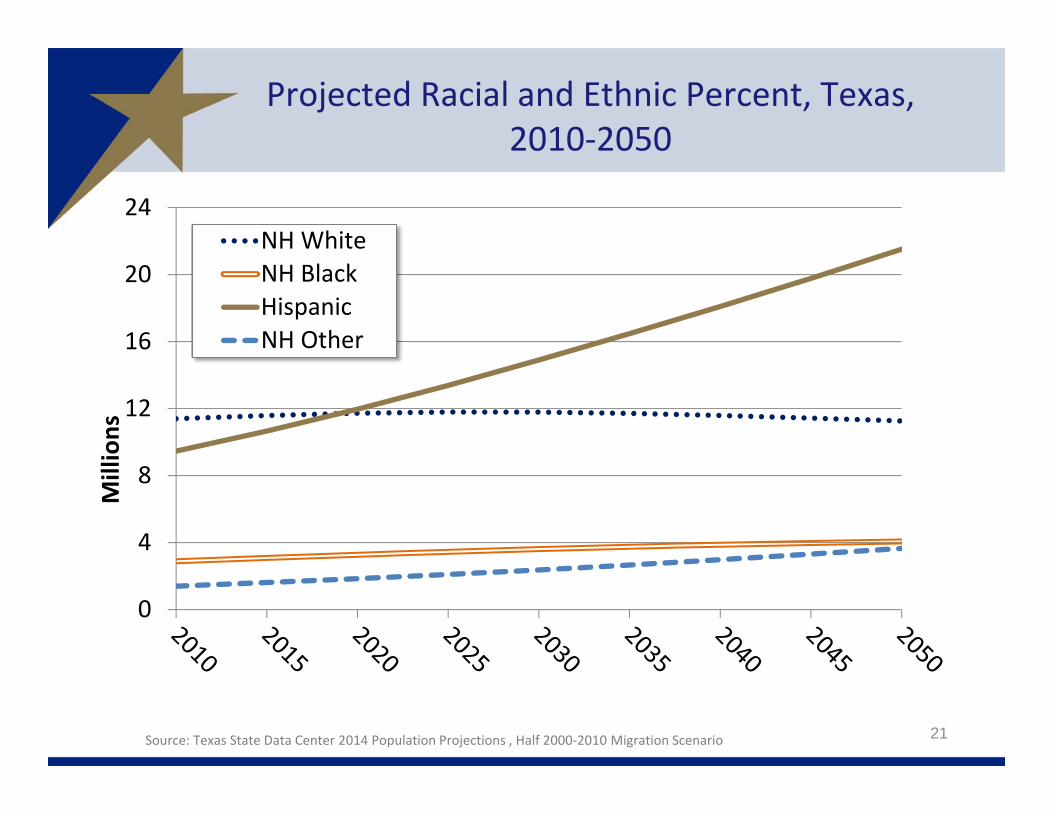
Projected Racial and Ethnic Percent, Texas, 2010‐2050
21Source: Texas State Data Center 2014 Population Projections , Half 2000‐2010 Migration Scenario
0
4
8
12
16
20
24
Millions
NH WhiteNH BlackHispanicNH Other
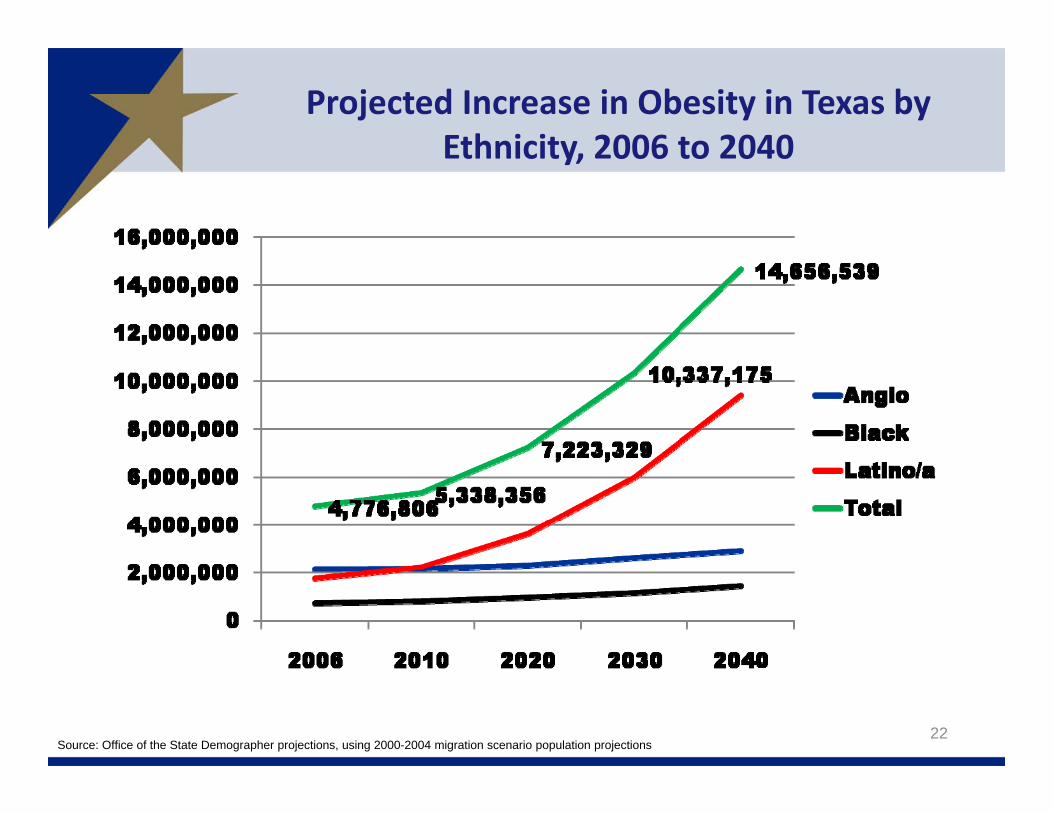
Projected Increase in Obesity in Texas by Ethnicity, 2006 to 2040
22Source: Office of the State Demographer projections, using 2000-2004 migration scenario population projections
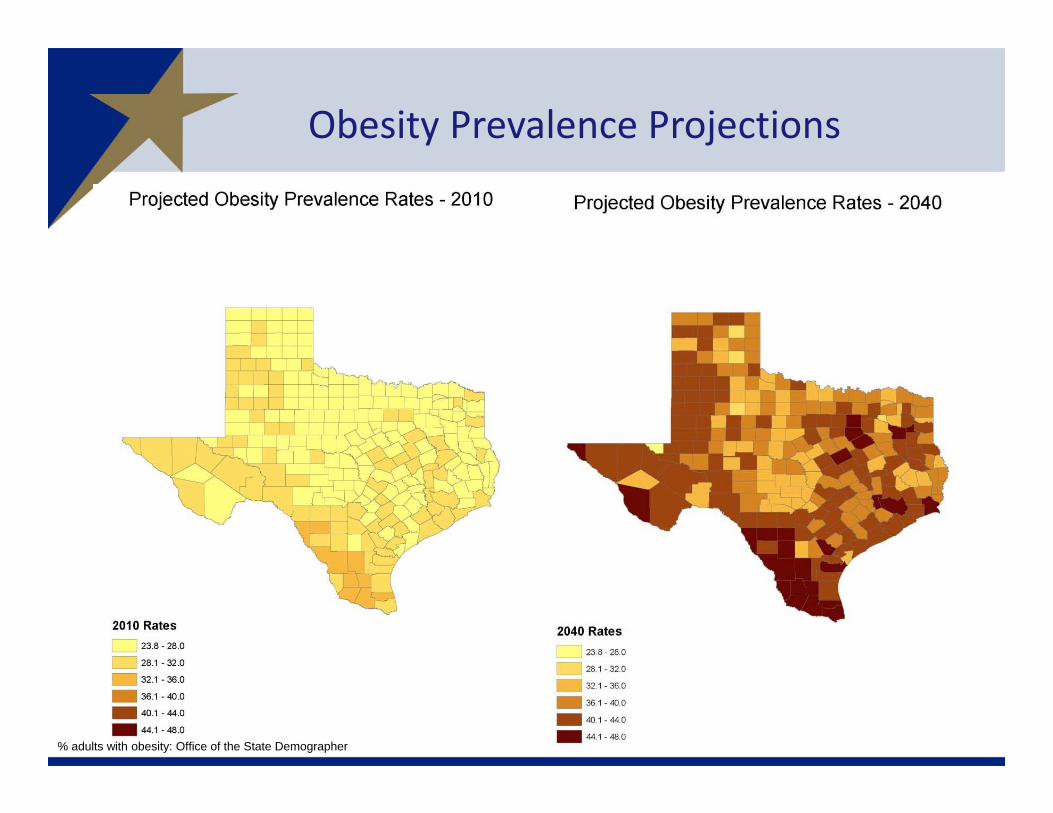
Obesity Prevalence Projections
23% adults with obesity: Office of the State Demographer
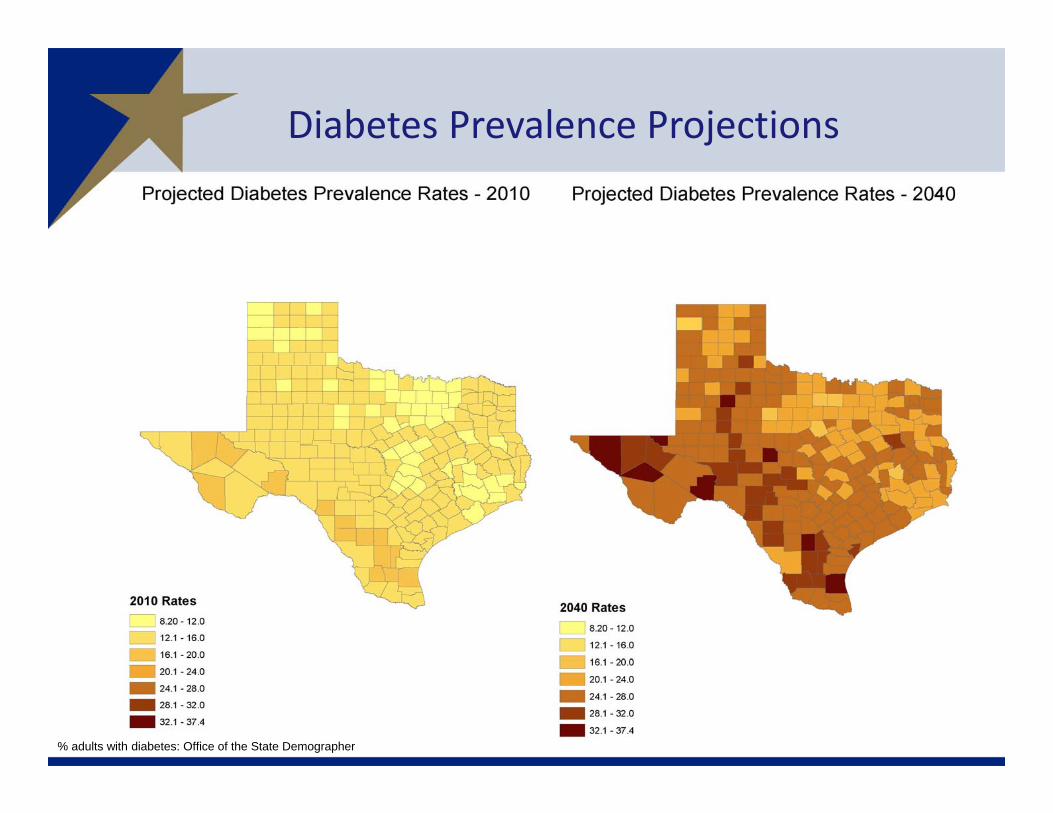
Diabetes Prevalence Projections
24% adults with diabetes: Office of the State Demographer
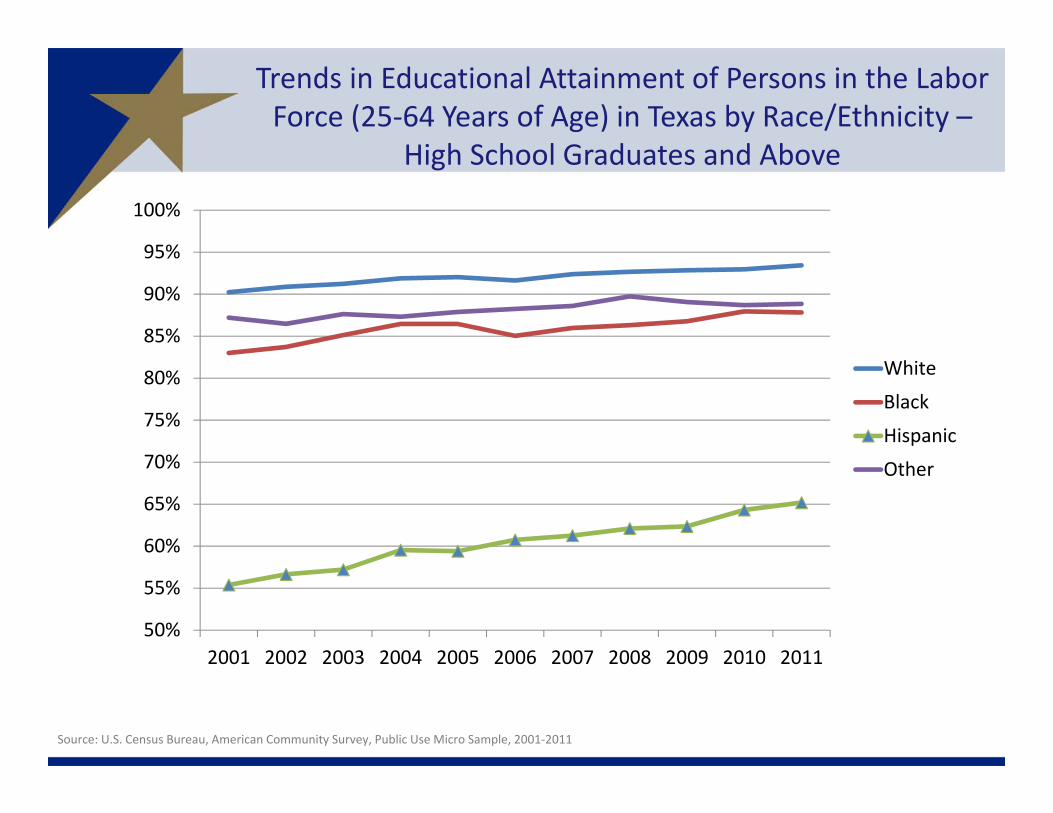
Trends in Educational Attainment of Persons in the Labor Force (25‐64 Years of Age) in Texas by Race/Ethnicity –
High School Graduates and Above
50%
55%
60%
65%
70%
75%
80%
85%
90%
95%
100%
2001 2002 2003 2004 2005 2006 2007 2008 2009 2010 2011
White
Black
Hispanic
Other
Source: U.S. Census Bureau, American Community Survey, Public Use Micro Sample, 2001‐2011
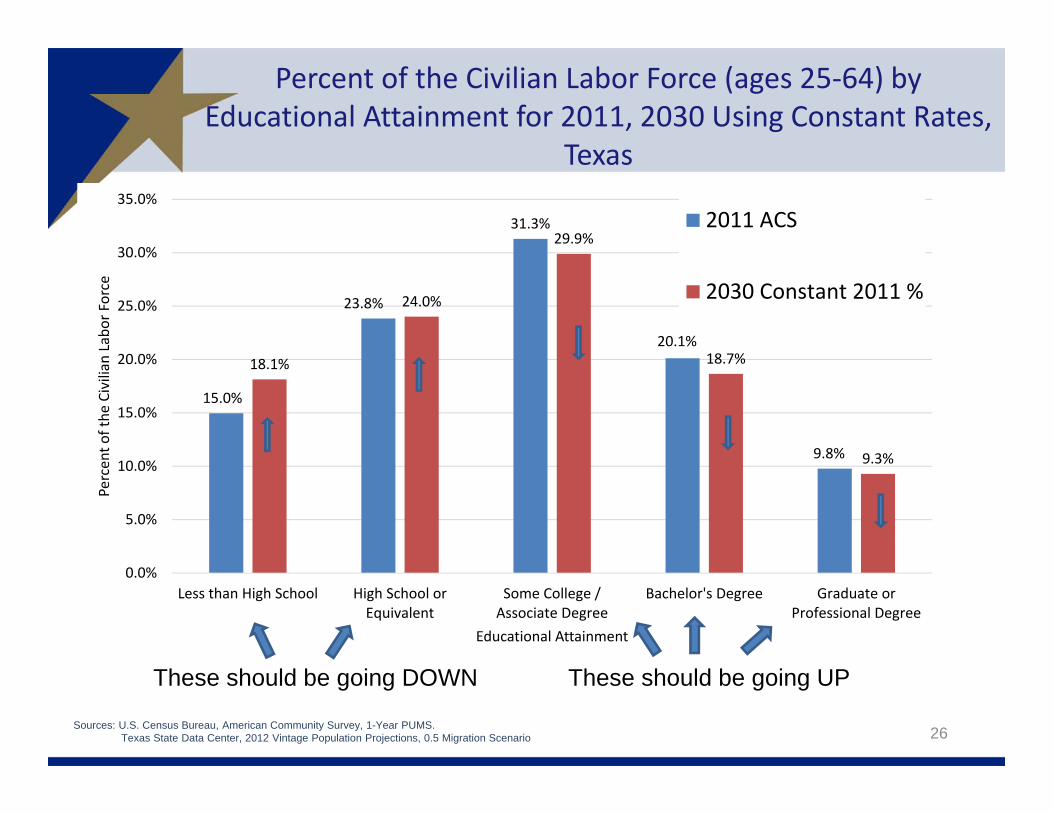
Percent of the Civilian Labor Force (ages 25‐64) by Educational Attainment for 2011, 2030 Using Constant Rates,
Texas
26
15.0%
23.8%
31.3%
20.1%
9.8%
18.1%
24.0%
29.9%
18.7%
9.3%
0.0%
5.0%
10.0%
15.0%
20.0%
25.0%
30.0%
35.0%
Less than High School High School orEquivalent
Some College /Associate Degree
Bachelor's Degree Graduate orProfessional Degree
Percen
t of the
Civilian
Labor Force
Educational Attainment
2011 ACS
2030 Constant 2011 %
These should be going DOWN These should be going UP
Sources: U.S. Census Bureau, American Community Survey, 1-Year PUMS.Texas State Data Center, 2012 Vintage Population Projections, 0.5 Migration Scenario
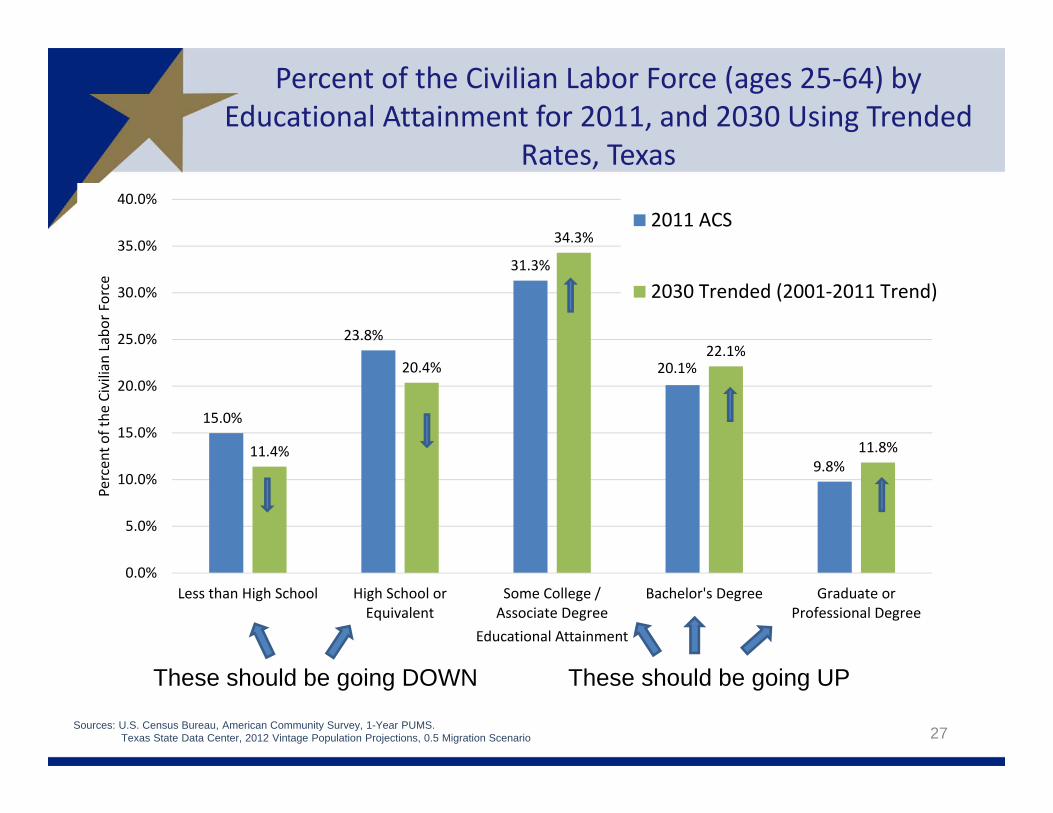
Percent of the Civilian Labor Force (ages 25‐64) by Educational Attainment for 2011, and 2030 Using Trended
Rates, Texas
27
15.0%
23.8%
31.3%
20.1%
9.8%11.4%
20.4%
34.3%
22.1%
11.8%
0.0%
5.0%
10.0%
15.0%
20.0%
25.0%
30.0%
35.0%
40.0%
Less than High School High School orEquivalent
Some College /Associate Degree
Bachelor's Degree Graduate orProfessional Degree
Percen
t of the
Civilian
Labor Force
Educational Attainment
2011 ACS
2030 Trended (2001‐2011 Trend)
These should be going DOWN These should be going UP
Sources: U.S. Census Bureau, American Community Survey, 1-Year PUMS.Texas State Data Center, 2012 Vintage Population Projections, 0.5 Migration Scenario
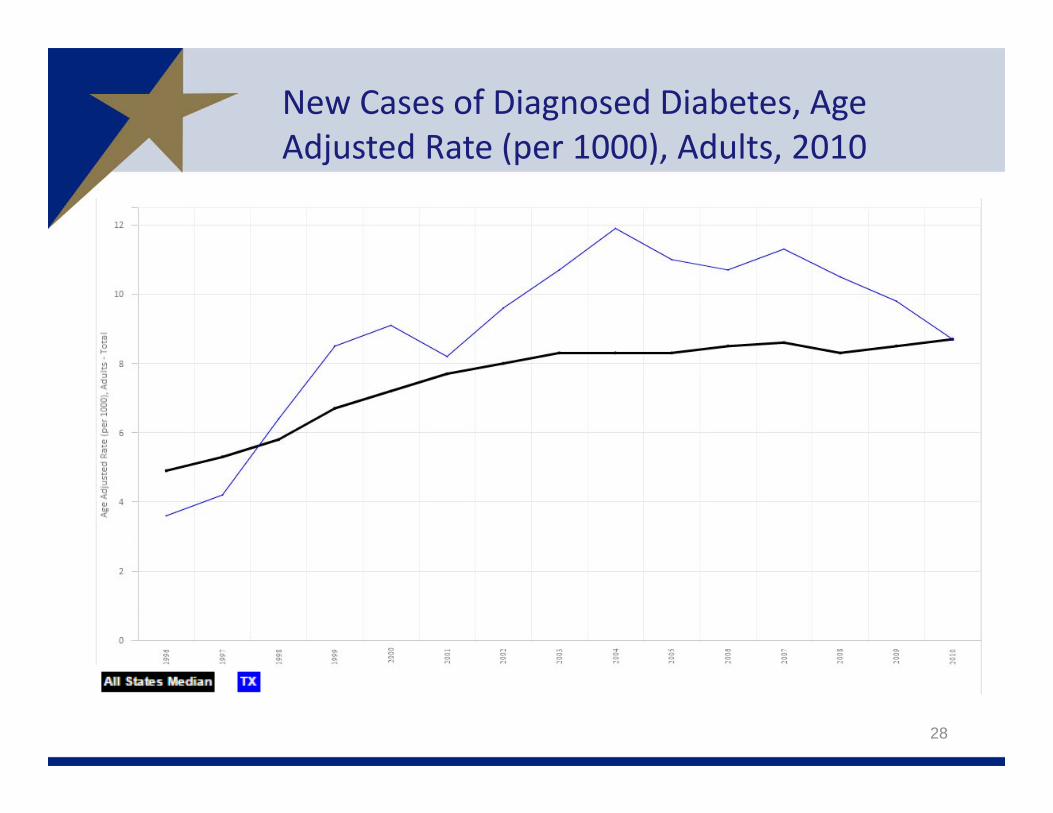
New Cases of Diagnosed Diabetes, Age Adjusted Rate (per 1000), Adults, 2010
28
Contact
Lila Valencia, Ph.D.
Office: (512) 936‐3542Email: [email protected]: http://osd.state.tx.usTwitter: @TexasDemography
29