texas: demographic characteristics and trends texas association of healthcare interpreters and...
Post on 19-Dec-2015
216 views
TRANSCRIPT

Texas: Demographic Characteristics and Trends
Texas Association of Healthcare Interpreters and Translators
August 19, 2011Dallas, TX

2
Growing States, 2000-2010
2000Population*
2010Population*
NumericalChange
2000-2010
PercentChange
2000-2010
United States 281,421,906 308,745,538 27,323,632 9.7%
Texas 20,851,820 25,145,561 4,293,741 20.6%
California 33,871,648 37,253,956 3,382,308 10.0%
Florida 15,982,378 18,801,310 2,818,932 17.6%Georgia 8,186,453 9,687,653 1,501,200 18.3%
North Carolina 8,049,313 9,535,483 1,486,170 18.5%
Arizona 5,130,632 6,392,017 1,261,385 24.6%
Population values are decennial census counts for April 1, 2000 and April 1, 2010.
15.7% of numerical change in U.S.
Source: U.S. Census Bureau. 2000 and 2010 Census Counts.

3
Percent ChangeDue to
Year* PopulationNumerical
ChangeNatural
IncreaseNet
MigrationPercentChange
NaturalIncrease
NetMigration
1950 7,711,194 -- -- -- -- -- --
1960 9,579,677 1,868,483 1,754,652 113,831 24.2 93.91 6.09
1970 11,196,730 1,617,053 1,402,683 214,370 16.9 86.74 13.26
1980 14,229,191 3,032,461 1,260,794 1,771,667 27.1 41.58 58.42
1990 16,986,510 2,757,319 1,815,670 941,649 19.9 65.85 34.15
2000 20,851,820 3,865,310 1,919,281 1,946,029 22.8 49.65 50.35
2009 24,782,302 3,930,484 2,124,124 1,781,785 18.8 54.04 45.33
*All values for the decennial dates are for the indicated census year. Values for 2009 are for July 1 as estimated by the U.S. Census Bureau.
Source: Derived from U.S. Census Bureau Estimates for dates indicated by the Texas State Data Center.Note: Residual values are not presented in this table.
Total Population and Components of Population Change in Texas, 1950-2009
4
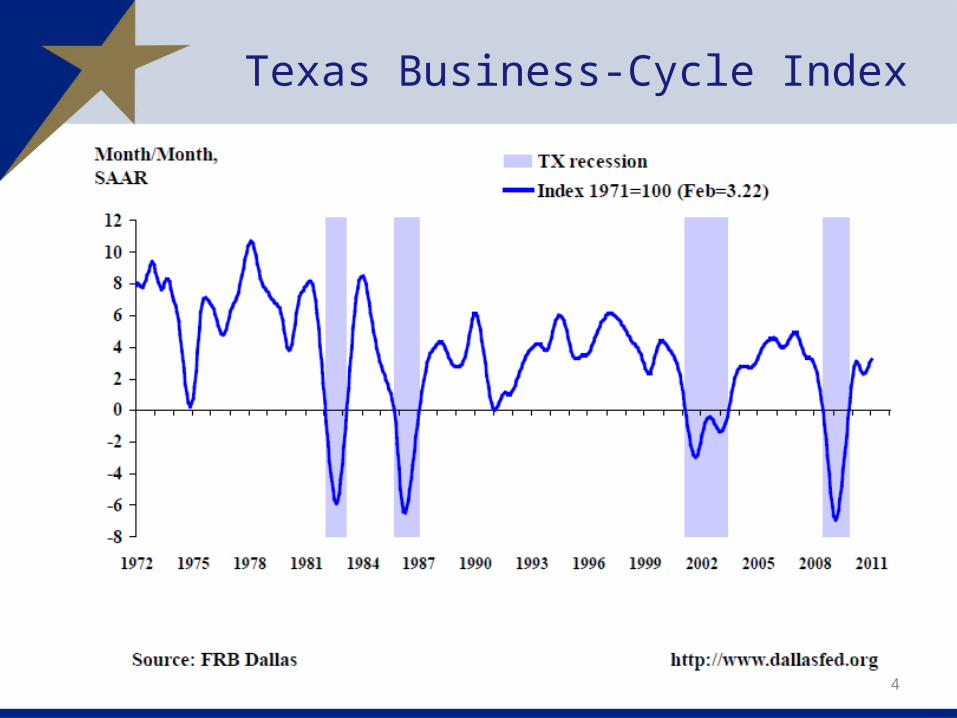
Texas Business-Cycle Index

5
Texas Total Nonfarm EmploymentQuarterly Growth

6
Texas Residential Permits and Mortgage Rate, 1990-2010

7
0
50,000
100,000
150,000
200,000
250,000
2000 to 2001
2001 to 2002
2002 to 2003
2003 to 2004
2004 to 2005
2005 to 2006
2006 to 2007
2007 to 2008
2008 to 2009
International
State-to-State
Source: U.S. Census Bureau. 2009 Population Estimates.
Estimated Annual Net Migration to Texas, 2000-2009

8Source: IRS Migration Data.Map produced by the Texas State Data Center.

9
Percent of Migrants to Texas by Race and Ethnicity, 2000-2009
Net domesti
c migr
ation
Internati
onal migr
ation
Total0%
10%20%30%40%50%60%70%80%90%
100%
44%24% 33%
28%50% 40%
23% 8% 15%
5%18% 12%
OtherBlackHispanicWhite
67% of all migrants
Sources: Percentages of domestic and international migrants by race and ethnicity derived from the 2006-2008 American Community Survey. Total numbers of domestic and international migrants between 2000-2009 are from Table 4. Cumulative Estimates of the Components of Resident Population Change for the United States, Regions, States, and Puerto Rico: April 1, 2000 to July 1, 2009, U.S. Census Bureau.
(848,702 migrants ) (933,083 migrants)
52% of all migrants were international

10
Estimated Domestic Migration (2000-2008) as a Percentage of 2000 Population by County
Source: Population Division, U.S. Census Bureau, March 19, 2009. Map produced by the Texas State Data Center.
Legend
-20 to -45%
-19 to -10%
-9 to -5%
-4 to 0%
1 to 5 %
6 to 20%
21 to 30%
31 to 65%
11
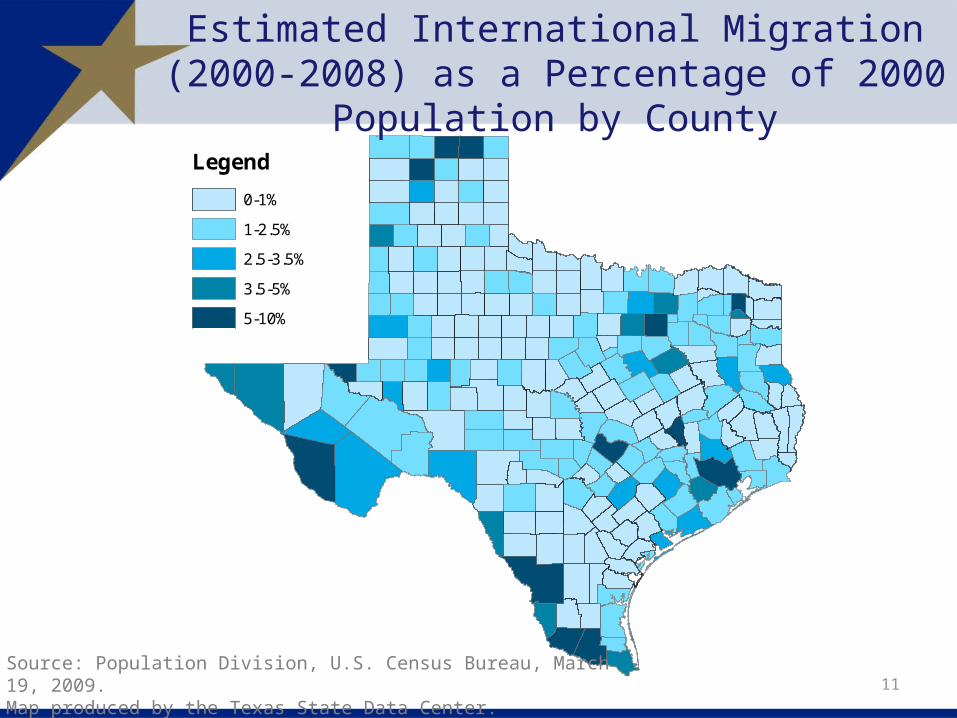
Legend
0-1%
1-2.5%
2.5-3.5%
3.5-5%
5-10%
Estimated International Migration (2000-2008) as a Percentage of 2000 Population by County
Source: Population Division, U.S. Census Bureau, March 19, 2009. Map produced by the Texas State Data Center.

Texas Racial and Ethnic Composition, 2000 and 2010
NH White53%
NH Black12%
NH Other
4%
Hispanic or Latino
32%
2000
NH White45%
NH Black11%
NH Other
6%
His-panic or Latino38%
2010
Source: U.S. Census Bureau. 2000 and 2010 Census Counts.

13
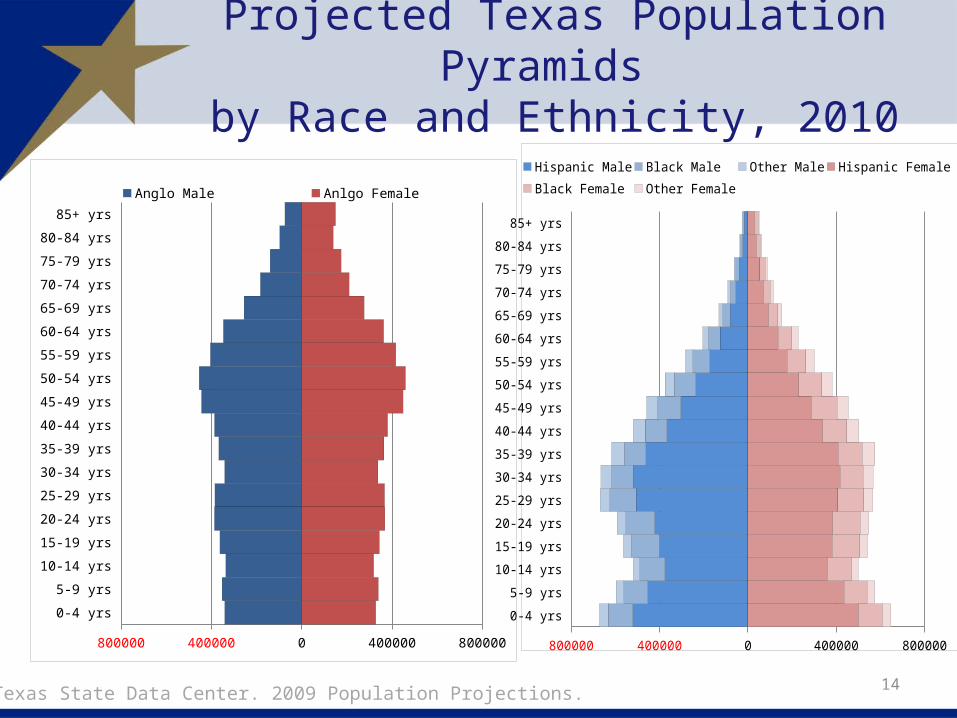
0-4 yrs
5-9 yrs
10-14 yrs
15-19 yrs
20-24 yrs
25-29 yrs
30-34 yrs
35-39 yrs
40-44 yrs
45-49 yrs
50-54 yrs
55-59 yrs
60-64 yrs
65-69 yrs
70-74 yrs
75-79 yrs
80-84 yrs
85+ yrs
1,200,000 800,000 400,000 0 400,000 800,000 1,200,000
Anglo Male Hispanic Male Black Male Other Male Anlgo Female Hispanic Female
Black Female Other Female
Projected Texas Population Pyramid by Race and Ethnicity, 2010
Source: Texas State Data Center. 2009 Population Projections.
14
0-4 yrs
5-9 yrs
10-14 yrs
15-19 yrs
20-24 yrs
25-29 yrs
30-34 yrs
35-39 yrs
40-44 yrs
45-49 yrs
50-54 yrs
55-59 yrs
60-64 yrs
65-69 yrs
70-74 yrs
75-79 yrs
80-84 yrs
85+ yrs
800000 400000 0 400000 800000
Anglo Male Anlgo Female
Projected Texas Population Pyramids by Race and Ethnicity, 2010
0-4 yrs
5-9 yrs
10-14 yrs
15-19 yrs
20-24 yrs
25-29 yrs
30-34 yrs
35-39 yrs
40-44 yrs
45-49 yrs
50-54 yrs
55-59 yrs
60-64 yrs
65-69 yrs
70-74 yrs
75-79 yrs
80-84 yrs
85+ yrs
800000 400000 0 400000 800000
Hispanic Male Black Male Other Male Hispanic Female Black Female
Other Female
Source: Texas State Data Center. 2009 Population Projections.

15
Total Population by County, 2010
Source: U.S. Census Bureau. 2010 Census Count.Map produced by the Texas State Data Center.
Legend
co48_d00
'PROJECTIONS X$'.totpop10
82 - 10,000
10,001 - 50,000
50,001 - 100,001
100,001 - 500,001
500,001 - 1,000,000
1,000,001 - 4,100,000

16
Numeric Change of Total Population by County, 2000-2010
Source: U.S. Census Bureau. 2000 and 2010 Census Counts.Map produced by the Texas State Data Center.
Legend
co48_d00
'PROJECTIONS X$'.totpopch0010
-3,200 - 0
1 - 10,000
10,001 - 50,000
50,001 - 100,000
100,001 - 700,000

17
Percent Change of Total Population by County, 2000-2010
Population increase for Texas was 20.6% during this period.
Source: U.S. Census Bureau. 2000 and 2010 Census Counts.Map produced by the Texas State Data Center.
Water'PROJECTIONS X$'.pctch0010
-20%-0%
1%-10%
10.1-25%
25.1%-50%
50.1%-82%
Physicians per 1,000 Population 2010'PROJECTIONS X$'.difphys
-3 to -0.5
-0.49 to -.001
0
.001 to .5
.51-2.1

Percent of Population That Is Foreign Born
by County, 2005-2009Percent Foreign Born
0-5%
5-10%
10-15%
15-25%
25-35%
Source: U.S. Census Bureau. American Community Survey, 5-Year Sample 2005-2009.Map produced by the Texas State Data Center.
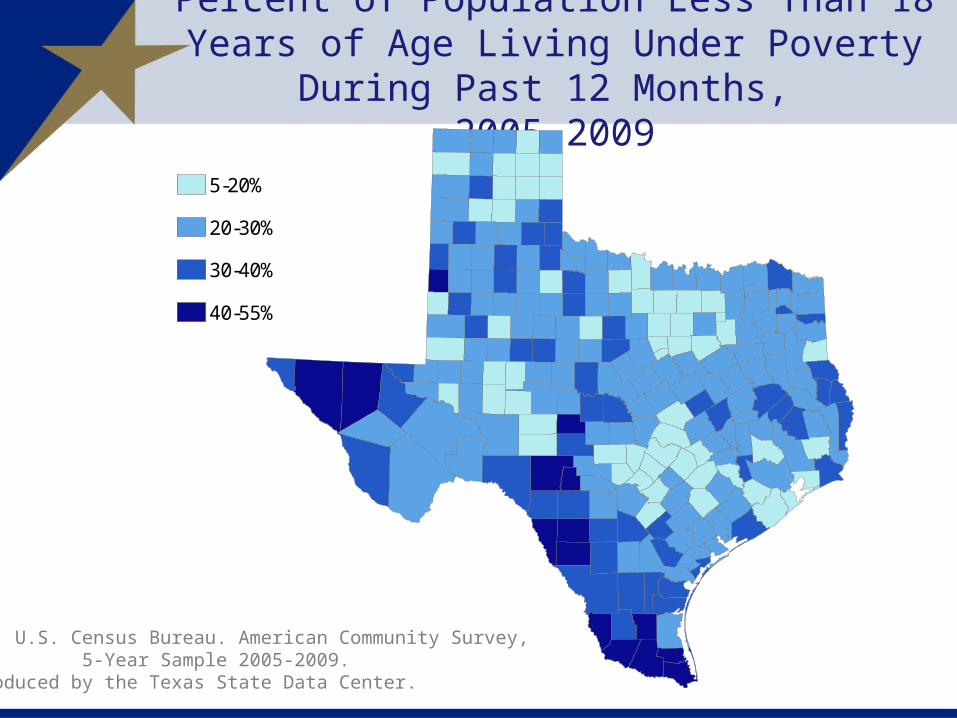
Percent of Population Less Than 18 Years of Age Living Under Poverty During Past 12 Months,
2005-2009
Source: U.S. Census Bureau. American Community Survey, 5-Year Sample 2005-2009.Map produced by the Texas State Data Center.
5-20%
20-30%
30-40%
40-55%

$18,000-30,000
$ 30,000-35,000
$ 35,000-40,000
$40,000-50,000
$ 50,000-76,000
Median Household Income by County, 2005-2009
Source: U.S. Census Bureau. American Community Survey, 5-Year Sample 2005-2009.Map produced by the Texas State Data Center.
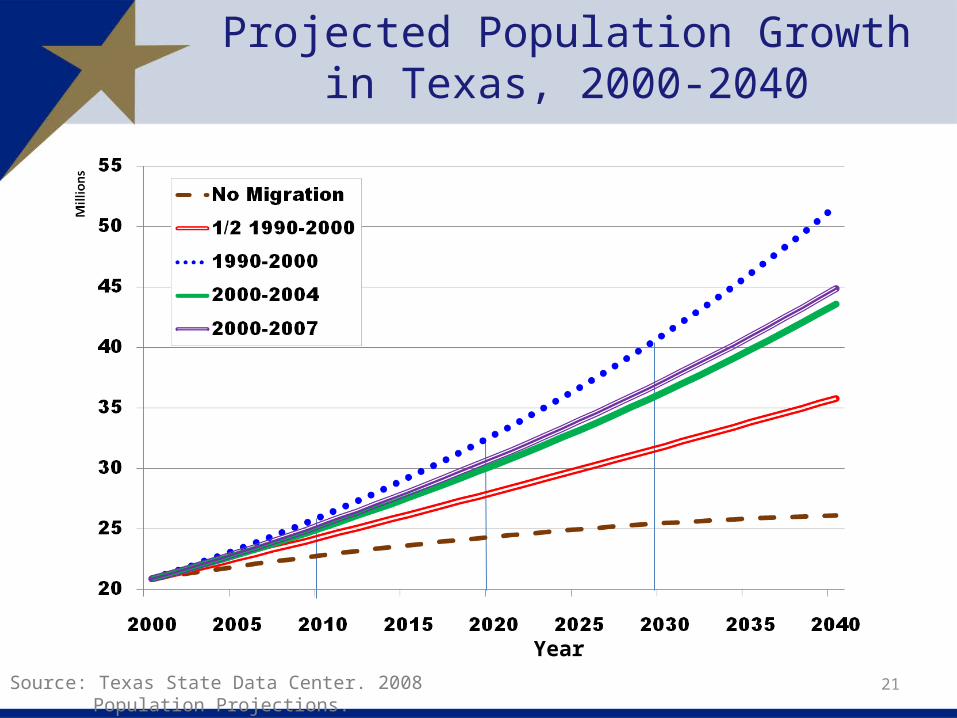
21Source: Texas State Data Center. 2008 Population Projections.
Year
Projected Population Growth in Texas, 2000-2040

2040 Population
P_40
36 - 1000
1001 - 10000
10001 - 50000
50001 - 100000
100001 - 500000
500001 - 1000000
1000001 - 8000000
Projected Population by Texas Counties, 2040
Source: Texas State Data Center. Vintage 2008 Population Projections, 2000-2007 Migration Scenario. Map produced by the Texas State Data Center.

Percent Projected Change of Total Population in Texas Counties, 2008-2040

24
0%
10%
20%
30%
40%
50%
60%
70%
2000
2002
2004
2006
2008
2010
2012
2014
2016
2018
2020
2022
2024
2026
2028
2030
2032
2034
2036
2038
2040
AngloBlackHispanicOther
Source: Texas State Data Center. 2008 Population Projections, 2000-2007 Migration Scenario.
Projected Racial and Ethnic Population Percentages for Texas, 2000-2040

Percent of Population 5 Years and Over Who Speak English Less Than Very Well by State, 2009
Californ
iaTexa
s
Nevada
New York
New Jerse
y
Hawaii
Florid
a
Arizona
New Mexic
o
Miss
issippi
North Dak
ota
Vermont
Montan
a
West
Virginia
0
5
10
15
20
25
Source: U.S. Census Bureau. American Community Survey, 2009.

Percent of Population 5 Years and Over Who Speak Spanish At Home by State, 2009
Texas
Californ
ia
New Mexic
o
Arizona
Nevada
Florid
a
New Jerse
y
New York
Montan
a
North Dak
ota
Main
e
West
Virginia
Vermont
0
5
10
15
20
25
30
35
Source: U.S. Census Bureau. American Community Survey, 2009.

Source: U.S. Census Bureau. American Community Survey, 5-Year Sample 2005-2009.Map produced by the Texas State Data Center.
Percent of Population 5 and Over Who Speak Spanish At Home by County, 2005-2009
Percent aged 5 years plus who speak Spanish at home0-10%
10-25%
25-50%
50-75%
75-96%

Source: U.S. Census Bureau. American Community Survey, 5-Year Sample 2005-2009.Map produced by the Texas State Data Center.
Number Households that are Spanish Linguistically Isolated, 2005-2009
Percent of households spanish linguistically isolatedSpanlingiso
0-1,500
1,501-5,000
5,001 - 10,000
10,001 - 50,000
50,001 - 150,000

Percent of Households that are Spanish
Linguistically Isolated, 2005-2009
0%
0.1% - 5%
5.1%-15%
15.1%-25%
25%-38%
Source: U.S. Census Bureau. American Community Survey, 5-Year Sample 2005-2009.Map produced by the Texas State Data Center.
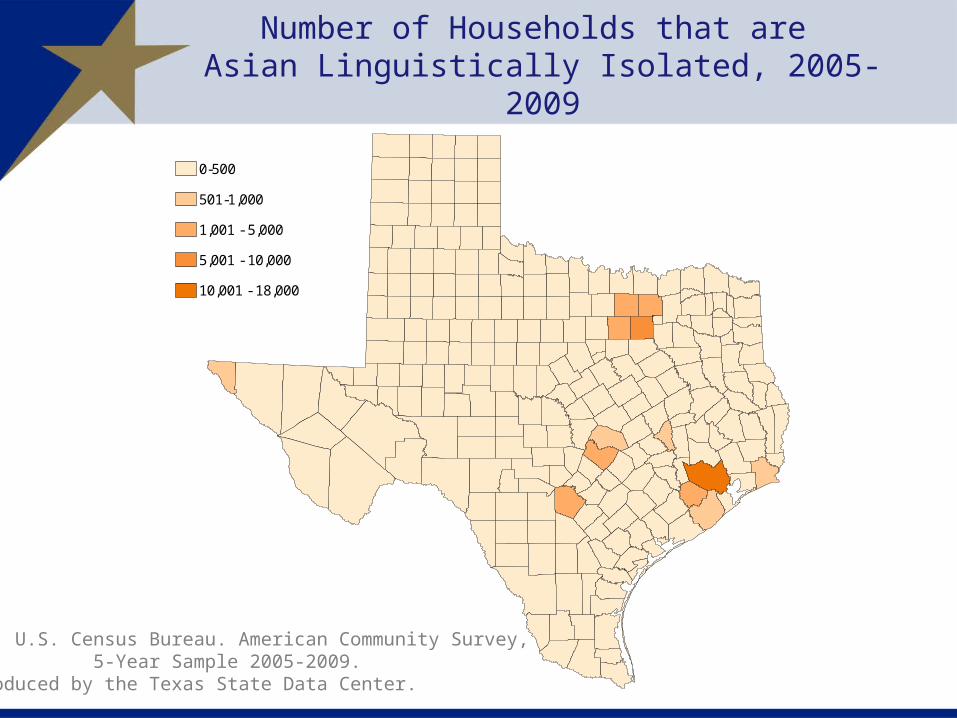
Number of Households that are
Asian Linguistically Isolated, 2005-2009Number of households Asian linguistically isolatedAsianiso
0-500
501-1,000
1,001 - 5,000
5,001 - 10,000
10,001 - 18,000
Source: U.S. Census Bureau. American Community Survey, 5-Year Sample 2005-2009.Map produced by the Texas State Data Center.

Percent of Households that are Asian
Linguistically Isolated, 2006-2009Percent of households Asian linguistically isolatedAsianisopct
0%
.01%-0.5%
0.51% - 1%
1.1% - 1.5%
1.51% - 1.75%
Source: U.S. Census Bureau. American Community Survey, 5-Year Sample 2005-2009.Map produced by the Texas State Data Center.

Percent of Population Aged 25 Years and Older with High
School Degree (or Equivalent) or Higher, 2005-2009
Percent 25+ with High School Degree45-55%
55-65%
65-75%
75-85%
85-98%
Source: U.S. Census Bureau. American Community Survey, 5-Year Sample 2005-2009.Map produced by the Texas State Data Center.
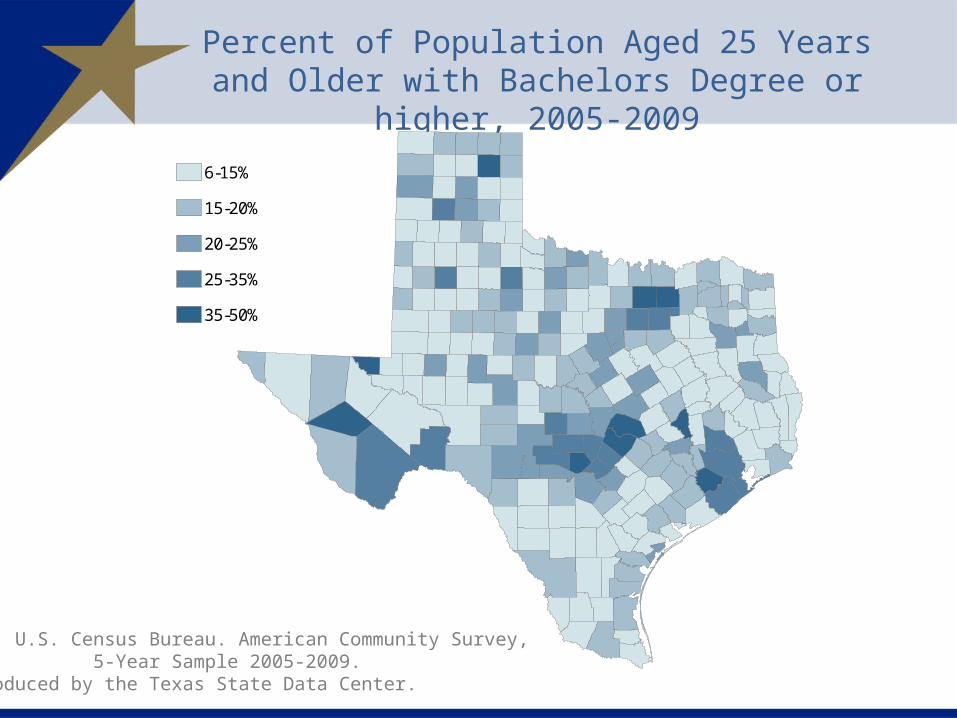
Percent of Population Aged 25 Years and Older with
Bachelors Degree or higher, 2005-2009
Percent 25 + with Bachelors6-15%
15-20%
20-25%
25-35%
35-50%
Source: U.S. Census Bureau. American Community Survey, 5-Year Sample 2005-2009.Map produced by the Texas State Data Center.

34
Educational Attainment of Persons 25 Years of Age and Older by Ethnicity for Texas, 2009
Non-Hispanic WhiteHispanic
0%10%20%30%40%50%60%70%80%90%
100%
8%43%
25%
25%33%
21%34%
11%
Bachelor's degree or higherSome college or as-sociate's degreeHigh school graduate, GED, or alternativeLess than high school diploma
Source: U.S. Census Bureau. American Community Survey, 2009.

35
Projected Increase of Obesity in Texas by Ethnicity, 2006-2040
Source: Texas State Data Center. Population Projections, 2000-2004 Migration Scenario.

36
Estimated Number of Adults with Obesity by County, 2008
Legend
co48_d00
Sheet1$.Nadultobes
0-10,000
10,001-25,000
25,001-75,000
75,001-250,000
250,001-73,000
Source: Centers for Disease Control and Prevention: National Diabetes Surveillance System. Available online at: http://apps.nccd.cdc.gov/DDTSTRS/default.aspx.

37
Projected Number of Adults with Diabetes by Race and Ethnicity for Texas, 2010-2040
2010
2020
2030
2040
0
2,000,000
4,000,000
6,000,000
8,000,000
Total Latino Anglo African American Other
Pro
ject
ed P
ers
ons
with
Dia
bete
s
Source: Office of the State Demographer. 2006 Population Projections, 2000-2004 Migration Scenario.

38
Demographics and Destiny

39
Contact
Office: (512) 463-8390 or (210) 458-6530Email: [email protected]: http://osd.state.tx.us
Lloyd Potter, Ph.D.