texas lyceum executive summary
TRANSCRIPT

Texas Lyceum Executive Summary
Executive Summary of Texans’ Views of the Coronavirus Pandemic and its Economic Consequences
With the worst evaluations of Texas’ and the nation’s economies in Texas Lyceum polling since the Great Recession of 2008, along with significant shares of Texans holding bleak outlooks of the country’s direction and their children’s future, the coronavirus pandemic tops the list of Texans’ greatest concerns: a plurality chose it as the most important problem facing the state and country while 88% expressed at least some concern about the ongoing pandemic.
The reach of the pandemic in Texas, as elsewhere, is significant, with nearly four in five Texas adults saying that they know someone who has contracted COVID-19, and nearly half saying that they personally know someone who has succumbed to the virus. The impact that the virus has had on employment, caregiving, and education is apparent in the 2021 Texas Lyceum Poll, but the financial hardships that Texans have faced due to the economic fallout of the coronavirus are present throughout the poll: 60% of Texans have cut back on entertainment expenses since the pandemic began, 43% on food expenses; 40% have provided financial support to a family member; 39% have lost at least some income; while 34% have delayed or postponed medical care. More generally, 52% of Texas adults say that their personal finances have been negatively impacted by the pandemic, with another 36% saying that the pandemic has negatively impacted their careers.
On a personal level, a majority of Texas adults, 54%, say that their relationships with friends have suffered due to the pandemic, 46% say the same of relationships with family members.
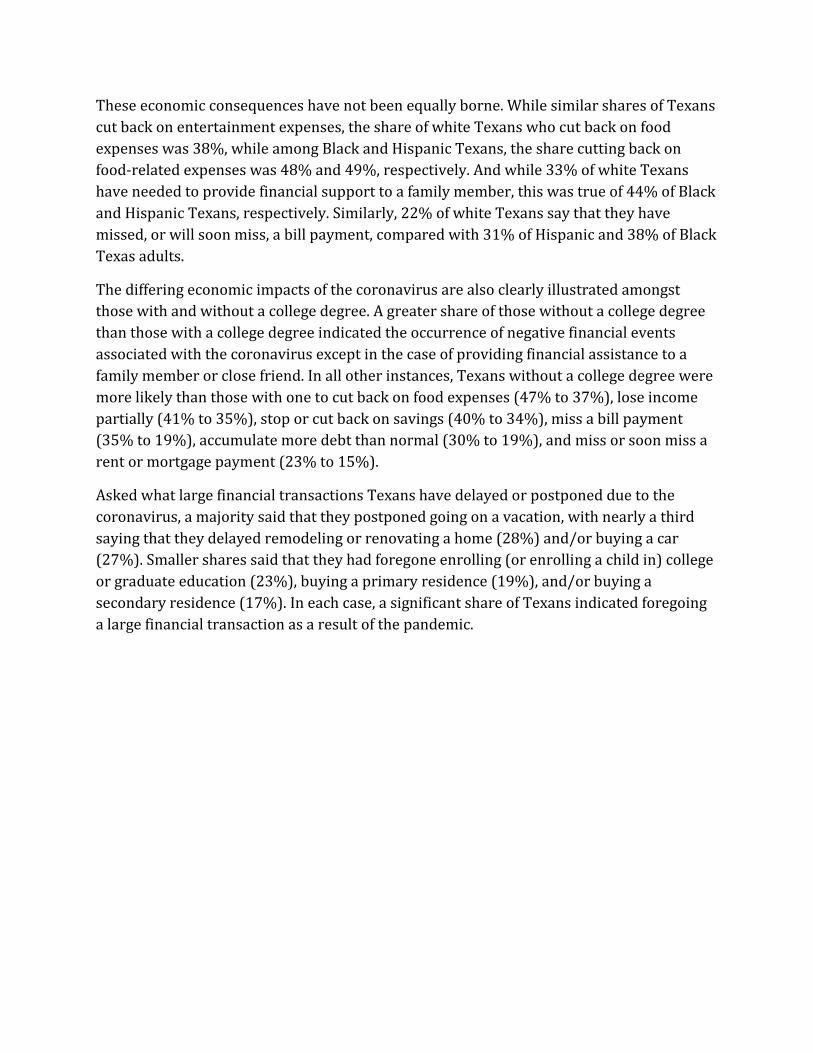
While Texans remain hopeful that the pandemic will be under control within the next 6-months, no doubt informed by the continued distribution of vaccines aimed at eliminating the spread of the virus, only 45% of Texas adults say that they will get a COVID-19 vaccine as soon as it becomes available to them, with 24% unsure if they will, and 26% saying that they will not get vaccinated. Concerns over the safety of COVID-19 vaccines was the primary reason provided by Texans for their reticence, followed by more general concerns about the safety of vaccines.
Ultimately, this creates a problem for Texas in its continued efforts to rebuild the economy as the virus rages on. Only 40% of Texas adults said that they have “a lot” of confidence in their healthcare provider to operate safely during the pandemic, dwarfing the share of

Texans who said the same of their employers (27%), grocery stores (25%), big box stores and local merchants (20% each, respectively), restaurants (16%), gyms (15%), and bars (13%), among others.
This is the context that Texas faces as the 2021 Texas Lyceum Public Conference begins on January 28, 2021, aimed at exploring the impact of a global pandemic on the Texas economy, the truths and myths of the Texas Miracle, and the projected path forward for a growing economy in COVID’s eventual wake.
The Mood of Texas
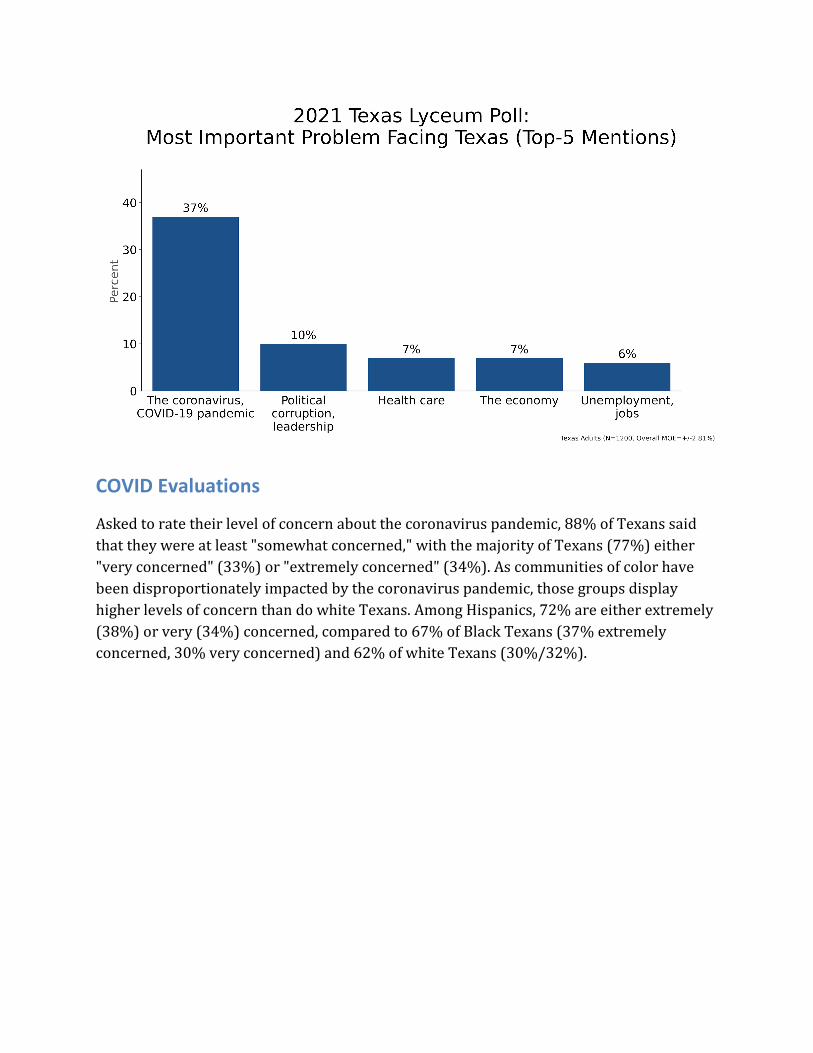
According to Texans, the coronavirus pandemic is the most important problem facing the country (offered by 29%, a plurality, of Texas adults) and the state (offered by 37% of Texas adults). The importance of the coronavirus was apparent across most every demographic and political subgroup. Political corruption and/or leadership was viewed as the second most important issue facing the country and state, no doubt a reflection of the riots that took place at the U.S. Capitol just prior to the survey’s field dates as well as continued efforts in Texas, as elsewhere, to cast doubt on the legitimacy of the 2020 Presidential Election. Overall, 14% of Texans said that political corruption/leadership was the most important problem facing the country, with 10% saying the same about the state.
With the continued spread of COVID-19, the coronavirus pandemic supplanted immigration and border security as the most important issues facing Texans in 2021, with those issues chosen by 28% of Texans in 2020 and 26% in 2019, but only 5% this year.
COVID Evaluations
Asked to rate their level of concern about the coronavirus pandemic, 88% of Texans said that they were at least "somewhat concerned," with the majority of Texans (77%) either "very concerned" (33%) or "extremely concerned" (34%). As communities of color have been disproportionately impacted by the coronavirus pandemic, those groups display higher levels of concern than do white Texans. Among Hispanics, 72% are either extremely (38%) or very (34%) concerned, compared to 67% of Black Texans (37% extremely concerned, 30% very concerned) and 62% of white Texans (30%/32%).
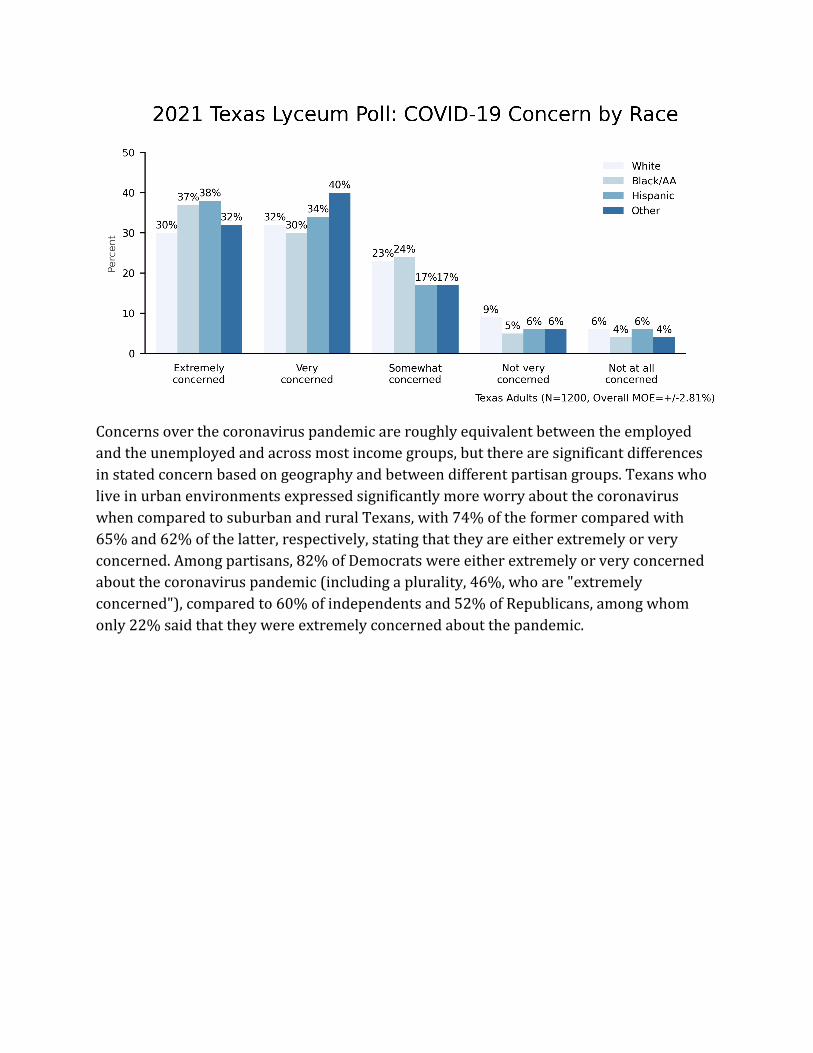
Concerns over the coronavirus pandemic are roughly equivalent between the employed and the unemployed and across most income groups, but there are significant differences in stated concern based on geography and between different partisan groups. Texans who live in urban environments expressed significantly more worry about the coronavirus when compared to suburban and rural Texans, with 74% of the former compared with 65% and 62% of the latter, respectively, stating that they are either extremely or very concerned. Among partisans, 82% of Democrats were either extremely or very concerned about the coronavirus pandemic (including a plurality, 46%, who are "extremely concerned"), compared to 60% of independents and 52% of Republicans, among whom only 22% said that they were extremely concerned about the pandemic.
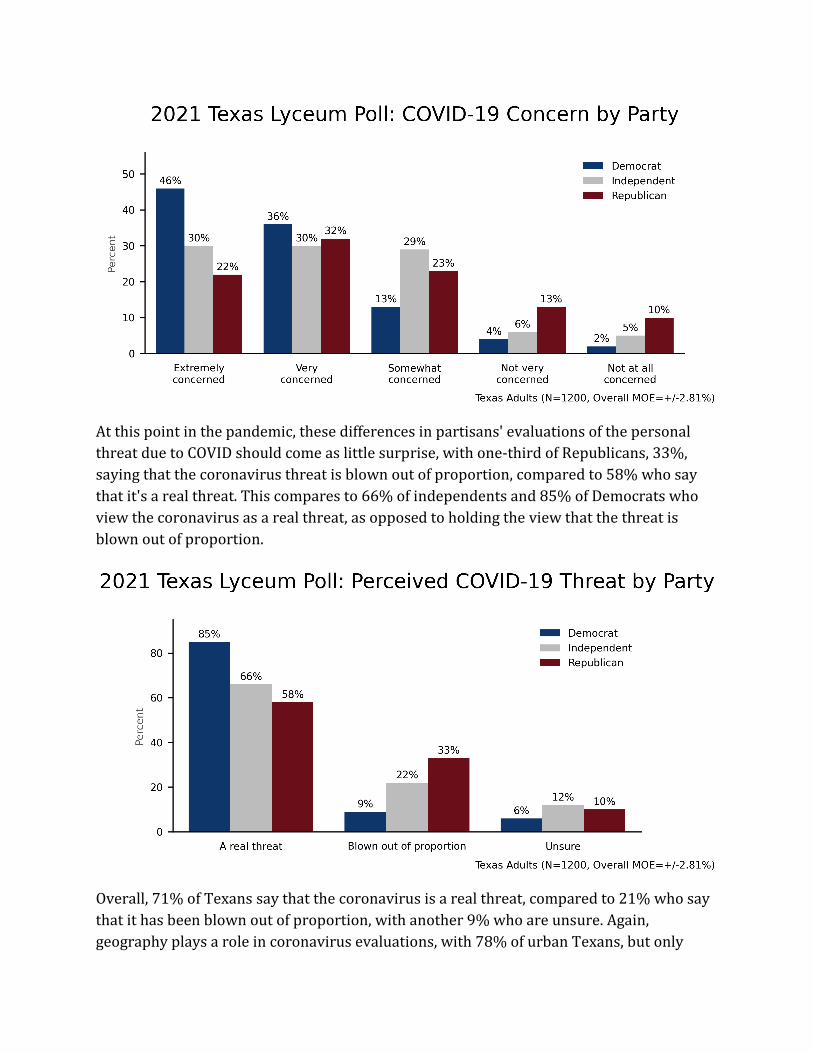
At this point in the pandemic, these differences in partisans' evaluations of the personal threat due to COVID should come as little surprise, with one-third of Republicans, 33%, saying that the coronavirus threat is blown out of proportion, compared to 58% who say that it's a real threat. This compares to 66% of independents and 85% of Democrats who view the coronavirus as a real threat, as opposed to holding the view that the threat is blown out of proportion.
Overall, 71% of Texans say that the coronavirus is a real threat, compared to 21% who say that it has been blown out of proportion, with another 9% who are unsure. Again, geography plays a role in coronavirus evaluations, with 78% of urban Texans, but only

71% of suburban, and 61% of rural Texans expressing the belief that the coronavirus threat is a serious one.
Asked to evaluate how the United States is handling the coronavirus compared to other countries, a slim majority of Texas adults, 51%, say that the United states is doing worse than other countries, with 30% saying that the country is fairing about the same, and only 16% who believe the country is doing a better job than other countries at handling the coronavirus pandemic.
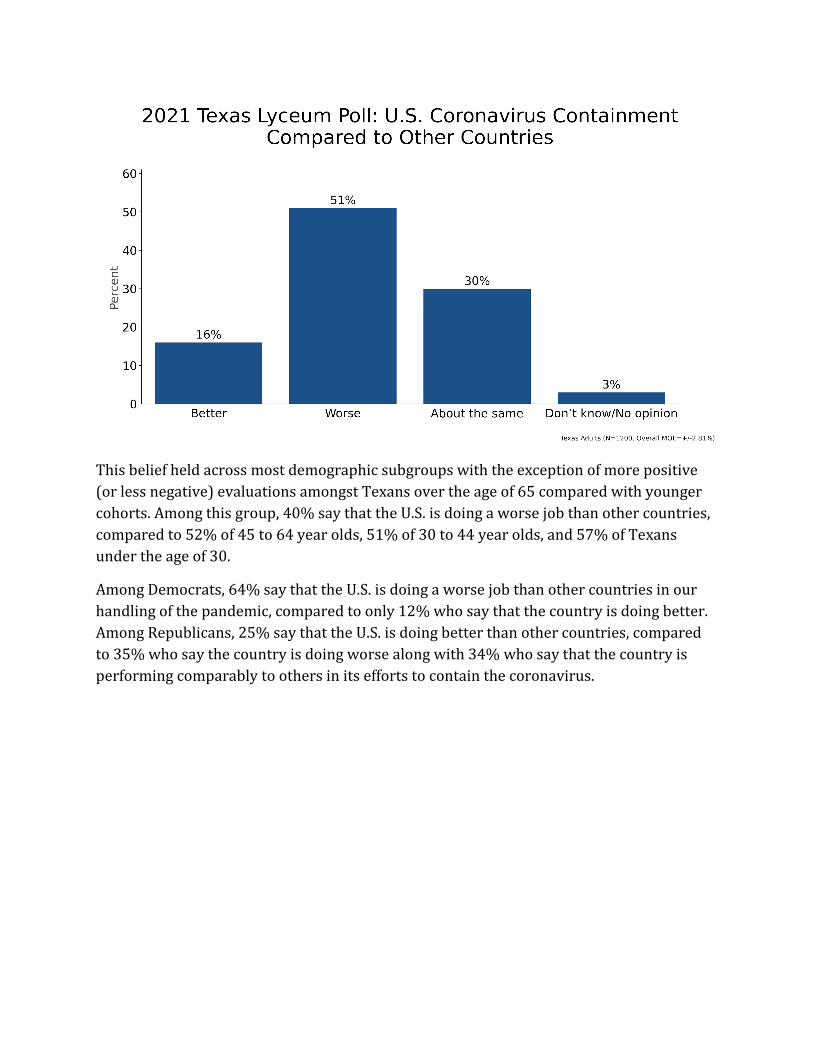
This belief held across most demographic subgroups with the exception of more positive (or less negative) evaluations amongst Texans over the age of 65 compared with younger cohorts. Among this group, 40% say that the U.S. is doing a worse job than other countries, compared to 52% of 45 to 64 year olds, 51% of 30 to 44 year olds, and 57% of Texans under the age of 30.
Among Democrats, 64% say that the U.S. is doing a worse job than other countries in our handling of the pandemic, compared to only 12% who say that the country is doing better. Among Republicans, 25% say that the U.S. is doing better than other countries, compared to 35% who say the country is doing worse along with 34% who say that the country is performing comparably to others in its efforts to contain the coronavirus.
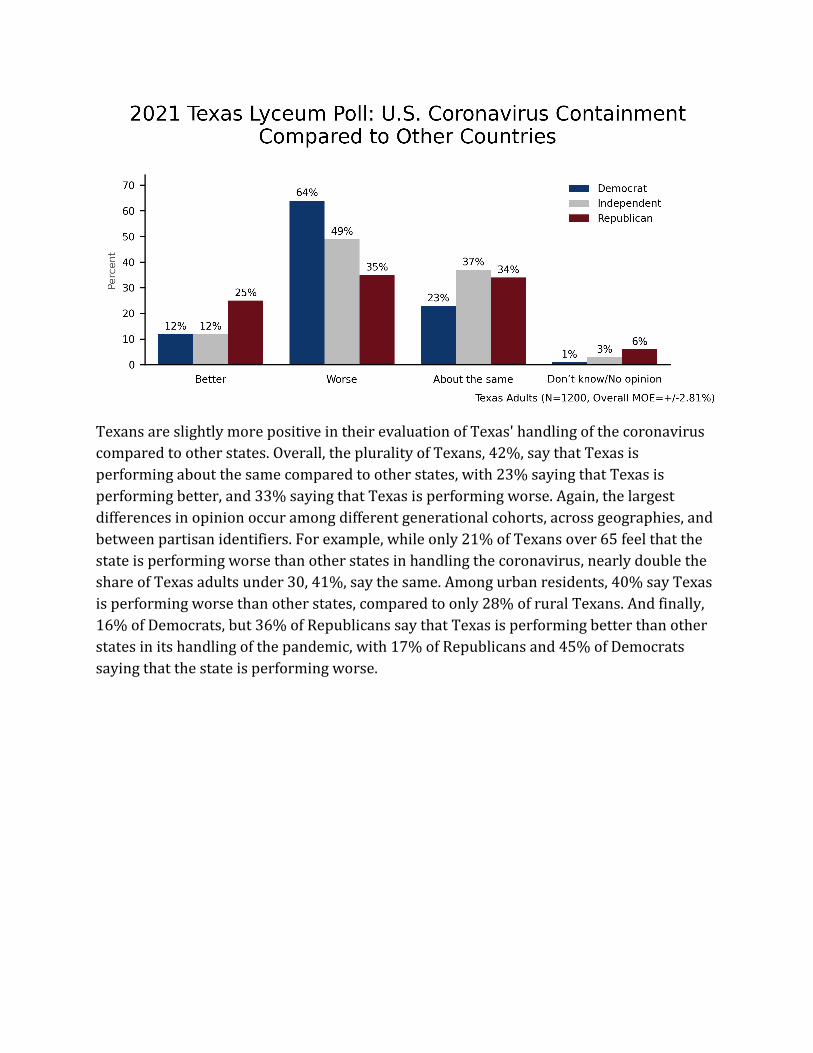
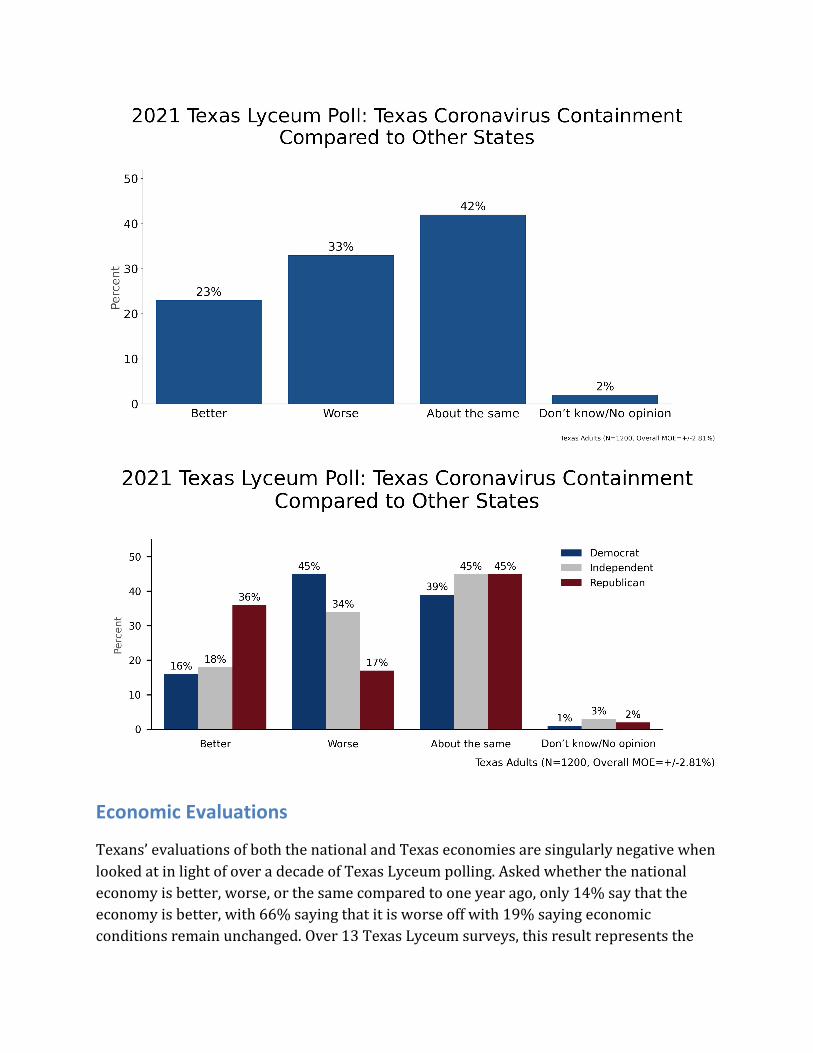
Texans are slightly more positive in their evaluation of Texas' handling of the coronavirus compared to other states. Overall, the plurality of Texans, 42%, say that Texas is performing about the same compared to other states, with 23% saying that Texas is performing better, and 33% saying that Texas is performing worse. Again, the largest differences in opinion occur among different generational cohorts, across geographies, and between partisan identifiers. For example, while only 21% of Texans over 65 feel that the state is performing worse than other states in handling the coronavirus, nearly double the share of Texas adults under 30, 41%, say the same. Among urban residents, 40% say Texas is performing worse than other states, compared to only 28% of rural Texans. And finally, 16% of Democrats, but 36% of Republicans say that Texas is performing better than other states in its handling of the pandemic, with 17% of Republicans and 45% of Democrats saying that the state is performing worse.
Economic Evaluations
Texans’ evaluations of both the national and Texas economies are singularly negative when looked at in light of over a decade of Texas Lyceum polling. Asked whether the national economy is better, worse, or the same compared to one year ago, only 14% say that the economy is better, with 66% saying that it is worse off with 19% saying economic conditions remain unchanged. Over 13 Texas Lyceum surveys, this result represents the
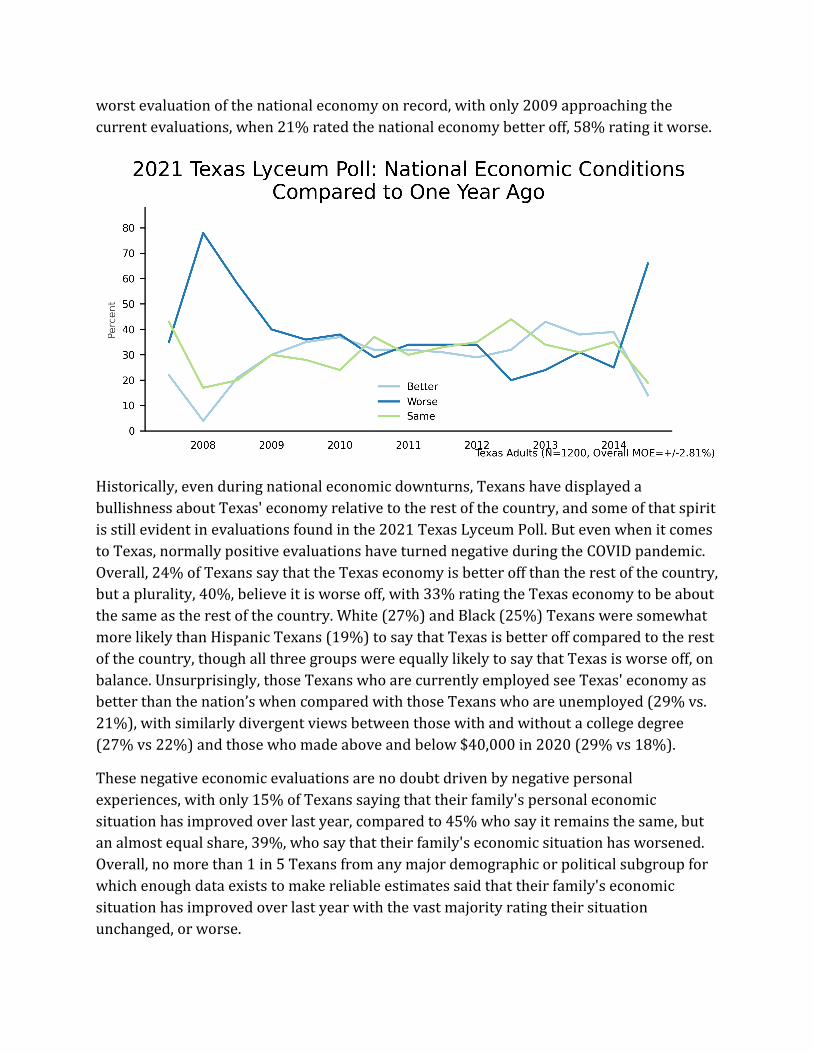
worst evaluation of the national economy on record, with only 2009 approaching the current evaluations, when 21% rated the national economy better off, 58% rating it worse.
Historically, even during national economic downturns, Texans have displayed a bullishness about Texas' economy relative to the rest of the country, and some of that spirit is still evident in evaluations found in the 2021 Texas Lyceum Poll. But even when it comes to Texas, normally positive evaluations have turned negative during the COVID pandemic. Overall, 24% of Texans say that the Texas economy is better off than the rest of the country, but a plurality, 40%, believe it is worse off, with 33% rating the Texas economy to be about the same as the rest of the country. White (27%) and Black (25%) Texans were somewhat more likely than Hispanic Texans (19%) to say that Texas is better off compared to the rest of the country, though all three groups were equally likely to say that Texas is worse off, on balance. Unsurprisingly, those Texans who are currently employed see Texas' economy as better than the nation’s when compared with those Texans who are unemployed (29% vs. 21%), with similarly divergent views between those with and without a college degree (27% vs 22%) and those who made above and below $40,000 in 2020 (29% vs 18%).
These negative economic evaluations are no doubt driven by negative personal experiences, with only 15% of Texans saying that their family's personal economic situation has improved over last year, compared to 45% who say it remains the same, but an almost equal share, 39%, who say that their family's economic situation has worsened. Overall, no more than 1 in 5 Texans from any major demographic or political subgroup for which enough data exists to make reliable estimates said that their family's economic situation has improved over last year with the vast majority rating their situation unchanged, or worse.
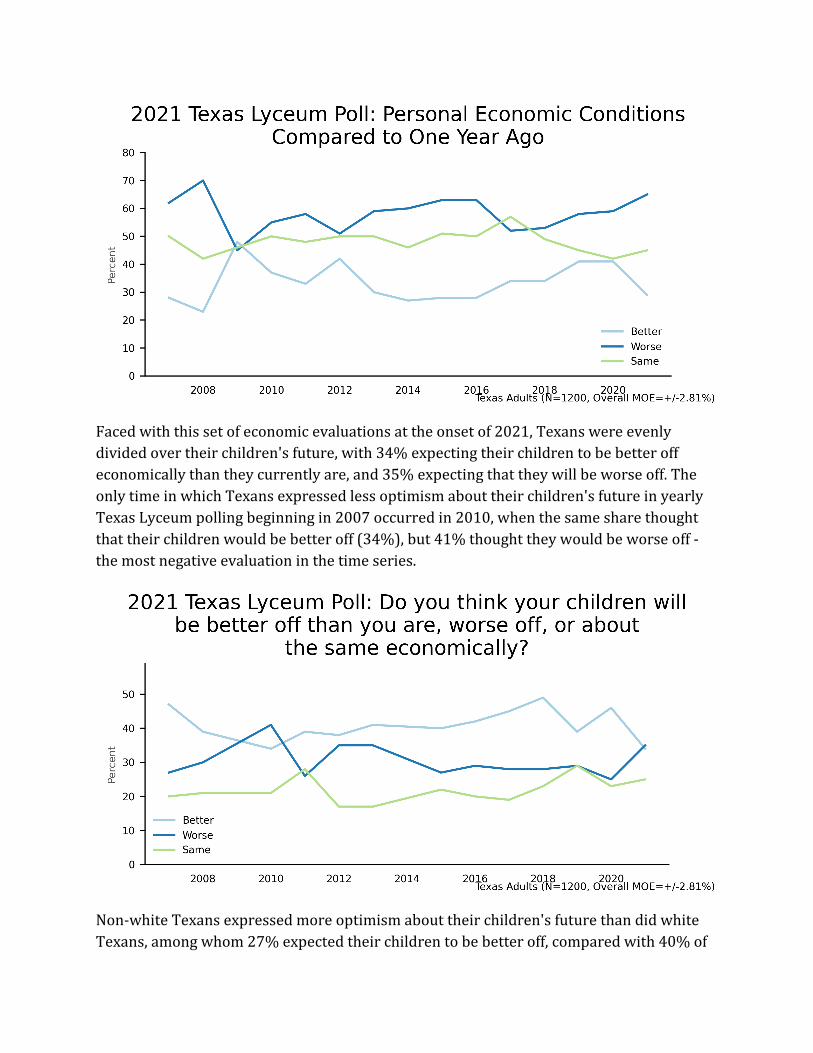
Faced with this set of economic evaluations at the onset of 2021, Texans were evenly divided over their children's future, with 34% expecting their children to be better off economically than they currently are, and 35% expecting that they will be worse off. The only time in which Texans expressed less optimism about their children's future in yearly Texas Lyceum polling beginning in 2007 occurred in 2010, when the same share thought that their children would be better off (34%), but 41% thought they would be worse off - the most negative evaluation in the time series.
Non-white Texans expressed more optimism about their children's future than did white Texans, among whom 27% expected their children to be better off, compared with 40% of

Hispanic and 42% of Black Texans. And in a potential reflection of the changing political environment at the national level after the 2020 Election, Democrats were more optimistic about their children's economic future than were Republicans (39% compared to 30%).
Direction of the Country
Reflecting the realities of the crises faced by Texas and the nation, a majority of Texas adults, 65%, said that the country is on the wrong track, compared with only 29% who said that country is headed in the right direction. This was the most negative assessment of Texans’ assessment of the country’s direction recorded in Lyceum polling since the financial crisis of 2008, during which time Lyceum polling found 70% of Texans saying that the country was headed in the wrong direction and only 23% saying that the country was on the right track. The current, negative view about the direction of the country was broadly held across different subgroups of Texans with some notable differences, in particular, slightly more positive evaluations of the direction of the country among Democrats than Republicans (35% vs. 22%) and among Black (40%) and Hispanic (34%) than among white Texans (23%) — again, likely due to the partisan change of the presidency, and the relative party identifications among white and non-white Texans.
COVID, the Economy, and the Future
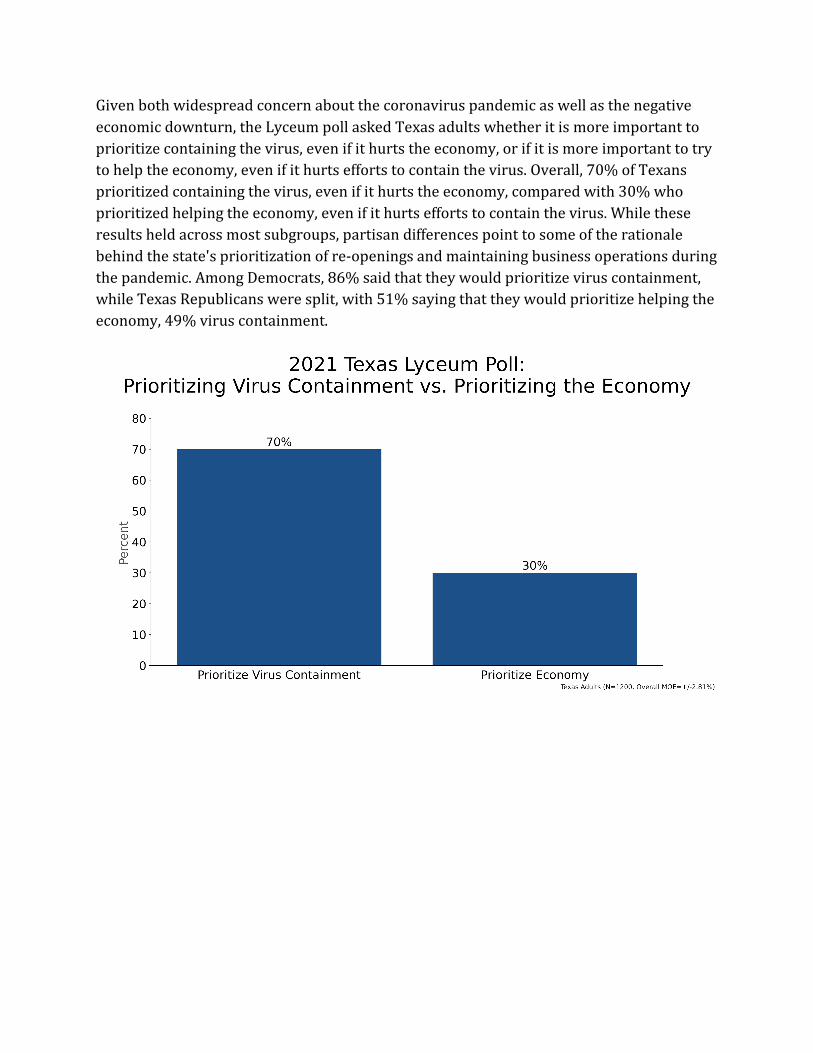
Given both widespread concern about the coronavirus pandemic as well as the negative economic downturn, the Lyceum poll asked Texas adults whether it is more important to prioritize containing the virus, even if it hurts the economy, or if it is more important to try to help the economy, even if it hurts efforts to contain the virus. Overall, 70% of Texans prioritized containing the virus, even if it hurts the economy, compared with 30% who prioritized helping the economy, even if it hurts efforts to contain the virus. While these results held across most subgroups, partisan differences point to some of the rationale behind the state's prioritization of re-openings and maintaining business operations during the pandemic. Among Democrats, 86% said that they would prioritize virus containment, while Texas Republicans were split, with 51% saying that they would prioritize helping the economy, 49% virus containment.
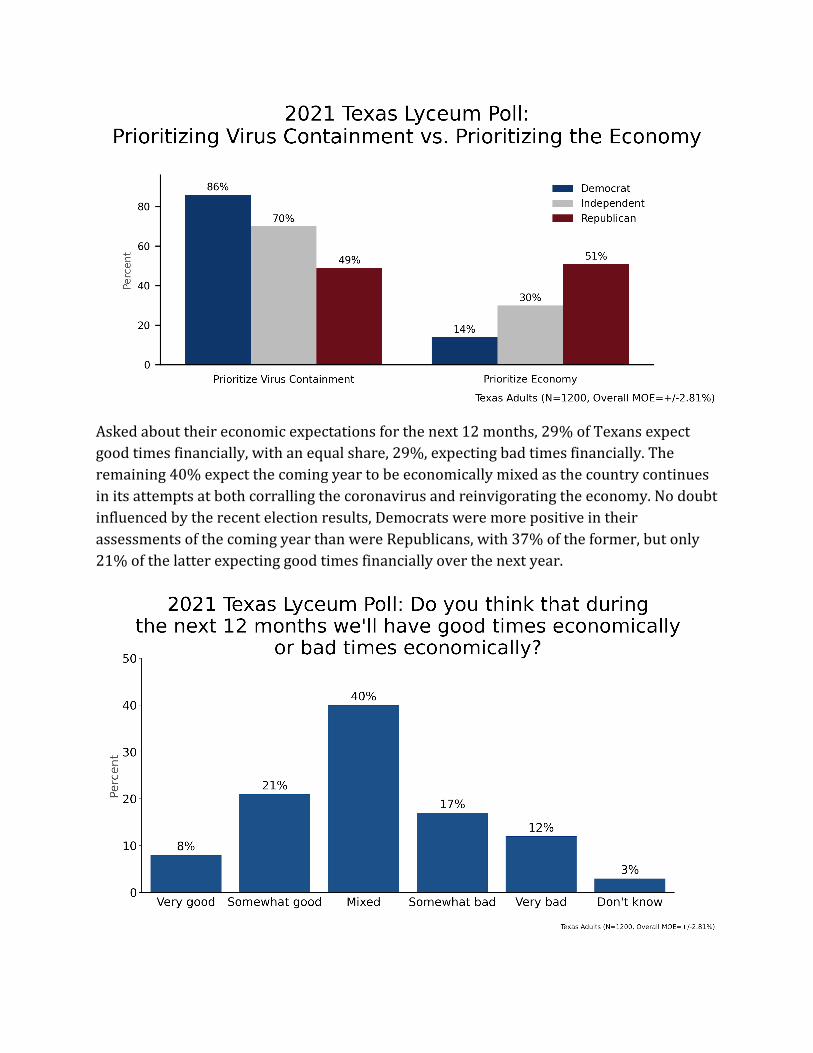
Asked about their economic expectations for the next 12 months, 29% of Texans expect good times financially, with an equal share, 29%, expecting bad times financially. The remaining 40% expect the coming year to be economically mixed as the country continues in its attempts at both corralling the coronavirus and reinvigorating the economy. No doubt influenced by the recent election results, Democrats were more positive in their assessments of the coming year than were Republicans, with 37% of the former, but only 21% of the latter expecting good times financially over the next year.
Texans of color again displayed a more positive expectation about their future economic prospects than did white Texans. Among Hispanic adults, 34% said that they expected better economic times in 2021 compared to 24% who expect things to deteriorate, while among Blacks, 30% said that they expected better economic times this year compared to 24% expecting the economy to worsen. White Texans were more likely than either to expect bad times economically in 2021, with 33% saying that the next 12 months will be bad, compared with 25% who expect things to be good.
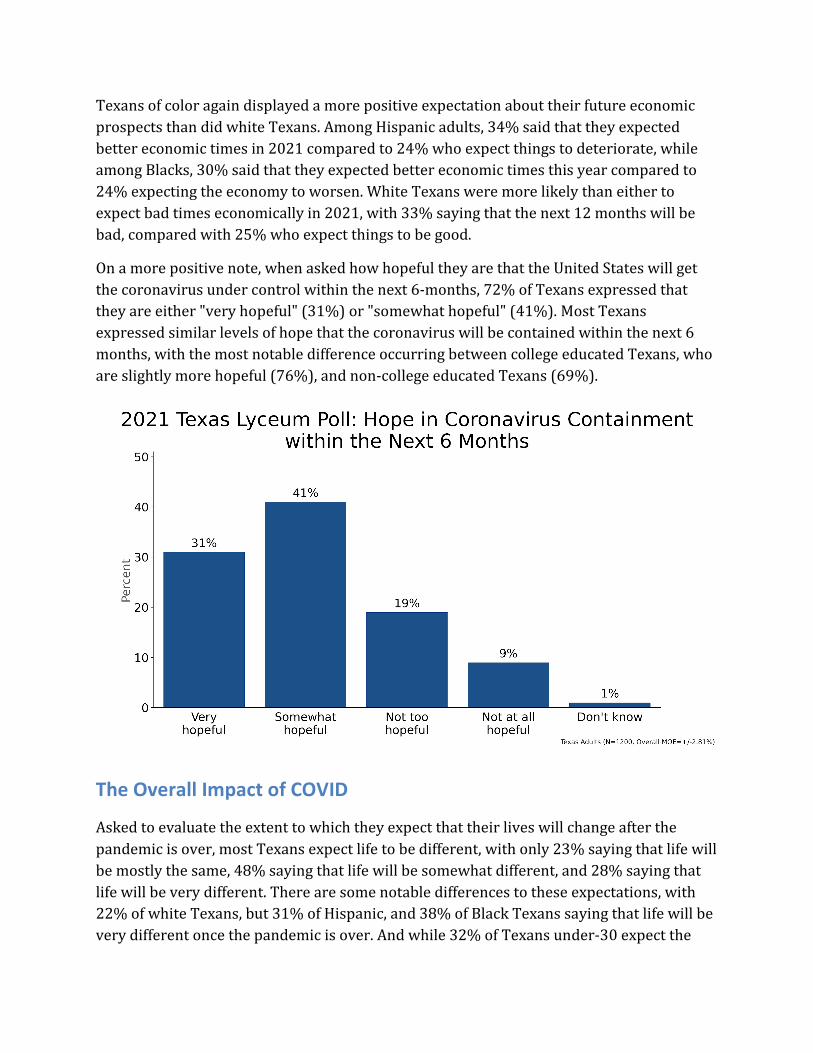
On a more positive note, when asked how hopeful they are that the United States will get the coronavirus under control within the next 6-months, 72% of Texans expressed that they are either "very hopeful" (31%) or "somewhat hopeful" (41%). Most Texans expressed similar levels of hope that the coronavirus will be contained within the next 6 months, with the most notable difference occurring between college educated Texans, who are slightly more hopeful (76%), and non-college educated Texans (69%).
The Overall Impact of COVID
Asked to evaluate the extent to which they expect that their lives will change after the pandemic is over, most Texans expect life to be different, with only 23% saying that life will be mostly the same, 48% saying that life will be somewhat different, and 28% saying that life will be very different. There are some notable differences to these expectations, with 22% of white Texans, but 31% of Hispanic, and 38% of Black Texans saying that life will be very different once the pandemic is over. And while 32% of Texans under-30 expect the

pandemic to change their lives significantly in its aftermath, that was true of only 23% of those over the age of 65.
Given different partisan evaluations of the COVID-19 pandemic, it should come as no surprise to find that Texas Democrats are more likely to expect big life changes after the pandemic is over, with 33% expecting life to be very different (and another 47% who think it will be somewhat different) compared with 22% of Republicans. However, the vast majority of Republicans do expect life to change as a result of the pandemic, with another 47% of Republicans saying that life will be somewhat different.
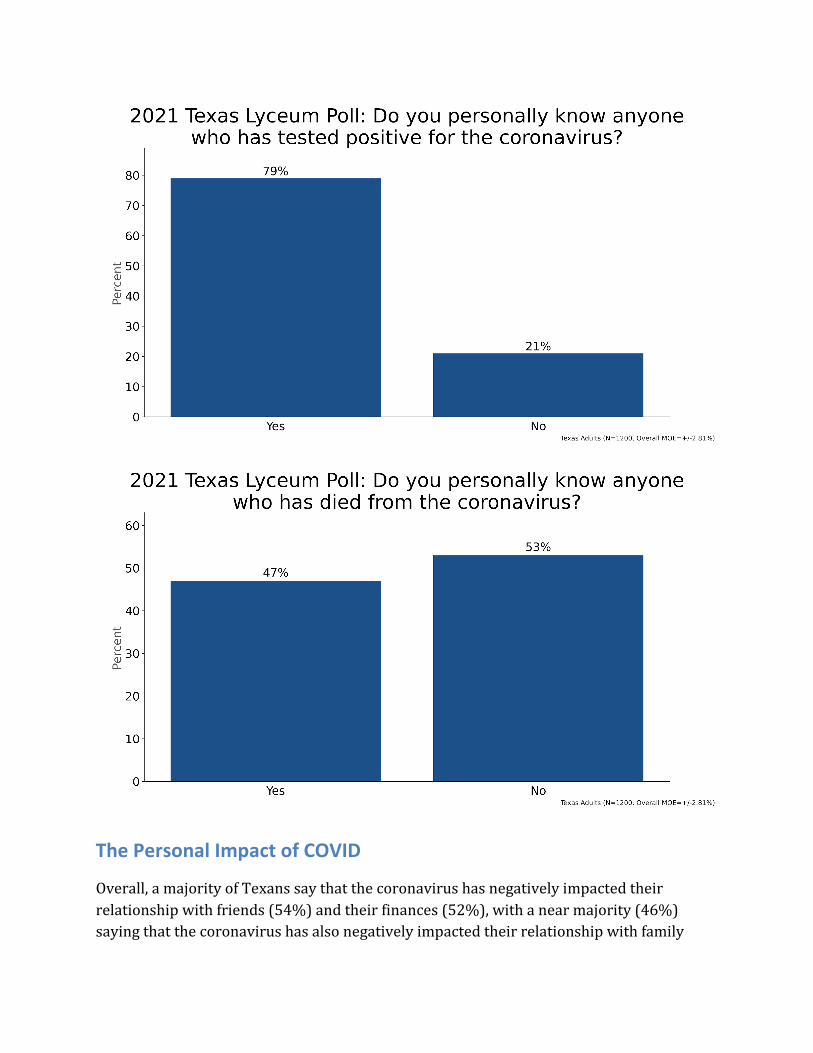
Nearly 4 in 5 Texans, 79%, say that they personally know someone who has been infected with the coronavirus, with nearly half, 47%, personally knowing someone who has died as a result of COVID-19. Personal knowledge of infection was consistent across demographic and political subgroups, but personal acquaintance with someone who has succumbed to the virus illustrates some notable differences. Hispanics were more likely than white or Black Texans to know someone who has died from the coronavirus, with 60% of Hispanics, compared to only 40% and 41% of white and Black Texans, respectively. Interestingly, 54% of Democrats, but only 42% of Republicans say that they know someone who has died of the coronavirus, likely a result of the relationship between race, geography, partisanship, and the pandemic, with a disproportionate share of the cases and deaths occurring among Texans of color, particularly Hispanics, and case surges taking place most notably in urban environments given population density.
The Personal Impact of COVID
Overall, a majority of Texans say that the coronavirus has negatively impacted their relationship with friends (54%) and their finances (52%), with a near majority (46%) saying that the coronavirus has also negatively impacted their relationship with family
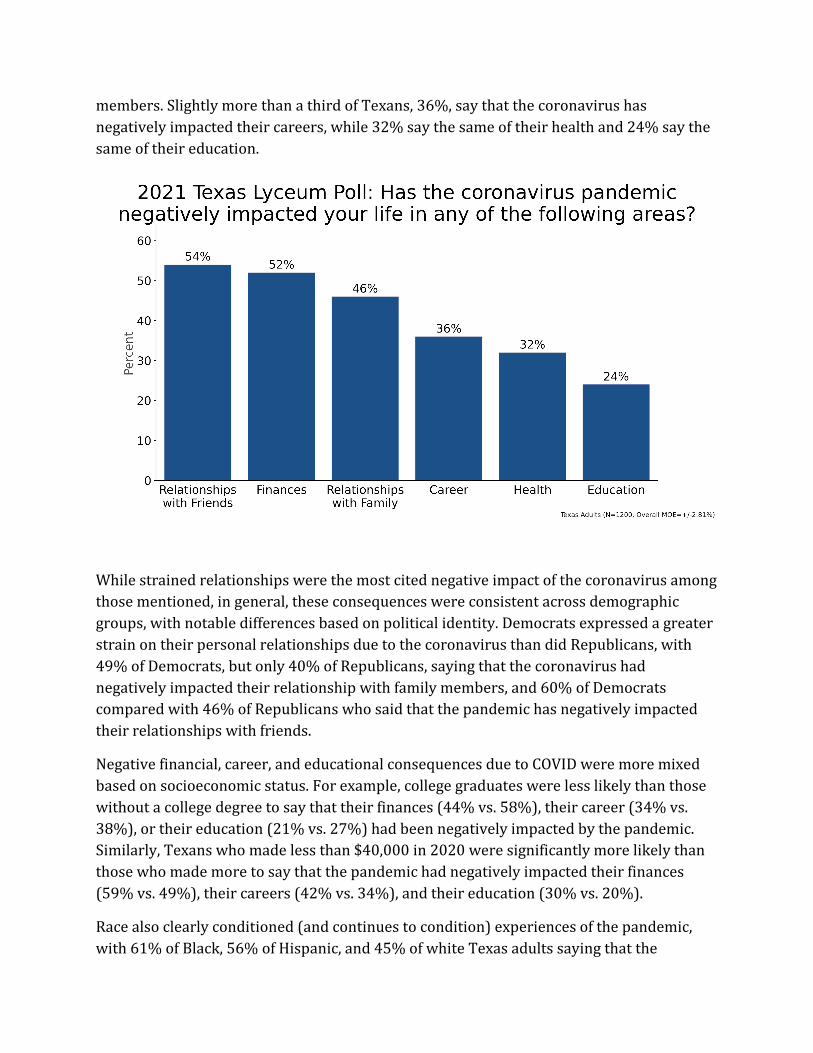
members. Slightly more than a third of Texans, 36%, say that the coronavirus has negatively impacted their careers, while 32% say the same of their health and 24% say the same of their education.
While strained relationships were the most cited negative impact of the coronavirus among those mentioned, in general, these consequences were consistent across demographic groups, with notable differences based on political identity. Democrats expressed a greater strain on their personal relationships due to the coronavirus than did Republicans, with 49% of Democrats, but only 40% of Republicans, saying that the coronavirus had negatively impacted their relationship with family members, and 60% of Democrats compared with 46% of Republicans who said that the pandemic has negatively impacted their relationships with friends.
Negative financial, career, and educational consequences due to COVID were more mixed based on socioeconomic status. For example, college graduates were less likely than those without a college degree to say that their finances (44% vs. 58%), their career (34% vs. 38%), or their education (21% vs. 27%) had been negatively impacted by the pandemic. Similarly, Texans who made less than $40,000 in 2020 were significantly more likely than those who made more to say that the pandemic had negatively impacted their finances (59% vs. 49%), their careers (42% vs. 34%), and their education (30% vs. 20%).
Race also clearly conditioned (and continues to condition) experiences of the pandemic, with 61% of Black, 56% of Hispanic, and 45% of white Texas adults saying that the

coronavirus has negatively impacted their finances. With regards to their careers, 42% of Hispanic, 38% of Black, and 31% of white Texans say that the pandemic has negatively impacted their careers, while 35% of Blacks, 29% of Hispanics, and only 17% of whites say that it has negatively impacted their education.
Asked whether or not a family member or family members have been negatively impacted by the coronavirus with respect to their finances, careers, health, or education, a majority of Texas adults acknowledge negative consequences for a family member's finances (57%), with 49% saying that a career has been negatively impacted, 48% saying that the health of a family member has been negatively impacted, and 37% saying the same of a family member’s education.
Similar to the survey items seeking to identify direct, personal negative consequences of the coronavirus, when asked about the situation of their family members, similar differences emerged based on Texans' different socioeconomic statuses. Among college graduates, 51% said that they have a family member whose finances have been negatively impacted by the coronavirus, while 43% have a family member whose career has been disrupted. Among those without a college degree, these shares increase to 60% and 53%, respectively.
Again, reflective of the differential rates of contraction among communities of color compared with Texas’ white population, Black and Hispanic Texans were more likely than white Texans to have a family member whose health has been negatively impacted by the coronavirus (Black: 50%; Hispanic: 53%; white: 43%). Likewise, while 60% of Black and 64% of Hispanic Texans have a family member whose finances have been negatively impacted by the pandemic, this is true of 49% of white Texans. Similarly, 55% of Hispanic, 52% of Black, and 42% of white Texans say that a family member's career has been negatively impacted by the coronavirus.
Interestingly, Democrats were more likely than Republicans to say that they have family members whose health (54% vs. 43%), finances (63% vs. 46%), career (58% vs. 40%), and education (40% vs. 35%) have been negatively impacted by the coronavirus.
COVID and Employment
A quarter of those surveyed, 24%, said that they had lost their job at some point since the start of the coronavirus outbreak in the U.S. This share was highest among Black (29%) and Hispanic (27%) Texans, compared with white Texans (21%), and was also higher among younger age cohorts, with 27% of 18 to 29 year olds and 37% of 30 to 44 year olds acknowledging a job loss at some point during the pandemic, compared with 18% of 45 to
64 year olds and 8% of those over the age of 65 (no doubt due in part to the greater proportion of this cohort in retirement).
While these results are troubling on their own, 41% of Texans who said that they are currently employed either part- or full-time said that their hours or income had been reduced at some point as a result of the coronavirus pandemic. This was more common among the younger cohorts than among older cohorts, but equally common amongst college graduates and those without a degree.
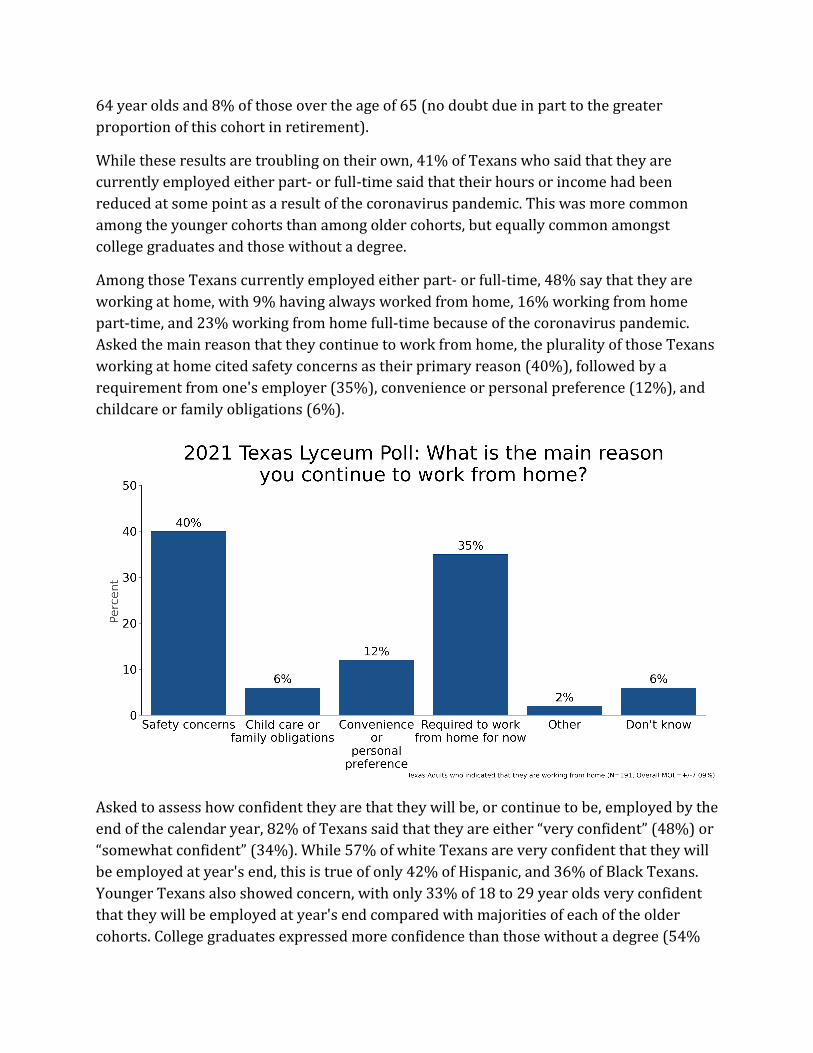
Among those Texans currently employed either part- or full-time, 48% say that they are working at home, with 9% having always worked from home, 16% working from home part-time, and 23% working from home full-time because of the coronavirus pandemic. Asked the main reason that they continue to work from home, the plurality of those Texans working at home cited safety concerns as their primary reason (40%), followed by a requirement from one's employer (35%), convenience or personal preference (12%), and childcare or family obligations (6%).
Asked to assess how confident they are that they will be, or continue to be, employed by the end of the calendar year, 82% of Texans said that they are either “very confident” (48%) or “somewhat confident” (34%). While 57% of white Texans are very confident that they will be employed at year's end, this is true of only 42% of Hispanic, and 36% of Black Texans. Younger Texans also showed concern, with only 33% of 18 to 29 year olds very confident that they will be employed at year's end compared with majorities of each of the older cohorts. College graduates expressed more confidence than those without a degree (54%
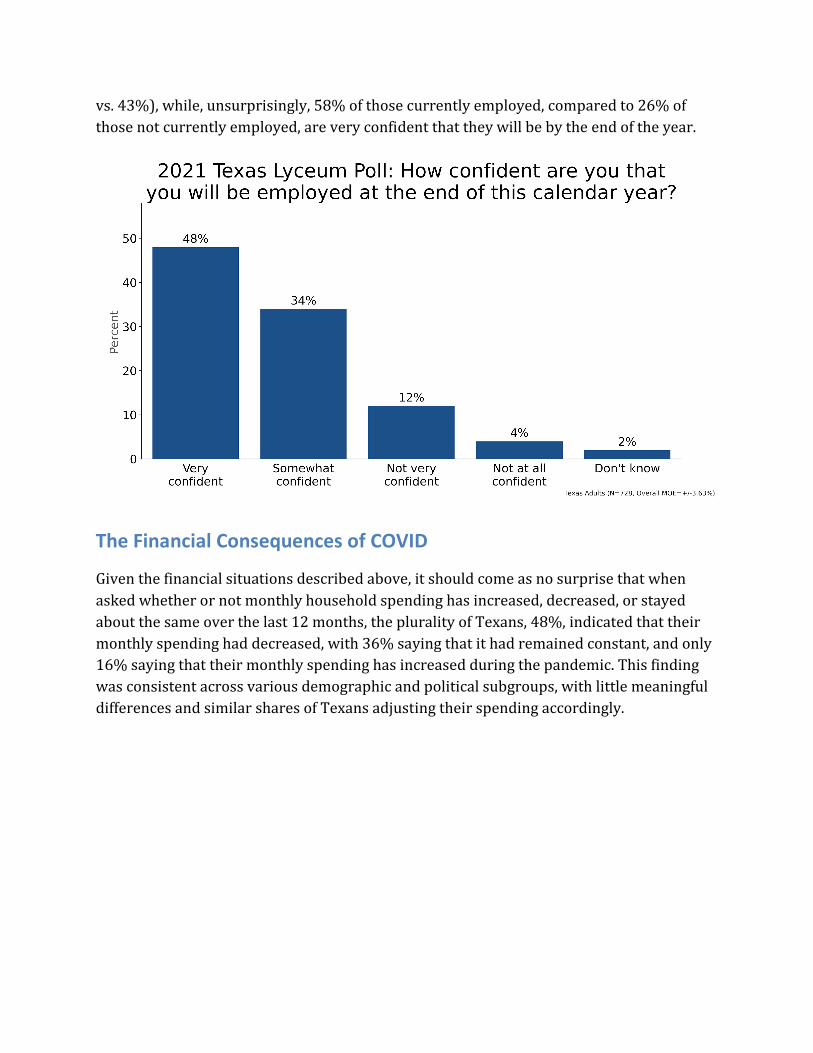
vs. 43%), while, unsurprisingly, 58% of those currently employed, compared to 26% of those not currently employed, are very confident that they will be by the end of the year.
The Financial Consequences of COVID
Given the financial situations described above, it should come as no surprise that when asked whether or not monthly household spending has increased, decreased, or stayed about the same over the last 12 months, the plurality of Texans, 48%, indicated that their monthly spending had decreased, with 36% saying that it had remained constant, and only 16% saying that their monthly spending has increased during the pandemic. This finding was consistent across various demographic and political subgroups, with little meaningful differences and similar shares of Texans adjusting their spending accordingly.
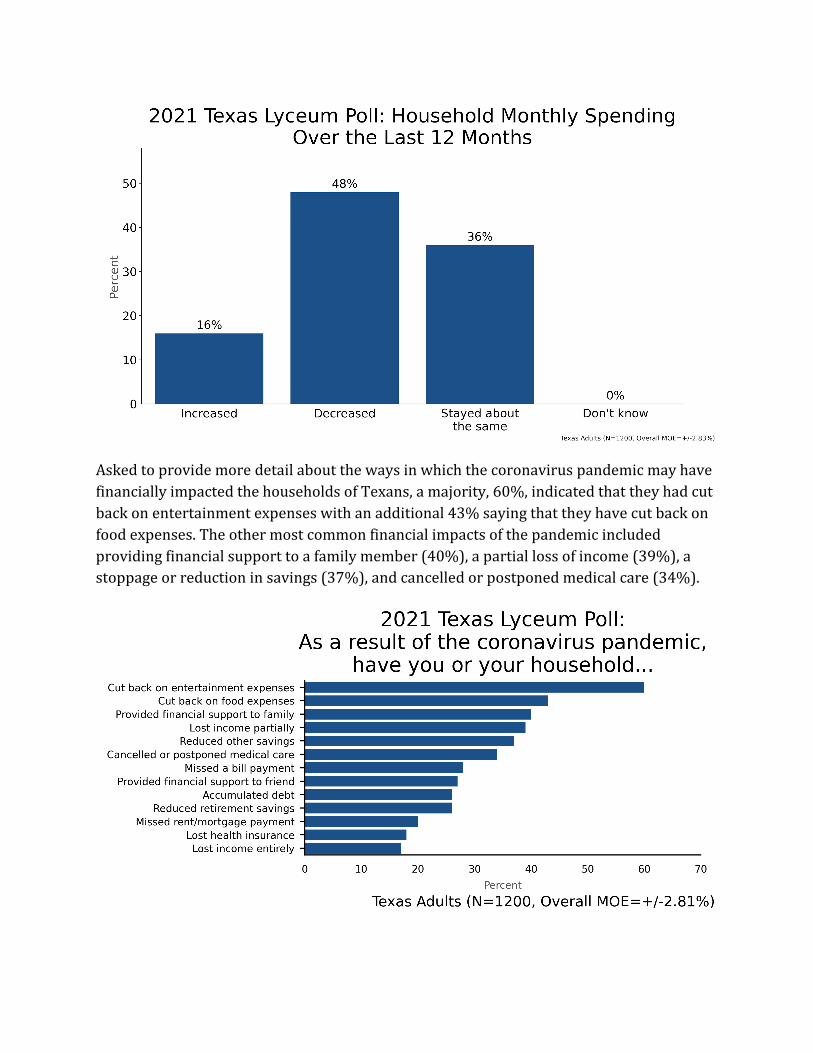
Asked to provide more detail about the ways in which the coronavirus pandemic may have financially impacted the households of Texans, a majority, 60%, indicated that they had cut back on entertainment expenses with an additional 43% saying that they have cut back on food expenses. The other most common financial impacts of the pandemic included providing financial support to a family member (40%), a partial loss of income (39%), a stoppage or reduction in savings (37%), and cancelled or postponed medical care (34%).
These economic consequences have not been equally borne. While similar shares of Texans cut back on entertainment expenses, the share of white Texans who cut back on food expenses was 38%, while among Black and Hispanic Texans, the share cutting back on food-related expenses was 48% and 49%, respectively. And while 33% of white Texans have needed to provide financial support to a family member, this was true of 44% of Black and Hispanic Texans, respectively. Similarly, 22% of white Texans say that they have missed, or will soon miss, a bill payment, compared with 31% of Hispanic and 38% of Black Texas adults.
The differing economic impacts of the coronavirus are also clearly illustrated amongst those with and without a college degree. A greater share of those without a college degree than those with a college degree indicated the occurrence of negative financial events associated with the coronavirus except in the case of providing financial assistance to a family member or close friend. In all other instances, Texans without a college degree were more likely than those with one to cut back on food expenses (47% to 37%), lose income partially (41% to 35%), stop or cut back on savings (40% to 34%), miss a bill payment (35% to 19%), accumulate more debt than normal (30% to 19%), and miss or soon miss a rent or mortgage payment (23% to 15%).
Asked what large financial transactions Texans have delayed or postponed due to the coronavirus, a majority said that they postponed going on a vacation, with nearly a third saying that they delayed remodeling or renovating a home (28%) and/or buying a car (27%). Smaller shares said that they had foregone enrolling (or enrolling a child in) college or graduate education (23%), buying a primary residence (19%), and/or buying a secondary residence (17%). In each case, a significant share of Texans indicated foregoing a large financial transaction as a result of the pandemic.

In each case, the share of Texans who chose to forego each of these transactions in 2020 due to the coronavirus was greater among those Texans who indicated that they live in an urban, as opposed to a suburban or rural environment. Likewise, and more than likely a result of differing views of the seriousness of the pandemic, Democrats were more likely than Republicans in each instance tested to say that they had foregone one of the aforementioned transactions.
Overall, Texans expressed limited confidence in the ability of businesses and institutions to operate safely during the coronavirus pandemic. Asked to evaluate how much trust they have in a number of businesses and institutions to operate safely during the coronavirus pandemic, healthcare providers topped the list, but with only 40% of Texas adults saying that they have "A lot" of confidence in their ability to operate safely (in addition, another 38% said that they have some confidence in healthcare providers). After healthcare providers, one's own employer was the next most trusted (27% saying that they have "a lot" of confidence). No other business or institution received "a lot" of confidence from more than a quarter of Texans, including grocery stores (25%), churches (23%), K-12 public schools (22%), big box stores, local merchants, and airports and airlines (20% each, respectively). In each instance, Republicans expressed more confidence than Democrats in the ability of institutions and businesses to operate safely.

COVID and Caregiving
Since the onset of the coronavirus pandemic, 37% of Texas adults say that their caregiving responsibilities have increased as a result, including 50% of those with children under 18, compared with 12% of Texans who say these responsibilities have decreased, and 49% who say that they've remained about the same. Hispanics were more likely than white or Black Texans to say that their caregiving responsibilities have increased (45% of Hispanics compared to 30% of whites and 29% of Blacks). Women were slightly more likely than men to say that their caregiving responsibilities have increased (39% to 34%).

Among those Texans with children under 18 currently living in their household, asked whether having children at home during the pandemic has been easy or difficult, the plurality of those with children in the household said that it has been difficult (47%), compared to 27% who say it has been easy, and 26% who say that it has been neither easy nor difficult. Thirty-five percent of white Texans say that having their children at home has been either somewhat or very easy, compared with 26% of Blacks and 23% of Hispanics.

Again, among those with children at home, Texans were asked whether or not they would feel safe sending their child to a public school in their area today, a majority of Texans, 53%, said no, with an additional 15% unsure and only 32% saying that they would feel safe sending a child to public school. Unsurprisingly, there were large differences in this assessment. While 44% of white parents currently feel safe sending their children to school, this decreases to 28% of Black and only 23% of Hispanic parents/caregivers. A majority of Republicans, 54%, said that they felt safe sending their children back to public schools, compared with only 24% of Democrats. Overall, large shares of Texas parents expressed concern about sending their children to public school as the Spring semester commences.

The majority of parents/caregivers in Texas, 61%, said that they have had to make school related purchases tied specifically to the coronavirus outbreak, with slightly more than half of those Texans, 53%, saying that those purchases have been a financial hardship for them or their families. Black (83%) and Hispanic (64%) families were more likely than white families (50%) to need to make these additional educational purchases, but were no more likely than white families to see these purchases as a financial hardship (51% of whites; 53% of Blacks; 56% of Hispanics).
COVID Vaccinations
In this January poll, Texans continued to express troublingly limited confidence in the vaccine that has become the primary effort to combat COVID-19 in Texas. The plurality of Texans, 45%, say that they intend to get vaccinated as soon as a COVID vaccine becomes available to them. With 5% saying that they have already received a COVID vaccine, leaving half of Texans who say that they either will not get a COVID vaccine as soon as it becomes available to them (26%), or unsure whether or not they will (24%).

Some Texans are more likely to embrace efforts to vaccinate the population than others. For example, while 45% of white and 47% of Hispanic Texans say that they will get a COVID vaccine as soon as it becomes available, this was true of 38% of Black Texans. Older Texans were more likely than younger Texans to say that they would get vaccinated, including 58% of those over the age of 65, 50% of those between 45 and 64, and 38% of those between under the age of 44. While a majority of those with a college degree, 57%, say that they will get the COVID vaccine, only 37% of those Texans without a college degree confirm that they will definitely get vaccinated. Similarly, while a majority of Democrats, 57%, say that they will get vaccinated as soon as possible, this was only true of 39% of independents and 38% of Republicans.
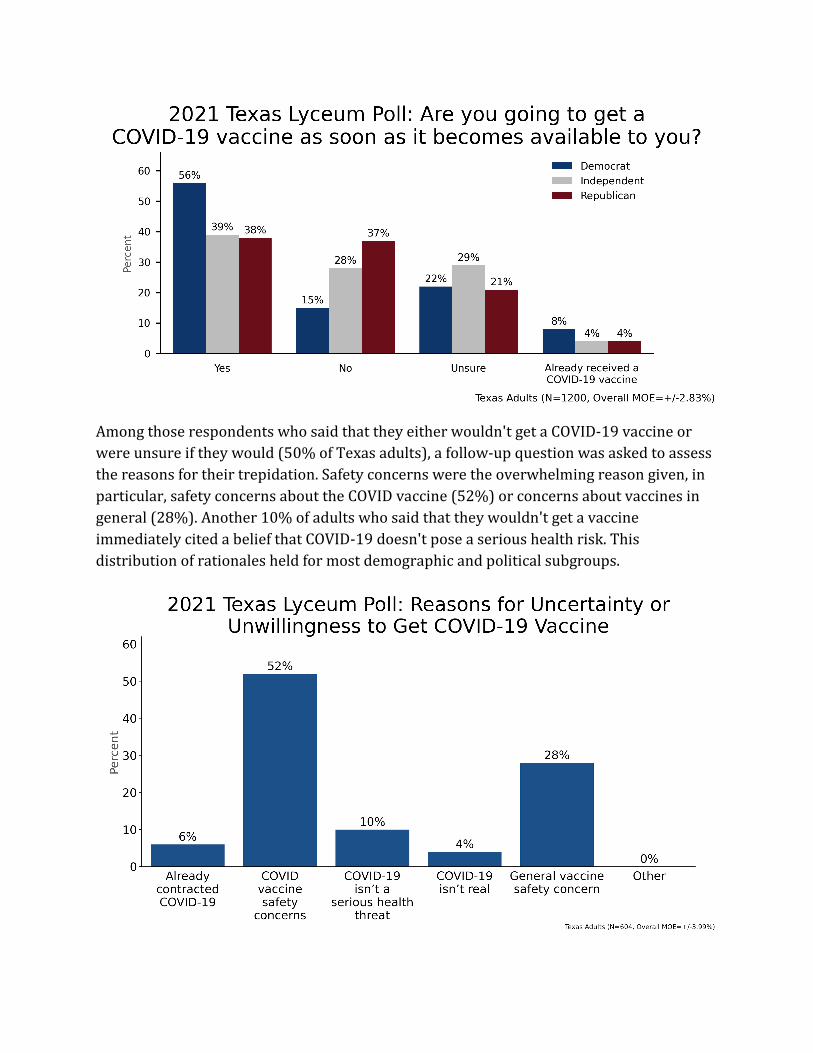
Among those respondents who said that they either wouldn't get a COVID-19 vaccine or were unsure if they would (50% of Texas adults), a follow-up question was asked to assess the reasons for their trepidation. Safety concerns were the overwhelming reason given, in particular, safety concerns about the COVID vaccine (52%) or concerns about vaccines in general (28%). Another 10% of adults who said that they wouldn't get a vaccine immediately cited a belief that COVID-19 doesn't pose a serious health risk. This distribution of rationales held for most demographic and political subgroups.
Looking ahead, Texans were asked whether some businesses or institutions should be allowed to require vaccinations. In particular, Texans were asked whether businesses should be allowed to require their employees to get vaccinated in order to work, educational institutions should be allowed to require that students get vaccinated in order to attend, and stadiums, arenas, or other large events should be allowed to require vaccines before attendance. Overall, 43% of Texans said that employers should be allowed to require vaccinations (38% said that they shouldn't, 18% were unsure), 46% said the same of educational institutions (37% said that they shouldn't, 16% were unsure), while 42% said the same of large events (39% said that they shouldn't, 18% were unsure).
The most notable differences occurred between partisans. Among Democrats, 55% said that employers should be allowed to require vaccinations, compared to 32% of Republicans. Sixty percent of Democrats, but only 36% of Republicans would allow schools to require vaccinations as a requirement before in-person education. A majority of Democrats, 54%, would also allow large events to require vaccinations before attendance, compared to 30% of Republicans.
Political Evaluations
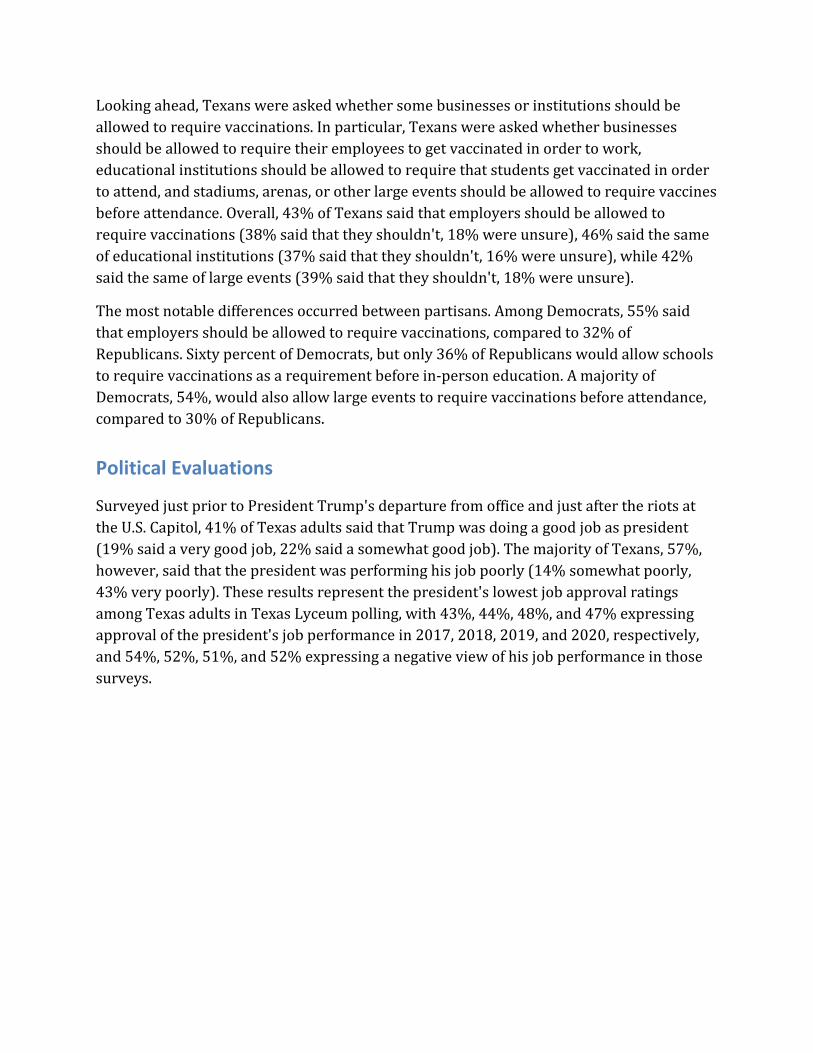
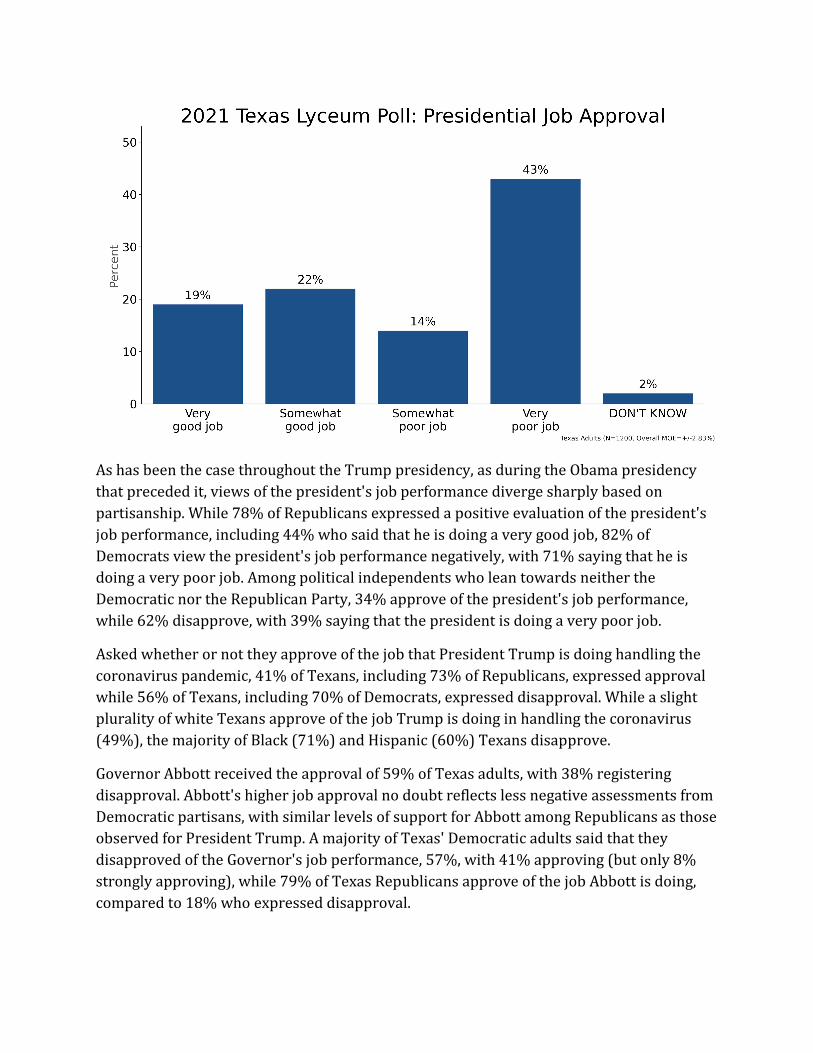
Surveyed just prior to President Trump's departure from office and just after the riots at the U.S. Capitol, 41% of Texas adults said that Trump was doing a good job as president (19% said a very good job, 22% said a somewhat good job). The majority of Texans, 57%, however, said that the president was performing his job poorly (14% somewhat poorly, 43% very poorly). These results represent the president's lowest job approval ratings among Texas adults in Texas Lyceum polling, with 43%, 44%, 48%, and 47% expressing approval of the president's job performance in 2017, 2018, 2019, and 2020, respectively, and 54%, 52%, 51%, and 52% expressing a negative view of his job performance in those surveys.
As has been the case throughout the Trump presidency, as during the Obama presidency that preceded it, views of the president's job performance diverge sharply based on partisanship. While 78% of Republicans expressed a positive evaluation of the president's job performance, including 44% who said that he is doing a very good job, 82% of Democrats view the president's job performance negatively, with 71% saying that he is doing a very poor job. Among political independents who lean towards neither the Democratic nor the Republican Party, 34% approve of the president's job performance, while 62% disapprove, with 39% saying that the president is doing a very poor job.
Asked whether or not they approve of the job that President Trump is doing handling the coronavirus pandemic, 41% of Texans, including 73% of Republicans, expressed approval while 56% of Texans, including 70% of Democrats, expressed disapproval. While a slight plurality of white Texans approve of the job Trump is doing in handling the coronavirus (49%), the majority of Black (71%) and Hispanic (60%) Texans disapprove.
Governor Abbott received the approval of 59% of Texas adults, with 38% registering disapproval. Abbott's higher job approval no doubt reflects less negative assessments from Democratic partisans, with similar levels of support for Abbott among Republicans as those observed for President Trump. A majority of Texas' Democratic adults said that they disapproved of the Governor's job performance, 57%, with 41% approving (but only 8% strongly approving), while 79% of Texas Republicans approve of the job Abbott is doing, compared to 18% who expressed disapproval.

Asked to assess the Governor's job performance with respect to his handling of the COVID pandemic, 54% of Texas adults said that they approved of his handling of the pandemic, with 43% expressing disapproval. Again, partisanship plays a key role in these evaluations, with 75% of Republicans approving of the governor's handling of the crisis, and 58% of Democrats disapproving.
Asked to assess president-elect, and now President, Biden's handling of the response to the coronavirus pandemic, 56% of Texas adults said that they approved of his performance, higher than former President Trump, but statistically indistinguishable from Governor Abbott. While 73% of Democrats approve of Biden's response so far, 52% of Republicans disapprove, with a non-trivial 34% approving.
Asked to evaluate the overall job performances of Lt. Governor Dan Patrick and Attorney General Ken Paxton, 50% of Texas adults said that they approve of the job that the Lt. Governor is doing compared with 39% who disapprove. Asked the same of the Attorney General, 49% approve compared to 39% who disapprove. Democratic adults expressed mixed opinions about both elected officials, with 34% approving of the Lt. Governor (57% disapproving), and 35% approving of the Attorney General (53% disapproving). Among Republicans, 72% expressed positive evaluations of Lt. Governor Patrick, while 64% said the same of Paxton.
Methodology From January 8-17, 2021, The Texas Lyceum conducted a 1000-person telephone survey of adult citizens from the state of Texas. The survey utilized a stratified probability sample design, with respondents being randomly selected at the level of the household and questioned by live interviewers. The survey also employed a randomized cell phone supplement, with 60 percent of completed interviews being conducted among cell phone only or cell phone dominant households. A Spanish-language instrument was developed, and bilingual interviewers offered respondents a chance to participate in English or Spanish. On average, respondents completed the interview in 15 minutes. To ensure an appropriate sub-sample of unregistered citizens, a supplement of 200 interviews among Texas adults confirmed as unregistered was completed online. This yields a total statewide sample of 1,200 adults, 835 of whom are registered voters according to self-reports. The final data set is weighted by race/ethnicity, age and gender to achieve representativeness as defined by the Texas Department State Health Services 2020 population projections. The overall margin of error for the poll is +/- 2.83 percentage points, with a larger margin of error for sub-samples.
The Texas Lyceum The Texas Lyceum has committed to annual probability samples of the state of Texas to bolster its understanding of public opinion on crucial policy issues. The professional rationale for the Texas Lyceum Poll is straightforward: a non-partisan, high quality, scientific survey designed to provide (1) specific data points on issues of interest, and (2) a time series of key demographics, attitudes, and opinions. Towards this end, the trademark of the Texas Lyceum Poll is transparency. Top-line and detailed cross-tabular results of each poll will be made available on the Texas Lyceum website at www.texaslyceum.org. The Texas Lyceum, now 40 years strong, is a non-profit, non-partisan statewide leadership organization focused on identifying the next generation of Texas leaders. The Texas Lyceum consists of 96 men and women from throughout the state. Directors begin their service while under the age of 46 and have demonstrated leadership in their community and profession, together with a deep commitment to Texas. The Texas Lyceum acts as a catalyst to bring together diverse opinions and expertise to focus on national and state issues, and seeks to emphasize constructive private sector, public sector, and individual responses to the issues. To accomplish these purposes, the Lyceum conducts periodic public forums, commissions The Texas Lyceum Poll, and convenes programs for the Directors to explore and discuss key economic and social issues of the state and nation.

TEXAS LYCEUM POLL
2021 Texas Statewide Survey
N=1,200 ADULTS MOE=+/-2.83 PERCENTAGE POINTS (UNLESS OTHERWISE NOTED) CELL PHONE SUPPLEMENT (600 respondents) ONLINE SUPPLEMENT (200 respondents) BILINGUAL INSTRUMENT/INTERVIEWERS January 8-17, 2021 Hello. We’re conducting a survey on behalf of the Texas Lyceum, a nonprofit, non-partisan organization focused on public policy issues affecting Texas and the United States. May I please speak with the person in your home who is 18 or older and who will be having the next birthday? IF ASK WHY BIRTHDAY SELECTION: This helps us make sure we represent adults living within a household correctly. IF NECESSARY: We’re interested in your views on several current issues. We would like to include your responses to this survey, which will be kept absolutely confidential, with the responses of several hundred other Texans like you. The survey should take about 12 minutes to complete, depending on your answers. SECTION I: GENERAL MOOD Q1. Are you registered to vote in the state of Texas?
1. Yes, registered. 70% 2. No, not registered. 30 Q2. Generally speaking, would you say that you are extremely interested in politics and public affairs, somewhat interested, not very interested, or not at all interested?
1. Extremely interested 28% 2. Somewhat interested 42 3. Not very interested 16 4. Not at all interested 14 5. DON’T KNOW/REFUSED/NA 0
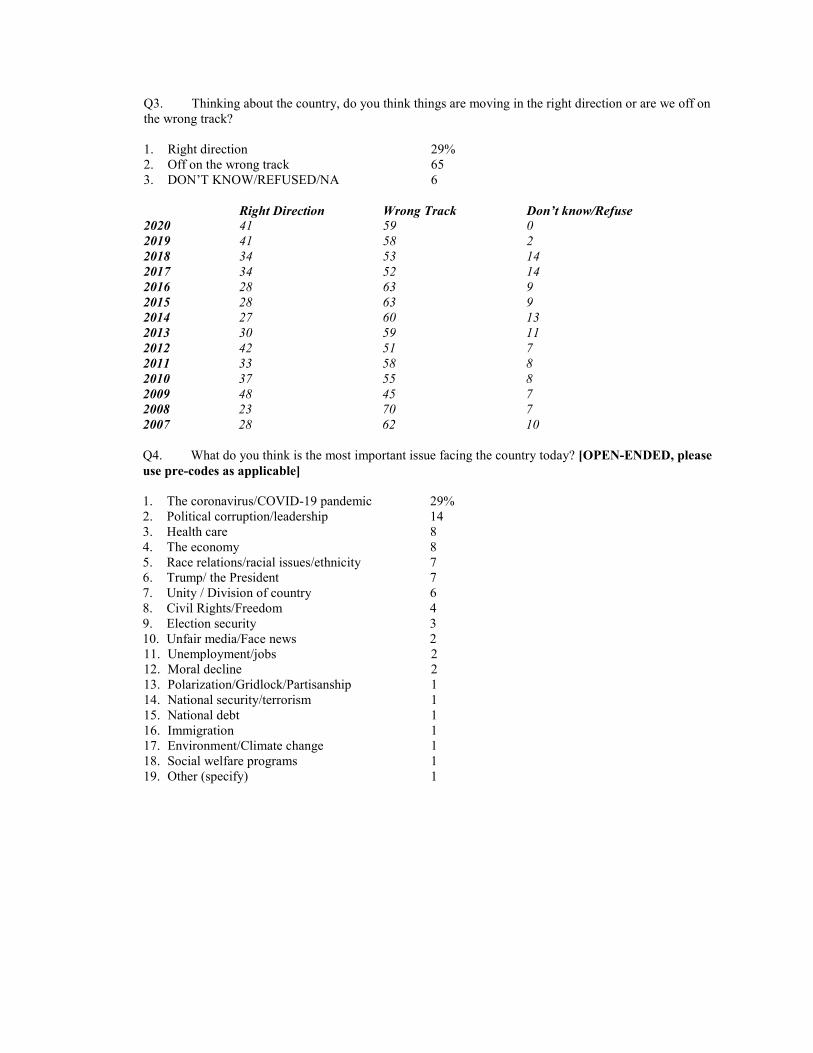
Q3. Thinking about the country, do you think things are moving in the right direction or are we off on the wrong track?
1. Right direction 29% 2. Off on the wrong track 65 3. DON’T KNOW/REFUSED/NA 6
Right Direction Wrong Track Don’t know/Refuse 2020 41 59 0 2019 41 58 2 2018 34 53 14 2017 34 52 14 2016 28 63 9 2015 28 63 9 2014 27 60 13 2013 30 59 11 2012 42 51 7 2011 33 58 8 2010 37 55 8 2009 48 45 7 2008 23 70 7 2007 28 62 10
Q4. What do you think is the most important issue facing the country today? [OPEN-ENDED, please use pre-codes as applicable]
1. The coronavirus/COVID-19 pandemic 29% 2. Political corruption/leadership 14 3. Health care 8 4. The economy 8 5. Race relations/racial issues/ethnicity 7 6. Trump/ the President 7 7. Unity / Division of country 6 8. Civil Rights/Freedom 4 9. Election security 3 10. Unfair media/Face news 2 11. Unemployment/jobs 2 12. Moral decline 2 13. Polarization/Gridlock/Partisanship 1 14. National security/terrorism 1 15. National debt 1 16. Immigration 1 17. Environment/Climate change 1 18. Social welfare programs 1 19. Other (specify) 1

Q5. What do you think is the most important issue facing the state of Texas today? [OPEN-ENDED, please use pre-codes as applicable]
1. The coronavirus/COVID-19 pandemic 37% 2. Political corruption/leadership 10 3. Health care 7 4. The economy 7 5. Unemployment/jobs 6 6. Civil / Racial rights 6 7. Civil unrest 5 8. Immigration 3 9. Border security 2 10. Crime and drugs 2 11. Education 2 12. Gun violence/gun control 2 13. Liberals moving in from out of state 2 14. Social welfare programs 2 15. The environment/Climate change 1 16. Moral decline 1 17. Taxes 1 18. Population growth 1 19. Energy 1 20. Don't know / No response 2
Q6. How well do you think Donald Trump is handling his job as president? Is he doing a very good job, somewhat good job, somewhat poor job, or very poor job? 1. Very good job 19% 2. Somewhat good job 22 3. Somewhat poor job 14 4. Very poor job 42 5. DON’T KNOW / REFUSED / NA 2
V. Good Job S. Good Job S. Poor Job V. Poor Job DK 2020 27 20 16 36 1 2019 24 24 17 34 0 2018 21 23 18 34 4 2017 19 24 18 36 4
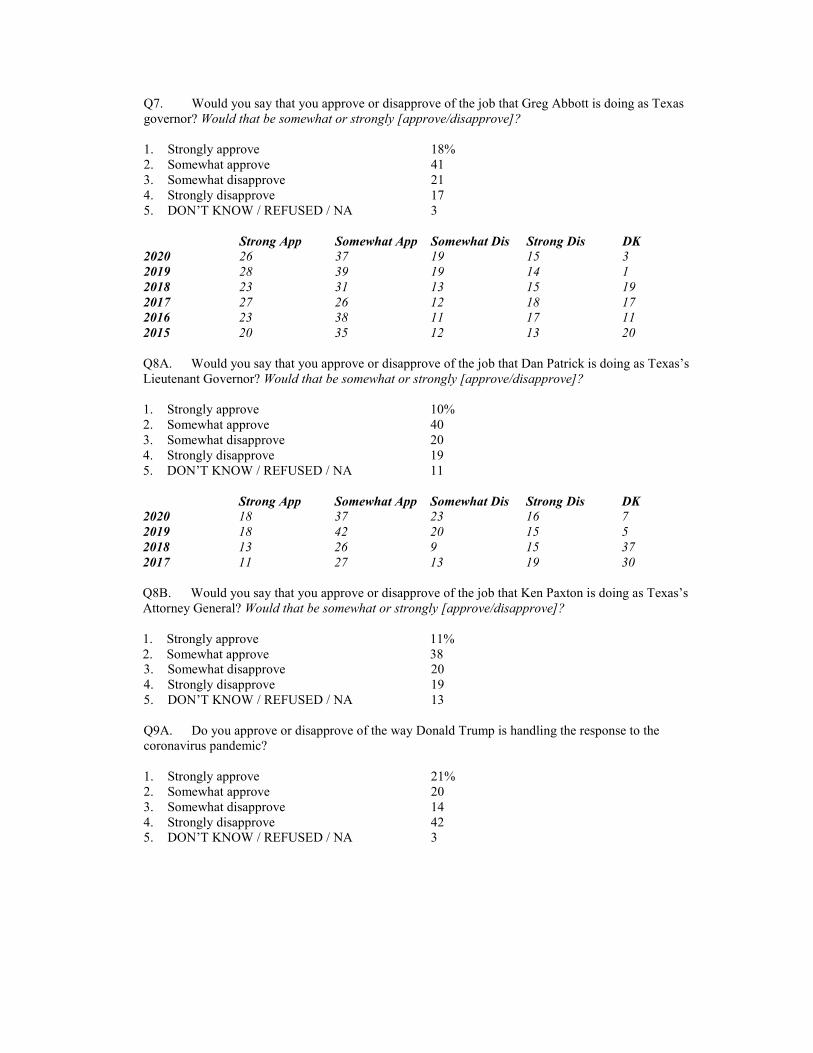
Q7. Would you say that you approve or disapprove of the job that Greg Abbott is doing as Texas governor? Would that be somewhat or strongly [approve/disapprove]?
1. Strongly approve 18% 2. Somewhat approve 41 3. Somewhat disapprove 21 4. Strongly disapprove 17 5. DON’T KNOW / REFUSED / NA 3
Strong App Somewhat App Somewhat Dis Strong Dis DK 2020 26 37 19 15 3 2019 28 39 19 14 1 2018 23 31 13 15 19 2017 27 26 12 18 17 2016 23 38 11 17 11 2015 20 35 12 13 20
Q8A. Would you say that you approve or disapprove of the job that Dan Patrick is doing as Texas’s Lieutenant Governor? Would that be somewhat or strongly [approve/disapprove]?
1. Strongly approve 10% 2. Somewhat approve 40 3. Somewhat disapprove 20 4. Strongly disapprove 19 5. DON’T KNOW / REFUSED / NA 11
Strong App Somewhat App Somewhat Dis Strong Dis DK 2020 18 37 23 16 7 2019 18 42 20 15 5 2018 13 26 9 15 37 2017 11 27 13 19 30
Q8B. Would you say that you approve or disapprove of the job that Ken Paxton is doing as Texas’s Attorney General? Would that be somewhat or strongly [approve/disapprove]?
1. Strongly approve 11% 2. Somewhat approve 38 3. Somewhat disapprove 20 4. Strongly disapprove 19 5. DON’T KNOW / REFUSED / NA 13
Q9A. Do you approve or disapprove of the way Donald Trump is handling the response to the coronavirus pandemic? 1. Strongly approve 21% 2. Somewhat approve 20 3. Somewhat disapprove 14 4. Strongly disapprove 42 5. DON’T KNOW / REFUSED / NA 3
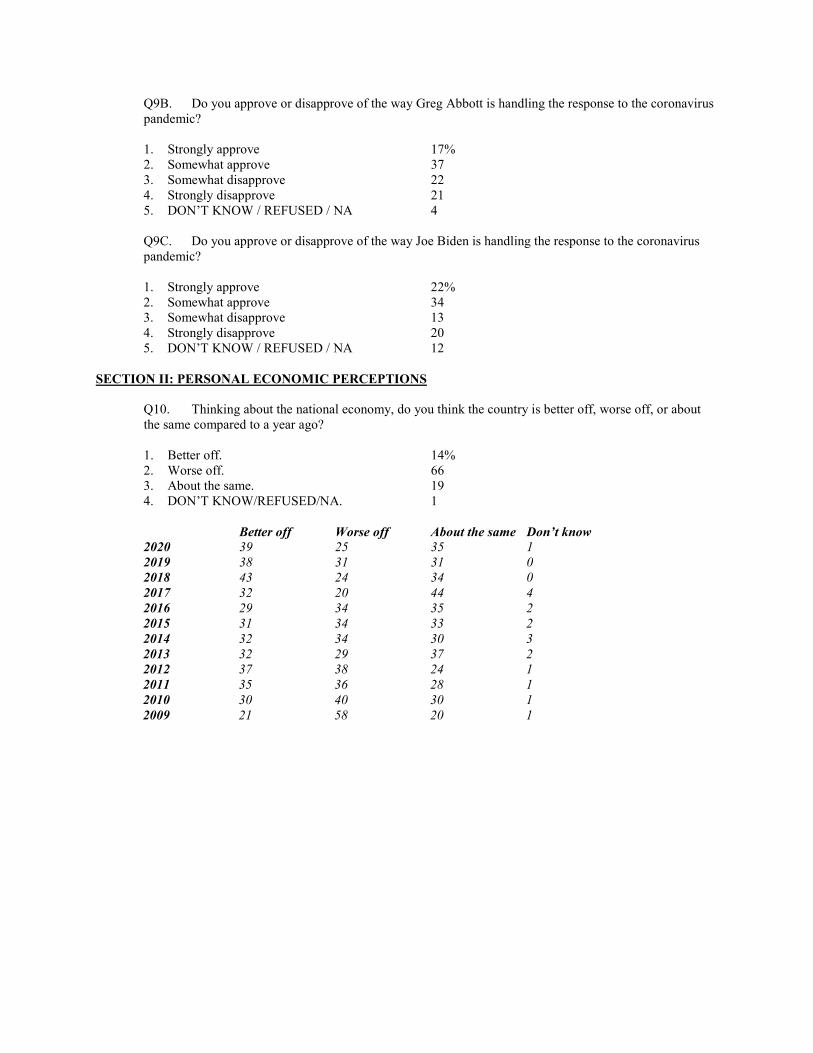
Q9B. Do you approve or disapprove of the way Greg Abbott is handling the response to the coronavirus pandemic?
1. Strongly approve 17% 2. Somewhat approve 37 3. Somewhat disapprove 22 4. Strongly disapprove 21 5. DON’T KNOW / REFUSED / NA 4
Q9C. Do you approve or disapprove of the way Joe Biden is handling the response to the coronavirus pandemic? 1. Strongly approve 22% 2. Somewhat approve 34 3. Somewhat disapprove 13 4. Strongly disapprove 20 5. DON’T KNOW / REFUSED / NA 12
SECTION II: PERSONAL ECONOMIC PERCEPTIONS
Q10. Thinking about the national economy, do you think the country is better off, worse off, or about the same compared to a year ago? 1. Better off. 14% 2. Worse off. 66 3. About the same. 19 4. DON’T KNOW/REFUSED/NA. 1
Better off Worse off About the same Don’t know 2020 39 25 35 1 2019 38 31 31 0 2018 43 24 34 0 2017 32 20 44 4 2016 29 34 35 2 2015 31 34 33 2 2014 32 34 30 3 2013 32 29 37 2 2012 37 38 24 1 2011 35 36 28 1 2010 30 40 30 1 2009 21 58 20 1

Q11. Do you think Texas’s economy is better off, worse off, or about the same as the rest of the country?
1. Better off 24% 2. Worse off 40 3. About the same 33 4. DON’T KNOW / REFUSED / NA 2
Better off Worse off About the same Don’t know 2020 49 14 36 2 2019 45 15 40 1 2018 63 10 27 0 2017 58 9 26 7 2016 60 11 25 4 2015 52 14 28 6 2014 61 10 23 6 2013 62 7 26 4 2012 70 7 22 1 2011 60 10 28 2 2010 61 8 28 4 2009 64 8 25 3
Q12. Now thinking about you and your family’s economic situation, would you say that you are better off, worse off, or about the same economically compared to a year ago?
1. Better off. 15% 2. Worse off. 39 3. About the same. 45 4. DON’T KNOW/REFUSED/NA. 1
Better off Worse off About the same Don’t know 2020 36 21 42 1 2019 33 22 45 0 2018 31 19 49 0 2017 27 15 57 1 2016 30 19 50 1 2015 25 23 51 0 2014 28 24 46 2 2013 26 23 50 1 2012 24 24 50 2 2011 21 31 48 0 2010 18 32 50 1 2009 17 37 46 0

Q13. Looking ahead to the future, do you think your children will be better off than you are, worse off, or about the same economically?
1. Better off 34% 2. Worse off 35 3. About the same 25 4. DON’T KNOW / REFUSED / NA 5
Better off Worse off About the same Don’t know 2020 46 25 23 5 2019 39 29 29 3 2018 49 28 23 0 2017 45 28 19 9 2016 42 29 20 9 2015 40 27 22 10 2014 NA NA NA NA 2013 41 35 17 7 2012 38 35 17 11 2011 39 26 28 8 2010 34 41 21 5 2009 40 32 18 10 2008 39 30 21 10 2007 47 27 20 6
Q14. Do you think that during the next 12 months we'll have good times economically or bad times economically? Would that be very [good/bad], or somewhat [good/bad]?
1. Very good 8% 2. Somewhat good 21 3. Mixed 40 4. Somewhat bad 17 5. Very bad 12 6. DON’T KNOW / REFUSED / NA 3

SECTION III: ISSUES & POLICY Now, we’re interested in learning more about your experience during the coronavirus pandemic... Q15. What do you think is more important...[RANDOMIZE 1-2]
1. Trying to help control the spread of the coronavirus, even if it hurts the economy 70% OR
2. Trying to help the economy, even if it hurts efforts to control the spread of the virus. 30
Q16. How concerned are you, if at all, about the coronavirus pandemic?
1. Extremely concerned 34% 2. Very concerned 33 3. Somewhat concerned 21 4. Not very concerned 7 5. Not at all concerned 5 6. DON’T KNOW / REFUSED / NA 0
Q17. Do you think the coronavirus is a real threat or is it blown out of proportion?
1. A real threat 71% 2. Blown out of proportion 21 3. Unsure 9 4. DON’T KNOW / REFUSED / NA 0
Q18A. Do you personally know anyone who has tested positive for the coronavirus?
1. Yes 79% 2. No 21 3. DON’T KNOW / REFUSED / NA 0
Q18B. Do you personally know anyone who has died from the coronavirus?
1. Yes 47% 2. No 53 3. DON’T KNOW / REFUSED / NA 0
Q19A. Do you think the United States is handling the pandemic better, worse, or about the same as other countries?
1. Better 16% 2. Worse 51 3. About the same 30 4. Don’t know/No opinion 3
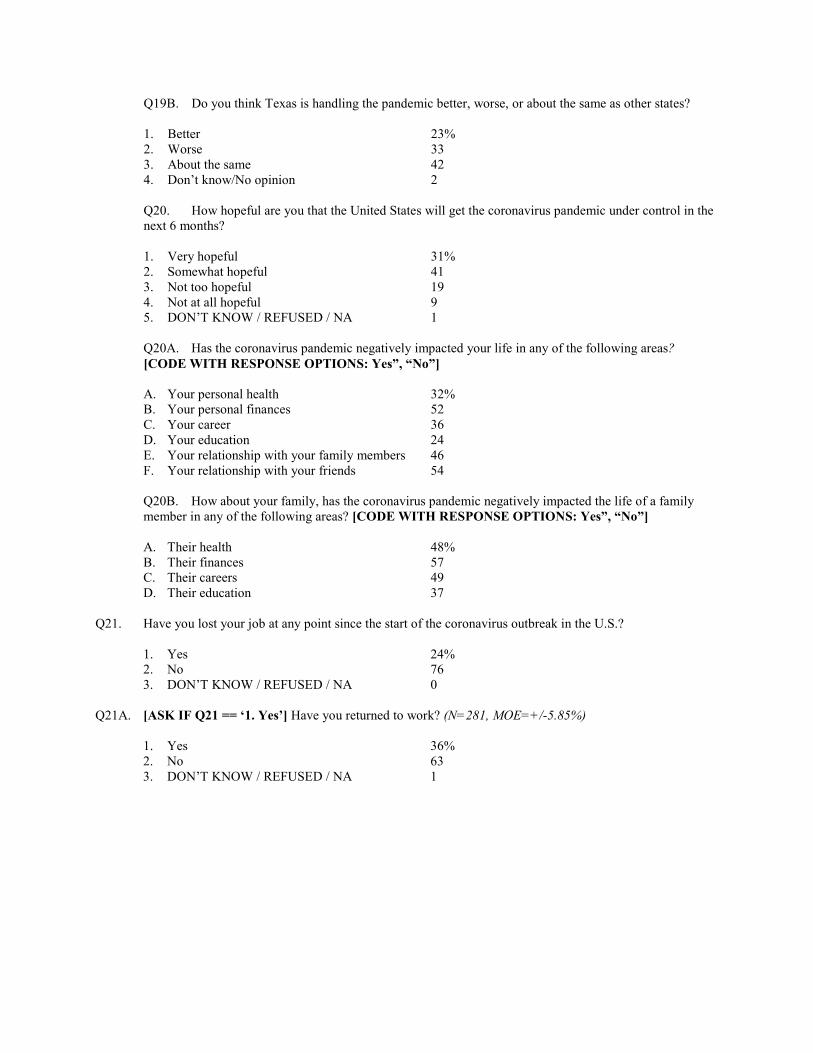
Q19B. Do you think Texas is handling the pandemic better, worse, or about the same as other states?
1. Better 23% 2. Worse 33 3. About the same 42 4. Don’t know/No opinion 2
Q20. How hopeful are you that the United States will get the coronavirus pandemic under control in the next 6 months?
1. Very hopeful 31% 2. Somewhat hopeful 41 3. Not too hopeful 19 4. Not at all hopeful 9 5. DON’T KNOW / REFUSED / NA 1
Q20A. Has the coronavirus pandemic negatively impacted your life in any of the following areas? [CODE WITH RESPONSE OPTIONS: Yes”, “No”]
A. Your personal health 32% B. Your personal finances 52 C. Your career 36 D. Your education 24 E. Your relationship with your family members 46 F. Your relationship with your friends 54
Q20B. How about your family, has the coronavirus pandemic negatively impacted the life of a family member in any of the following areas? [CODE WITH RESPONSE OPTIONS: Yes”, “No”]
A. Their health 48% B. Their finances 57 C. Their careers 49 D. Their education 37
Q21. Have you lost your job at any point since the start of the coronavirus outbreak in the U.S.?
1. Yes 24% 2. No 76 3. DON’T KNOW / REFUSED / NA 0
Q21A. [ASK IF Q21 == ‘1. Yes’] Have you returned to work? (N=281, MOE=+/-5.85%)
1. Yes 36% 2. No 63 3. DON’T KNOW / REFUSED / NA 1
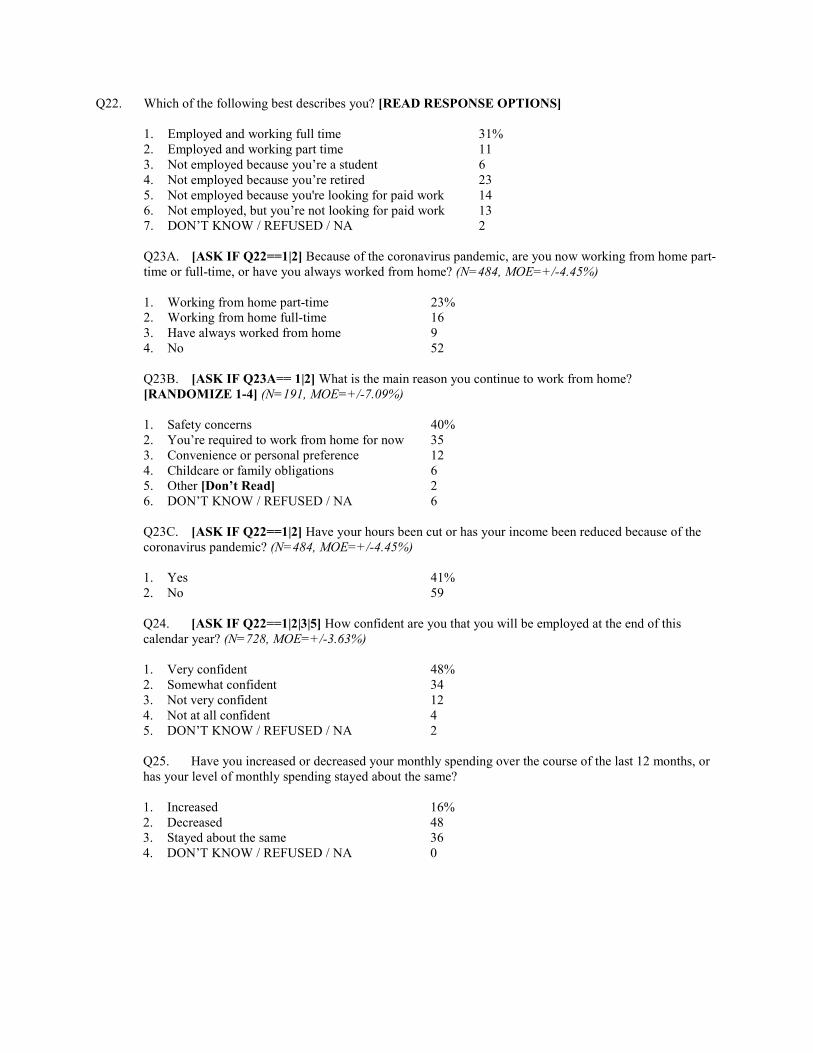
Q22. Which of the following best describes you? [READ RESPONSE OPTIONS]
1. Employed and working full time 31% 2. Employed and working part time 11 3. Not employed because you’re a student 6 4. Not employed because you’re retired 23 5. Not employed because you're looking for paid work 14 6. Not employed, but you’re not looking for paid work 13 7. DON’T KNOW / REFUSED / NA 2 Q23A. [ASK IF Q22==1|2] Because of the coronavirus pandemic, are you now working from home part-time or full-time, or have you always worked from home? (N=484, MOE=+/-4.45%)
1. Working from home part-time 23% 2. Working from home full-time 16 3. Have always worked from home 9 4. No 52
Q23B. [ASK IF Q23A== 1|2] What is the main reason you continue to work from home? [RANDOMIZE 1-4] (N=191, MOE=+/-7.09%)
1. Safety concerns 40% 2. You’re required to work from home for now 35 3. Convenience or personal preference 12 4. Childcare or family obligations 6 5. Other [Don’t Read] 2 6. DON’T KNOW / REFUSED / NA 6
Q23C. [ASK IF Q22==1|2] Have your hours been cut or has your income been reduced because of the coronavirus pandemic? (N=484, MOE=+/-4.45%)
1. Yes 41% 2. No 59
Q24. [ASK IF Q22==1|2|3|5] How confident are you that you will be employed at the end of this calendar year? (N=728, MOE=+/-3.63%)
1. Very confident 48% 2. Somewhat confident 34 3. Not very confident 12 4. Not at all confident 4 5. DON’T KNOW / REFUSED / NA 2
Q25. Have you increased or decreased your monthly spending over the course of the last 12 months, or has your level of monthly spending stayed about the same?
1. Increased 16% 2. Decreased 48 3. Stayed about the same 36 4. DON’T KNOW / REFUSED / NA 0
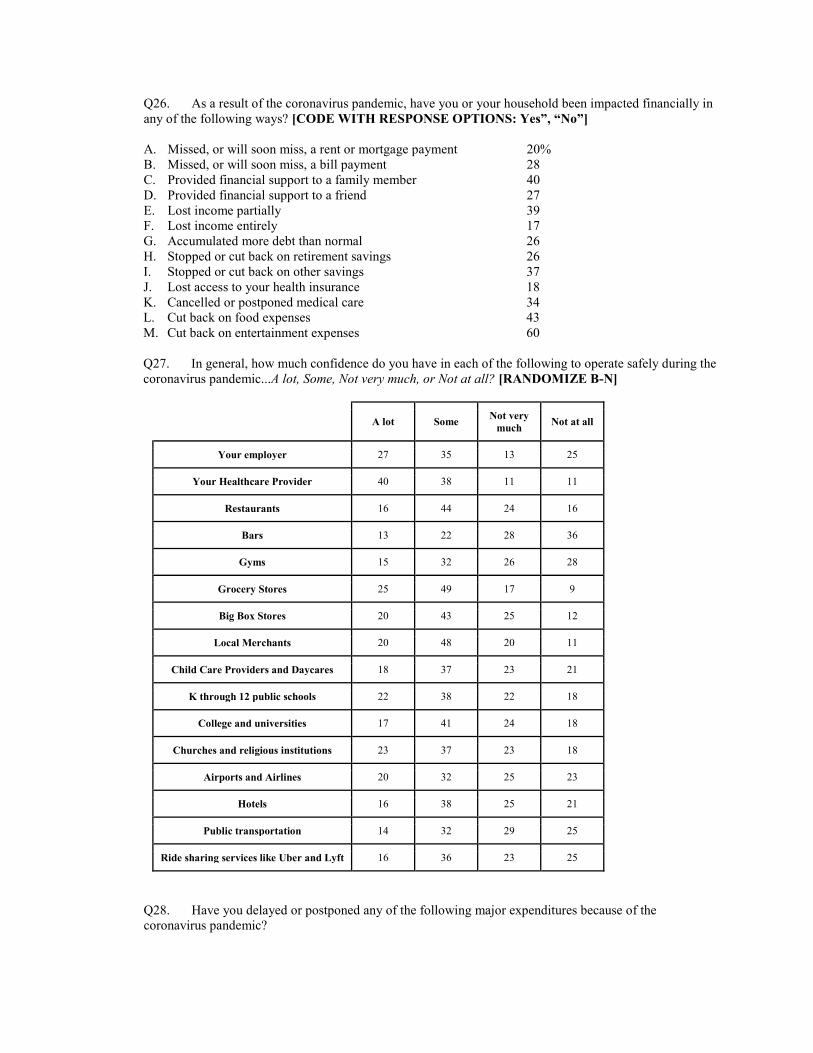
Q26. As a result of the coronavirus pandemic, have you or your household been impacted financially in any of the following ways? [CODE WITH RESPONSE OPTIONS: Yes”, “No”]
A. Missed, or will soon miss, a rent or mortgage payment 20% B. Missed, or will soon miss, a bill payment 28 C. Provided financial support to a family member 40 D. Provided financial support to a friend 27 E. Lost income partially 39 F. Lost income entirely 17 G. Accumulated more debt than normal 26 H. Stopped or cut back on retirement savings 26 I. Stopped or cut back on other savings 37 J. Lost access to your health insurance 18 K. Cancelled or postponed medical care 34 L. Cut back on food expenses 43 M. Cut back on entertainment expenses 60
Q27. In general, how much confidence do you have in each of the following to operate safely during the coronavirus pandemic...A lot, Some, Not very much, or Not at all? [RANDOMIZE B-N]
A lot Some Not very much Not at all
Your employer 27 35 13 25
Your Healthcare Provider 40 38 11 11
Restaurants 16 44 24 16
Bars 13 22 28 36
Gyms 15 32 26 28
Grocery Stores 25 49 17 9
Big Box Stores 20 43 25 12
Local Merchants 20 48 20 11
Child Care Providers and Daycares 18 37 23 21
K through 12 public schools 22 38 22 18
College and universities 17 41 24 18
Churches and religious institutions 23 37 23 18
Airports and Airlines 20 32 25 23
Hotels 16 38 25 21
Public transportation 14 32 29 25
Ride sharing services like Uber and Lyft 16 36 23 25
Q28. Have you delayed or postponed any of the following major expenditures because of the coronavirus pandemic?
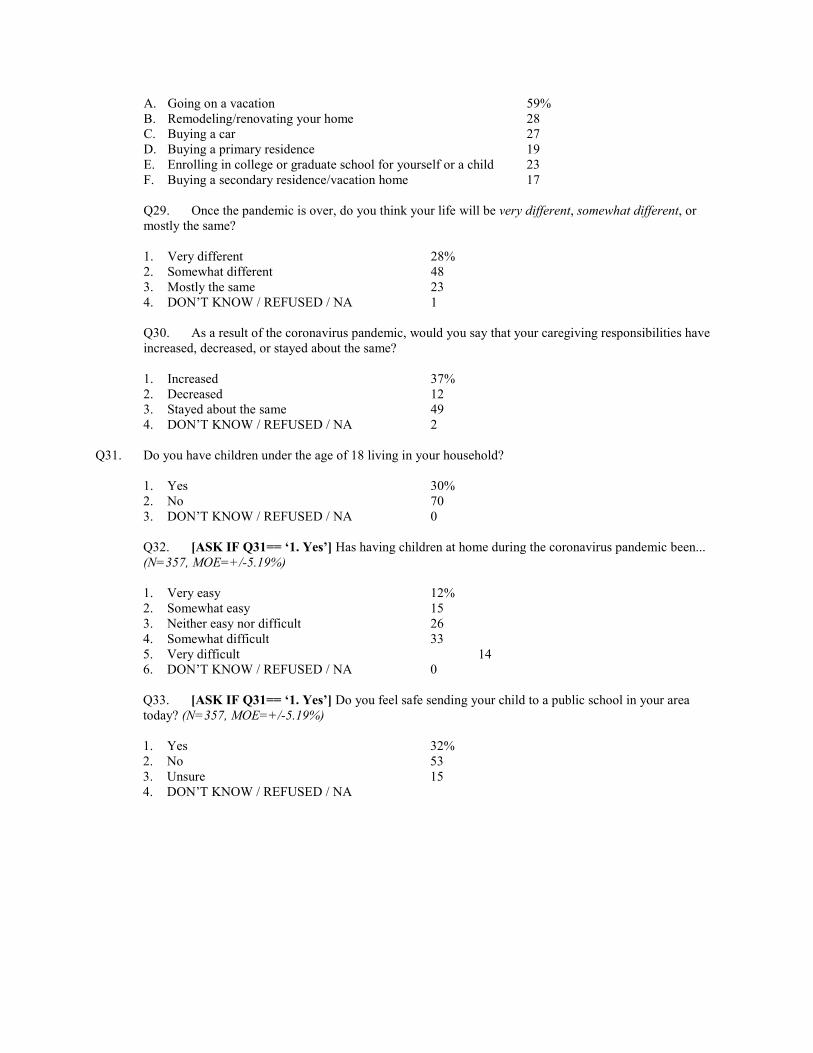
A. Going on a vacation 59% B. Remodeling/renovating your home 28 C. Buying a car 27 D. Buying a primary residence 19 E. Enrolling in college or graduate school for yourself or a child 23 F. Buying a secondary residence/vacation home 17 Q29. Once the pandemic is over, do you think your life will be very different, somewhat different, or mostly the same? 1. Very different 28% 2. Somewhat different 48 3. Mostly the same 23 4. DON’T KNOW / REFUSED / NA 1
Q30. As a result of the coronavirus pandemic, would you say that your caregiving responsibilities have increased, decreased, or stayed about the same?
1. Increased 37% 2. Decreased 12 3. Stayed about the same 49 4. DON’T KNOW / REFUSED / NA 2
Q31. Do you have children under the age of 18 living in your household?
1. Yes 30% 2. No 70 3. DON’T KNOW / REFUSED / NA 0
Q32. [ASK IF Q31== ‘1. Yes’] Has having children at home during the coronavirus pandemic been... (N=357, MOE=+/-5.19%)
1. Very easy 12% 2. Somewhat easy 15 3. Neither easy nor difficult 26 4. Somewhat difficult 33 5. Very difficult 14 6. DON’T KNOW / REFUSED / NA 0
Q33. [ASK IF Q31== ‘1. Yes’] Do you feel safe sending your child to a public school in your area today? (N=357, MOE=+/-5.19%)
1. Yes 32% 2. No 53 3. Unsure 15 4. DON’T KNOW / REFUSED / NA

Q34A. [ASK IF Q31== ‘1. Yes’] Have you needed to make any school related purchases for the children living in your household because of the coronavirus outbreak? (N=357, MOE=+/-5.19%)
1. Yes 61% 2. No 39 3. DON’T KNOW / REFUSED / NA 0
Q34B. [ASK IF Q34A== ‘1. Yes’] And was this purchase, or were these purchases a financial hardship for you and your family? (N=216, MOE=+/-6.67%)
1. Yes 53% 2. No 47 3. DON’T KNOW / REFUSED / NA 0
Q35. Are you going to get a COVID-19 vaccine as soon as it becomes available to you?
1. Yes 45% 2. No 26 3. Unsure 24 4. Already received a COVID-19 vaccine 5 5. DON’T KNOW / REFUSED / NA 0
Q36A. [ASK IF Q35 == 2|3] Why [won’t you get/aren’t you sure about getting] a COVID-19 vaccine? [OPEN-ENDED, please use pre-codes as applicable, but record verbatims] (N=604, MOE=+/-3.99%) 1. COVID vaccine safety concern(s) 52% 2. General vaccine safety concern 28 3. COVID-19 isn’t a serious health threat 10 4. Already contracted COVID-19 6 5. COVID-19 isn’t real 4 6. Other 0
Q37A. Do you think that employers should be allowed to require employees to get vaccinated in order to work?
1. Yes 43% 2. No 38 3. Unsure 18 4. DON’T KNOW / REFUSED / NA 1 Q37B. Do you think that educational institutions, like K through 12 public schools and colleges, should be allowed to require students to get vaccinated in order to attend in-person education?
1. Yes 46% 2. No 37 3. Unsure 16 4. DON’T KNOW / REFUSED / NA 1

Q37C. Do you think that stadiums, arenas, conferences, and other large events where people gather should be allowed to require that attendees get vaccinated in order to attend?
1. Yes 42% 2. No 39 3. Unsure 18 4. DON’T KNOW / REFUSED / NA 1

SECTION IV: DEMOGRAPHICS We’re almost done. The final questions are for statistical purposes… AGEG.
1. 18-29 24% 2. 30-44 27 3. 45-64 32 4. 65+ 17
LOCATE. Would you say that you live in an urban, suburban, or rural community?
1. Urban 31% 2. Suburban 42 3. Rural 27
MARRIED. What is your current marital status?
1. Never married 33% 2. Married 45 3. Divorced 9 4. Widowed 7 5. Separated 4 6. DON’T KNOW/REFUSED/NA. 2
INCOME. What was your total household income for 2020? [READ CATEGORIES]
1. Less than $15,000 16% 2. $15,0000-$25,000 13 3. $25,000-$40,000 14 4. $40,000-$75,000 17 5. $75,000-$150,000 13 6. More than $150,000 6 7. DON’T KNOW/REFUSED/NA. 20
EDOFR. What is the highest level of education you completed? [READ CATEGORIES AS NECESSARY]
1. Less than high school 6% 2. High school 27 3. Some college 25 4. College degree 26 5. Post-graduate degree (MA, LLD, PhD) 13 6. DON’T KNOW/REFUSED/NA. 2
RELIGION. What is your religious denomination [PRON: DEE-NOM-I-NATION]?
1. Protestant 10% 2. Catholic 27 3. Other Christian 31 4. Jewish 1 5. Muslim, Buddhist, or other non-Christian 5 6. Agnostic/Atheist 7 7. DON’T KNOW/REFUSED 18
FUND. [IF RELIGION EQ 1] Would you say that you are evangelical, fundamentalist, or born-again?
1. Yes 60%

2. No 40 RACE. Would you say that you are…
1. White or Anglo 45% 2. Black or African American 12 3. Hispanic 36 4. Other 7
LIBCON. Generally speaking, would you say that you are…
1. Liberal 20% 2. Moderate, or 41 3. Conservative. 34 4. DON’T KNOW/REFUSED 5
PID7.
1. Strong Democrat 17% 2. Weak Democrat 12 3. Lean Democrat 9 4. Independent 31 5. Lean Republican 7 6. Weak Republican 10 7. Strong Republican 14
PID3.
1. Democrat 38% 2. Independent 31 3. Republican 30
GENDER. Do you identify as...
1. Male 49% 2. Female 51 3. Non-binary <1 4. REFUSED 0
Thank you very much for your time today/this evening! Have a good day/evening
Poll Methodology From January 8-17, 2021, The Texas Lyceum conducted a 1000-person telephone survey of adult citizens from the state of Texas. The survey utilized a stratified probability sample design, with respondents being randomly selected at the level of the household and questioned by live interviewers. The survey also employed a randomized cell phone supplement, with 60 percent of completed interviews being conducted among cell phone only or cell phone dominant households. A Spanish-language instrument was developed, and bilingual interviewers offered respondents a chance to participate in English or Spanish. On average, respondents completed the interview in 15 minutes. To ensure an appropriate sub-sample of unregistered citizens, a supplement of 200 interviews among Texas adults confirmed as unregistered was completed online. This yields a total statewide sample of 1,200 adults, 835 of whom are registered voters according to self-reports. The final data set is weighted by race/ethnicity, age and gender to achieve representativeness as defined by the Texas Department State Health Services 2020 population projections. The overall margin of error for the poll is +/- 2.83 percentage points, with a larger margin of error for sub-samples.